An update on DNB’s strategy and portfolio within shipping, offshore and logistics
Stockholm, March 15, 2013
Harald Serck-Hanssen

Norway is a leading maritime nation. DNB no. 1 shipping bank globally
Shipping
strategy
Long-term
and
relationship
driven
Leading industry expertise
DNB – a one-stop bank
Mainly
larger,
leading
industrial
clients
2
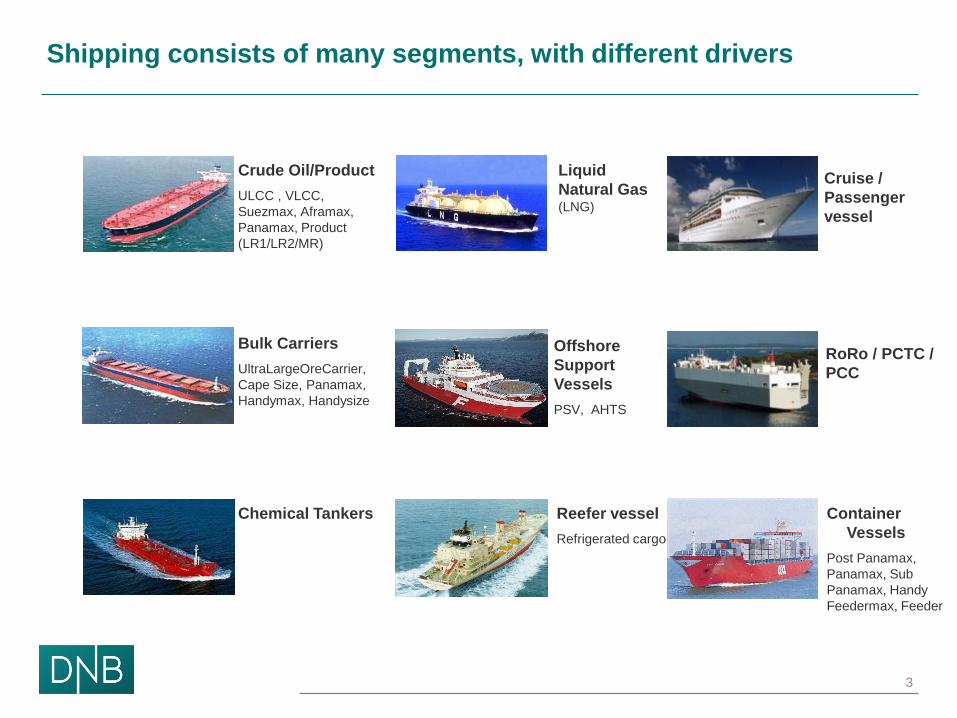
Shipping consists of many segments, with different drivers
Bulk Carriers
UltraLargeOreCarrier,
Cape Size, Panamax,
Handymax, Handysize
Crude Oil/Product
ULCC , VLCC,
Suezmax, Aframax,
Panamax, Product
(LR1/LR2/MR)
Chemical Tankers
Container
Vessels
Post Panamax,
Panamax, Sub
Panamax, Handy
Feedermax, Feeder
Liquid
Natural Gas (LNG)
Offshore
Support
Vessels
PSV, AHTS
Reefer vessel
Refrigerated cargo
RoRo / PCTC /
PCC
Cruise /
Passenger
vessel
3

Consistent growth in tonnage demand, even in low GDP scenarios
Growth in Global GDP vs growth in total tonnage demand
High tonnage demand
also in weaker economic
conditions
Platou’s expected growth in
tonnage demand basis BNP
prognosis for 2013 – 2017
T
o
n
n
a
g
e
g
r
o
w
t
h
GDP Growth
4

Expected Worldwide Container Demand
Demand for shipping services is expected to increase further
Source: Clarkson
5
Source: Clarksons

Much lower orderbook, but challenging dry bulk and tanker markets
Orderbook now close to normal levels
► Orderbook is significantly reduced
compared with the peak in 2008
► Scrapping is increasing
► Lower increase in demand
► Spot rates expected to remain at
low levels for some time
Orderbook within the major shipping
segments as per cent of the existing fleet
6

Client selection is key to portfolio quality
► A set of financial and
minimum value covenants
► Act as early warning signals
► Used actively in client discussions
► 1st priority mortgages
► Acceptable jurisdictions
► Modern and standard tonnage
► Financial strength
► Track record & standing
► Investment horizon
► Cash flow projections
► Historical performance
► Volatility
Cash flow Client
Collateral Covenants
Client
selection
through
the 4 Cs
7

DNB maintains a diversified portfolio within shipping and offshore
► Offshore is the largest single segment
with 24%. It is comprised of drilling
rigs, support- and specialized vessels
► Industrial shipping, such as gas, ro/ro,
chemical and cruise totals 30%
► Within containers, dry bulk and
tankers the shares are 14%, 12% and
9% respectively.
Offshore is the largest segment A diversified maritime portfolio
8
Share of EaD pr. 31.12.2012
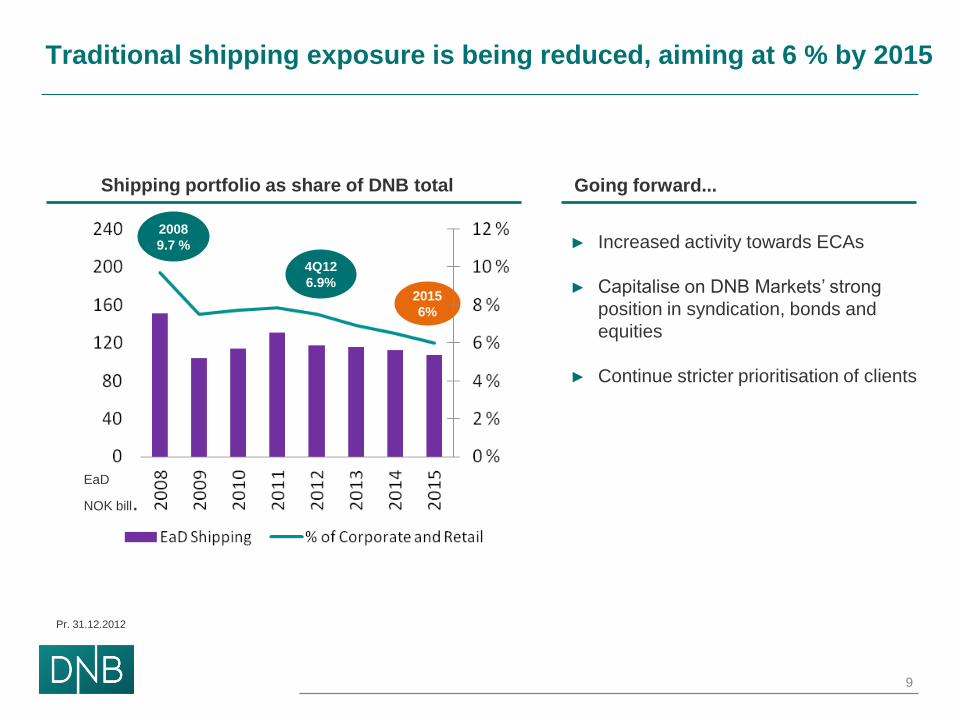
Going forward...
► Increased activity towards ECAs
► Capitalise on DNB Markets’ strong
position in syndication, bonds and
equities
► Continue stricter prioritisation of clients
Traditional shipping exposure is being reduced, aiming at 6 % by 2015
9
2008
9.7 %
4Q12
6.9% 2015
6%
Shipping portfolio as share of DNB total
EaD
NOK bill.
Pr. 31.12.2012

The shipping portfolio has been reduced in all segments, except Gas
Exposure within the major shipping segments, 4q 2012 vs 4q 2008
10
EaD NOK
million EaD
NOK million
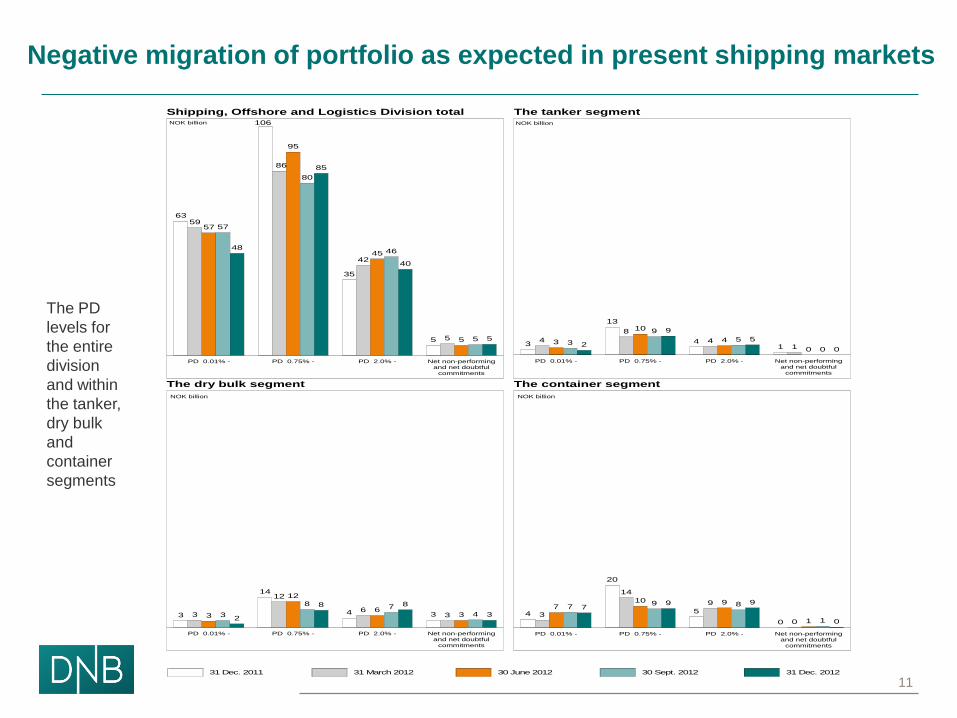
Negative migration of portfolio as expected in present shipping markets
The PD
levels for
the entire
division
and within
the tanker,
dry bulk
and
container
segments
11
Shipping, Offshore and Logistics Division total The tanker segment
63
106
35
5
59
86
42
5
57
95
45
5
57
80
46
5
48
85
40
5
PD 0.01% - PD 0.75% - PD 2.0% - Net non-performingand net doubtful
commitments
NOK billion
3
13
41
4
8
41
3
10
4
03
9
5
02
9
5
0
PD 0.01% - PD 0.75% - PD 2.0% - Net non-performingand net doubtful
commitments
NOK billion
The dry bulk segment The container segment
3
14
4 33
12
633
12
633
8 74
2
8 8
3
PD 0.01% - PD 0.75% - PD 2.0% - Net non-performingand net doubtful
commitments
NOK billion
4
20
5
03
14
9
0
710 9
1
79 8
1
79 9
0
PD 0.01% - PD 0.75% - PD 2.0% - Net non-performingand net doubtful
commitments
NOK billion
31 Dec. 2011 31 March 2012 30 June 2012 30 Sept. 2012 31 Dec. 2012

Number of clients on the bank’s internal Watch List
Very close follow-up of difficult exposures is given top priority
An active approach
12
► Early and constructive dialogue with our
clients
► One special restructuring unit handles all
difficult cases
► Watchlist clients are subject to very close
follow-up, including frequent internal
reporting
► Write-downs on all watchlist clients are
assessed on a quarterly basis – subject
to internal and external auditor’s review
Pr. 31.12.2012

Specifying the non-performing and net-doubtful commitments
Shipping’s share of non performing and net
doubtful commitments Most of the shipping loans are performing
13
► The aggregate of the Net non-performing
and Net doubtful commitments for the
DNB group totaled NOK 19.7 billion at 4Q
2012.
► The shipping share was NOK 5.2 billion.
55% was performing.
Pr. 31.12.2012
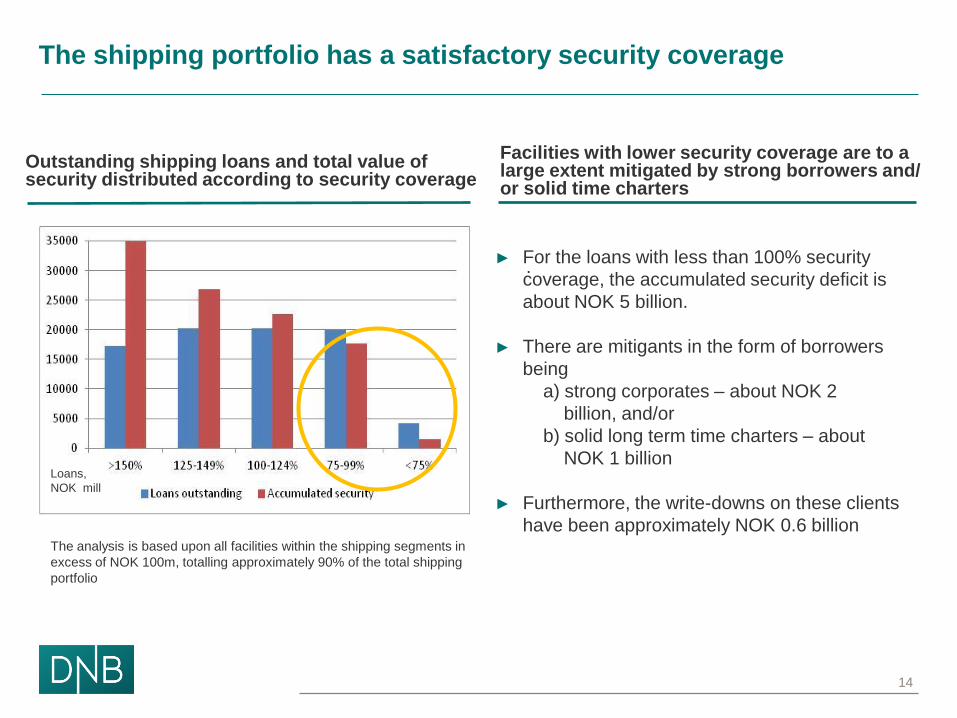
Facilities with lower security coverage are to a large extent mitigated by strong borrowers and/ or solid time charters
The shipping portfolio has a satisfactory security coverage
The analysis is based upon all facilities within the shipping segments in
excess of NOK 100m, totalling approximately 90% of the total shipping
portfolio
Loans,
NOK mill
Outstanding shipping loans and total value of security distributed according to security coverage
14
.
► For the loans with less than 100% security
coverage, the accumulated security deficit is
about NOK 5 billion.
► There are mitigants in the form of borrowers
being
a) strong corporates – about NOK 2
billion, and/or
b) solid long term time charters – about
NOK 1 billion
► Furthermore, the write-downs on these clients
have been approximately NOK 0.6 billion
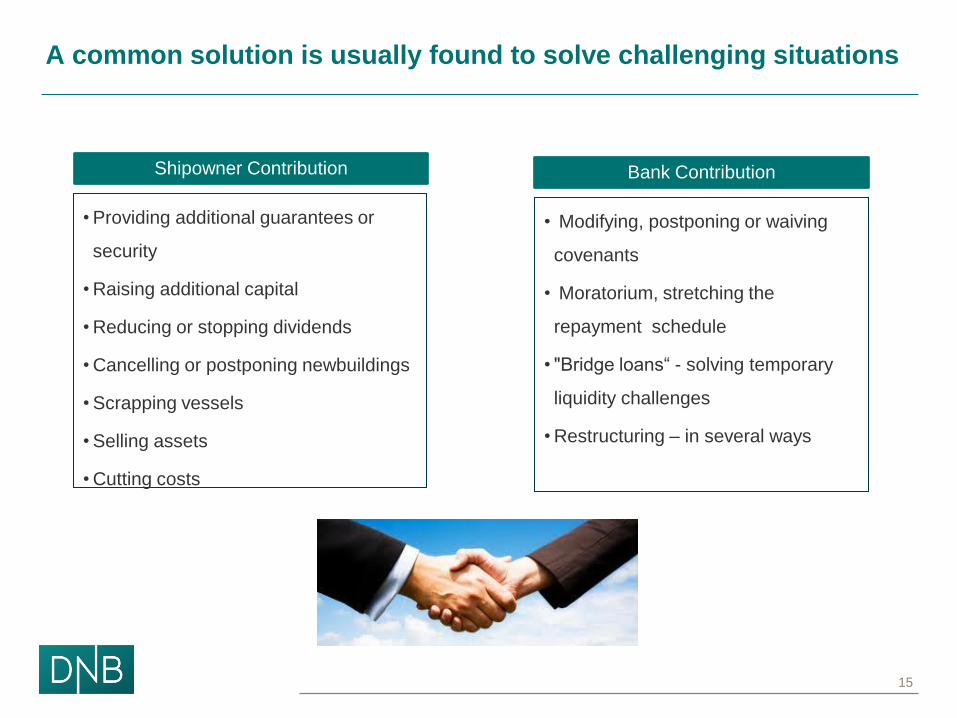
A common solution is usually found to solve challenging situations
• Providing additional guarantees or
security
• Raising additional capital
• Reducing or stopping dividends
• Cancelling or postponing newbuildings
• Scrapping vessels
• Selling assets
• Cutting costs
• Modifying, postponing or waiving
covenants
• Moratorium, stretching the
repayment schedule
• "Bridge loans“ - solving temporary
liquidity challenges
• Restructuring – in several ways
Bank Contribution Shipowner Contribution
15

The average margin is increasing every quarter
16
Pr. 31.12.2012
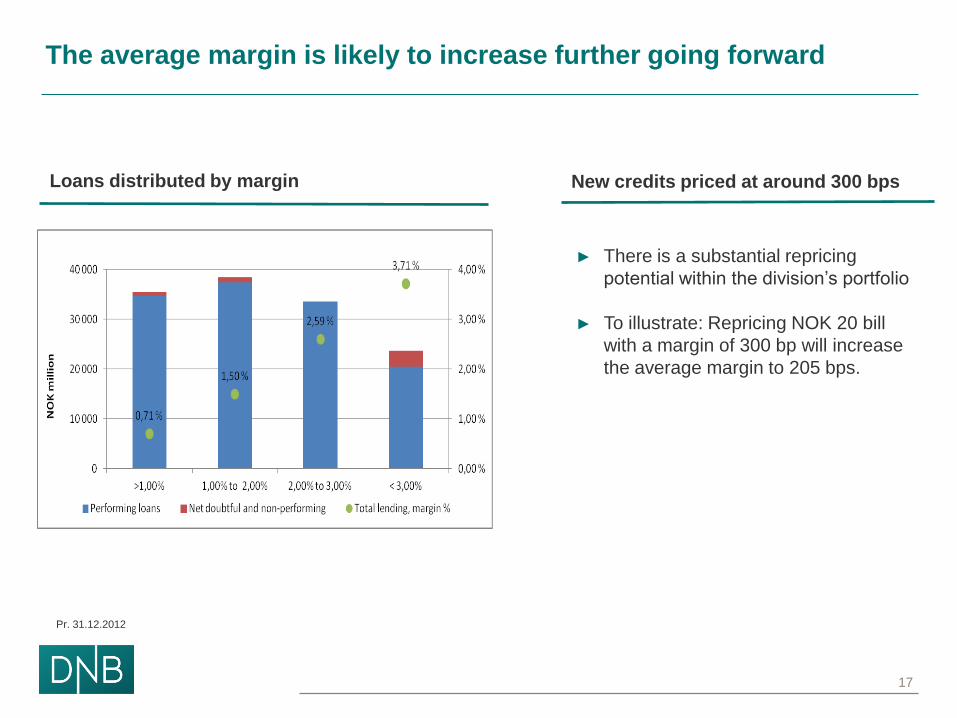
The average margin is likely to increase further going forward
Loans distributed by margin New credits priced at around 300 bps
17
► There is a substantial repricing
potential within the division’s portfolio
► To illustrate: Repricing NOK 20 bill
with a margin of 300 bp will increase
the average margin to 205 bps.
Pr. 31.12.2012
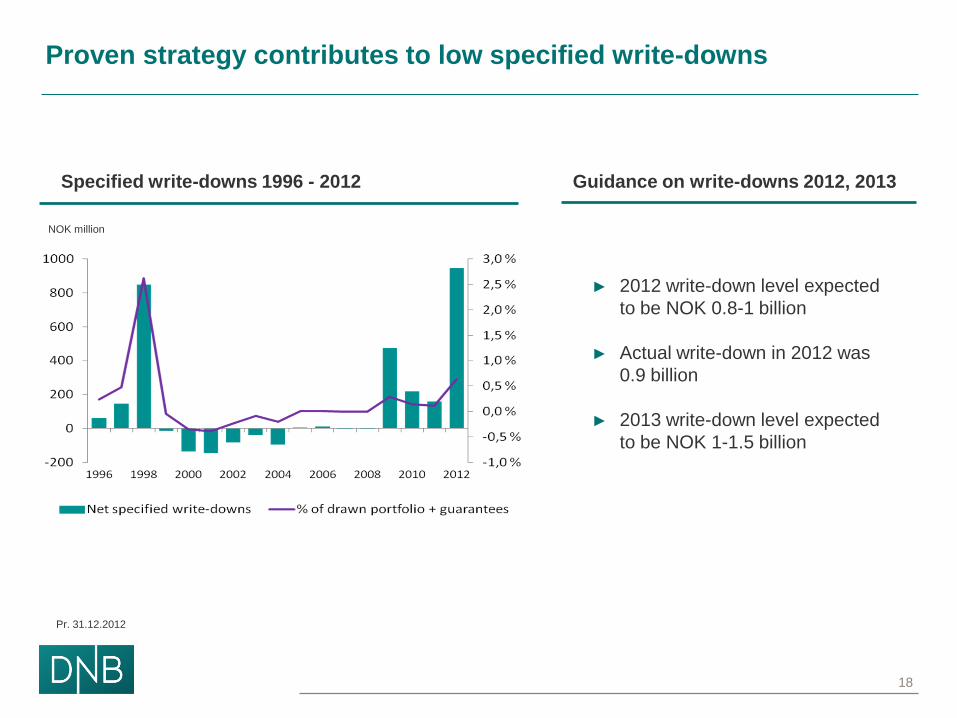
Proven strategy contributes to low specified write-downs
NOK million
Specified write-downs 1996 - 2012 Guidance on write-downs 2012, 2013
18
► 2012 write-down level expected
to be NOK 0.8-1 billion
► Actual write-down in 2012 was
0.9 billion
► 2013 write-down level expected
to be NOK 1-1.5 billion
Pr. 31.12.2012

DNB’s maritime business has considerable loss-absorbing capacity
19
Top maritime bookrunners
2012
Source: Dealogic
Shipping, Offshore & Logistics Division’s
financial performance 2009-2012
Pr. 31.12.2012
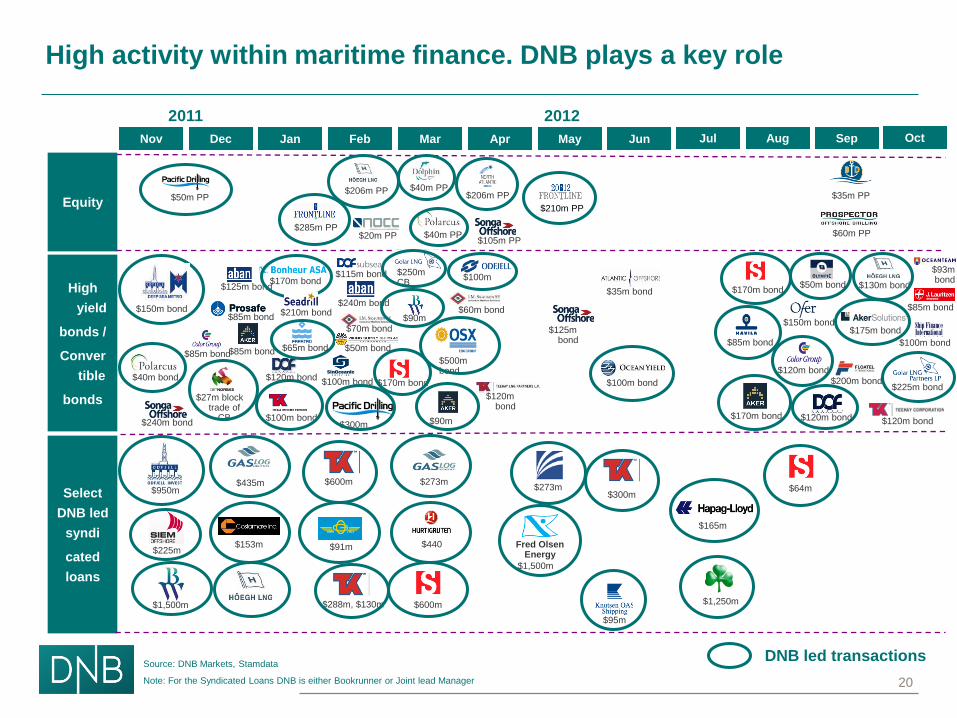
High activity within maritime finance. DNB plays a key role
Equity
High
yield
bonds /
Conver
tible
bonds
2011
Select
DNB led
syndi
cated
loans
DNB led transactions Source: DNB Markets, Stamdata
Note: For the Syndicated Loans DNB is either Bookrunner or Joint lead Manager
Jan Feb May Jun Jul Aug Sep Oct Nov
$40m bond
$150m bond
$240m bond
$950m
$1,500m
$225m
$27m block trade of
CB
$85m bond
Dec
$125m bond
$85m bond
$100m bond
$170m bond
$85m bond
$120m bond
$65m bond
$210m bond
$115m bond
2012
$435m
$153m
$288m, $130m
$285m PP
$206m PP $50m PP
$100m bond
$300m
$70m bond
Mar
$240m bond
$250m CB
$90m
$90m
$600m
$50m bond
$170m bond
$500m bond
$100m
Apr
$60m bond
$120m bond
$20m PP
$40m PP
$40m PP $105m PP
$273m
$600m
$440 $91m
$125m bond
$210m PP
$206m PP
$35m bond
$1,500m
Fred Olsen Energy
$100m bond
$95m
$300m $273m
$85m bond
$170m bond
$170m bond
$1,250m
$165m
$64m
$120m bond
$120m bond
$50m bond $130m bond
$175m bond
$225m bond
$120m bond
$150m bond
$200m bond
$35m PP
$60m PP
$100m bond
$85m bond
$93m bond
20
21
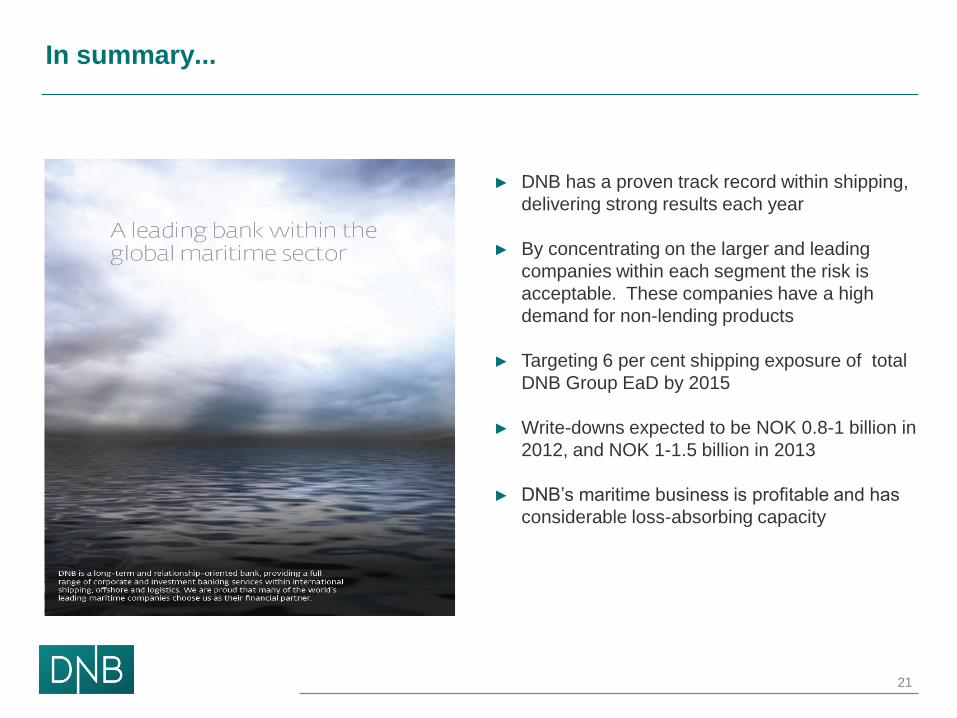
In summary...
► DNB has a proven track record within shipping,
delivering strong results each year
► By concentrating on the larger and leading
companies within each segment the risk is
acceptable. These companies have a high
demand for non-lending products
► Targeting 6 per cent shipping exposure of total
DNB Group EaD by 2015
► Write-downs expected to be NOK 0.8-1 billion in
2012, and NOK 1-1.5 billion in 2013
► DNB’s maritime business is profitable and has
considerable loss-absorbing capacity

Appendix
• Illustrative Case: USD 1 billion (70%) financing of modern vessels
22
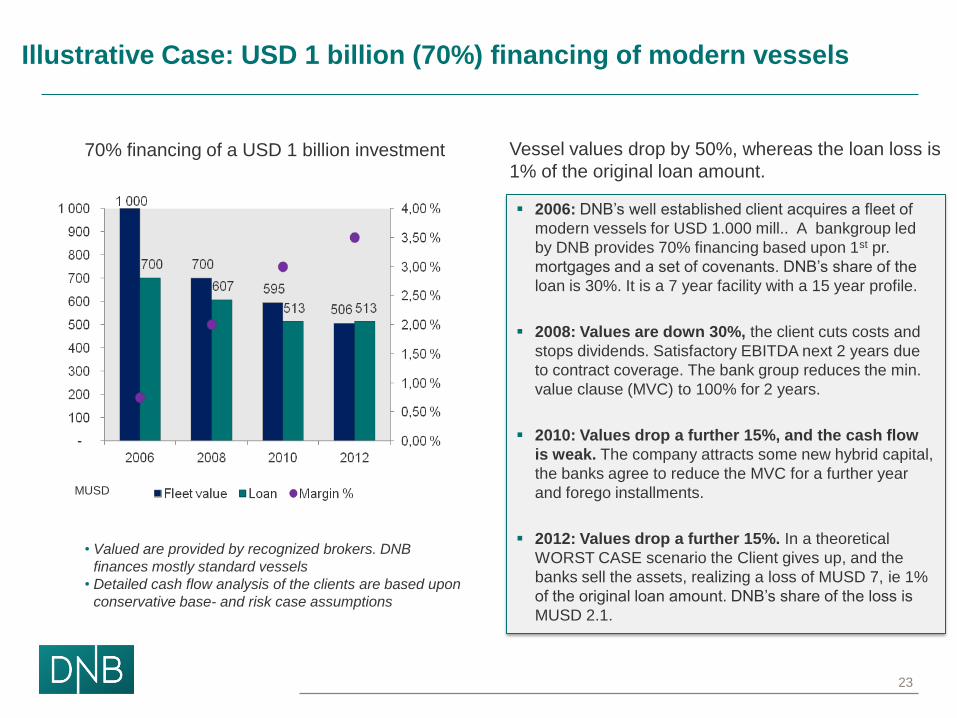
Illustrative Case: USD 1 billion (70%) financing of modern vessels
2006: DNB’s well established client acquires a fleet of
modern vessels for USD 1.000 mill.. A bankgroup led
by DNB provides 70% financing based upon 1st pr.
mortgages and a set of covenants. DNB’s share of the
loan is 30%. It is a 7 year facility with a 15 year profile.
2008: Values are down 30%, the client cuts costs and
stops dividends. Satisfactory EBITDA next 2 years due
to contract coverage. The bank group reduces the min.
value clause (MVC) to 100% for 2 years.
2010: Values drop a further 15%, and the cash flow
is weak. The company attracts some new hybrid capital,
the banks agree to reduce the MVC for a further year
and forego installments.
2012: Values drop a further 15%. In a theoretical
WORST CASE scenario the Client gives up, and the
banks sell the assets, realizing a loss of MUSD 7, ie 1%
of the original loan amount. DNB’s share of the loss is
MUSD 2.1.
70% financing of a USD 1 billion investment
• Valued are provided by recognized brokers. DNB
finances mostly standard vessels
• Detailed cash flow analysis of the clients are based upon
conservative base- and risk case assumptions
MUSD
Vessel values drop by 50%, whereas the loan loss is
1% of the original loan amount.
23
Recommended