
An Introduction to R
Bernd Klaus, EMBL
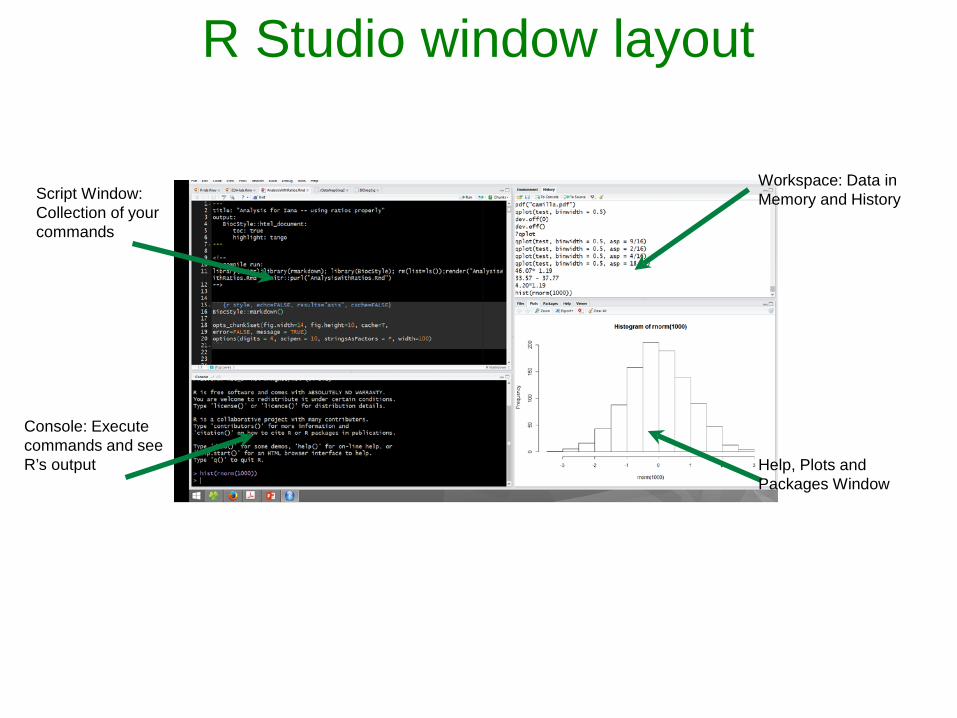
R Studio window layout
Workspace: Data in Memory and History
Help, Plots and Packages Window
Script Window: Collection of your commands
Console: Execute commands and seeR’s output

R packages, getting helpCRAN repository: http://cran.r-project.orgBiostatistics / Bioinformatics: http://bioconductor.org
• install via install.packages(packagename)• ... or use biocLite from Bioconductor• load via library(packagename)• overview sessionInfo()
• RStudio: Tools --> Install packages• activate packages using the packages tab in the plot window!• Help: ?packagename / functionname,
browseVignettes(“packages”)
• Rseek: http://www.rseek.org/ • Working directory: setwd(), getwd()

Rationale of learning RThe syntax of R is simple and logical
Allows to quickly allow for a basic understanding of simple R programs
The best, and in a sense the only, way to learn R is through trial-and- error on simple and then more complex examples
Essential booksDalgaard (2002) - Introductory Statistics with RVenables and Ripley (2002) - Modern Applied Statistics with S.Wickham Advanced R

R as a calculator
• Assigments are done with <- , or alternatively with =• Ex. a <- 5 => Variable a has value 5• R has basic calculator capabilities:• a+b, a-b, a∗b, aˆb (a**b), a %% b (a MOD b)• additionally functions like sqrt(a), sin(a) ...
• and some simple statistics:• mean(a,b)• summary(a,b)• Variance var(a,b)
• min(a,b), max(a,b)

Objects in R• R is an object-oriented language• Object = all data Items in R• Objects are instances of “blue-prints” called classes:
• Elementary Types:numeric: real numberstring: chain of characters, Textfactor: String or numbers, describing certain categorieslogical: TRUE, FALSENA: missing value
• Data Storage Types:Vectors, Matrices, Data Frames

Some simple commands ...assign value “9” to an object a: a<-9• Is a a string?is.character(a) => FALSE
• Is a number?is.numeric(a) => TRUE
• Now turn it into a factora<-as.factor(a)
• Is it a factor?is.factor(a) => TRUE
• Assign an string to a: a<- “NAME”;
• What’s a?summary(a) => Length 1 Class character

Vectors = collection of simple obj.• a <- c(5,6,7); a now is a vector with elements 5, 6, 7• How long is a? length(a)
• Access: a[Position]=> a[2] gives 6Arithmetic works on vectors just as it does on single numbers• 3*a gives (15,18,21)• a[2] = a[2]*3 gives (5,18,7)• Sorting and related: sort(a), order(a), rank(a)• Useful functions for vector creation:
Sequence: seq(from=1,to=10)
Repetition: rep(x = 1, times = 10)

Matrices = 2-dim. vectorsmat <- matrix(c(1,0,0,0,1,0,0,0,1), nrow = 3 )
creates unit matrix and saves it in mat
• Access with [Row, Column], i.e. mat[1,1] gives 1mat[,1] - first column
• Select single rows/cols can be done accordingly: mat[rows,] mat[,cols]
• consecutive rows / cols via mat[from:to,]
• Exclude via minus sign mat[-lines,]

Matrix access: example
A <- matrix(seq(1,9), nrow = 3, byrow=T)

Lists = Collections of arbitrary obj.Lists can contain “columns” of arbitrary objects of arb.length; Access with list[[entrynumber]]/list[[“name”]]
L[[2]] would alsogive 1 2 as output!

Importing data to data framesEasy with RStudio: Tools -> Import Example file: Patients.csv (NA is a marker for a quantity that is
not available)
R-Code: patients <- read.csv(file = /path/to/filename/Patients.csv, header = TRUE)
Excel read/write via the package xlsx, read.xlsx / write.xlsx

data.frame = Class representing tables in R(a dataframe is a list of columns)• Columns are variables; Rows are observations • head() gives first entries• names() gives column names• Access to variables (columns):
•dataframe$colname (just like a named list)•dataframe[,“colname”] •dataframe[[“colname”]] (just like a named list)
data.frame: tables in R

Looking at patIt has weight, height and gender of three people. Gender is a factor => special type for vectors that represent
categories
Since data frames are just special lists, they can be accessed in the same way

Looking at pat: Subsetting

Using R functions
Using ?matrix, you will find the following informationon the matrix function:
matrix(data = NA, nrow = 1, ncol = 1, byrow = FALSE, dimnames = NULL)
• Variables for which values can be given are in the round brackets• Otherwise, R will use the standard values indicated by "=" if there are any
• matrix(c(1,0), nrow = 2 ) creates a matrix with 2 rows and 1 column• matrix(c(1,0,3,4), nrow = 2, ncol = 2 ) creates a 2 x 2 matrix • Equivalent but not recommended: matrix(c(1,0,3,4), 2, 2)

"Apply" commands
Apply commands allows to apply a function to every row or column of a data matrix
apply(X, MARGIN, FUN, ...)
MARGIN: 1 (row-wise) or 2 (column-wise)FUN: The function to apply
Additional apply functions: lapply (lists), sapply (lapply wrapper trying to convert the result into a matrix), tapply, aggregate (apply according to factor groups), mapply (apply to corresponding elements of multiple inputs) ...

apply for patients* Calculate mean for each of the first two columns
* Mean height separately for each gender

Irises
Iris virginica Iris setosa Iris versicolor
PetalSepal

Apply example for irisisthe iris data gives measurements in centimeters of 5 variables
for 3 plant species.
> iris[1:3,1:3]
Sepal.Length Sepal.Width Petal.Length
1 5.1 3.5 1.4
2 4.9 3.0 1.4
3 4.7 3.2 1.3
> apply(iris[1:3,1:3], 1, mean)
1 2 3
3.333333 3.100000 3.066667

Graphics in Rbase graphics and ggplot2 (grammar of graphics) are
commonly used to produce plots in R; in a nutshell:
base R: “canvas” model you start with a white space and add graphical elements step by step
ggplot2: “grammar” of graphics model. You start by organizing your data in the right way, then a plot is a mapping from data to aesthetics
aesthetics = things that you can visually perceive:color, shape or geometric objects like points, lines, bars
Nice lectures by Roger Pen:http://www.youtube.com/watch?v=HeqHMM4ziXAhttp://www.youtube.com/watch?v=n8kYa9vu1l8
Graphics in base RDefault command: plot() , there are other specialized
commands like hist() or pie()
plot(x, y, type, main, par (...) )
x: x-axis data y: y-axis data (may be missing)type=l,p,h,b: display lines / points / horizontal lines ...main: plot headingpar (...): additional graphical parameters, see ?par for
more Info ...

Changing graphical parameterspar(cex, col, lty, mfrow, pch, x/yaxs)
• cex Scaling of graphical elements• col Color (colors() shows predefined colors, see alsohttp://research.stowers-institute.org/efg/R/Color/Chart/ )• lty: Line type• mfrow / mfcol: positioning of multiple plots• pch: use different plotting symbols• x/yaxs: y / x-axis style
A parameter can be obtained with ?par
Graphical Elements in Rplot(): opens a new graphics window
Additional elements can then be added, e.g.• lines(), points(), legend(), text() ...
Plots can be plotted into files using graphical devices like pdf(), ps() and jpg()
dev.off() shuts down the graphical device and saves the file
help can be obtained by calling e.g. ?legend.
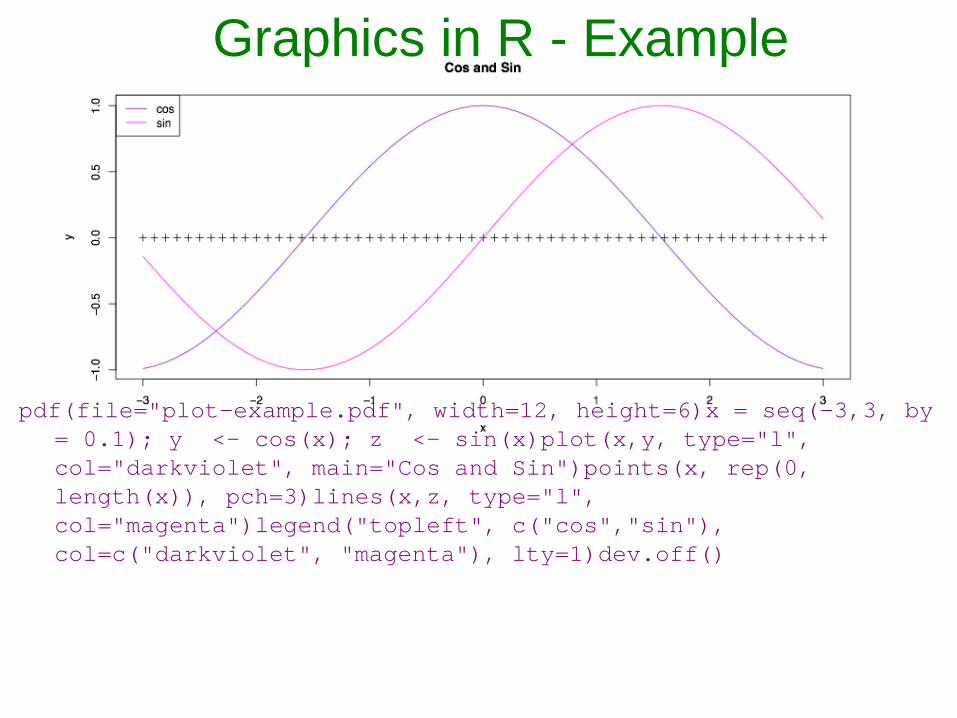
Graphics in R - Example
pdf(file="plot-example.pdf", width=12, height=6)x = seq(-3,3, by = 0.1); y <- cos(x); z <- sin(x)plot(x,y, type="l", col="darkviolet", main="Cos and Sin")points(x, rep(0, length(x)), pch=3)lines(x,z, type="l", col="magenta")legend("topleft", c("cos","sin"), col=c("darkviolet", "magenta"), lty=1)dev.off()

ggplot2 exampleWe use the iris data set: to produce a simple scatterplot of
Sepal.Length and Sepal.Width one can map Sepal.Lengthto the x and Sepal.Width to y axis
p <- ggplot(iris, aes(Sepal.Length, Sepal.Width) )Then we can a point geometry to produce a scatterplotp + geom_point()

Example continuedwe can further map the species to color, here using the qplot()
command, the ggplot 2 version of plot()qplot(Sepal.Length, Sepal.Width, data = iris, color = Species)

Panels in ggplot2you can easily split the plots into panels using factors(qplot(Sepal.Length, Sepal.Width, data = iris,color = Species, facets = . ~ Species))

qplot summary• can be used much like plot, but has nice additional options
qplot(x, y = NULL, ..., data, facets = NULL, NA), ylim = c(NA, NA), log = "", main = NULL, xlab = deparse(substitute(x)), ylab = deparse(substitute(y)))
• facets: split the plot into facets• main: title of the plot• color, fill: set to factor/string in the data set in order to color the
plot depending on that factor. Use I("colorname") to use a specific color
• geom: specify a “geometry” to be used in the plots, examples include point, line, boxplot, histogram etc.

Programming in RYou can create your own function by using the following
templatefunction.name<-function(arguments, options) { ......return()
}
arguments: compulsory argumentsoptions: optional arguments with default values{ }: the function code is in curly bracketsreturn(): return value of the function, if omitted, R returns
the result of the last computation performed

Example: mean value function my.mean <-function(data) {
my.sum<-sum(data, na.rm=TRUE)
my.length<-length(!is.na(data))
my.sum/my.length
}
my.mean function namedata input datamy.sum, my.length local variables, only visible within
the functionreturn value: last statement, i.e. calculated mean value

Example: Currency converter
euro.calc<-function(x) {
# convert euro to us dollars
x*1.13
}
Example: Currency Converter
x: formal argument, necessary to execute the functionreturn(...): specifies return value of the function
# indicate comments, ALWAYS COMMENT EXTENSIVELY!

Programming StatementsIf-Statement: Computation is
only performed if a certain condition is met
For-Loop: Computation is done a specified number of times
Log. operators: ==(=), ! =(=),<=(≤) and >=(≥), combine with & (“and”) and |(“or”)

Currency converter including an If statement
euro.calc<-function(x, currency="US") {
## currency has a default argrument "US"
if(currency=="US") return(x*1.13)
if(currency=="Pounds") return(x*0.65)
}
x: formal argument, necessary to execute the functioncurrency: optional argument, set to "US" by default
return(...): specifies return value of the function
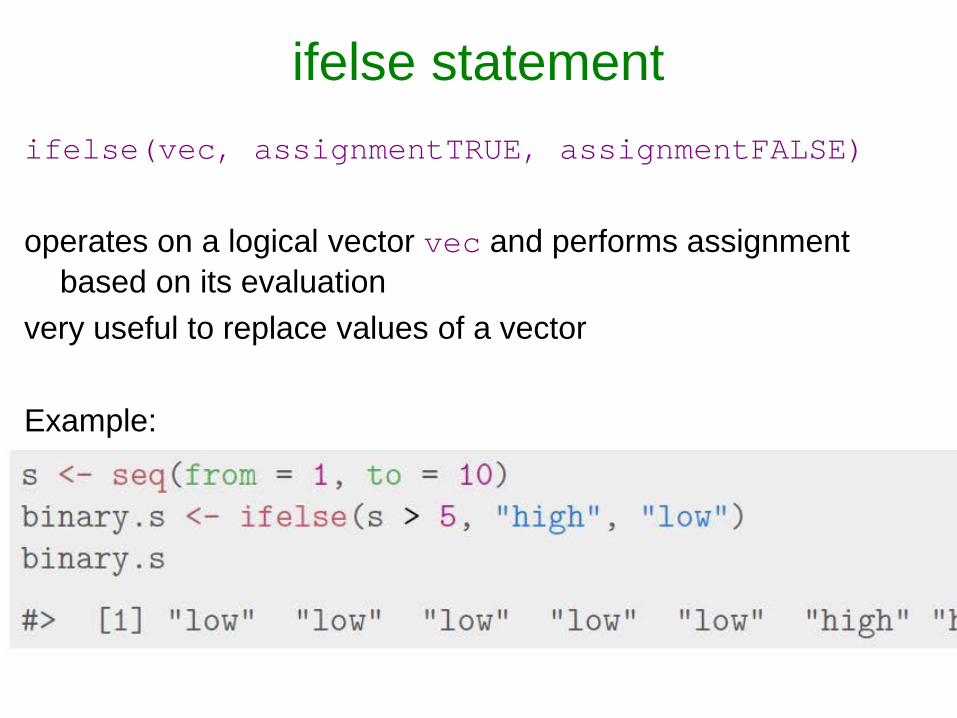
ifelse statementifelse(vec, assignmentTRUE, assignmentFALSE)
operates on a logical vector vec and performs assignment based on its evaluation
very useful to replace values of a vector
Example:
> x <- 1:10
> ifelse(x<5, x, 0)
[1] 1 2 3 4 0 0 0 0 0 0
Recommended


![Some Examples in R- [Data Visualization--R graphics]](https://img.pdfslide.us/doc/110x75/5871290c1a28abe4448b6bb3/some-examples-in-r-data-visualization-r-graphics.jpg)
