An Innovative Approach for
Determining Storm Event
Rainfall Probabilities
Case Studies Hurricanes Matthew and
Joaquin
ASFPM Annual ConferenceMay 2, 2017 | Kansas City, MO
Neal Banerjee, PE, CFMWater Resources Dept. Manager
ESP Associates, P.A.
October 2015 - Hurricane Joaquin Storm in the Carolinas
Driving Force – You May Remember This

October 2016 - Hurricane Matthew Storm in the Carolinas
And This …

Presentation Outline
• Background and Context
• Rainfall Probability Concepts
• Storm Event Magnitude Approach
• Case Study Applications
• Summary and Conclusions
• Looking Ahead

Background and Context
• Rainfall is the most direct and relatable characteristic that defines magnitude of a storm event
• There are a number of resources that report storm event rainfall
• Natural desire to associate large events with recurrence interval

Problem Statement
• Rainfall generally report as depth totals or
animated reflectivity images
• Traditional Reporting Limitations:
– Duration “lost is translation”
– Little to no information on storm pattern
Magnitude of storm unknown,
misinterpreted, and/or
miscommunicated
Background and Context

The Objective
• Figure out a way to compile rainfall data
and compute and visualize storm event
magnitudes
Answer the common question:
What magnitude storm event did we (or
are we going) to have?
Background and Context

Goals
• Compute for large areas quickly
• Visualize near real-time observed and forecast precipitation probabilities
• Retroactively compute probabilities for historic events
• Integrate wide range of storm magnitudes
– 2-yr through 500-yr+
• Handle range of storm durations
– 6-hr, 12-hr, 24-hr, 7-day, etc.
Background and Context

Rainfall Probability Concepts
Basic Inputs
• When, where, and how much it rained
– Rainfall amounts distributed over time
– Spatial location
• Statistical rainfall probability information
– Depth-Duration-Frequency (DDF)
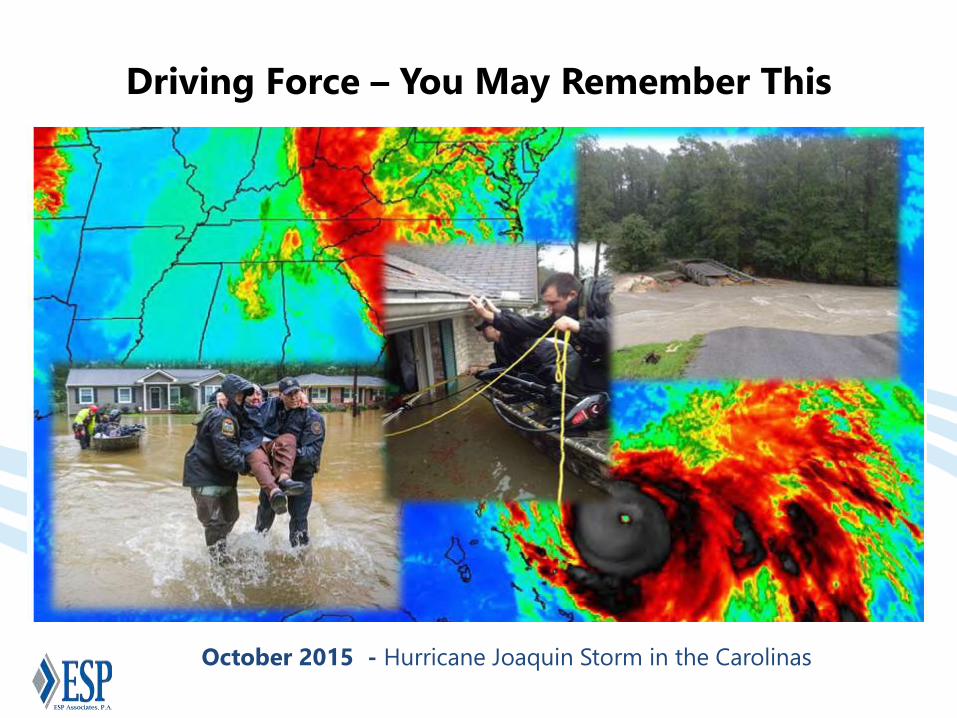
Data Sources
• Rainfall Amounts
– Rain gages
– Radar-Based: • NEXRAD/Radar Products
• NWS River Forecast Center (RFC) Products
• NSSL Multiple Radar / Multiple Sensor (MRMS)
• Rainfall Probability
– NOAA Atlas 14 (successor of TP-40)
– USGS gage studies
– Local storm design manuals
Rainfall Probability
Concepts

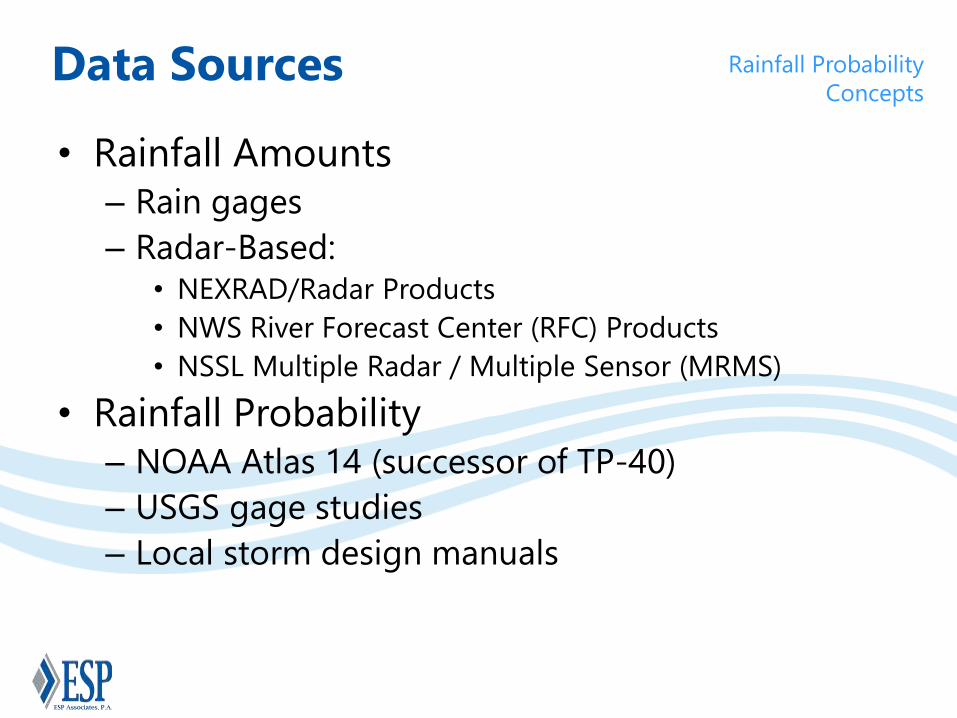
Gage-Based Rainfall Data
Pros
– Most accurate
– Near real-time readings
Cons:
– Point-Based Reading
– Incomplete/Inconsistent spatial distribution
Rainfall Probability
Concepts
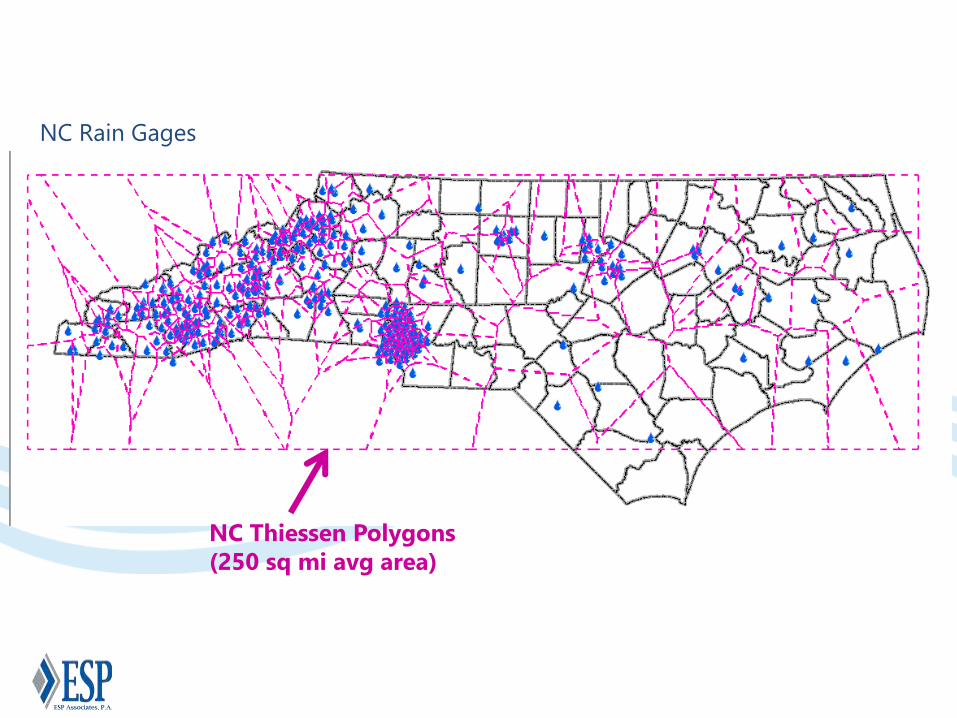
NC Thiessen Polygons
(250 sq mi avg area)
NC Rain Gages

Radar-Based Rainfall Data
Pros
– Complete coverage
– “Area” based estimates
Cons:
– Less Accuracy
– Ease of use
– Not as “real-time”
Rainfall Probability
Concepts

NEXRAD Data from Greenville, SC Station

Daily/Monthly/Yearly
Hourly
NWS Precipitation Download

NWS Rainfall Download (Point Shapefile)
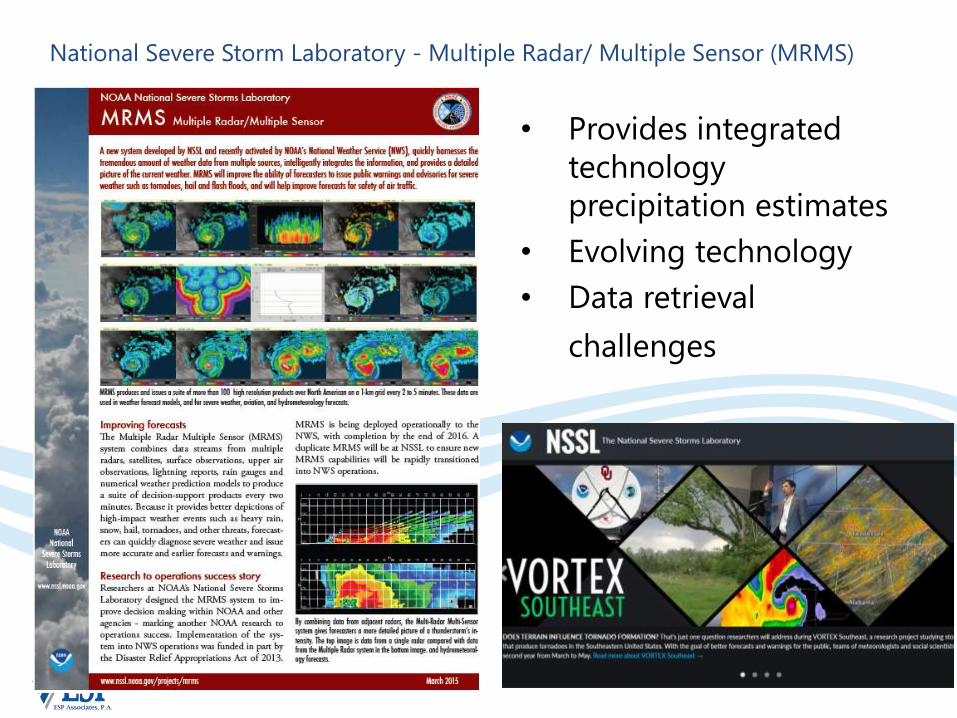
• Provides integrated
technology
precipitation estimates
• Evolving technology
• Data retrieval
challenges
National Severe Storm Laboratory - Multiple Radar/ Multiple Sensor (MRMS)
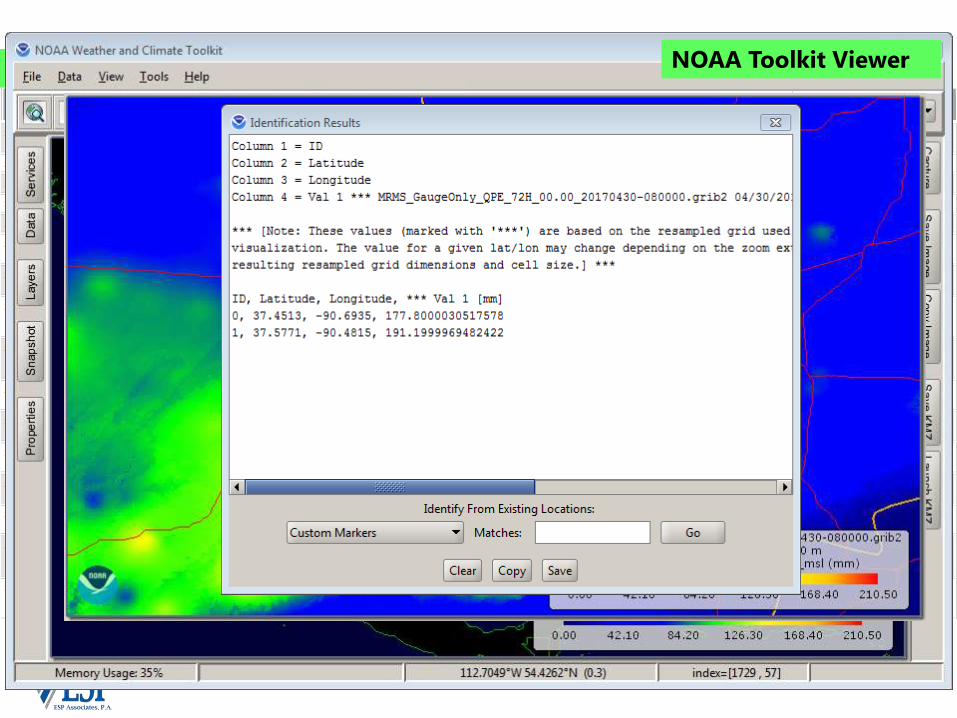
Sample Product Table NOAA Toolkit Viewer

NOAA Atlas 14 Data
• Nationwide coverage (10 volumes)
– Volume 2 covers Carolinas
• “Static” datasets
• Provides seamless Depth-Duration-Frequency:
– 5-min to 60-day duration
– 1-yr to 1000-yr frequency
• Digital access/retrieval through
Hydrometeorological Design Study Center
(HDSC) website
Rainfall Probability
Concepts

HDSC Precipitation DDF Web Access
USGS / Local Data
• Number of local/regional USGS studies that
have independent or pseudo-independent
DDF (or IDF) information
• Generally focused in more urban areas and
generalized at municipal level
• Expected that generally similar to Atlas 14
estimates as often based on(or references)
predecessors
Rainfall Probability
Concepts

Examples of USGS /
Local Rainfall
Probability
Information

Storm Event Magnitude Approach
Data Sources
• NWS Rainfall Data
• NOAA Atlas 14 Probability Data
General Approach
• Compile pre-staged rainfall reporting and probability data
• Integrate data into single dataset
• Develop calculation algorithms

Workflow
• Extract storm precipitation data for desired time/duration from NWS site
• Associated with Pre-Stage/Loaded Data
• Calculate probability based on depth and duration
• Create probability rasters
• Summarize at watershed (HUC12) or desired AOI level
• Map results
Storm Event Magnitude Approach

• 2.5 mi grid spacing
• Static ID to link to
storm
observed/forecast
readings
NWS Reporting Point Grid

NOAA Atlas 14 Probability Data

NC 24-hr 100-yr Rainfall Depth Raster
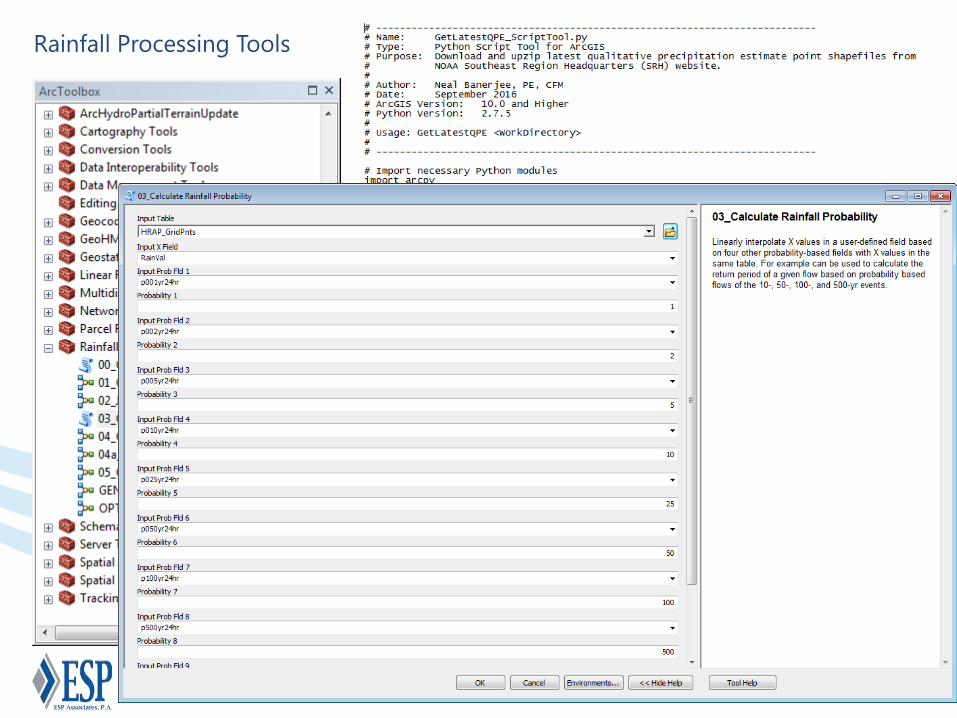
Rainfall Processing Tools

Case Study Applications
• SC/NC Hurricane Joaquin – October 2015
• SC/NC Hurricane Matthew – October 2016
• Mecklenburg County – August 2011

Hurricane Joaquin
• October 3 – 5, 2015
• Hurricane and stalled low pressure system
• 3” – 20”+ of rainfall
• 20 fatalities
• Billions in losses and damage
• South-Central SC hit hardest
Case Study Applications

3-Day Probability Storm
Event Magnitude

• 2,750 HUC12s in
Carolinas
• 40 sq mi average area ±
Probability Summarized
at HUC 12

Hurricane Matthew
• October 7 – 8, 2016
• 3” – 20”+ of rainfall
• 26 fatalities in Carolinas
• New records at 8 gages
• Billions in losses and damage
• Extended flooding for weeks
Case Study Applications


August 2011 Storm
• August 5, 2011
• Stalled low pressure system western-central
Charlotte
• Major “flash flood”
• 7”+/- rain in short period
• 2 fatalities, 160 buildings flooded
• $2M in damage
Case Study Applications

• Intense 6-hr storm concentrated
over 3-4 hours
• Dense gage network
• Example of multi-duration
probability
Multi-Duration Storm Event Magnitude
Performance/Scalability
• Algorithms work very fast at large are levels
(e.g. statewide)
– Probability calculations: seconds
– Mapping and AOI Summary: seconds to minutes
• Scalable nationwide
• Can use similar logic for rainfall forecast
– 3-day advance in 6-hr increment
• Can automate retrieval and processing every
hour
Case Study
Applications

Summary and Conclusions
• Traditional rainfall reporting can lead to misinterpretation of storm event magnitude
• Combining readily available rainfall data, can estimate storm event magnitudes for multiple durations over large areas
• Same logic can be applied to historic storms or forecasted rainfall
• Data and algorithms are scalable and can be batched for automated processing

Looking Ahead
• Relate rainfall probability estimates with
flood impacts
– Flood Warning / Gages (where exists)
– Existing models (e.g. RiskMAP) in ungaged
areas

NC FIMAN in EOC During Hurricane Matthew

Recommended