Turkish J. Eng. Env. Sci.31 (2007) , 79 – 87.c© TUBITAK
An in Vitro Investigation of Steady Transitional Flow in anArteriovenous Graft-to-Vein Anastomosis
Nurullah ARSLANFatih University, Graduate Institute of Sciences and Engineering and
Department of Industrial Engineering, 34500, Istanbul-TURKEYe-mail: [email protected]
Received 14.09.2006
Abstract
Fluid flow analysis was experimentally performed inside a venous anastomosis of an arteriovenous (AV)graft-to-vein connection. Velocity measurements were conducted inside an upscaled end-to-side graft modelunder steady flow conditions at Reynolds numbers of 1000, 1800, and 2500, which are the representatives ofin vivo flow conditions at diastolic, average, and systolic phases inside a human AV graft used for dialysisaccess. The distribution of the velocity and turbulence intensity was measured at several locations in theplane of the bifurcation and in the plane that is perpendicular to the plane of bifurcation. Critical flowregions, such as the separation region and high turbulence region, were found inside the anastomosis.
Key words: Hemodialysis, Arteriovenous graft, Stenosis, Turbulence.
Introduction
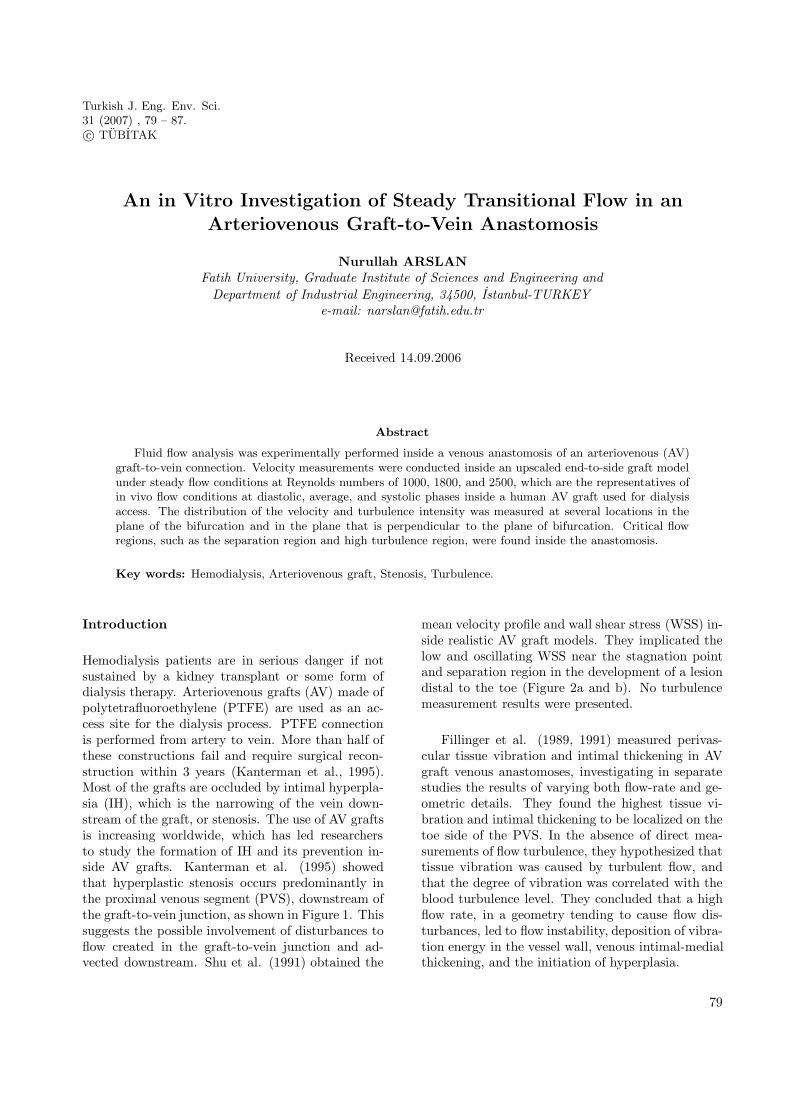
Hemodialysis patients are in serious danger if notsustained by a kidney transplant or some form ofdialysis therapy. Arteriovenous grafts (AV) made ofpolytetrafluoroethylene (PTFE) are used as an ac-cess site for the dialysis process. PTFE connectionis performed from artery to vein. More than half ofthese constructions fail and require surgical recon-struction within 3 years (Kanterman et al., 1995).Most of the grafts are occluded by intimal hyperpla-sia (IH), which is the narrowing of the vein down-stream of the graft, or stenosis. The use of AV graftsis increasing worldwide, which has led researchersto study the formation of IH and its prevention in-side AV grafts. Kanterman et al. (1995) showedthat hyperplastic stenosis occurs predominantly inthe proximal venous segment (PVS), downstream ofthe graft-to-vein junction, as shown in Figure 1. Thissuggests the possible involvement of disturbances toflow created in the graft-to-vein junction and ad-vected downstream. Shu et al. (1991) obtained the
mean velocity profile and wall shear stress (WSS) in-side realistic AV graft models. They implicated thelow and oscillating WSS near the stagnation pointand separation region in the development of a lesiondistal to the toe (Figure 2a and b). No turbulencemeasurement results were presented.
Fillinger et al. (1989, 1991) measured perivas-cular tissue vibration and intimal thickening in AVgraft venous anastomoses, investigating in separatestudies the results of varying both flow-rate and ge-ometric details. They found the highest tissue vi-bration and intimal thickening to be localized on thetoe side of the PVS. In the absence of direct mea-surements of flow turbulence, they hypothesized thattissue vibration was caused by turbulent flow, andthat the degree of vibration was correlated with theblood turbulence level. They concluded that a highflow rate, in a geometry tending to cause flow dis-turbances, led to flow instability, deposition of vibra-tion energy in the vessel wall, venous intimal-medialthickening, and the initiation of hyperplasia.
79
ARSLAN
Artery
Vein
19%
47%Venousanastomosis4%
Arterialanastomosis
11%
AV Graft
Figure 1. Distribution of hyperplastic stenoses accordingto Kanterman et al. (1995).
While these studies have contributed to our un-derstanding of IH formation in anastomoses, they didnot fully take into account all of the special fluid me-chanical circumstances pertaining to this junction.The major differences between these 2 end-to-sideanastomoses, the arterial and the venous, from thefluid mechanical point of view, relate to the higherflow-rate and the reduced viscosity for the renal dial-ysis access graft. Higher flow-rate is a consequenceof the fact that the arteriovenous shunt bypasses theperipheral resistance, forcing the heart to increasecardiac output by virtue of the increased venousreturn. Higher flow rates produce a much higherReynolds number in the graft-to-vein junction andcause a greater tendency for flow instability and tur-bulence, as noted by Fillinger et al. (1990). Thisfact is illustrated by ultrasonic measurements of flow-rates and vessel diameters in a patient with such anarteriovenous graft constructed (Figure 3). In thisstudy, it was assumed that turbulent flow is likely inany graft-to-vein junction having the diameter andflow-rate necessary for continuing patency and dial-ysis use.
GRAFT
DVS
HEEL(Apex)
HOOD
FLOOR
TOE
PVS
-x/D +x/D0
(a)
-6 -5.2 -4.4 -3.6 -2.8 -2 -1.2 -0.4 0.4 1.2 2 2.8 3.6
x x xx
xx
xx x x x x x x x x x x x x
-6.6
x
yz
(c)
1 BIFURCATIONPLANE
BIFURCATIONPLANE
1 BIFURCATIONPLANE
(b)
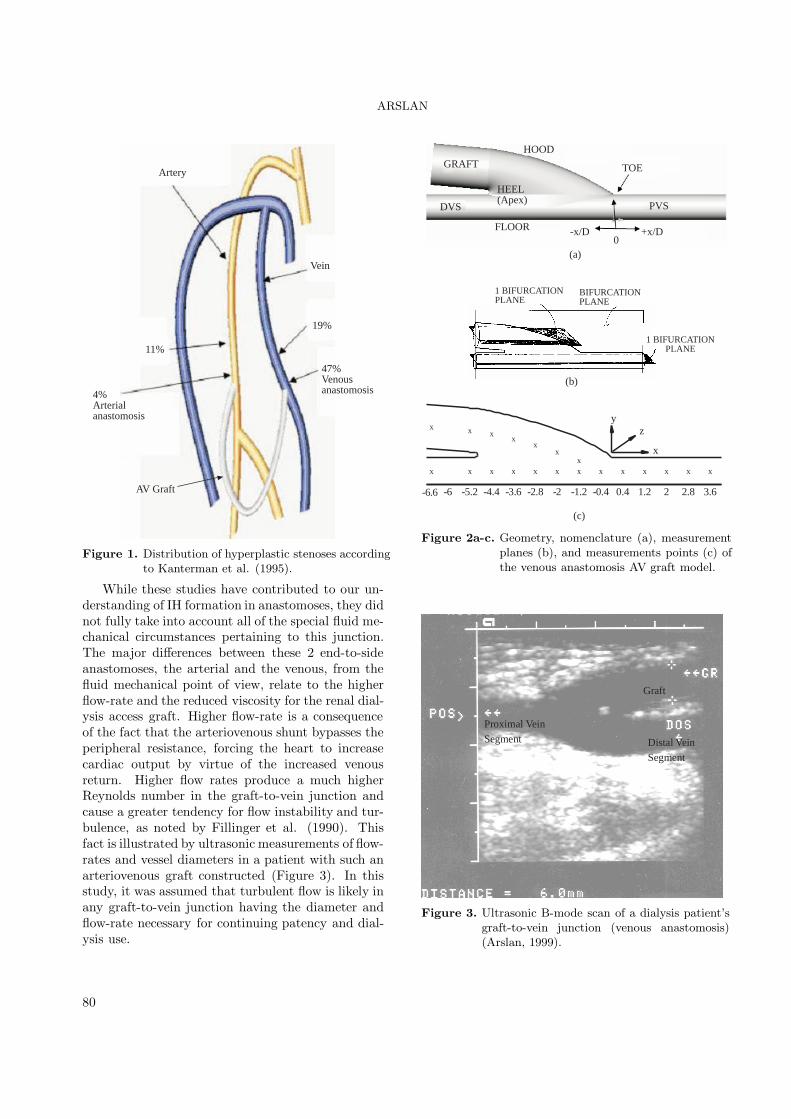
Figure 2a-c. Geometry, nomenclature (a), measurementplanes (b), and measurements points (c) ofthe venous anastomosis AV graft model.
Distal Vein
Segment
Graft
Proximal Vein
Segment
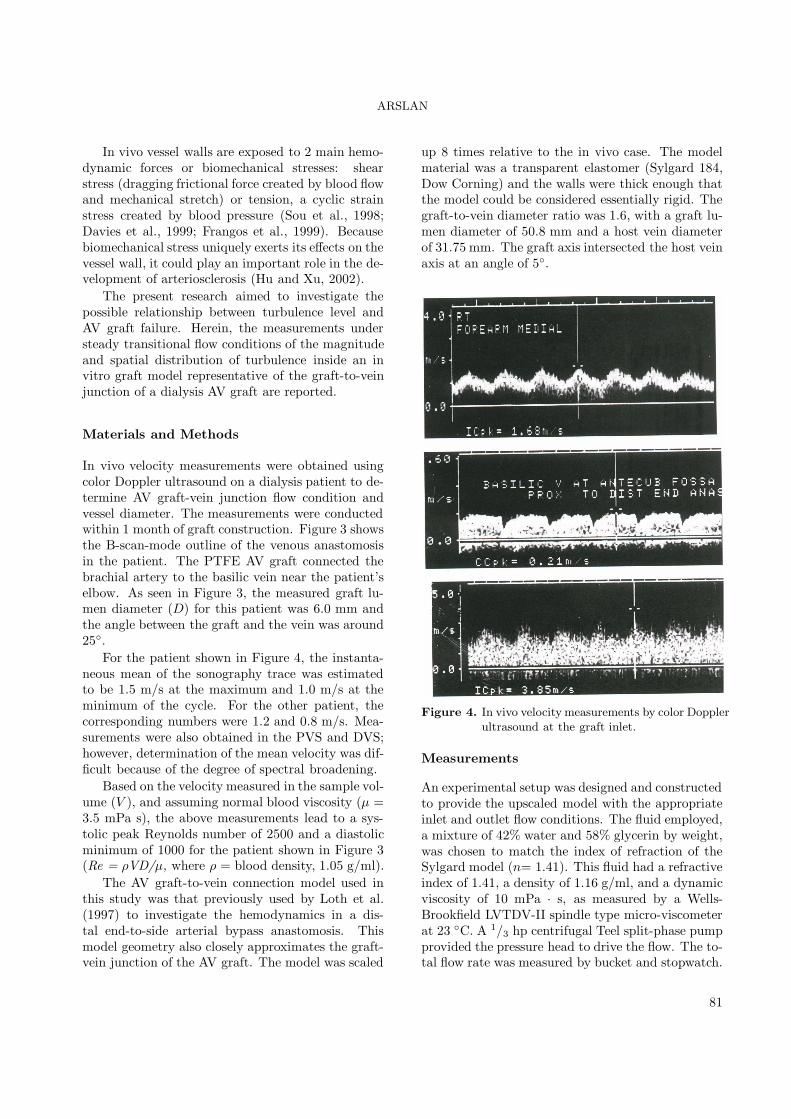
Figure 3. Ultrasonic B-mode scan of a dialysis patient’sgraft-to-vein junction (venous anastomosis)(Arslan, 1999).
80
ARSLAN
In vivo vessel walls are exposed to 2 main hemo-dynamic forces or biomechanical stresses: shearstress (dragging frictional force created by blood flowand mechanical stretch) or tension, a cyclic strainstress created by blood pressure (Sou et al., 1998;Davies et al., 1999; Frangos et al., 1999). Becausebiomechanical stress uniquely exerts its effects on thevessel wall, it could play an important role in the de-velopment of arteriosclerosis (Hu and Xu, 2002).
The present research aimed to investigate thepossible relationship between turbulence level andAV graft failure. Herein, the measurements understeady transitional flow conditions of the magnitudeand spatial distribution of turbulence inside an invitro graft model representative of the graft-to-veinjunction of a dialysis AV graft are reported.
Materials and Methods
In vivo velocity measurements were obtained usingcolor Doppler ultrasound on a dialysis patient to de-termine AV graft-vein junction flow condition andvessel diameter. The measurements were conductedwithin 1 month of graft construction. Figure 3 showsthe B-scan-mode outline of the venous anastomosisin the patient. The PTFE AV graft connected thebrachial artery to the basilic vein near the patient’selbow. As seen in Figure 3, the measured graft lu-men diameter (D) for this patient was 6.0 mm andthe angle between the graft and the vein was around25◦.
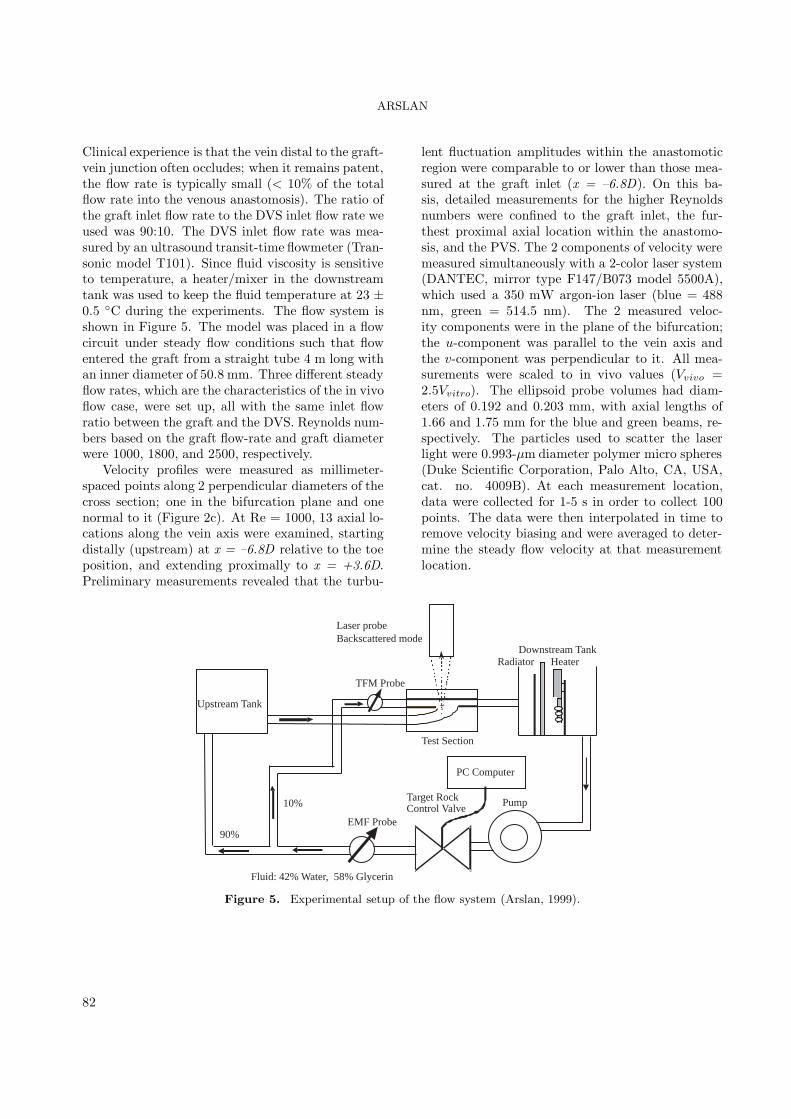
For the patient shown in Figure 4, the instanta-neous mean of the sonography trace was estimatedto be 1.5 m/s at the maximum and 1.0 m/s at theminimum of the cycle. For the other patient, thecorresponding numbers were 1.2 and 0.8 m/s. Mea-surements were also obtained in the PVS and DVS;however, determination of the mean velocity was dif-ficult because of the degree of spectral broadening.
Based on the velocity measured in the sample vol-ume (V ), and assuming normal blood viscosity (µ =3.5 mPa s), the above measurements lead to a sys-tolic peak Reynolds number of 2500 and a diastolicminimum of 1000 for the patient shown in Figure 3(Re = ρVD/µ, where ρ = blood density, 1.05 g/ml).
The AV graft-to-vein connection model used inthis study was that previously used by Loth et al.(1997) to investigate the hemodynamics in a dis-tal end-to-side arterial bypass anastomosis. Thismodel geometry also closely approximates the graft-vein junction of the AV graft. The model was scaled
up 8 times relative to the in vivo case. The modelmaterial was a transparent elastomer (Sylgard 184,Dow Corning) and the walls were thick enough thatthe model could be considered essentially rigid. Thegraft-to-vein diameter ratio was 1.6, with a graft lu-men diameter of 50.8 mm and a host vein diameterof 31.75 mm. The graft axis intersected the host veinaxis at an angle of 5◦.
Figure 4. In vivo velocity measurements by color Dopplerultrasound at the graft inlet.
Measurements
An experimental setup was designed and constructedto provide the upscaled model with the appropriateinlet and outlet flow conditions. The fluid employed,a mixture of 42% water and 58% glycerin by weight,was chosen to match the index of refraction of theSylgard model (n= 1.41). This fluid had a refractiveindex of 1.41, a density of 1.16 g/ml, and a dynamicviscosity of 10 mPa · s, as measured by a Wells-Brookfield LVTDV-II spindle type micro-viscometerat 23 ◦C. A 1/3 hp centrifugal Teel split-phase pumpprovided the pressure head to drive the flow. The to-tal flow rate was measured by bucket and stopwatch.
81
ARSLAN
Clinical experience is that the vein distal to the graft-vein junction often occludes; when it remains patent,the flow rate is typically small (< 10% of the totalflow rate into the venous anastomosis). The ratio ofthe graft inlet flow rate to the DVS inlet flow rate weused was 90:10. The DVS inlet flow rate was mea-sured by an ultrasound transit-time flowmeter (Tran-sonic model T101). Since fluid viscosity is sensitiveto temperature, a heater/mixer in the downstreamtank was used to keep the fluid temperature at 23 ±0.5 ◦C during the experiments. The flow system isshown in Figure 5. The model was placed in a flowcircuit under steady flow conditions such that flowentered the graft from a straight tube 4 m long withan inner diameter of 50.8 mm. Three different steadyflow rates, which are the characteristics of the in vivoflow case, were set up, all with the same inlet flowratio between the graft and the DVS. Reynolds num-bers based on the graft flow-rate and graft diameterwere 1000, 1800, and 2500, respectively.
Velocity profiles were measured as millimeter-spaced points along 2 perpendicular diameters of thecross section; one in the bifurcation plane and onenormal to it (Figure 2c). At Re = 1000, 13 axial lo-cations along the vein axis were examined, startingdistally (upstream) at x = –6.8D relative to the toeposition, and extending proximally to x = +3.6D.Preliminary measurements revealed that the turbu-
lent fluctuation amplitudes within the anastomoticregion were comparable to or lower than those mea-sured at the graft inlet (x = –6.8D). On this ba-sis, detailed measurements for the higher Reynoldsnumbers were confined to the graft inlet, the fur-thest proximal axial location within the anastomo-sis, and the PVS. The 2 components of velocity weremeasured simultaneously with a 2-color laser system(DANTEC, mirror type F147/B073 model 5500A),which used a 350 mW argon-ion laser (blue = 488nm, green = 514.5 nm). The 2 measured veloc-ity components were in the plane of the bifurcation;the u-component was parallel to the vein axis andthe v-component was perpendicular to it. All mea-surements were scaled to in vivo values (Vvivo =2.5Vvitro). The ellipsoid probe volumes had diam-eters of 0.192 and 0.203 mm, with axial lengths of1.66 and 1.75 mm for the blue and green beams, re-spectively. The particles used to scatter the laserlight were 0.993-µm diameter polymer micro spheres(Duke Scientific Corporation, Palo Alto, CA, USA,cat. no. 4009B). At each measurement location,data were collected for 1-5 s in order to collect 100points. The data were then interpolated in time toremove velocity biasing and were averaged to deter-mine the steady flow velocity at that measurementlocation.
Pump
Laser probeBackscattered mode
HeaterRadiatorDownstream Tank
Upstream Tank
Test Section
Fluid: 42% Water, 58% Glycerin
Target RockControl Valve
90%
10%
EMF Probe
TFM Probe
PC Computer
Figure 5. Experimental setup of the flow system (Arslan, 1999).
82
ARSLAN
The SIZEware data acquisition program (Dantec,Inc.) was used to record the instantaneous velocityfor steady flow. We recorded 5000 validated sam-ples inside the flow field and then the mean velocitywas found by taking the average of the samples for uand v components of the velocity. Since the data ratewas lower near the wall of the model, an elapsed timemode was used and data were taken for 5 min (thenumber of the validated samples was changed from200 to 1000). The fluctuation velocities were foundby subtracting the mean velocity from the instanta-neous velocities at each time step and then averagedover the specified number of validated samples to findthe variables at each measurement location (Arslan,1999).
Results
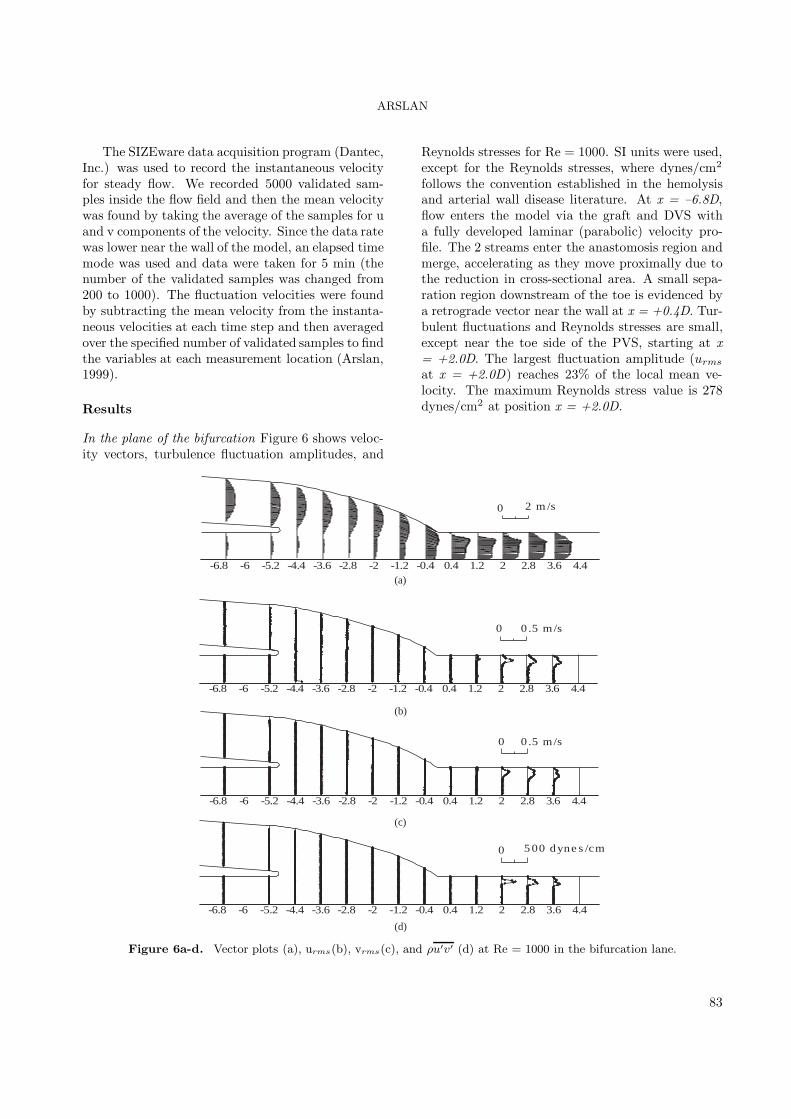
In the plane of the bifurcation Figure 6 shows veloc-ity vectors, turbulence fluctuation amplitudes, and
Reynolds stresses for Re = 1000. SI units were used,except for the Reynolds stresses, where dynes/cm2
follows the convention established in the hemolysisand arterial wall disease literature. At x = –6.8D,flow enters the model via the graft and DVS witha fully developed laminar (parabolic) velocity pro-file. The 2 streams enter the anastomosis region andmerge, accelerating as they move proximally due tothe reduction in cross-sectional area. A small sepa-ration region downstream of the toe is evidenced bya retrograde vector near the wall at x = +0.4D. Tur-bulent fluctuations and Reynolds stresses are small,except near the toe side of the PVS, starting at x= +2.0D. The largest fluctuation amplitude (urms
at x = +2.0D) reaches 23% of the local mean ve-locity. The maximum Reynolds stress value is 278dynes/cm2 at position x = +2.0D.
-6.8 -6 -5.2 -4.4 -3.6 -2.8 -2 -1.2 -0.4 0.4 1.2 2 2.8 3.6 4.4
0 0 .5 m/s
-6.8 -6 -5.2 -4.4 -3.6 -2.8 -2 -1.2 -0.4 0.4 1.2 2 2.8 3.6 4.4
0 0 .5 m/s
-6.8 -6 -5.2 -4.4 -3.6 -2.8 -2 -1.2 -0.4 0.4 1.2 2 2.8 3.6 4.4
0 5 00 dyne s /cm
-6.8 -6 -5.2 -4.4 -3.6 -2.8 -2 -1.2 -0.4 0.4 1.2 2 2.8 3.6 4.4
0 2 m /s
(a)
(b)
(c)
(d)
Figure 6a-d. Vector plots (a), urms(b), vrms(c), and ρu′v′ (d) at Re = 1000 in the bifurcation lane.
83
ARSLAN
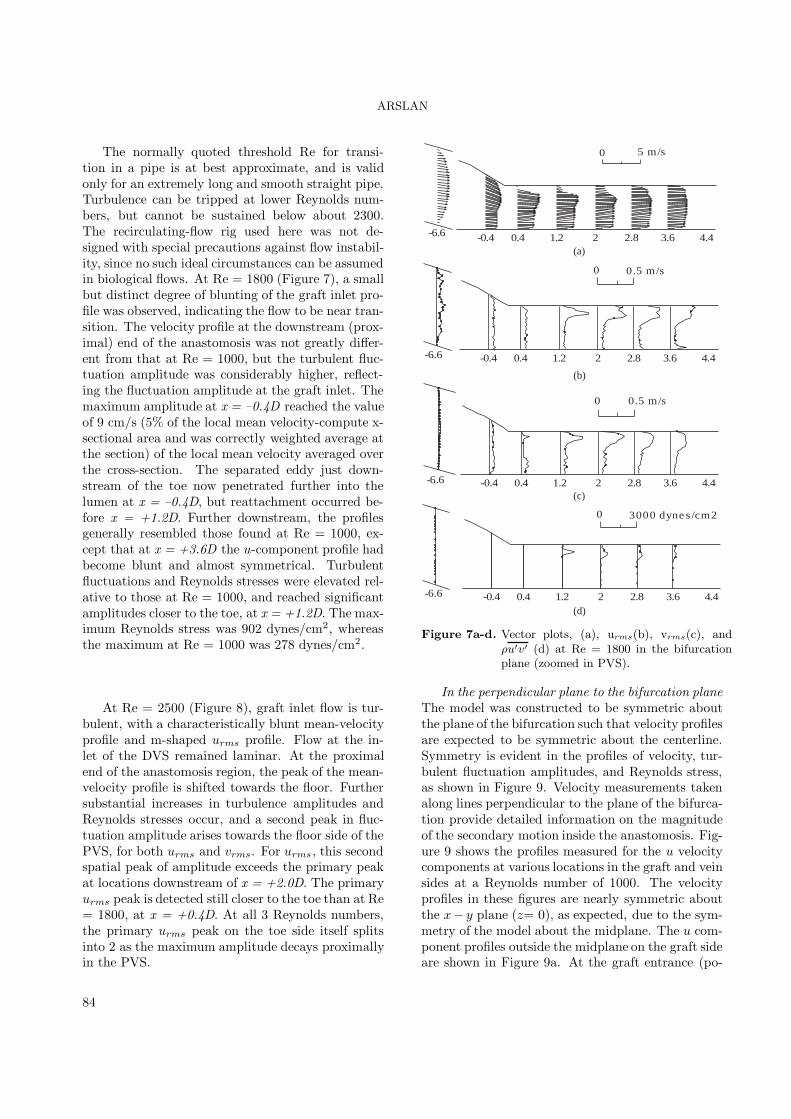
The normally quoted threshold Re for transi-tion in a pipe is at best approximate, and is validonly for an extremely long and smooth straight pipe.Turbulence can be tripped at lower Reynolds num-bers, but cannot be sustained below about 2300.The recirculating-flow rig used here was not de-signed with special precautions against flow instabil-ity, since no such ideal circumstances can be assumedin biological flows. At Re = 1800 (Figure 7), a smallbut distinct degree of blunting of the graft inlet pro-file was observed, indicating the flow to be near tran-sition. The velocity profile at the downstream (prox-imal) end of the anastomosis was not greatly differ-ent from that at Re = 1000, but the turbulent fluc-tuation amplitude was considerably higher, reflect-ing the fluctuation amplitude at the graft inlet. Themaximum amplitude at x = –0.4D reached the valueof 9 cm/s (5% of the local mean velocity-compute x-sectional area and was correctly weighted average atthe section) of the local mean velocity averaged overthe cross-section. The separated eddy just down-stream of the toe now penetrated further into thelumen at x = –0.4D, but reattachment occurred be-fore x = +1.2D. Further downstream, the profilesgenerally resembled those found at Re = 1000, ex-cept that at x = +3.6D the u-component profile hadbecome blunt and almost symmetrical. Turbulentfluctuations and Reynolds stresses were elevated rel-ative to those at Re = 1000, and reached significantamplitudes closer to the toe, at x = +1.2D. The max-imum Reynolds stress was 902 dynes/cm2, whereasthe maximum at Re = 1000 was 278 dynes/cm2.
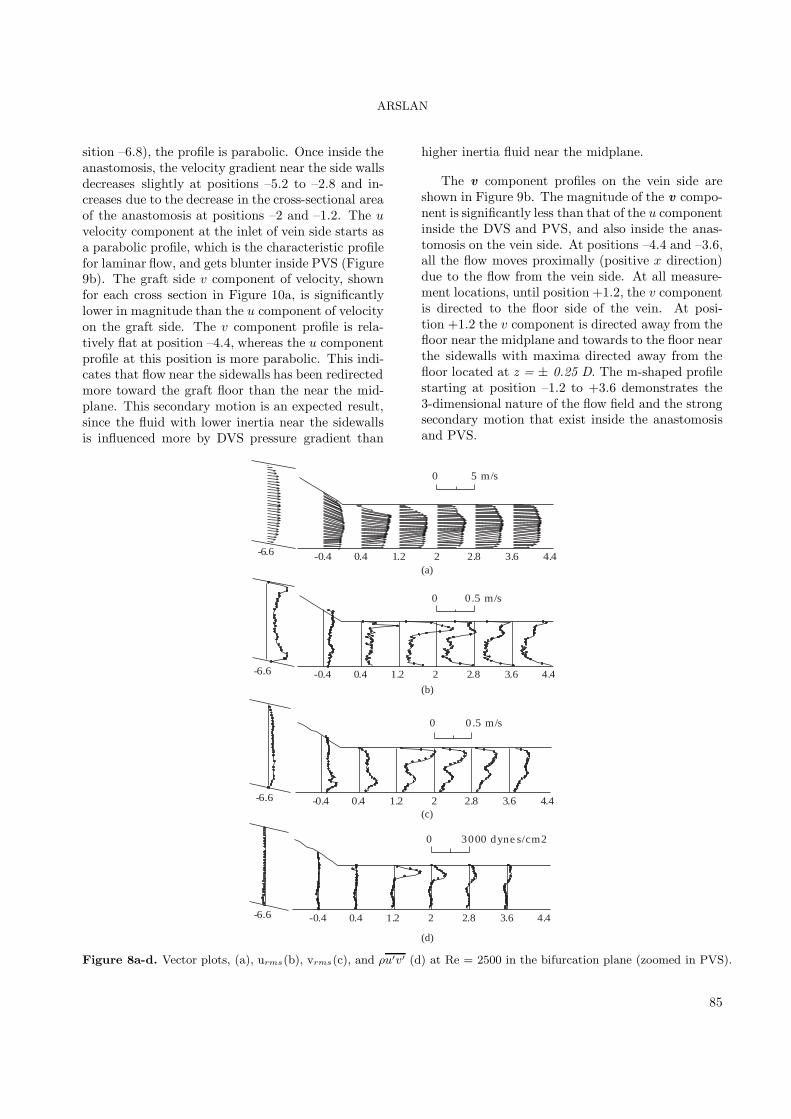
At Re = 2500 (Figure 8), graft inlet flow is tur-bulent, with a characteristically blunt mean-velocityprofile and m-shaped urms profile. Flow at the in-let of the DVS remained laminar. At the proximalend of the anastomosis region, the peak of the mean-velocity profile is shifted towards the floor. Furthersubstantial increases in turbulence amplitudes andReynolds stresses occur, and a second peak in fluc-tuation amplitude arises towards the floor side of thePVS, for both urms and vrms. For urms, this secondspatial peak of amplitude exceeds the primary peakat locations downstream of x = +2.0D. The primaryurms peak is detected still closer to the toe than at Re= 1800, at x = +0.4D. At all 3 Reynolds numbers,the primary urms peak on the toe side itself splitsinto 2 as the maximum amplitude decays proximallyin the PVS.
-6.6 -0.4 0.4 1.2 2 2.8 3.6 4.4
0 0.5 m/s
-6.6 -0.4 0.4 1.2 2 2.8 3.6 4.4
0 3000 dyne s /cm2
-6.6 -0.4 0.4 1.2 2 2.8 3.6 4.4
0 5 m/s
-6.6 -0.4 0.4 1.2 2 2.8 3.6 4.4
0 0.5 m/s
(a)
(b)
(c)
(d)
Figure 7a-d. Vector plots, (a), urms(b), vrms(c), andρu′v′ (d) at Re = 1800 in the bifurcationplane (zoomed in PVS).
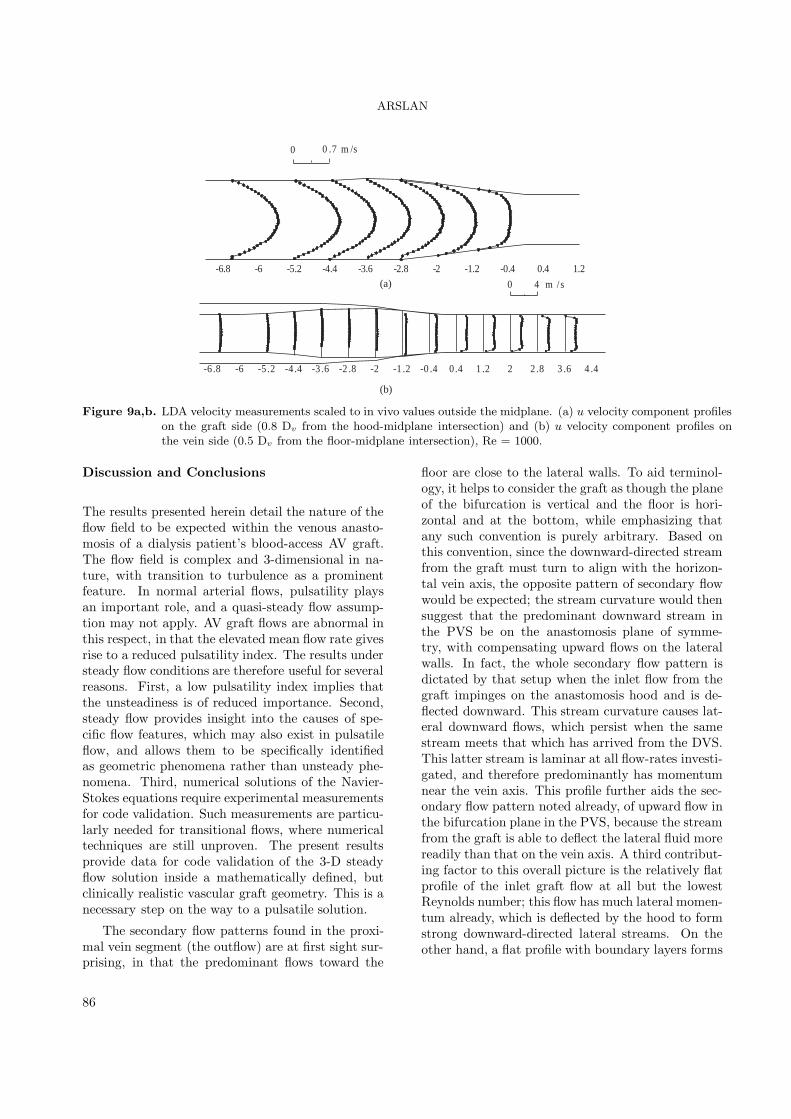
In the perpendicular plane to the bifurcation planeThe model was constructed to be symmetric aboutthe plane of the bifurcation such that velocity profilesare expected to be symmetric about the centerline.Symmetry is evident in the profiles of velocity, tur-bulent fluctuation amplitudes, and Reynolds stress,as shown in Figure 9. Velocity measurements takenalong lines perpendicular to the plane of the bifurca-tion provide detailed information on the magnitudeof the secondary motion inside the anastomosis. Fig-ure 9 shows the profiles measured for the u velocitycomponents at various locations in the graft and veinsides at a Reynolds number of 1000. The velocityprofiles in these figures are nearly symmetric aboutthe x− y plane (z= 0), as expected, due to the sym-metry of the model about the midplane. The u com-ponent profiles outside the midplane on the graft sideare shown in Figure 9a. At the graft entrance (po-
84
ARSLAN
sition –6.8), the profile is parabolic. Once inside theanastomosis, the velocity gradient near the side wallsdecreases slightly at positions –5.2 to –2.8 and in-creases due to the decrease in the cross-sectional areaof the anastomosis at positions –2 and –1.2. The uvelocity component at the inlet of vein side starts asa parabolic profile, which is the characteristic profilefor laminar flow, and gets blunter inside PVS (Figure9b). The graft side v component of velocity, shownfor each cross section in Figure 10a, is significantlylower in magnitude than the u component of velocityon the graft side. The v component profile is rela-tively flat at position –4.4, whereas the u componentprofile at this position is more parabolic. This indi-cates that flow near the sidewalls has been redirectedmore toward the graft floor than the near the mid-plane. This secondary motion is an expected result,since the fluid with lower inertia near the sidewallsis influenced more by DVS pressure gradient than
higher inertia fluid near the midplane.
The v component profiles on the vein side areshown in Figure 9b. The magnitude of the v compo-nent is significantly less than that of the u componentinside the DVS and PVS, and also inside the anas-tomosis on the vein side. At positions –4.4 and –3.6,all the flow moves proximally (positive x direction)due to the flow from the vein side. At all measure-ment locations, until position +1.2, the v componentis directed to the floor side of the vein. At posi-tion +1.2 the v component is directed away from thefloor near the midplane and towards to the floor nearthe sidewalls with maxima directed away from thefloor located at z = ± 0.25 D. The m-shaped profilestarting at position –1.2 to +3.6 demonstrates the3-dimensional nature of the flow field and the strongsecondary motion that exist inside the anastomosisand PVS.
-6.6 -0.4 0.4 1.2 2 2.8 3.6 4.4
0 0.5 m/s
-6.6 -0.4 0.4 1.2 2 2.8 3.6 4.4
0 3000 dyne s/cm2
-6.6 -0.4 0.4 1.2 2 2.8 3.6 4.4
0 5 m/s
-6.6 -0.4 0.4 1.2 2 2.8 3.6 4.4
0 0.5 m/s
(a)
(b)
(c)
(d)
Figure 8a-d. Vector plots, (a), urms(b), vrms(c), and ρu′v′ (d) at Re = 2500 in the bifurcation plane (zoomed in PVS).
85
ARSLAN
-6.8 -6 -5.2 -4.4 -3.6 -2.8 -2 -1.2 -0.4 0.4 1.2
0 0 .7 m /s
-6 .8 -6 -5 .2 -4 .4 -3 .6 -2 .8 -2 -1 .2 -0 .4 0 .4 1 .2 2 2 .8 3 .6 4 .4
0 4 m /s(a)
(b)
Figure 9a,b. LDA velocity measurements scaled to in vivo values outside the midplane. (a) u velocity component profileson the graft side (0.8 Dv from the hood-midplane intersection) and (b) u velocity component profiles onthe vein side (0.5 Dv from the floor-midplane intersection), Re = 1000.
Discussion and Conclusions
The results presented herein detail the nature of theflow field to be expected within the venous anasto-mosis of a dialysis patient’s blood-access AV graft.The flow field is complex and 3-dimensional in na-ture, with transition to turbulence as a prominentfeature. In normal arterial flows, pulsatility playsan important role, and a quasi-steady flow assump-tion may not apply. AV graft flows are abnormal inthis respect, in that the elevated mean flow rate givesrise to a reduced pulsatility index. The results understeady flow conditions are therefore useful for severalreasons. First, a low pulsatility index implies thatthe unsteadiness is of reduced importance. Second,steady flow provides insight into the causes of spe-cific flow features, which may also exist in pulsatileflow, and allows them to be specifically identifiedas geometric phenomena rather than unsteady phe-nomena. Third, numerical solutions of the Navier-Stokes equations require experimental measurementsfor code validation. Such measurements are particu-larly needed for transitional flows, where numericaltechniques are still unproven. The present resultsprovide data for code validation of the 3-D steadyflow solution inside a mathematically defined, butclinically realistic vascular graft geometry. This is anecessary step on the way to a pulsatile solution.
The secondary flow patterns found in the proxi-mal vein segment (the outflow) are at first sight sur-prising, in that the predominant flows toward the
floor are close to the lateral walls. To aid terminol-ogy, it helps to consider the graft as though the planeof the bifurcation is vertical and the floor is hori-zontal and at the bottom, while emphasizing thatany such convention is purely arbitrary. Based onthis convention, since the downward-directed streamfrom the graft must turn to align with the horizon-tal vein axis, the opposite pattern of secondary flowwould be expected; the stream curvature would thensuggest that the predominant downward stream inthe PVS be on the anastomosis plane of symme-try, with compensating upward flows on the lateralwalls. In fact, the whole secondary flow pattern isdictated by that setup when the inlet flow from thegraft impinges on the anastomosis hood and is de-flected downward. This stream curvature causes lat-eral downward flows, which persist when the samestream meets that which has arrived from the DVS.This latter stream is laminar at all flow-rates investi-gated, and therefore predominantly has momentumnear the vein axis. This profile further aids the sec-ondary flow pattern noted already, of upward flow inthe bifurcation plane in the PVS, because the streamfrom the graft is able to deflect the lateral fluid morereadily than that on the vein axis. A third contribut-ing factor to this overall picture is the relatively flatprofile of the inlet graft flow at all but the lowestReynolds number; this flow has much lateral momen-tum already, which is deflected by the hood to formstrong downward-directed lateral streams. On theother hand, a flat profile with boundary layers forms
86
ARSLAN
a weaker Dean vortex flow than does a parabolic one,all other things being equal, and so flatness at theinlet from the graft has both contributory and oppos-ing effects. Once the 2 streams merge in the PVS,the flow is undeveloped and consequently has a re-duced contributing factor to the observed pattern ofupward flow in the bifurcation plane. The PVS sec-ondary flow pattern is qualitatively similar at all 3Reynolds numbers examined, but is strongest at theintermediate Re = 1800. Reduced secondary flowtends to form the classical Dean secondary flow pat-tern; this counts as yet a fourth.
The distribution of turbulence inside a venousanastomosis was simulated using an upscaled in vitromodel under steady flow conditions. The highest tur-bulent intensities and Reynolds stresses were foundat the toe side of the PVS. This coincides with pre-viously reported locations of stenosis formation in
AV grafts, which implicates turbulence as a poten-tial cause of AV graft failure. Future studies usingpulsatile flow and realistic AV graft models will beconducted to further characterize the importance ofturbulence. An understanding of the relationship be-tween graft failure and turbulence levels may lead tograft design criteria to maximize AV graft patencyrates.
Acknowledgments
The author acknowledges the Mechanical Engineer-ing Department of the University of Illinois atChicago for the use of their Laser Doppler anemome-ter system for experimental measurements and valu-able discussions with their staff regarding the flowphenomena.
References
Arslan, N., “Experimental Characterization ofTransitional Unsteady Flow inside a Graft-to-VeinJunction”, Ph.D. thesis, The University of Illinoisat Chicago, 1999.
Davies, P.F., Polacek, D.C., Handen, J.S., Helmke,B.P. and DePaola, N., “A Spatial Approach to Tran-scriptional Profiling: Mechanotransduction and theFocal Origin of Atherosclerosis”, Trends Biotech-nol., 17, 347-51, 1999.
Fillinger, M.F., Kerns, D.B. and Schwartz, R.A.,”Hemodynamics and Intimal Hyperplasia”, Chap-ter 2 of Vascular Access for Hemodialysis-II, W.L.Gore & Associates, Inc., and Precept Press, Inc.,(B.G. Sommer and M.L. Henry, Eds.), 21-51, 1991.
Fillinger, M.F., Reinitz, E.R., Schwartz, R.A.., Re-setarits, D.E., Paskanik, A.M. and Bredenberg,C.E., “Beneficial Effects of Banding on VenousIntimal-Medial Hyperplasia in Arteriovenous LoopGrafts,” The American Journal of Surgery, 158, 87-94, 1989.
Fillinger, M.F., Reinitz, E.R., Schwartz, R.A., Rese-tarits, D.E., Paskanik, A.M., Bruch D. and Breden-berg, C.E., “Graft Geometry and Venous Intimal-Medial Hyperplasia in Arteriovenous Loop Grafts”,Journal of Vascular Surgery, 11, 556-566, 1991.
Frangos, S.G., Gahtan, V. and Sumpio B., “Local-ization of Atherosclerosis: Role of Hemodynamics”,Arch. Surg., 134, 1142-9, 1990.
Hu, Y. and Xu, Q., “New Mouse Model of Vein By-pass Graft Atherosclerosis”, Heart, Lung and Circu-lation, 11, 182-88, 2002.
Kanterman, R.Y., Vesley, T.M., Pilgram, T.K.,Guy, B.W., Windus, D.W. and Picus, D., ”DialysisAccess Grafts: Anotomic Location of Venous Steno-sis and Results of Angioplasty”, Radiology, 195, 135-139, 1995.
Loth, F., Jones, S.A., Giddens, D.P., Bassiouny,H.S., Glagov, S. and Zarins, C.K., “Measurementsof Velocity and Wall Shear stress inside a PTFE Vas-cular Graft Model under Steady Flow Conditions”Journal of Biomechanical Engineering, 119, 187-194,1997.
Shu, M.C. and Hwang, N.H.C., “Haemodynamicsof Angioaccess Venous Anastomoses”, Journal ofBiomedical Engineering, 13, 103-112, 1991.
Zou, Y., Hu, Y., Metzler, B. and Xu Q., “SignalTransduction in Arteriosclerosis: Mechanical StressActivated MAP Kinases in Vascular Smooth MuscleCells”, Int. J. Mol. Med., 1, 827-34, 1998.
87
Recommended


![monotonous [muh- not -n-uhs] ( adj .)](https://img.pdfslide.us/doc/110x75/56815754550346895dc4fb9e/monotonous-muh-not-n-uhs-adj-.jpg)