1 Estimation of Feng-Shui on Housing Prices
INTERNATIONAL REAL ESTATE REVIEW
2011 Vol. XX No. XX: pp. XX – XX
An Estimation of the Impact of Feng-Shui on
Housing Prices in Taiwan: A Quantile
Regression Application
Chu-Chia Lin Professor, Department of Economics, National Chengchi University, Taipei, Taiwan, Phone: +886 2 29387462, Email: [email protected].
Chien-Liang Chen Professor, Department of Economics, National Chi-Nan University, Nan-Tou County, Taiwan
Ya-Chien Twu M.A., Department of Economics, National Chengchi University, Taipei, Taiwan.
Feng-shui is an old and traditional body of knowledge in Chinese society. Feng-shui has a significant influence on many aspects in daily life for most Chinese, including choosing locations for dwelling units, offices, burial sites, and so on. However, there have been few studies on the impact of feng-shui on housing prices. By applying a housing hedonic equation and a data set of 77,624 observations in Taiwan, we have attempted to estimate the impact of feng-shui on housing prices. We find that all six types of bad feng-shui have a significantly negative impact on housing prices. Moreover, by applying a quantile regression, we find that most of the bad feng-shui has a stronger negative impact on expensive dwelling units. Our findings confirm that people who buy expensive housing units care about feng-shui more than those who buy less expensive housing units. .
Keywords:
Feng-shui; Hedonic Equation; Quantile Regression
Lin, Chen and Twu 2
1. Introduction
Feng-shui is a general term that depicts certain conditions of a local area,
including weather, geology, landscaping, environment, and even sometimes,
taboos in buildings.1 Although some Chinese people feel that feng-shui is a
mysterious phenomenon, with improvements in technology and social
progress, there are still lots of Chinese people who believe that feng-shui
continues to be an important factor that affects their daily behavior, such as
buying a house, choosing a burial site, and so on. Lu (1999) discusses the
reasons why some Chinese people believe that feng-shui is a mysterious
phenomenon. Since there are so many sub-streams (namely, feng-shui
occultism) and each sub-stream has its own way of explaining this
phenomenon, it is difficult for ordinary people to understand what is true and
what is not. Therefore, people are inclined to believe that feng-shui is simply
a way that a feng-shui master deceives the public.
Yet, in a modern society like Taiwan, why are there still so many of people
who believe in feng-shui? Confucius once said: “As time goes by in a year,
everything grows up.” In ancient Chinese agrarian society, farmers followed
the seasons to tend to their crops and reap their harvest. Tung (179-104
B.C.) in the Han dynasty also said: “The environment and people should get
around as one group.” This means that humans should work with the
environment. In other words, feng-shui originates from the daily life of
people. For example, people who want easier access to water should live
near a river and those who want to avoid strong winds should live near the
mountains. In modern society, individuals are so busy that they often face
immense stress and are easily frustrated and alienated. Therefore, they are
inclined to seek help from feng-shui so that they could find something to
save their souls and help them avoid bad luck, or even become rich and
famous. As an architect, Han (2006) finds that feng-shui is very popular.
When he designs a house, he asks the owner which direction the building
should face with respect to feng-shui.
There is some literature that discusses the impact of feng-shui on people’s
daily lives and especially on housing demand. Lu (2000) finds that even the
prime minister of the UK invited a feng-shui master to apply feng-shui
techniques for him when he was constructing his new office. Bourassa and
Peng (1999) apply a data set taken from a Chinese community in New
Zealand and find that home addresses with different numbers could have
significant impacts on housing prices.2 Moreover, Tam, Tso, and Lam (1999)
use the definition of facing a river and the back leaning on a mountain as an
1 For a detailed discussion of the definition of feng-shui, one may refer to Hu (1999). 2 For example, four is a bad number for Chinese people because the pronunciation of
“four” is similar to “death” in Mandarin, so people do not like to have “four” in their
home address.
3 Estimation of Feng-Shui on Housing Prices
index for feng-shui and find that feng-shui has a significant impact on the
housing prices in their data set from Hong Kong.
In the Taiwanese housing market, Lin (2007) finds that bad feng-shui may
reduce the housing price by 10% on average. Bai et al. (2004) discuss the
types of bad feng-shui that homebuyers care about the most, including
lu-chun, double-layer road, and dead-end road, etc.3 In the application of a
data set from Taichung city, Chen (2004) confirms that lu-chun has a
significant impact on housing price. Huang et al. (2005) find that with bad
feng-shui, a home seller may reduce the asking price by 6% to 8%. Chuang
and Hwa (2008) find that the impact of feng-shui on home buying decisions
is dependent on the age of the buyer, but independent from gender, education,
and religion.
Moreover, some undesirable facilities are also taken as bad feng-shui in
Taiwan. Lee and Ho (1996) have conducted a survey in Taipei to study
attitudes toward some of the undesirable facilities, such as funeral parlors,
crematories, and cemeteries. Chen (2002), Yang (2003), and Liao (2005) all
discuss how Chinese people try to avoid living near death-related facilities.
They all agree that it is bad feng-shui for a dwelling unit to be in close
proximity to funeral parlors, crematories, and cemeteries.
Since it is clear that Chinese people care very much about feng-shui when
they buy or build a new dwelling unit, it is interesting to determine the
impact of feng-shui on the price of a dwelling unit. Moreover, Chu (1999)
finds that the richer and more famous care about feng-shui more than their
less well off peers. So, we would also like to see if the impact is different for
dwelling units with different prices. In this study, we apply a large data set
with 77,624 dwelling units in Taiwan to estimate the actual impact of
feng-shui on housing prices. In order to investigate the magnitude of the
impact for different housing units with different prices, we also employ a
quantile regression model to estimate our data set.
The paper is constructed as follows: Section 1 is the introduction and
literature review. In Section 2, we introduce the hedonic equation and the
quantile regression model. The definitions of variables and basic statistics of
the data set applied in this study are shown in Section 3. The empirical
results are discussed in Section 4. We conclude this study in Section 5.
3 Lu-chun means that a dwelling unit is facing the road in a direct way. For
example, a dwelling unit located at the end of dead-end road and directly facing the
road so that people in the house could see the entire street.
Lin, Chen and Twu 4
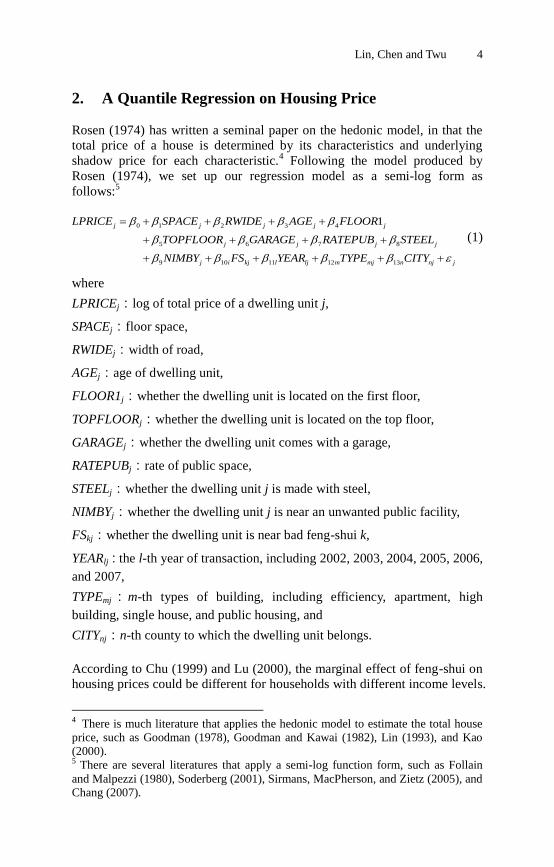
2. A Quantile Regression on Housing Price
Rosen (1974) has written a seminal paper on the hedonic model, in that the
total price of a house is determined by its characteristics and underlying
shadow price for each characteristic.4 Following the model produced by
Rosen (1974), we set up our regression model as a semi-log form as
follows:5
(1)
where
LPRICEj:log of total price of a dwelling unit j,
SPACEj:floor space,
RWIDEj:width of road,
AGEj:age of dwelling unit,
FLOOR1j:whether the dwelling unit is located on the first floor,
TOPFLOORj:whether the dwelling unit is located on the top floor,
GARAGEj:whether the dwelling unit comes with a garage,
RATEPUBj:rate of public space,
STEELj:whether the dwelling unit j is made with steel,
NIMBYj:whether the dwelling unit j is near an unwanted public facility,
FSkj:whether the dwelling unit is near bad feng-shui k,
YEARlj:the l-th year of transaction, including 2002, 2003, 2004, 2005, 2006,
and 2007,
TYPEmj:m-th types of building, including efficiency, apartment, high
building, single house, and public housing, and
CITYnj:n-th county to which the dwelling unit belongs.
According to Chu (1999) and Lu (2000), the marginal effect of feng-shui on
housing prices could be different for households with different income levels.
4 There is much literature that applies the hedonic model to estimate the total house
price, such as Goodman (1978), Goodman and Kawai (1982), Lin (1993), and Kao
(2000). 5 There are several literatures that apply a semi-log function form, such as Follain
and Malpezzi (1980), Soderberg (2001), Sirmans, MacPherson, and Zietz (2005), and
Chang (2007).
0 1 2 3 4
5 6 7 8
9 10 11 12 13
1j j j j j
j j j j
j i kj l lj m mj n nj j
LPRICE SPACE RWIDE AGE FLOOR
TOPFLOOR GARAGE RATEPUB STEEL
NIMBY FS YEAR TYPE CITY
5 Estimation of Feng-Shui on Housing Prices
This implies that the marginal effect of feng-shui on housing prices for
houses with different prices could be different, too, since affluent households
usually buy more expensive houses. In order to capture the different impacts
of feng-shui on housing prices, we apply a quantile regression here, since
ordinary least squares (OLS) can only show the mean effect of feng-shui on
housing price.
The quantile regression was first introduced by Koenker and Bassett (1978).
They applied the concept of least absolute deviation (LAD) and provided a
more robust estimation model. The object function is a sum of the weighted
absolute deviation. For instance, if we try to solve the solution under
quantile θ, then the share of the number of observations for data less than
and above θ will be θ and 1-θ. Then, the deviations have weights of 1-θ
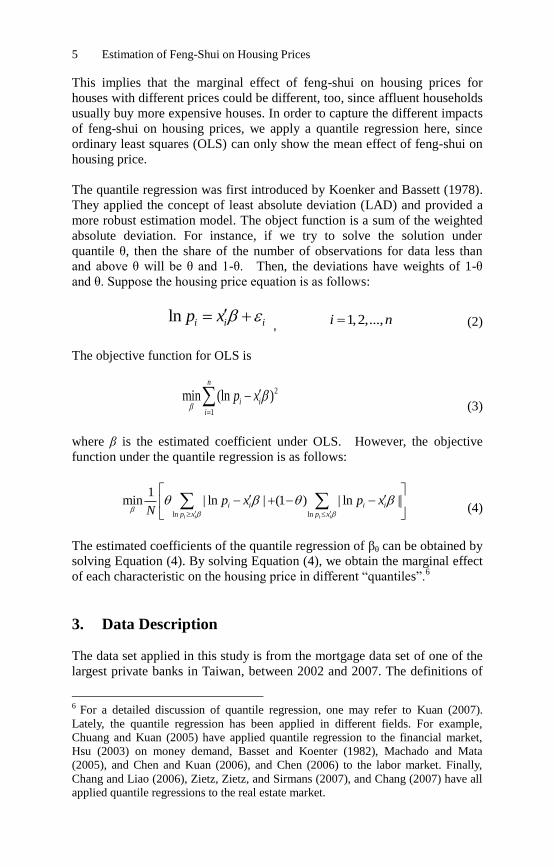
and θ. Suppose the housing price equation is as follows:
ln i i ip x , 1,2,...,i n (2)
The objective function for OLS is
2
1
min (ln )n
i i
i
p x
(3)
where β is the estimated coefficient under OLS. However, the objective
function under the quantile regression is as follows:
ln ln
1min | ln | (1 ) | ln |
i i i i
i i i i
p x p x
p x p xN
(4)
The estimated coefficients of the quantile regression of βθ can be obtained by
solving Equation (4). By solving Equation (4), we obtain the marginal effect
of each characteristic on the housing price in different “quantiles”.6
3. Data Description
The data set applied in this study is from the mortgage data set of one of the
largest private banks in Taiwan, between 2002 and 2007. The definitions of
6 For a detailed discussion of quantile regression, one may refer to Kuan (2007).
Lately, the quantile regression has been applied in different fields. For example,
Chuang and Kuan (2005) have applied quantile regression to the financial market,
Hsu (2003) on money demand, Basset and Koenter (1982), Machado and Mata
(2005), and Chen and Kuan (2006), and Chen (2006) to the labor market. Finally,
Chang and Liao (2006), Zietz, Zietz, and Sirmans (2007), and Chang (2007) have all
applied quantile regressions to the real estate market.
Lin, Chen and Twu 6
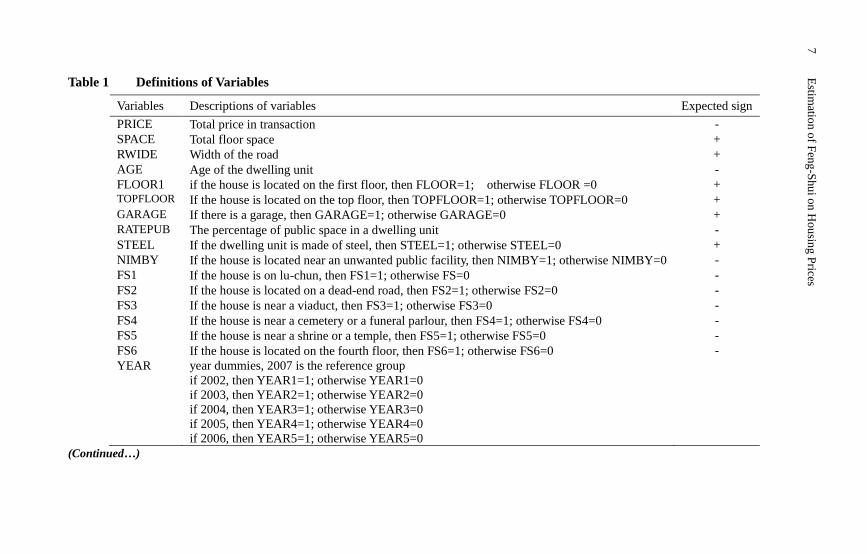
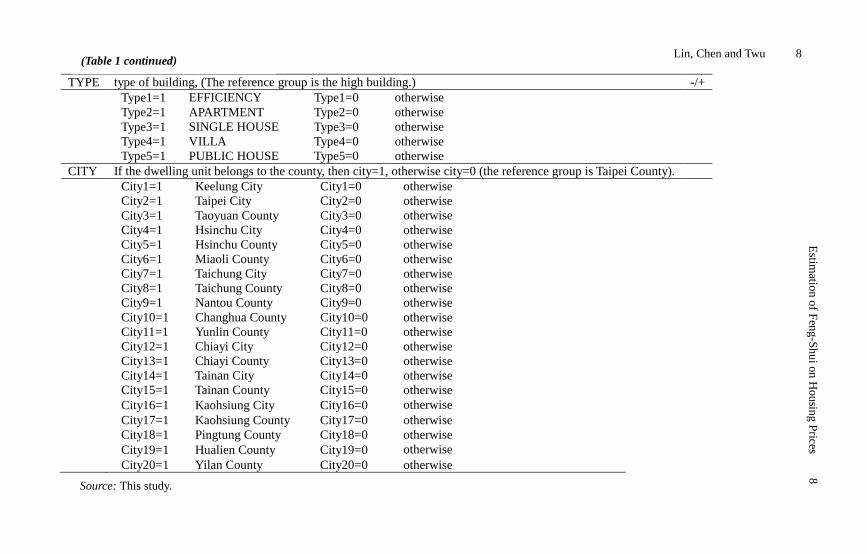
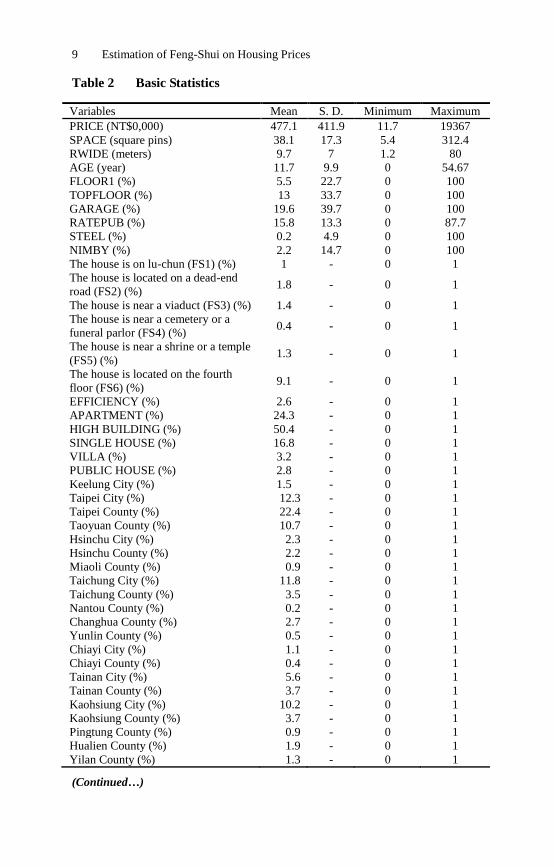
the variables are in Table 1 and the basic statistics are in Table 2. In total,
there are 76,264 observations in our data set. The data distributions among
years and counties are shown in Table 2. One important point that we have to
make here for the data set applied in this study is that most of the data are
from the five largest cities in Taiwan, including Taipei City, Taipei County,
Taichung City, Tainan City, and Kaoshiung City. Table 2 shows that 72.3%
of the data observations are from these five cities. Although the mortgage
appears to be heavily concentrated in the five major cities, our intuition is
that the lending policy for the bank from which applied data is typical for
most large private banks in Taiwan. Since the housing markets in the five
major cities are generally more prosperous than those of other rural areas in
Taiwan, large private banks are more interested in providing mortgages there.
Traditionally, people in rural areas who want to obtain a mortgage will
usually go to state-owned banks or some other small or private financial
institutions, such as credit unions and credit departments of agriculture
associations.7
In terms of some of the important basic statistics, one may see that the
average housing price is NT$4.77 million in Table 2. The average floor
space is 38.11 pins, which is a little larger than the average floor space of the
total housing units in Taiwan.8 The average width of the road where the
houses are located is 9.67 meters. The average age of the dwelling units is
11.74 years.9 The average amount of public space is 15.8%.
10 Moreover, the
percentage of housing units with garages is 19.6%, which is much lower
than that of the total housing units in Taiwan (51.3%). 11
7 Since we do not have the total distribution of the total housing mortgage in Taiwan,
we could not run a test to see if the regional distribution of data is similar to that of
the population. 8 One pin is equal to 36 square feet. According to Social Indicators, published by
Directorate General of Budget, Accounting and Statistics (DGBAS), Executive Yuan,
Taiwan, the average floor space in 2005 of the total housing units in Taiwan is 35.9
pins. 9 Again, according to Social Indicators, the average age of the total dwelling units is
17.5 years in 2005. It is common to see that the average age of the dwelling units in
the market is higher than that as a whole. 10 Since there is no data in the census, we have no idea about the average figure for
the total housing units in Taiwan. Traditionally, the amount of public space for a
single unit is zero, 10% for a five-floor apartment, and 30% for an apartment that is
in a high building. Since there are more and more high rises constructed in Taiwan,
the average of the total amount of public space should be quickly increasing. 11 Since most observations in our data set are from the five major cities and parking
space is much more expensive there, the average rate of having a garage is lower in
our data set.
7 Estimation of Feng-Shui on Housing Prices
Table 1 Definitions of Variables
Variables Descriptions of variables Expected sign
PRICE Total price in transaction -
SPACE Total floor space +
RWIDE Width of the road +
AGE Age of the dwelling unit -
FLOOR1 if the house is located on the first floor, then FLOOR=1; otherwise FLOOR =0 + TOPFLOOR If the house is located on the top floor, then TOPFLOOR=1; otherwise TOPFLOOR=0 +
GARAGE If there is a garage, then GARAGE=1; otherwise GARAGE=0 +
RATEPUB The percentage of public space in a dwelling unit -
STEEL If the dwelling unit is made of steel, then STEEL=1; otherwise STEEL=0 +
NIMBY If the house is located near an unwanted public facility, then NIMBY=1; otherwise NIMBY=0 -
FS1 If the house is on lu-chun, then FS1=1; otherwise FS=0 -
FS2 If the house is located on a dead-end road, then FS2=1; otherwise FS2=0 -
FS3 If the house is near a viaduct, then FS3=1; otherwise FS3=0 -
FS4 If the house is near a cemetery or a funeral parlour, then FS4=1; otherwise FS4=0 -
FS5 If the house is near a shrine or a temple, then FS5=1; otherwise FS5=0 -
FS6 If the house is located on the fourth floor, then FS6=1; otherwise FS6=0 -
YEAR year dummies, 2007 is the reference group
if 2002, then YEAR1=1; otherwise YEAR1=0
if 2003, then YEAR2=1; otherwise YEAR2=0
if 2004, then YEAR3=1; otherwise YEAR3=0
if 2005, then YEAR4=1; otherwise YEAR4=0
if 2006, then YEAR5=1; otherwise YEAR5=0
(Continued…)
7
E
stimatio
n o
f Fen
g-S
hu
i on H
ou
sing
Prices
Lin, Chen and Twu 8
TYPE type of building, (The reference group is the high building.) -/+
Type1=1 EFFICIENCY Type1=0 otherwise
Type2=1 APARTMENT Type2=0 otherwise
Type3=1 SINGLE HOUSE Type3=0 otherwise
Type4=1 VILLA Type4=0 otherwise
Type5=1 PUBLIC HOUSE Type5=0 otherwise
CITY If the dwelling unit belongs to the county, then city=1, otherwise city=0 (the reference group is Taipei County).
City1=1 Keelung City City1=0 otherwise
City2=1 Taipei City City2=0 otherwise
City3=1 Taoyuan County City3=0 otherwise
City4=1 Hsinchu City City4=0 otherwise
City5=1 Hsinchu County City5=0 otherwise
City6=1 Miaoli County City6=0 otherwise
City7=1 Taichung City City7=0 otherwise
City8=1 Taichung County City8=0 otherwise
City9=1 Nantou County City9=0 otherwise
City10=1 Changhua County City10=0 otherwise
City11=1 Yunlin County City11=0 otherwise
City12=1 Chiayi City City12=0 otherwise
City13=1 Chiayi County City13=0 otherwise
City14=1 Tainan City City14=0 otherwise
City15=1 Tainan County City15=0 otherwise
City16=1 Kaohsiung City City16=0 otherwise
City17=1 Kaohsiung County City17=0 otherwise
City18=1 Pingtung County City18=0 otherwise
City19=1 Hualien County City19=0 otherwise
City20=1 Yilan County City20=0 otherwise
(Table 1 continued)
Source: This study.
Estim
ation
of F
eng
-Sh
ui o
n H
ou
sing
Prices
8
9 Estimation of Feng-Shui on Housing Prices
Table 2 Basic Statistics
Variables Mean S. D. Minimum Maximum
PRICE (NT$0,000) 477.1 411.9 11.7 19367
SPACE (square pins) 38.1 17.3 5.4 312.4
RWIDE (meters) 9.7 7 1.2 80
AGE (year) 11.7 9.9 0 54.67
FLOOR1 (%) 5.5 22.7 0 100
TOPFLOOR (%) 13 33.7 0 100
GARAGE (%) 19.6 39.7 0 100
RATEPUB (%) 15.8 13.3 0 87.7
STEEL (%) 0.2 4.9 0 100
NIMBY (%) 2.2 14.7 0 100
The house is on lu-chun (FS1) (%) 1 - 0 1
The house is located on a dead-end
road (FS2) (%) 1.8 - 0 1
The house is near a viaduct (FS3) (%) 1.4 - 0 1
The house is near a cemetery or a
funeral parlor (FS4) (%) 0.4 - 0 1
The house is near a shrine or a temple
(FS5) (%) 1.3 - 0 1
The house is located on the fourth
floor (FS6) (%) 9.1 - 0 1
EFFICIENCY (%) 2.6 - 0 1
APARTMENT (%) 24.3 - 0 1
HIGH BUILDING (%) 50.4 - 0 1
SINGLE HOUSE (%) 16.8 - 0 1
VILLA (%) 3.2 - 0 1
PUBLIC HOUSE (%) 2.8 - 0 1
Keelung City (%) 1.5 - 0 1
Taipei City (%) 12.3 - 0 1
Taipei County (%) 22.4 - 0 1
Taoyuan County (%) 10.7 - 0 1
Hsinchu City (%) 2.3 - 0 1
Hsinchu County (%) 2.2 - 0 1
Miaoli County (%) 0.9 - 0 1
Taichung City (%) 11.8 - 0 1
Taichung County (%) 3.5 - 0 1
Nantou County (%) 0.2 - 0 1
Changhua County (%) 2.7 - 0 1
Yunlin County (%) 0.5 - 0 1
Chiayi City (%) 1.1 - 0 1
Chiayi County (%) 0.4 - 0 1
Tainan City (%) 5.6 - 0 1
Tainan County (%) 3.7 - 0 1
Kaohsiung City (%) 10.2 - 0 1
Kaohsiung County (%) 3.7 - 0 1
Pingtung County (%) 0.9 - 0 1
Hualien County (%) 1.9 - 0 1
Yilan County (%) 1.3 - 0 1
(Continued…)
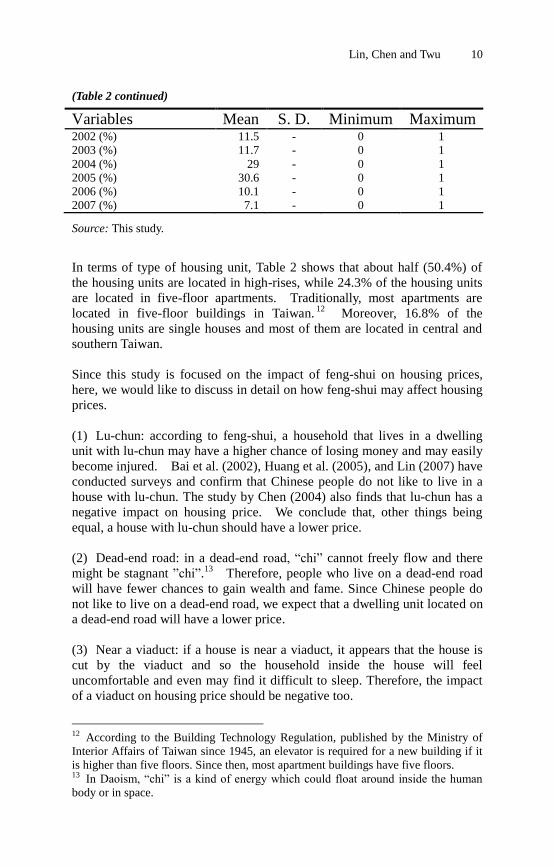
Lin, Chen and Twu 10
(Table 2 continued)
Variables Mean S. D. Minimum Maximum 2002 (%) 11.5 - 0 1
2003 (%) 11.7 - 0 1
2004 (%) 29 - 0 1
2005 (%) 30.6 - 0 1
2006 (%) 10.1 - 0 1
2007 (%) 7.1 - 0 1
Source: This study.
In terms of type of housing unit, Table 2 shows that about half (50.4%) of
the housing units are located in high-rises, while 24.3% of the housing units
are located in five-floor apartments. Traditionally, most apartments are
located in five-floor buildings in Taiwan.12
Moreover, 16.8% of the
housing units are single houses and most of them are located in central and
southern Taiwan.
Since this study is focused on the impact of feng-shui on housing prices,
here, we would like to discuss in detail on how feng-shui may affect housing
prices.
(1) Lu-chun: according to feng-shui, a household that lives in a dwelling
unit with lu-chun may have a higher chance of losing money and may easily
become injured. Bai et al. (2002), Huang et al. (2005), and Lin (2007) have
conducted surveys and confirm that Chinese people do not like to live in a
house with lu-chun. The study by Chen (2004) also finds that lu-chun has a
negative impact on housing price. We conclude that, other things being
equal, a house with lu-chun should have a lower price.
(2) Dead-end road: in a dead-end road, “chi” cannot freely flow and there
might be stagnant ”chi”.13
Therefore, people who live on a dead-end road
will have fewer chances to gain wealth and fame. Since Chinese people do
not like to live on a dead-end road, we expect that a dwelling unit located on
a dead-end road will have a lower price.
(3) Near a viaduct: if a house is near a viaduct, it appears that the house is
cut by the viaduct and so the household inside the house will feel
uncomfortable and even may find it difficult to sleep. Therefore, the impact
of a viaduct on housing price should be negative too.
12 According to the Building Technology Regulation, published by the Ministry of
Interior Affairs of Taiwan since 1945, an elevator is required for a new building if it
is higher than five floors. Since then, most apartment buildings have five floors. 13 In Daoism, “chi” is a kind of energy which could float around inside the human
body or in space.
11 Estimation of Feng-Shui on Housing Prices
(4) Near a cemetery or funeral parlor: if a house is near a cemetery or a
funeral parlor, it may easy to gather yin-chi.14
Since most Chinese people do
not like yin-chi, we expect that cemeteries and funeral parlors should have a
negative impact on housing price.
(5) Near a temple or shrine: if a dwelling unit is near a temple or shrine, it
may have to endure more noise pollution and also more air pollution too.15
Therefore, the housing price near a temple or a shrine should be lower.
(6) Located on the fourth floor: since the pronunciation of “four” is similar
to “death” in Mandarin, traditionally, “four” is a bad luck number.
Therefore, we expect that the price of a dwelling unit located on the fourth
floor should be lower than a dwelling unit located on other floors.
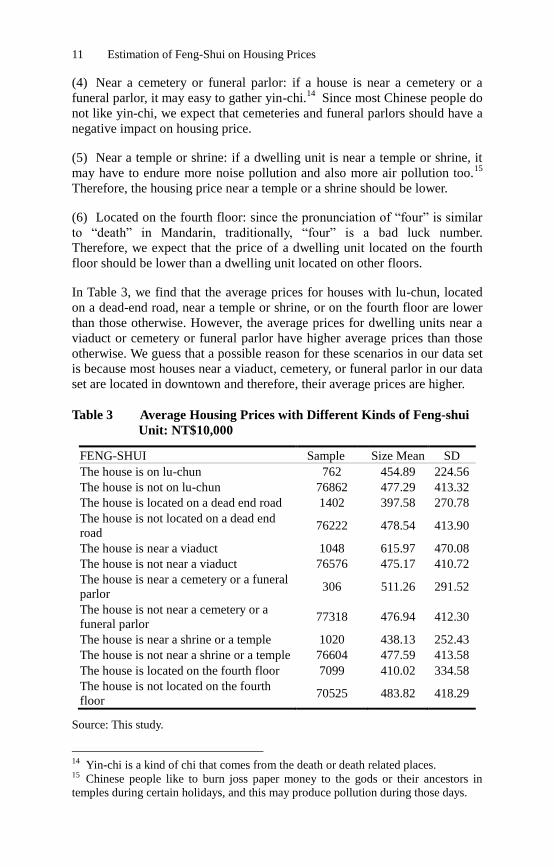
In Table 3, we find that the average prices for houses with lu-chun, located
on a dead-end road, near a temple or shrine, or on the fourth floor are lower
than those otherwise. However, the average prices for dwelling units near a
viaduct or cemetery or funeral parlor have higher average prices than those
otherwise. We guess that a possible reason for these scenarios in our data set
is because most houses near a viaduct, cemetery, or funeral parlor in our data
set are located in downtown and therefore, their average prices are higher.
Table 3 Average Housing Prices with Different Kinds of Feng-shui
Unit: NT$10,000
FENG-SHUI Sample Size Mean SD
The house is on lu-chun 762 454.89 224.56
The house is not on lu-chun 76862 477.29 413.32
The house is located on a dead end road 1402 397.58 270.78
The house is not located on a dead end
road 76222 478.54 413.90
The house is near a viaduct 1048 615.97 470.08
The house is not near a viaduct 76576 475.17 410.72
The house is near a cemetery or a funeral
parlor 306 511.26 291.52
The house is not near a cemetery or a
funeral parlor 77318 476.94 412.30
The house is near a shrine or a temple 1020 438.13 252.43
The house is not near a shrine or a temple 76604 477.59 413.58
The house is located on the fourth floor 7099 410.02 334.58
The house is not located on the fourth
floor 70525 483.82 418.29
Source: This study.
14 Yin-chi is a kind of chi that comes from the death or death related places. 15 Chinese people like to burn joss paper money to the gods or their ancestors in
temples during certain holidays, and this may produce pollution during those days.
Lin, Chen and Twu 12
4. The Estimation of the Impact of Feng-shui on Housing
Price
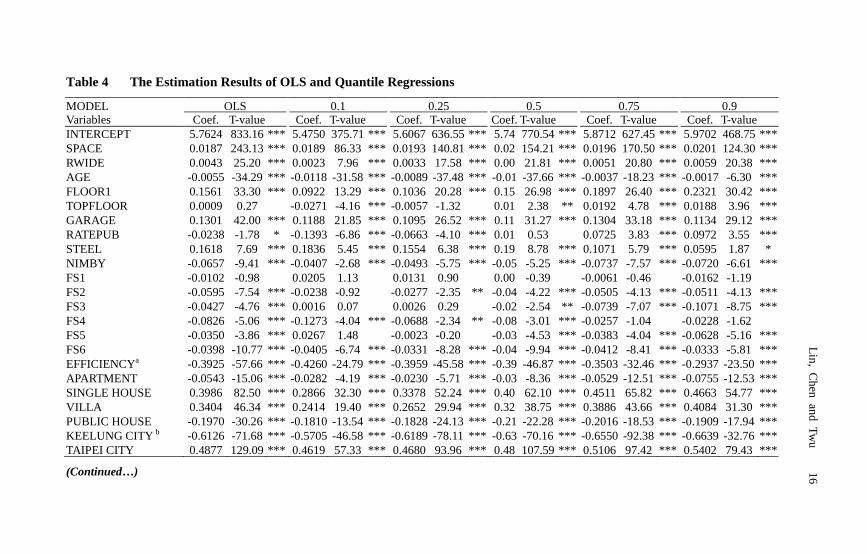
By applying our data set in Equation (1), the estimated results for both the
OLS and quantile regressions are shown in Table 4.16
The adjusted
R-squares in OLS is 0.777, while the pseudo R-squares at different quantiles
are between 0.492 and 0.587. Moreover, most estimated coefficients are
significant under the 95% significance level. Overall speaking, the
estimated results are satisfactory.
FLOOR (0.0187), RWIDE (0.0043), GARAGE (0.1301), FLOOR1 (0.1561),
TOPFLOOR (0.0009), and STEEL (0.1618) all have significantly positive
coefficients both in OLS and all quantiles as expected. On the other hand,
AGE (-0.0055), RATEPUB (-0.0238), and NIMBY (-0.0657) all have
significantly negative coefficients both in OLS and all quantiles, which are
again consistent with our expectations.
Moreover, it will be interesting to see the changes of the estimated
coefficients for some major variables in different quantiles. For floor space,
we can see that the coefficient of floor space increases from 0.0189 in the
0.1 quantile to 0.0201 in the 0.9 quantile. This result shows that
high-income individuals would like to pay more for larger housing units.17
The coefficient of road width (RWIDE) also increases from 0.0023 in the 0.1
quantile to 0.0059 in the 0.9 quantile. The result shows that the
willingness-to-pay for a wider road increases as the homeowner income
increases.18
The coefficient of AGE decreases from -0.0118 for the 0.1
quantile to -0.0017 for the 0.9 quantile. There are two reasons: first, the
depreciation rate for housing units is higher for expensive houses. Secondly,
the affluent may pay a higher unit price for newer houses.
The variable of public space shows a negative coefficient (-0.0238) which
means that on average, Taiwanese people prefer a house with less public
space. However, when we run the quantile regressions, we see quite a
different impact that public space has on housing units with different prices.
In Table 4, we see that for cheaper houses (quantile 0.1), the coefficient of
public space is negative (-0.1393) and then the coefficient gradually
becomes positive. In fact, the coefficient of public space becomes 0.0972
with the most expensive houses (0.9 quantile).
16 The estimations for the 5 quantiles are shown in Table 4, including the 0.1, 0.25,
0.5, 0.75, and 0.9 quantiles. 17 In the recent housing market in Taiwan, one can see that there are more and more
large housing units sold with higher unit prices. For luxury housing units, the
developers intend to build houses with better materials and better design and so on,
which also contribute to a higher unit price. 18 For most cities in Taiwan, a wider road usually means that it is located in
downtown or a new town which implies that it is a more expensive area.
13 Estimation of Feng-Shui on Housing Prices
Table 4 The Estimation Results of OLS and Quantile Regressions
MODEL OLS 0.1 0.25 0.5 0.75 0.9 Variables Coef. T-value Coef. T-value Coef. T-value Coef. T-value Coef. T-value Coef. T-value
INTERCEPT 5.7624 833.16 *** 5.4750 375.71 *** 5.6067 636.55 *** 5.74 770.54 *** 5.8712 627.45 *** 5.9702 468.75 ***
SPACE 0.0187 243.13 *** 0.0189 86.33 *** 0.0193 140.81 *** 0.02 154.21 *** 0.0196 170.50 *** 0.0201 124.30 ***
RWIDE 0.0043 25.20 *** 0.0023 7.96 *** 0.0033 17.58 *** 0.00 21.81 *** 0.0051 20.80 *** 0.0059 20.38 ***
AGE -0.0055 -34.29 *** -0.0118 -31.58 *** -0.0089 -37.48 *** -0.01 -37.66 *** -0.0037 -18.23 *** -0.0017 -6.30 ***
FLOOR1 0.1561 33.30 *** 0.0922 13.29 *** 0.1036 20.28 *** 0.15 26.98 *** 0.1897 26.40 *** 0.2321 30.42 ***
TOPFLOOR 0.0009 0.27 -0.0271 -4.16 *** -0.0057 -1.32 0.01 2.38 ** 0.0192 4.78 *** 0.0188 3.96 ***
GARAGE 0.1301 42.00 *** 0.1188 21.85 *** 0.1095 26.52 *** 0.11 31.27 *** 0.1304 33.18 *** 0.1134 29.12 ***
RATEPUB -0.0238 -1.78 * -0.1393 -6.86 *** -0.0663 -4.10 *** 0.01 0.53 0.0725 3.83 *** 0.0972 3.55 ***
STEEL 0.1618 7.69 *** 0.1836 5.45 *** 0.1554 6.38 *** 0.19 8.78 *** 0.1071 5.79 *** 0.0595 1.87 *
NIMBY -0.0657 -9.41 *** -0.0407 -2.68 *** -0.0493 -5.75 *** -0.05 -5.25 *** -0.0737 -7.57 *** -0.0720 -6.61 ***
FS1 -0.0102 -0.98 0.0205 1.13 0.0131 0.90 0.00 -0.39 -0.0061 -0.46 -0.0162 -1.19
FS2 -0.0595 -7.54 *** -0.0238 -0.92 -0.0277 -2.35 ** -0.04 -4.22 *** -0.0505 -4.13 *** -0.0511 -4.13 ***
FS3 -0.0427 -4.76 *** 0.0016 0.07 0.0026 0.29 -0.02 -2.54 ** -0.0739 -7.07 *** -0.1071 -8.75 ***
FS4 -0.0826 -5.06 *** -0.1273 -4.04 *** -0.0688 -2.34 ** -0.08 -3.01 *** -0.0257 -1.04 -0.0228 -1.62
FS5 -0.0350 -3.86 *** 0.0267 1.48 -0.0023 -0.20 -0.03 -4.53 *** -0.0383 -4.04 *** -0.0628 -5.16 ***
FS6 -0.0398 -10.77 *** -0.0405 -6.74 *** -0.0331 -8.28 *** -0.04 -9.94 *** -0.0412 -8.41 *** -0.0333 -5.81 ***
EFFICIENCYa -0.3925 -57.66 *** -0.4260 -24.79 *** -0.3959 -45.58 *** -0.39 -46.87 *** -0.3503 -32.46 *** -0.2937 -23.50 ***
APARTMENT -0.0543 -15.06 *** -0.0282 -4.19 *** -0.0230 -5.71 *** -0.03 -8.36 *** -0.0529 -12.51 *** -0.0755 -12.53 ***
SINGLE HOUSE 0.3986 82.50 *** 0.2866 32.30 *** 0.3378 52.24 *** 0.40 62.10 *** 0.4511 65.82 *** 0.4663 54.77 ***
VILLA 0.3404 46.34 *** 0.2414 19.40 *** 0.2652 29.94 *** 0.32 38.75 *** 0.3886 43.66 *** 0.4084 31.30 ***
PUBLIC HOUSE -0.1970 -30.26 *** -0.1810 -13.54 *** -0.1828 -24.13 *** -0.21 -22.28 *** -0.2016 -18.53 *** -0.1909 -17.94 ***
KEELUNG CITY b -0.6126 -71.68 *** -0.5705 -46.58 *** -0.6189 -78.11 *** -0.63 -70.16 *** -0.6550 -92.38 *** -0.6639 -32.76 ***
TAIPEI CITY 0.4877 129.09 *** 0.4619 57.33 *** 0.4680 93.96 *** 0.48 107.59 *** 0.5106 97.42 *** 0.5402 79.43 ***
(Continued…)
Lin
, C
hen
an
d
Tw
u
16
Lin, Chen and Twu 14
(Table 4 continued)
MODEL OLS 0.1 0.25 0.5 0.75 0.9
Variables Coef. T-value Coef. T-value Coef. T-value Coef. T-value Coef. T-value Coef. T-value
TAOYUAN COUNTY -0.5112 -127.85 *** -0.4320 -68.19 *** -0.4785 -103.54 *** -0.51 -114.24 *** -0.5349 -100.03 *** -0.5399 -88.31 ***
HSINCHU CITY -0.4039 -55.21 *** -0.4016 -22.86 *** -0.3732 -34.93 *** -0.40 -59.16 *** -0.4290 -47.82 *** -0.4332 -32.07 ***
HSINCHU COUNTY -0.5450 -73.37 *** -0.4703 -33.86 *** -0.5108 -62.34 *** -0.55 -63.84 *** -0.5736 -74.42 *** -0.5829 -70.22 ***
MIAOLI COUNTY -0.7407 -65.70 *** -0.6499 -23.36 *** -0.6850 -50.55 *** -0.74 -59.54 *** -0.7964 -52.15 *** -0.7947 -36.94 ***
TAICHUNG CITY -0.5646 -140.15 *** -0.4763 -78.70 *** -0.5229 -116.14 *** -0.57 -141.74 *** -0.6144 -132.58 *** -0.6506 -108.78 ***
TAICHUNG COUNTY -0.7118 -115.35 *** -0.6068 -57.15 *** -0.6619 -98.74 *** -0.73 -106.95 *** -0.7634 -114.68 *** -0.7860 -79.44 ***
NANTOU COUNTY -0.7748 -36.77 *** -0.7111 -22.94 *** -0.7297 -18.03 *** -0.76 -45.97 *** -0.8139 -27.59 *** -0.8267 -23.73 ***
CHANGHUA COUNTY -0.8081 -117.97 *** -0.7121 -65.14 *** -0.7661 -84.53 *** -0.81 -127.17 *** -0.8602 -84.88 *** -0.8662 -81.44 ***
YUNLIN COUNTY -1.0238 -71.56 *** -0.9969 -25.39 *** -1.0236 -48.95 *** -1.01 -55.22 *** -1.0233 -68.88 *** -1.0431 -38.10 ***
CHIAYI CITY -0.8110 -79.88 *** -0.7580 -52.03 *** -0.7603 -66.80 *** -0.81 -120.51 *** -0.8708 -100.07 *** -0.8891 -55.73 ***
CHIAYI COUNTY -1.0783 -66.20 *** -1.0243 -25.12 *** -1.0407 -44.62 *** -1.07 -48.19 *** -1.0756 -40.60 *** -1.1197 -53.84 ***
TAINAN CITY -0.7518 -144.86 *** -0.6692 -68.96 *** -0.7069 -119.61 *** -0.75 -138.45 *** -0.7977 -112.68 *** -0.8083 -80.65 ***
TAINAN COUNTY -0.8943 -148.52 *** -0.7977 -60.14 *** -0.8422 -118.06 *** -0.89 -159.04 *** -0.9439 -132.51 *** -0.9716 -118.26 ***
KAOHSIUNG CITY -0.5581 -129.66 *** -0.5568 -73.17 *** -0.5814 -104.70 *** -0.59 -102.37 *** -0.5194 -59.53 *** -0.4640 -53.39 ***
KAOHSIUNG COUNTY -0.7466 -122.36 *** -0.7356 -75.16 *** -0.7346 -79.91 *** -0.73 -131.24 *** -0.7697 -87.17 *** -0.7766 -69.40 ***
PINGTUNG COUNTY -0.9091 -78.81 *** -0.8330 -37.28 *** -0.8887 -100.59 *** -0.92 -62.11 *** -0.9718 -54.85 *** -0.9715 -54.81 ***
HUALIEN COUNTY -0.8106 -102.24 *** -0.7074 -59.79 *** -0.7511 -92.36 *** -0.81 -106.44 *** -0.8689 -107.82 *** -0.8972 -77.04 ***
YILAN COUNTY -0.6652 -71.13 *** -0.5840 -34.53 *** -0.6165 -49.22 *** -0.66 -60.07 *** -0.6969 -75.01 *** -0.7118 -67.43 ***
(Continued…)
17
E
stimatio
n o
f Fen
g-S
hu
i on H
ou
sing
Prices
15 Estimation of Feng-Shui on Housing Prices
(Table 4 continued)
MODEL OLS 0.1 0.25 0.5 0.75 0.9
Variables Coef. T-value Coef. T-value Coef. T-value Coef. T-value Coef. T-value Coef. T-value
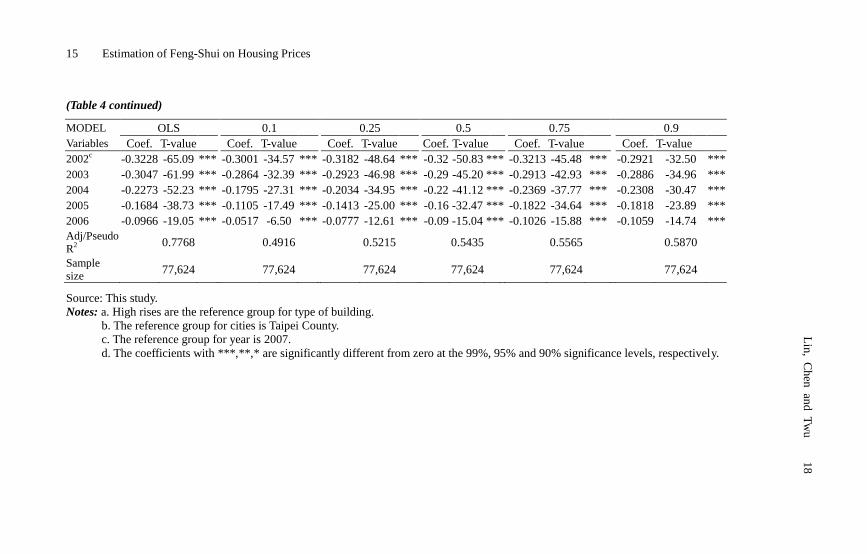
2002c -0.3228 -65.09 *** -0.3001 -34.57 *** -0.3182 -48.64 *** -0.32 -50.83 *** -0.3213 -45.48 *** -0.2921 -32.50 ***
2003 -0.3047 -61.99 *** -0.2864 -32.39 *** -0.2923 -46.98 *** -0.29 -45.20 *** -0.2913 -42.93 *** -0.2886 -34.96 ***
2004 -0.2273 -52.23 *** -0.1795 -27.31 *** -0.2034 -34.95 *** -0.22 -41.12 *** -0.2369 -37.77 *** -0.2308 -30.47 ***
2005 -0.1684 -38.73 *** -0.1105 -17.49 *** -0.1413 -25.00 *** -0.16 -32.47 *** -0.1822 -34.64 *** -0.1818 -23.89 ***
2006 -0.0966 -19.05 *** -0.0517 -6.50 *** -0.0777 -12.61 *** -0.09 -15.04 *** -0.1026 -15.88 *** -0.1059 -14.74 ***
Adj/Pseudo
R2
0.7768 0.4916 0.5215 0.5435 0.5565 0.5870
Sample
size 77,624 77,624 77,624 77,624 77,624 77,624
Source: This study.
Notes: a. High rises are the reference group for type of building.
b. The reference group for cities is Taipei County.
c. The reference group for year is 2007.
d. The coefficients with ***,**,* are significantly different from zero at the 99%, 95% and 90% significance levels, respectively.
Lin
, C
hen
an
d
Tw
u
18
Lin, Chen and Twu 16
The result shows that the poor may not like to pay much for public space.
On the other hand, the rich are willing to pay more for larger public space.
In other words, public space is a luxury good for people in Taiwan.
Finally, the impact of not in my backyard (NIMBY) on housing price is
similar to that of unwanted feng-shui in that the poor may care less about
NIMBY so that the negative impacts of NIMBY on cheaper housing units
are fewer. The estimated result shows that the negative coefficient for
NIMBY is -0.0407 for cheaper houses (0.1 quantile) and -0.0720 for
expensive ones (0.9 quantile).
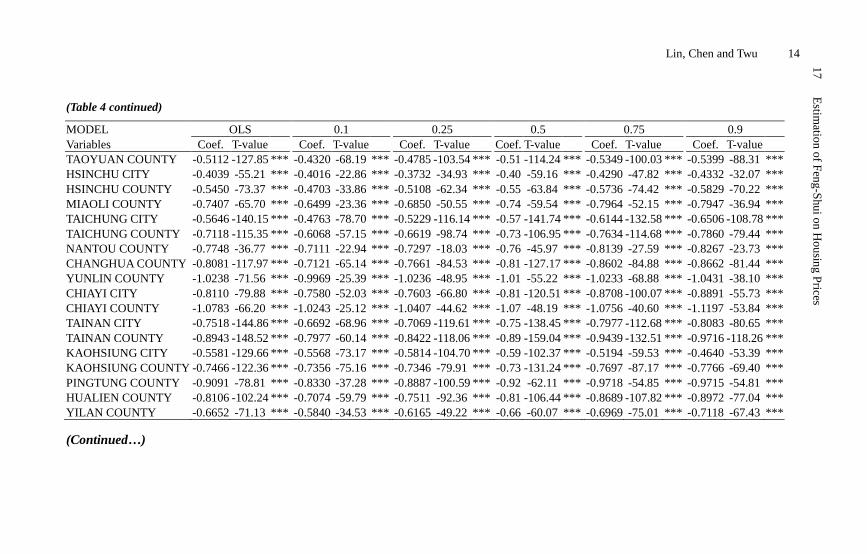
For those with unwanted feng-shui in this study, we find that FS2 (located on
a dead-end road), FS3 (near a viaduct), FS4 (near a cemetery), FS5 (near a
temple), and FS6 (located on the fourth floor) all have significantly negative
coefficients in the OLS regression results as we expected. While FS1
(lu-chun) also has a negative coefficient (-0.0102), it is not significantly
different from zero.
According to Chu (1999), the rich and famous may care about feng-shui
more than the others do. Since the rich and famous usually live in more
expensive dwelling units then the poor, this means that the negative impacts
of bad feng-shui on a dwelling unit with a higher price might be higher than
those for dwelling units with lower prices. In order to investigate the
potential different impacts, we apply a quantile regression to our data set and
the results are shown in Table 4.
In Table 4, one may see that the signs of most of the estimated coefficients
are similar to the results by OLS. However, the size of the estimated
coefficients is quite different for the different quantiles. In order to show
the different scales of the estimated coefficients at different quantiles, we
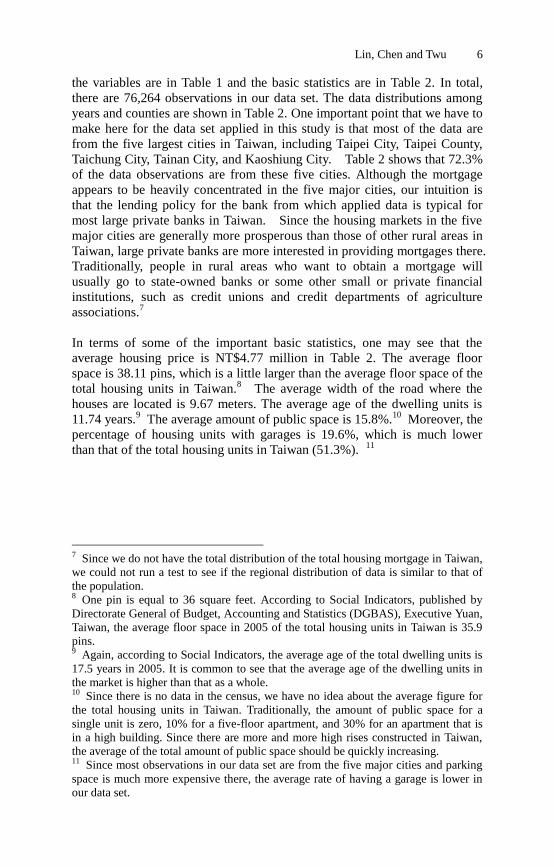
plot the estimate coefficients in different quantiles in Figure 1.19
In Figure 1, the solid and straight horizontal line is the estimated coefficient
under the OLS (i.e. 50% quantile). The solid line that goes up and down
represents the changes of the estimated coefficients at different quantiles.
The other two dotted lines are the 95% confidence intervals for the estimated
coefficients under the quantile regressions.
It is clear to see that in Figure 1(a) (lu-chun), 1(b) (dead-end road), 1(c)
(viaduct), and 1(d) (temple), the slope of the lines of the estimated
coefficients in the quantile regressions for the above four variables are all
negative. This means that the estimated coefficients are smaller as the
19 In order to smoothly plot the estimated coefficients in different quantiles, we
compute the coefficients in 100 points, instead of only five estimated points in the
five quantiles as shown in Table 4.
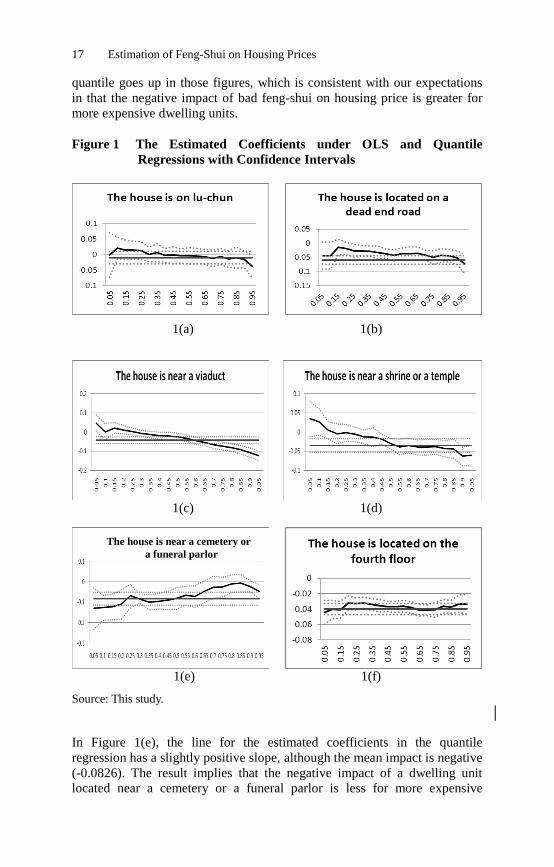
17 Estimation of Feng-Shui on Housing Prices
quantile goes up in those figures, which is consistent with our expectations
in that the negative impact of bad feng-shui on housing price is greater for
more expensive dwelling units.
Figure 1 The Estimated Coefficients under OLS and Quantile
Regressions with Confidence Intervals
1(a) 1(b)
1(c) 1(d)
1(e) 1(f)
Source: This study.
In Figure 1(e), the line for the estimated coefficients in the quantile
regression has a slightly positive slope, although the mean impact is negative
(-0.0826). The result implies that the negative impact of a dwelling unit
located near a cemetery or a funeral parlor is less for more expensive
The house is near a cemetery or
a funeral parlor
Lin, Chen and Twu 18
housing units. This result is different from our expectations. One possible
reason is that while most funeral parlors in Taiwan are located downtown, a
dwelling unit near a funeral parlor means that it is near downtown, too, and
so the affluent might like to buy it just for convenience.
In Figure 1(f), one can see that the line of the estimated coefficients in the
quantile regression is close to a straight line (-0.0398). The result shows that
the negative impact of a fourth floor on housing price is the same for all
kinds of housing units. This simply means that both the rich and the poor do
not like their house to be located on the fourth floor.
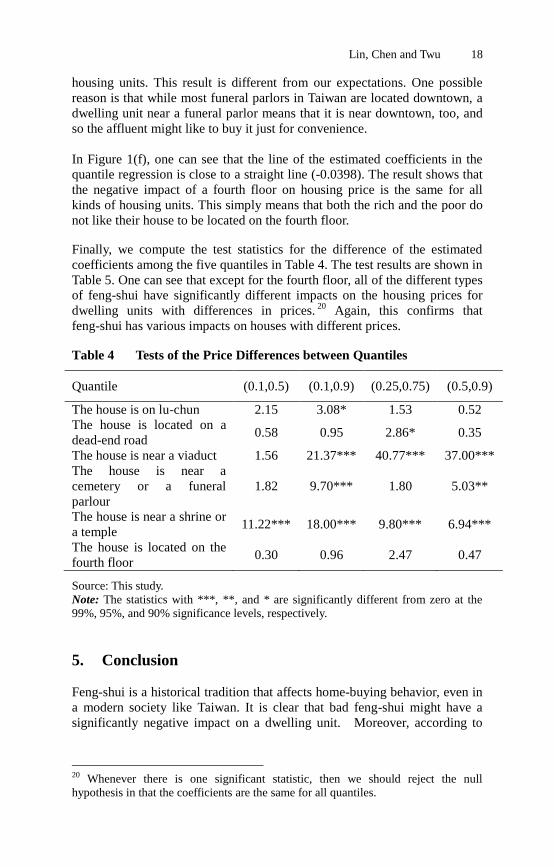
Finally, we compute the test statistics for the difference of the estimated
coefficients among the five quantiles in Table 4. The test results are shown in
Table 5. One can see that except for the fourth floor, all of the different types
of feng-shui have significantly different impacts on the housing prices for
dwelling units with differences in prices.20
Again, this confirms that
feng-shui has various impacts on houses with different prices.
Table 4 Tests of the Price Differences between Quantiles
Quantile (0.1,0.5) (0.1,0.9) (0.25,0.75) (0.5,0.9)
The house is on lu-chun 2.15 3.08* 1.53 0.52
The house is located on a
dead-end road 0.58 0.95 2.86* 0.35
The house is near a viaduct 1.56 21.37*** 40.77*** 37.00***
The house is near a
cemetery or a funeral
parlour
1.82 9.70*** 1.80 5.03**
The house is near a shrine or
a temple 11.22*** 18.00*** 9.80*** 6.94***
The house is located on the
fourth floor 0.30 0.96 2.47 0.47
Source: This study.
Note: The statistics with ***, **, and * are significantly different from zero at the
99%, 95%, and 90% significance levels, respectively.
5. Conclusion
Feng-shui is a historical tradition that affects home-buying behavior, even in
a modern society like Taiwan. It is clear that bad feng-shui might have a
significantly negative impact on a dwelling unit. Moreover, according to
20 Whenever there is one significant statistic, then we should reject the null
hypothesis in that the coefficients are the same for all quantiles.
19 Estimation of Feng-Shui on Housing Prices
Chu (1999), the rich and famous might be care more about feng-shui
whenever possible.
In order to estimate the size of the above two potential effects, this study has
employed a data set from a private bank in Taiwan with 77,624 observations.
By using an OLS regression, we find that all bad feng-shui have
significantly negative impacts on housing prices, such as location on a
dead-end road, or near a viaduct, temple, cemetery, or located on the fourth
floor. Lu-chun has a negative impact on a dwelling unit, however, the impact
is not significantly different from zero.
To investigate the possible different impacts of feng-shui on different people,
we have applied a quantile regression for dwelling units with different prices.
We find that lu-chun, dead-end roads, viaducts, cemeteries, and temples all
have different impacts on dwelling units with different prices. Generally,
the negative impact of bad feng-shui on housing price will be greater for a
dwelling unit with a higher price. Our findings are consistent with Chu
(1999) in that the rich and famous care about feng-shui more than the others
do.
Restricted by the data set, we cannot discuss how good feng-shui affects the
housing price in this study. It is no doubt that it will be an interesting
question to answer in the future. Moreover, it will also be an interesting
issue to check, by using a panel data set, whether feng-shui may actually
affect a household’s fortune before and after the move into a new dwelling
unit.
References:
Bai, G.A., Lee, C.C., Peng, S.H., Chi, C.Y., Chang, S.Y., and Tong, R.Y.
(2002). The Impact of Household Composition on the Home Buying
Behavior, Paper Presented at the Graduated Students Presentation
Conference, Department of Real Estate Management and Department of
Recreation Business, National Ping-Dong Business Technology Institute,
Ping-Dong, Taiwan. (in Chinese)
Basset, G.J., and Koenter, R. (1982). Recent Advances in Quantile
Regression Models: A Practical Guideline for Empirical Research, The
Journal of Human Resources, 33, 1, 88-126.
Bourassa, S.C. and Peng, V.S. (1999). Hedonic Prices and House Numbers:
The Influence of Feng Shui, International Real Estate Review, 2, 1, 79 –
93.
Lin, Chen and Twu 20
Chang, C.O. and Liao, C.R. (2006). A Non–symmetric Price of Housing
Agent Service, Urban and Planning, 33, 1, 1-16. (in Chinese)
Chang, Y. W. (2007). An Extension Study on the Characteristic Prices on the
Mass Appraisal: An Application of the Quantile Regression, Master Thesis,
Department of Land Economics, National Chengchi University, Taipei,
Taiwan. (in Chinese)
Chen, C.C. (2002). A Study on the Problems and the Solutions of the Funeral
Facilities and Its Management in Taipei, Master Thesis, Graduate Institute of
Life and Death, Nan-Hwa University, Taiwan. (in Chinese)
Chen, C.L. (2006). A Quantile Regression on the Wage Differences between
the Public Sector and the Private Sector, Academia Economic Papers, 35,
473-520. (in Chinese)
Chen, C.L., and Kuan, C.M. (2006). A Quantile Regression of the Wage
Equation and Gender Discrimination on Wage, Academia Economic Papers,
34, 435-468. (in Chinese)
Chen, S.H. (2004). A Study on the Impact of Lu-Chung on Housing Price,
Master Thesis, Department of Financial Economics, Yu-Ling Institute of
Technology, Yu-Ling, Taiwan. (in Chinese)
Chu, H.Y. (1999). The Fashion of Occultism and Social Change, Taiwanese
Journal of Sociology, 22, 1-45. (in Chinese)
Chuang, C.C. and Kuan, C.M. (2005). A Quantile Regression of the
Relationship of Price and Quantity in the US and Taiwan, Academia
Economic Papers, 33, 2, 379-404. (in Chinese)
Chuang, Y.L., and Hua, G.C. (2008). A Study of the Impact of Feng-Shui on
Households’ Buying Decision, The Proceedings of the 17th Annual
Conference of the Chinese Society of Housing Study, 206-232. (in Chinese)
Follain, J.R., and Malpezzi, S. (1980). Dissenting Housing Value and Rent,
Washington, DC: The Urban Institute.
Goodman, A.C. (1978). Hedonic Price, Price Indices, Housing Markets,
Journal of Urban Economics, 5, 471-484.
Goodman, A.C. and Kawai, M. (1982). Permanent Income, Hedonic Prices,
and Housing Demand: New Evidence, Journal of Urban Economics, 12,
214-237.
21 Estimation of Feng-Shui on Housing Prices
Han, B.T. (2006). Feng-Shui and Environment, Dar-Kua Publishing Co.,
Taipei, Taiwan. (in Chinese)
Hsu, R.H. (2003). The Empirical Study of the Demand for Money in Taiwan:
Quantile Regression of Error Correction Model, Master Thesis, Department
of Economics, National Taiwan University, Taipei, Taiwan. (in Chinese)
Hu, B.G. (1999). Super-Generation of Yang-Zhe Study, Lien-Zin Publishing
Co., Taipei, Taiwan. (in Chinese)
Huang, M.Y., Chen, C.Y., Chen, G.Y., Tsai, M.C., and Chuang, L.R. (2005).
A Study of the Impact of Unwanted Feng-Shui on the Housing Price, Paper
Presented at the Graduated Students Presentation Conference, Department of
Real Estate Management and Department of Recreation Business, National
Ping-Dong Business Technology Institute, Ping-Dong, Taiwan. (in Chinese)
Kao, W.C. (2000). A Study on the Housing Characteristics and Housing
Price: A Case of Lan-Tan, Chia-Yi City, Master Thesis, Department of
International Economics, National Chung-Cheng University, Chia-Yi,
Taiwan. (in Chinese)
Koenker, R. and Basset, G.W. (1978). Regression Quantiles, Econometrica,
46, 1, 211-244.
Koenker, R. and Basset, G.W. (1982). Robust Test for Heteroscedasticity
Based on Regression Quantiles, Journal of Derivatives, 50, 1, 43-62.
Kuan, C.M. (2007). An Introduction to Quantile Regression, Institute of
Economics, Academia Sinica, Taipei, Taiwan.
Lee, Y.C., and Ho, C.F. (1999). A Study on Locational Choice of
Environmental Justice and NIMBY Facilities, Journal of Urban Planning,
26, 91-107. (in Chinese)
Liao, S.H. (2005). A Study on a Sustainable Valuation Index of Cemetery
Land Use: A Case Study of Tainan Area, Master Thesis, Graduate Institute of
Land Management, Chung-Rong University, Tainan, Taiwan. (in Chinese)
Lin, C.C. (1993). The Relationship between Rents and Prices of
Owner-Occupied Housing in Taiwan, Journal of Real Estate Finance and
Economics, 6, 25-54.
Lin, C.M. (2007). A Study on the Impact of Feng-Shui on the Housing Price,
The Quarterly Journal of Land Issue Studies, 6, 1, 45-52.
Lin, Chen and Twu 22
Lu, Y.C. (1999). From the Source of Feng–Shui to Critic the Superstition of
Feng-Shui in the Modern Society, Paper Presented at the Fifth Science
History Conference, Academia Sinica, Taipei, Taiwan.
Lu, Y.C. (2000). Business Feng-Shui Knowledge, Yuan-Liau Publishing
Co., Taipei, Taiwan. (in Chinese)
Machado, A.F., and Mata, J. (2005). Counterfactual Decomposition of
Changes in Wage Distributions using Quantile Regression, Journal of
Applied Econometrics, 20, 4, 445-465.
Rosen, S. (1974). Hedonic Prices and Implicit Markets: Product
Differentiation in Pure Competition, The Journal of Political Economy, 82, 1,
34-55.
Sirmans, G.S. MacPherson, D.A. and Zietz, E.N. (2005). The Composition
of Hedonic Pricing Models, Journal of Real Estate Literature, 13, 1, 3-44.
Soderberg, B. (2001). A Note on the Hedonic Model Specification for
Income Properties, in E.K. Wang and M. L. Wolverton eds, Research in Real
Estate Monograph Services: Valuation Theory, Kluwer, Boston.
Tam, C. M. Tso, T. Y. N. and Lam, K. C. (1999). Feng Shui and Its Impacts
on Land and Property Development, Journal of Urban Planning and
Development, 125, 4, 152-163.
Tung, C. S. (179-104B.C.). Chun-Chiu Feng Lu. (in Chinese)
Yang, K. Z. (2003). A Study on the Locational Choice for the Funeral
Related Business: A New Institutional Viewpoint on the Bid-Rent Model,
Ph.D. Dissertation, Department of Land Economics, National Chengchi
University, Taipei, Taiwan. (in Chinese)
Zietz, J., Zietz, E. N. and Sirmans, G. S. (2007). Determinants of House
Prices: A Quantile Regression Approach, The Journal of Real Estate Finance
and Economic Working Paper Series.
Recommended