XVI Annual Conference Proceedings January, 2015
ISBN no. 978-81-923211-7-2 http://www.internationalconference.in/XVI_AIC/INDEX.HTM Page 935
AN EMPIRICAL STUDY FOR EXPLORING CUSTOMER SATISFACTION
TOWARDS DTH SERVICES USING SERVICE QUALITY DIMENSIONS –
A DETAILED STUDY OF DELHI NCR
Dr. Manish Madan
Associate Professor,
Rukmini Devi Institute of Advanced Studies
Dr. Nitin Gupta
Associate Professor,
School of Management,
G. D. Goenka University
Ms. Esha Jain,
Asistant Profesor,
School of Management,
G. D. Goenka University.
ABSTRACT
Measuring the quality of a service can be a very difficult exercise. Unlike product where
there are specific specifications such as length, depth, width, weight, and color etc. a service
can have numerous intangible or qualitative specifications. In addition there are the
expectations of the customer with regards the service, which can vary considerably based on
a range of factors such as prior experience, personal needs and what other people may have
told them. In the age of information technology and highly competitive business where world
has become a truly global retaining current customers and attracting potential customers has
no alternative. This can only be achieved by customer centric strategies and missions and
filling the gap between expectations and perception of service provided by DTH operators.
Thus it is important to analyze the gap in the service on regular basis and following the
improvement, if any, is very important in this paper such analysis of the gap is investigated
on services provided by DTH operatorsto its customers in Delhi. SERVQUAL has been used
as a tool with 5 dimensions and statements for this analysis. The Gap score is a reliable
indication of each of the five dimensions of service quality. Using SERVQUAL, service
providers can obtain an indication of the level of quality of their service provision, and
highlight areas requiring improvement. Questionnaire survey is used to work out the gap
score using SERVQUAL scale and shove area have been identified on the basis of the gap
score where the DTH operator should pay focused attention. The perceptions, of the DTH

XVI Annual Conference Proceedings January, 2015
ISBN no. 978-81-923211-7-2 http://www.internationalconference.in/XVI_AIC/INDEX.HTM Page 936
customers are more inclined towards the consistency in the services provided by the DTH
providers.
Key words: Perceived service quality, SERVQUAL, customer satisfaction, 5
dimensions: TANGIBLES, RELIABILITY, RESPONSIVENESS,
ASSURANCE and EMPATHY.
SERVICE QUALITY
The single most researched area in services marketing to date is service quality. According to
Fisk et al. (1993) early research in service quality disclosed its subjective nature, but it was
not until several years later that the concept of service quality as the result of differences
between actual and expected levels of service began to emerge. This implies that
organizations must establish requirements and specifications; once established, the quality
goal of the various function of an organization is to comply strictly with these specifications.
In today's increasingly competitive environment, quality service is critical to corporate
success. In the past the focus was mainly on meeting internal quality or technical standards.
The focus today has shifted to qualifying customer assessments of services, and translating
these measures into specific internal standards (Brown, Hitchcock and Willard, 1994) [2]
.
Delivering high quality service is closely linked to profits, cost saving and market share.
Service quality is defined as „a global judgment or attitude relating to the overall
superiority of the service‟ (Parasuraman, Zeithaml and Berry, 1988)[3]
. It has been
argued previously that the quality of a service has two important components: "Technical
Quality" and Functional Quality“(Gronroos, 1990a)[4]
.”The technical quality refers to the
outcome dimension of the service operation process whereas functional quality refers to the
process dimension in terms of the interactions between the customer and the service
provider" (Payne, 1993)[5]
.Service quality is a highly abstract construct, in contrast to goods
where technical aspects of quality predominate. Many conceptualizations of service quality
therefore begin by addressing the abstract expectations that consumers hold in respect of
quality.
LITERATURE REVIEW

XVI Annual Conference Proceedings January, 2015
ISBN no. 978-81-923211-7-2 http://www.internationalconference.in/XVI_AIC/INDEX.HTM Page 937
INTRODUCTION TO DOOR TO HOME SERVICES
Indian Direct-To-Home (DTH) TV industry has been growing at rapid pace since the
inception of commercial services in 2003 on the back of huge investments by the existing and
new players. The DTH industry has defied the global trend of economic crisis and posted
significant growth in 2008.
The DTH market has been able to acquire around 18 Million subscribers over the past six
years. With the entry of new players, the number of DTH subscribers has witnessed a steady
growth as the competition in the market increased and people have a wide range of options to
choose from according to their requirements.
Thanks to the superior audio and video quality, the DTH services are now in a position to
attract a large number of subscribers. On analysis of “Indian DTH Market Forecast to 2012”,
the number of DTH subscribers is projected to grow at a CAGR of around 28% during 2010-
2012. Presently, the DTH subscribers constitute only a small proportion of the total TV
household in the country, representing a vast future growth potential.
By 2015, DTH will enjoy a market share of 40%, digital cable 40% and analog cable will
follow with only 20% market share. The DTH service market in India has emerged as one of
the most lucrative markets that have successfully
With the growth of Indian economy booming at a GDP growth rate of 9.4% there is a sense
of growth prevailing everywhere. The average Indian‟s disposable income and purchasing
power has risen to never before levels. The Indian entertainment and media industry is also
not far behind. It is estimated that a worth of Rs.450 billion with a CAGR of 18% over the
next five years. Report predicts that India would overtake Japan as Asia‟s largest DTH by
next year and be the Asia‟s leading cable market by 2010 and the most profitable pay by
2015.We have been hearing about the vast potential of the Indian DTH market since it was
established in the early 2000s. There has been huge growth in the number of DTH households
but, for the entirefurore, the market has not accelerated as it was expected to. India‟s
penchant for DTH has been fuelled by economic growth. India is getting wealthier and, as a
result, the population is now earning more, meaning that they have more disposable income
to spend on items such as TV sets. In fact, the Indian TV market is massive. There are 130
million TV households in the country. At present, only a fraction of the population has access
to DTH services. The potential is phenomenal. The regional content that is offered is also

XVI Annual Conference Proceedings January, 2015
ISBN no. 978-81-923211-7-2 http://www.internationalconference.in/XVI_AIC/INDEX.HTM Page 938
very attractive especially in a country like India with a diverse population and mix of
cultures.
Research Company RN COS has recently released a report entitled „Indian DTH Market
Forecast to 2012‟. The Report has found that the Indian DTH industry‟s growth has been
supported by huge investments by existing and new players in the market. Defying the global
trend of economic crisis, the DTH industry posted significant growth in 2008 and 2009.
RN COS also found that the DTH market acquired around 16 million subscribers by the end
of 2009, an increase of approximately 44 percent over the 2008 levels. With the entry of new
players in the Indian DTH industry, competition is getting intense. Due to this intensifying
competition, installation prices are declining and subscriber have a wide range of options to
make choices.
India has about 130 million TV homes of which, Cable & Satellite (C&S) services are present
in 97 million (74%) of the home. The DTH market in India comprises 11% of the total
market with almost 15 million homes. The DTH industry growth lagged to 10.3% in 2008
from 16.7% a year earlier. But industry players agree that the digitization drive is expanding
by 35-40% annually. However, industry estimates DTH to touch 35-40 million subscribers by
2012, and that is the number that every DTH brand has set its sights on.
The anticipated growth to the efforts of DTH industry players who are all trying to lure
viewers by cutting down prices as well as offering perquisites even though it translates into
loss of Rs 1,600-2,000 on each new subscriber acquired by them. They have started to offer a
number of value-added services such as „movie on demand‟, live recording of TV content,
matrimonial matchmaking, etc.
Currently, the Indian DTH market is being served by six privateplayers - Dish TV, Tata Sky,
Sun Direct, Big TV, Airtel Digital TV andVideocon D2H. Doordarshan is also available but
this is a free DTHservice provider. All providers are investing huge amounts of moneyin the
promotion and marketing of DTH services in the country.
XVI Annual Conference Proceedings January, 2015
ISBN no. 978-81-923211-7-2 http://www.internationalconference.in/XVI_AIC/INDEX.HTM Page 939
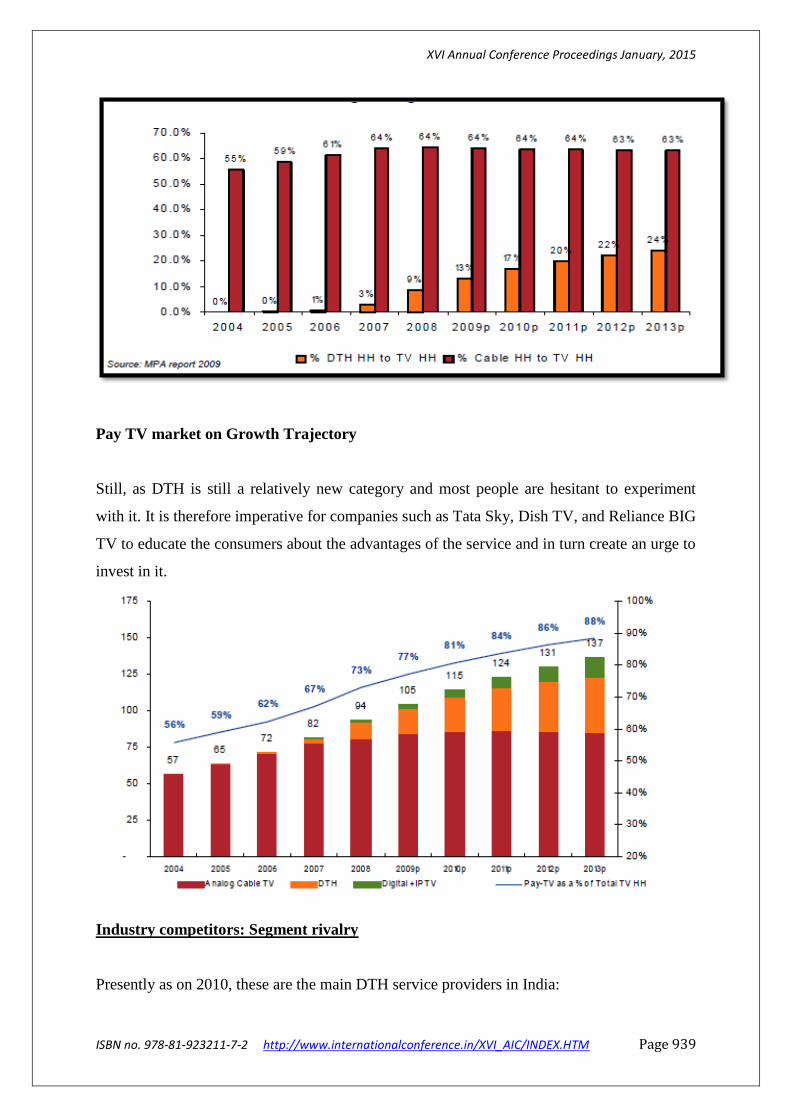
Pay TV market on Growth Trajectory
Still, as DTH is still a relatively new category and most people are hesitant to experiment
with it. It is therefore imperative for companies such as Tata Sky, Dish TV, and Reliance BIG
TV to educate the consumers about the advantages of the service and in turn create an urge to
invest in it.
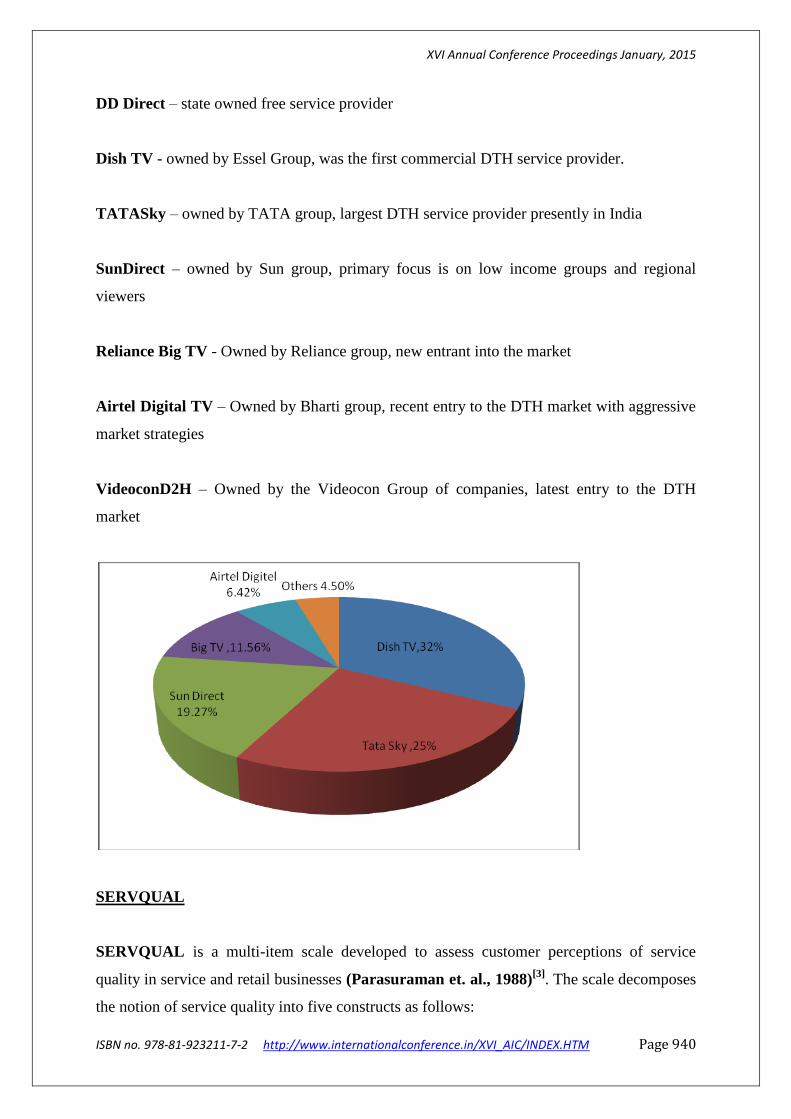
Industry competitors: Segment rivalry
Presently as on 2010, these are the main DTH service providers in India:
XVI Annual Conference Proceedings January, 2015
ISBN no. 978-81-923211-7-2 http://www.internationalconference.in/XVI_AIC/INDEX.HTM Page 940
DD Direct – state owned free service provider
Dish TV - owned by Essel Group, was the first commercial DTH service provider.
TATASky – owned by TATA group, largest DTH service provider presently in India
SunDirect – owned by Sun group, primary focus is on low income groups and regional
viewers
Reliance Big TV - Owned by Reliance group, new entrant into the market
Airtel Digital TV – Owned by Bharti group, recent entry to the DTH market with aggressive
market strategies
VideoconD2H – Owned by the Videocon Group of companies, latest entry to the DTH
market
SERVQUAL
SERVQUAL is a multi-item scale developed to assess customer perceptions of service
quality in service and retail businesses (Parasuraman et. al., 1988)[3]
. The scale decomposes
the notion of service quality into five constructs as follows:

XVI Annual Conference Proceedings January, 2015
ISBN no. 978-81-923211-7-2 http://www.internationalconference.in/XVI_AIC/INDEX.HTM Page 941
* Tangibles - physical facilities, equipment, staff appearance, etc.
* Reliability - ability to perform service dependably and accurately
* Responsiveness - willingness to help and respond to customer need
* Assurance - ability of staff to inspire confidence and trust
* Empathy - the extent to which caring individualized service is given
SERVQUAL represents service quality as the discrepancy between a customer's expectations
for a service offering and the customer's perceptions of the service received, requiring
respondents to answer questions about both their expectations and their perceptions
(Parasuraman et. al., 1988). The use of perceived as opposed to actual service received
makes the SERVQUAL measure an attitude measure that is related to, but not the same as,
satisfaction (Parasuraman et. al., 1988). Parasuramanet. al. (1991) presented some revisions
to the original SERVQUAL measure to remedy problems with high means and standard
deviations found on some questions and to obtain a direct measure of the importance of each
construct to the customer.
Later research showed that it is possible to integrate the two approaches by integrating
Service Quality Gap Analysis and Utility Theory (Robert F Bordley, 2001)[6]
. The dominant
models of Positivistic approach have been created by Christian Gronroos (1984)[7]
and A
Parsuraman, Valarie A Zeithaml and Leonard L Berry (1985)[8]
. Both models look at
service quality gaps between expected service and perceived service from the point of view
of the researcher. They consider service quality as a multidimensional attitude held by
consumers where each dimension is made up of a number of attributes. The models assume a
rational, rule based review of service quality as an accurate depiction of consumer perception.
Expected
Service
Perceived Service
quality PerceivedService
Traditional marketing activities
IMAGE

XVI Annual Conference Proceedings January, 2015
ISBN no. 978-81-923211-7-2 http://www.internationalconference.in/XVI_AIC/INDEX.HTM Page 942
Fig. 1 Source: Christian Gronroos, “A Service Quality Model and its Marketing
Implications”, European Journal of Marketing, Vol 18, No. 4, 1984
However, the Gap Analysis Model of Service Quality created by Parsuraman, Zeithaml
and Berry (1988, 1985) is the most widely accepted instrument to measure service quality.
They postulated that a-priori factors like Personal Needs, Word-of-Mouth influences and Past
Experiences as well as Communication by the service organization create Expectation of
service. A service quality gap results when service perceptions fall short of expectations.
Whereas when the service is delivered, the customer forms a Perception. The extent of
difference between the two contributes to the customer evaluating the service highly or
otherwise. Other researchers have concluded similarly, in terms of prior expectation of the
service if formed by the customer‟s mind using intrinsic and extrinsic cues, previous
experience and other information sources (Gould and Williams, 1999)[9]
.
Technical
Quality
Functional
Quality
Word of mouth
communication
Personal
Needs
Past
Experience
Expected Service
Perceived Service
Service delivery
(including pre & post-
contacts)
External
communication to
consumer
GAP 5
GAP 4
MARKETER
CONSUMER
XVI Annual Conference Proceedings January, 2015
ISBN no. 978-81-923211-7-2 http://www.internationalconference.in/XVI_AIC/INDEX.HTM Page 943
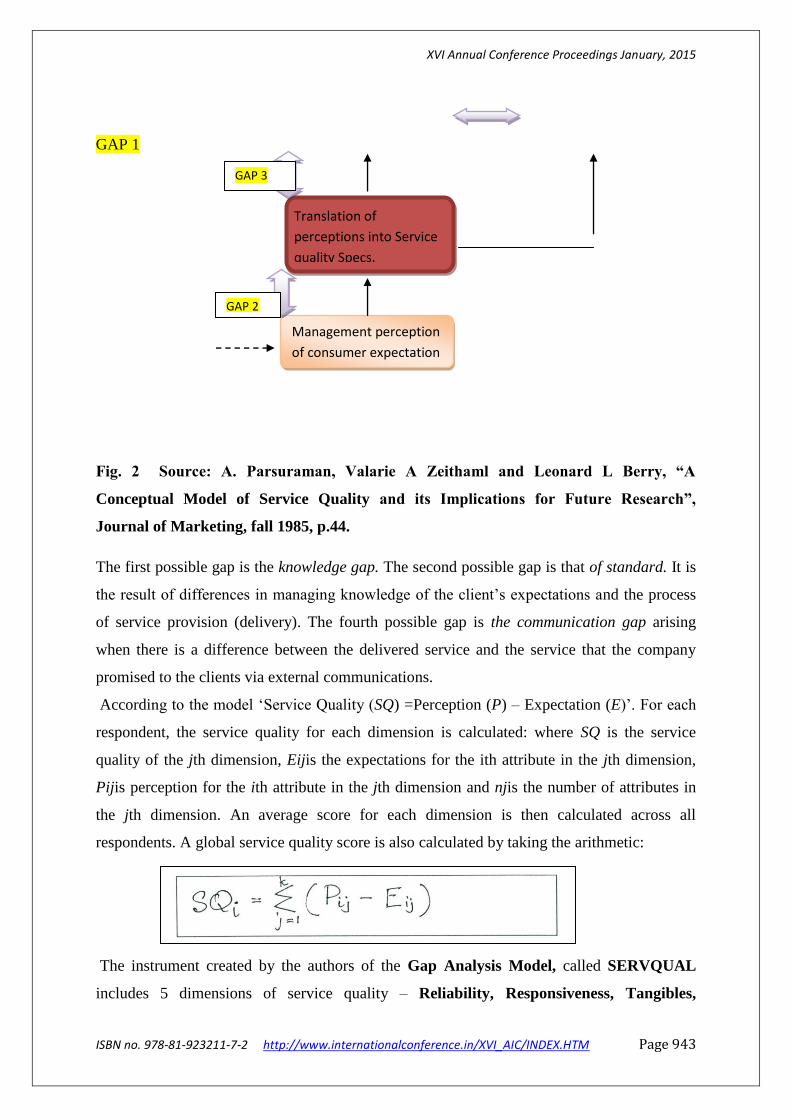
GAP 1
Fig. 2 Source: A. Parsuraman, Valarie A Zeithaml and Leonard L Berry, “A
Conceptual Model of Service Quality and its Implications for Future Research”,
Journal of Marketing, fall 1985, p.44.
The first possible gap is the knowledge gap. The second possible gap is that of standard. It is
the result of differences in managing knowledge of the client‟s expectations and the process
of service provision (delivery). The fourth possible gap is the communication gap arising
when there is a difference between the delivered service and the service that the company
promised to the clients via external communications.
According to the model „Service Quality (SQ) =Perception (P) – Expectation (E)‟. For each
respondent, the service quality for each dimension is calculated: where SQ is the service
quality of the jth dimension, Eijis the expectations for the ith attribute in the jth dimension,
Pijis perception for the ith attribute in the jth dimension and njis the number of attributes in
the jth dimension. An average score for each dimension is then calculated across all
respondents. A global service quality score is also calculated by taking the arithmetic:
The instrument created by the authors of the Gap Analysis Model, called SERVQUAL
includes 5 dimensions of service quality – Reliability, Responsiveness, Tangibles,
Translation of
perceptions into Service
quality Specs.
Management perception
of consumer expectation
GAP 2
GAP 3

XVI Annual Conference Proceedings January, 2015
ISBN no. 978-81-923211-7-2 http://www.internationalconference.in/XVI_AIC/INDEX.HTM Page 944
Assurance and Empathy. Parsuraman have published studies prior to their paper on the
Gaps model wherein they started with 10 dimensions that were tested amongst consumers
and judges across various service industries and thus was refined to 5 dimensions before
being used in SERVQUAL.Several later models also use the 5 dimensions as bases for
evaluating service quality.Research has been conducted across industries and cultural
contexts using SERVQUAL (Fornell, C. 1992)[10]
Critics of SERVQUAL (Nyeck, S.,
Morales, M., Ladhari, R., & Pons, F. 2002)[11]
argue that depending on the context and the
particular service industry, the dimensions of quality may be prioritized differently and may
even be customized. Some service quality researchers even go to the extent of saying that the
difference scores between perception and expectation, as computed using SERVQUAL
should be avoided (Peter, Churchill and Brown, 1992)[12]
and state that there are serious
problems in conceptualizing service quality as a difference score.
In their empirical studies, Cronin, Brady and Hult (2000)[13]
used a performance-only
measure of Service Quality, called SERVPERF, and found that the new scale captured the
variation in Service Quality better that SERVQUAL. Where the global service quality score
is also calculated by taking the arithmetic:
RESEARCH OBJECTIVES AND METHODOLOGY
The main objective of the research is to find the gap between the expectation and perception
of the DTH services provided to the customers. It is being justified why this industry is being
selected. Indian Direct-To-Home (DTH) TV industry has been growing at rapid pace since
the inception of commercial services in 2003 on the back of huge investments by the existing
and new players.SERVQUAL is a multi-item scale developed to assess customer perceptions
of service quality in service and retail businesses. Here the SERVQUAL is used to calculate
the gap in services of DTH industry.
XVI Annual Conference Proceedings January, 2015
ISBN no. 978-81-923211-7-2 http://www.internationalconference.in/XVI_AIC/INDEX.HTM Page 945
POPULATION AND SAMPLE
Delhi is considered under the study as the purpose of the study is not a comparison of the
status of service quality across various services providers total of 200 questionnaires were
filled up, collected and analyzed during data entry 15 questionnaires have been rejected due
to incomplete filling and for reducing biasness. Only customers using DTH services have
been selected as respondents and the demographic profile of the respondents have been kept
standardized. The sample consists of different customer‟s profile (different age groups,
professions and gender) from Delhi.
MANAGEMENT OF QUESTIONNARE
The genetic questionnaire as used byParasuramanet. al., 1988 has been used here with 22
statements under 5 dimensions. The responses have been captured in 7 point Likert scale and
gap score is calculated by deducting expectations from perceptions (E-P). At the time of
collecting data proper care have been given to demographic profile of the users to ensure the
result free from any sort of prejudice.
ANALYSIS AND FINDINGS
The use of SERVQUAL is analyzed here in detail with logical sequences. It starts with all of
the 22 original statements categorized into five in the form of a questionnaire and a seven
point scale is used to collect the customers‟ expectations and perceptions. The difference is
the GAP score which is then averaged. The methodology is as follows:-

XVI Annual Conference Proceedings January, 2015
ISBN no. 978-81-923211-7-2 http://www.internationalconference.in/XVI_AIC/INDEX.HTM Page 946
Step 1:- Designing SERVQUAL Instrument
EXPECTATIONS PERCEPTIONS GAP
SCORE
TANGIBLES E Tangibles P E-P
E1 Excellent DTH companies
will have modern looking
equipment
5.9 P1 DTH companies will have
modern looking equipment
4.2
1.7
E2 The excellent DTH
companies have well built
network
5.6 P2The DTH companies have
well built network
4.4
1.2
E3 Economic Plans 6.5 P3 HDFC bank‟s employees
are neat appearing
2.8
3.7
E4 Materials associated with the
service(such as pamphlets or
catalogues)will be visually
appealing for an excellent DTH
company
5.7 P4Materials associated with
the service(such as pamphlets
or catalogues)will be visually
appealing for DTH company
3.4
2.3
Total 23.7 14.8 8.9
Average Gap Score
[Total of E-P/4]
2.22
XVI Annual Conference Proceedings January, 2015
ISBN no. 978-81-923211-7-2 http://www.internationalconference.in/XVI_AIC/INDEX.HTM Page 947
Reliability E RELIABILITY P E-P
E5Excellent DTH companies
promise to do something by a
certain time, they do
5.8 P5 DTH companies promise
to do something by a certain
time, it does so
3.6
2.2
E6 When a customer has
aproblem;DTH companies will
show a sincere interest in solving
it.
7.1 P6 When customer have a
problem, DTH companies
show a sincere interest in
solving it
2.8
4.3
E7 Excellent DTH companies
will perform the services right
the first time
7.2 P7DTH companies provide its
service right the first time
2.9
4.3
E8 Excellent DTH companies
will provide the service at the
time they promise to do so
6.5 P8DTH companies provide its
service at the time it promises
to do so
4.4
2.1
E9 Excellent DTH companies
have less signal and hardware
problem.
6.8 P9DTH companies have less
signal and hardware problem.
5.2
1.6
Total 33.4 18.9 14.5
Average Gap Score 2.9
RESPONSIVENESS E RESPONSIVNESS P E-P
E10 Employees of excellent 6.8 P10 Employees in DTH 4.7

XVI Annual Conference Proceedings January, 2015
ISBN no. 978-81-923211-7-2 http://www.internationalconference.in/XVI_AIC/INDEX.HTM Page 948
DTH companies will tell
customers exactly when services
will be performed.
companies tell you exactly
when services will be
performed
2.1
E11 Employees of DTH
companiesnt banks will give
prompt service to customers
5.8 P11 Employees in DTH
companiesgive prompt
service
3.7
2.1
E12. Employees of excellent
DTH companieswill always be
willing to help customers.
6.2 P12. Employees in DTH
companies are always willing
to help you
3.8
2.4
E13 Employees of excellent
DTH companieswill never be too
busy to respond to customers‟
requests.
6.1 P13. Employees in DTH
companies are never too busy
to respond to your request.
3.5
2.6
Total 24.9 15.7 9.2
Average Gap Score
( Total Of E-P/4)
2.3
ASSURANCE E ASSURANCE P E-P
E14 The behavior of employees
in excellent DTH companieswill
instill confidence in customers
6.1 P14 The behavior of
employees in DTH
companiesinstills confidence
3.9

XVI Annual Conference Proceedings January, 2015
ISBN no. 978-81-923211-7-2 http://www.internationalconference.in/XVI_AIC/INDEX.HTM Page 949
in you
2.2
E15 Customers trust in excellent
DTH companies.
6.2 P15Customers trust inDTH
companies.
4.2
2
E16After sales service of
excellent DTH companies
5.8 P16After sales service of
DTH companies
3.9
1.9
E17 Employees of excellent
DTH companies will have the
knowledge to answer customers‟
questions
5.7 P17 Employees in DTH
companies have the
knowledge to answer your
questions
3.5
2.2
Total 23.8 15.5 8.3
Average Gap Score
(Total of E-P/4)
2.07
EMPATHY E EMPATHY P E-P
E18 Excellent DTH
companieswill give customers
individual attention.
5.3 P18 DTH companiesgive you
individual attention
3.9
1.4
XVI Annual Conference Proceedings January, 2015
ISBN no. 978-81-923211-7-2 http://www.internationalconference.in/XVI_AIC/INDEX.HTM Page 950
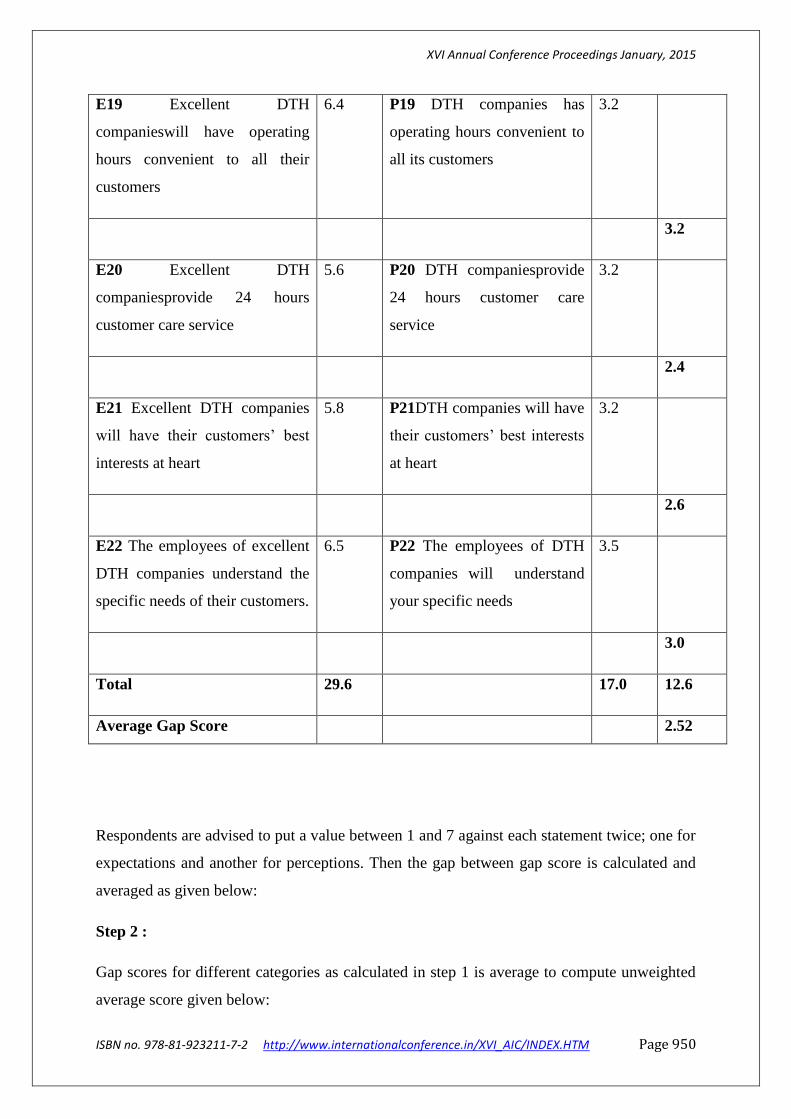
E19 Excellent DTH
companieswill have operating
hours convenient to all their
customers
6.4 P19 DTH companies has
operating hours convenient to
all its customers
3.2
3.2
E20 Excellent DTH
companiesprovide 24 hours
customer care service
5.6 P20 DTH companiesprovide
24 hours customer care
service
3.2
2.4
E21 Excellent DTH companies
will have their customers‟ best
interests at heart
5.8 P21DTH companies will have
their customers‟ best interests
at heart
3.2
2.6
E22 The employees of excellent
DTH companies understand the
specific needs of their customers.
6.5 P22 The employees of DTH
companies will understand
your specific needs
3.5
3.0
Total 29.6 17.0 12.6
Average Gap Score 2.52
Respondents are advised to put a value between 1 and 7 against each statement twice; one for
expectations and another for perceptions. Then the gap between gap score is calculated and
averaged as given below:
Step 2 :
Gap scores for different categories as calculated in step 1 is average to compute unweighted
average score given below:

XVI Annual Conference Proceedings January, 2015
ISBN no. 978-81-923211-7-2 http://www.internationalconference.in/XVI_AIC/INDEX.HTM Page 951
Categories Gap Scores
1. Average score for Tangibles 2.22
2. Average score for Reliability 2.90
3. Average score for Responsiveness 2.30
4. Average score for Assurance 2.07
5. Average score for Empathy 2.52
Total 12.01
Average (Total/5) Un-weighted score 2.402
Step 3:
This step is the extension of the SERVQUAL score and is only required if weighted score is
calculated. Putting weights against each of the five dimensions is critical because the amount
of weight represents the relative importance of the dimensions to the customer. The
questionnaire has a separate page asking each respondent to put relative weight against each
dimensions. The points against each of the dimensions are totaled and averaged to normalize
it. Total 100 points has been allocated among these dimensions as stated below that have
been calculated considering respondents‟ viewpoint on it:
Dimensions Points
1. The network, set top box, promotional material, monthly plans etc.
(Tangibles)
29
2. The DTH company‟s ability to perform the promised service
dependable and accurately(Reliability)
21
3. The DTH company‟s willingness to help customers and provide
prompt service(Responsiveness)
23
4. The knowledge and courtesy of the DTH company‟s employees and 15

XVI Annual Conference Proceedings January, 2015
ISBN no. 978-81-923211-7-2 http://www.internationalconference.in/XVI_AIC/INDEX.HTM Page 952
their ability to convey trust and confidence(Assurance)
5. The caring, individual attention the DTH company‟s provides its
customers (Empathy)
12
TOTAL 100
Step 4:
DIMENSIONS Un-weighted
score(step2)
X Weights(step3) = Weighted
Tangibles 2.22 X 0.29 = 0.644
Reliability 2.90 X 0.21 = 0.609
Responsiveness 2.30 X 0.23 = 0.529
Assurance 2.07 X 0.15 = 0.311
Empathy 2.52 X 0.12 = 0.302
Total Weight Score X 2.202
Step 5:- Analyse and take necessary actions
Finally, the score should be analyzed to find out the weak area where more attention is
required. The gap score indicates the extent of gap in service quality .The higher the gap
score is, the more is the dissatisfaction .overall score under each category and total have been
presented in a single table to get an oval picture as shown below.
XVI Annual Conference Proceedings January, 2015
ISBN no. 978-81-923211-7-2 http://www.internationalconference.in/XVI_AIC/INDEX.HTM Page 953
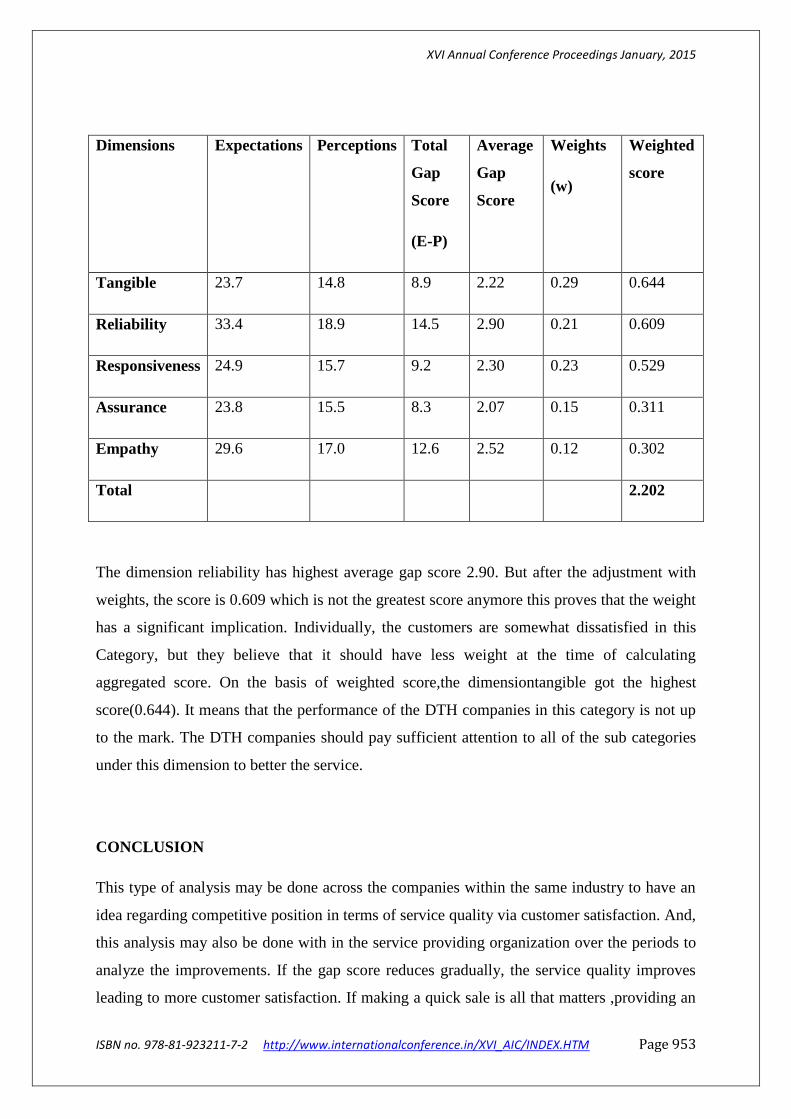
Dimensions Expectations Perceptions Total
Gap
Score
(E-P)
Average
Gap
Score
Weights
(w)
Weighted
score
Tangible 23.7 14.8 8.9 2.22 0.29 0.644
Reliability 33.4 18.9 14.5 2.90 0.21 0.609
Responsiveness 24.9 15.7 9.2 2.30 0.23 0.529
Assurance 23.8 15.5 8.3 2.07 0.15 0.311
Empathy 29.6 17.0 12.6 2.52 0.12 0.302
Total 2.202
The dimension reliability has highest average gap score 2.90. But after the adjustment with
weights, the score is 0.609 which is not the greatest score anymore this proves that the weight
has a significant implication. Individually, the customers are somewhat dissatisfied in this
Category, but they believe that it should have less weight at the time of calculating
aggregated score. On the basis of weighted score,the dimensiontangible got the highest
score(0.644). It means that the performance of the DTH companies in this category is not up
to the mark. The DTH companies should pay sufficient attention to all of the sub categories
under this dimension to better the service.
CONCLUSION
This type of analysis may be done across the companies within the same industry to have an
idea regarding competitive position in terms of service quality via customer satisfaction. And,
this analysis may also be done with in the service providing organization over the periods to
analyze the improvements. If the gap score reduces gradually, the service quality improves
leading to more customer satisfaction. If making a quick sale is all that matters ,providing an

XVI Annual Conference Proceedings January, 2015
ISBN no. 978-81-923211-7-2 http://www.internationalconference.in/XVI_AIC/INDEX.HTM Page 954
ongoing service can be ignored but how many products and services are sold only once in a
life time?Very few! The successful companies know that to produce ongoing sales and
expand the business by attracting new customers through recommendations it is essential to
look after the customers after the sale has been made.
In this analysis a SERVQUAL has been used to identify the gaps in DTH services provided
to the customers and the expectation level of the customers. The centre of point of attraction
of the customers is the Tangible dimension of the SERVQUAL having the maximum
weightage. DTH customers are deciding on the basis of the equipments and products being
supplied by the DTH companies‟along with the economical plans.If we observe the
perception of the DTH customer the more inclination is towards the consistency in the
services provided by the DTH companies. In respond to it, the DTH companies are able to
satisfy the needs of the customer in terms of the Tangible dimension of the SERVQUAL but
unable to fulfill the Reliability dimension of SERVQUAL.It is being observed that the
weakest part of the DTH companies is the Reliability dimension of the services. This analysis
will be helpful in understanding the needs and expectations of the customers and the various
factors that affect the customers to buy DTH product. Thus we can say that SERVQUAL is
an efficient tool in bridging the gap between the expectations and the perceptions of the
customers in the DTH companies.
REFERENCES
1.Fisk, R. F., Brown, S. W.,&Bitner, M. J.(1993). Teaching the evolution of services
marketing literature. Journal ofRetailing 1993; 69(1):61 – 103.
2. Brown, Mark G.; Hitchcock, Darcy E.; and Willard, Marsha L. Why TQM Fails: And
What to Do About It. Business One Irwin, 1994.
3. Zeithaml, V. A., Berry, L. L. &Parasuraman, A. (1988). “The behavioral consequences of
service quality”.Journalof Marketing, 60 (1), 31-46.
4. Grönroos, C. (2001). “The perceived service quality concept - a
mistake?”ManagingService Quality, 11 (3), 150-152
5. Person Education. Prentice Hill
XVI Annual Conference Proceedings January, 2015
ISBN no. 978-81-923211-7-2 http://www.internationalconference.in/XVI_AIC/INDEX.HTM Page 955
6. Robert F. Bordley (2001). Measurement and Evaluation of Satisfaction Processes in Retail
Settings. Journal of Retailing, 57(3), 2548
7. Gronroos, “A Service Quality Model and its Marketing Implications”, European Journal of
Marketing, Vol 18, No. 4, 1984
8.A. Parsuraman, Valarie A Zeithaml and Leonard L Berry, “A Conceptual Model of Service
Quality and its Implications for Future Research”, Journal of Marketing, fall 1985, p.44.
9. Management: A South Asian Perspective. 12th
Ed. Pearson Education.Prentice Hall.
10. Fornell, C. (1992). A national Customer Satisfaction Barometer: The Swedish
Experience. Journal of Marketing, 56(1), 621.
11. Nyeck, S., Morales, M., Ladhari, R., & Pons, F.(2002). “ 10 years of service quality
measurement: reviewing the use of SERVQUAL instrument.”
12. Brown, Mark G.; Hitchcock, Darcy E.; and Willard, Marsha L. Why TQM Fails: And
What to Do About It. Business One Irwin, 1994.
13. Cronin, J. J., Brady, M. K, and Hult, G. (2000). Assessing the Effects of Quality, Value,
and Customer Satisfaction on Consumer Behavioural Intentions in Service
Environments.Journal of Retailing, 76(2), 193218.
14. Kotler, Philip. Keller, K.L., Koshy, Abraham. And Jha, M., 2007.Marketing
15. India Today magazines

XVI Annual Conference Proceedings January, 2015
ISBN no. 978-81-923211-7-2 http://www.internationalconference.in/XVI_AIC/INDEX.HTM Page 956
Recommended