Understanding Food Insecurity in Nevada:
An Assessment of Food Policy Councils and Their Impacts
By
Katie Orlady
University of Colorado at Boulder
A thesis submitted to the University of Colorado at Boulder
In partial fulfillment Of the requirements to receive
Honors designation in Environmental Studies
May 2017 Thesis advisors:
Kelly Simmons, Environmental Studies, Committee Chair John Lanterman, Environmental Design
Dale Miller, Environmental Studies © 2017 by Katie Orlady
All rights reserved

ii

iii
Abstract This project analyzes food policy councils (FPCs) as new body of stakeholders developing solutions to food system failures in the modern food system. Focusing on the case study of Nevada, this thesis evaluates FPCs and other food system actor’s role in shaping food policy in Nevada, primarily, in alleviating food insecurity in comparison to more traditional interventions. Nevada is a geographically and demographically diverse state that places great pressure on its resources to achieve food security in both urban and rural areas. Survey data was collected from Nevada’s three FPCs, multiple food banks, and other key stakeholders in the food system to generate qualitative data and empirical evidence on the key characteristics of these organizations, and barriers hindering success. The collected data was organized into three categories of successfulness of FPCs, barriers to food policy and urban and rural trends. Through this organization, I was able to discern some barriers and identify potential opportunities to improve the policy conditions and implementation of FPCs in Nevada, which was put into context with additional research. The purpose of my research was to fill the gap in research done specifically on Nevada’s FPCs and organizations involved in food policy on a state level. I offered two recommendations based on my research to increase food policy actor’s collaboration and for Nevada FPCs to better achieve past cited potentials of other FPCs in the United States.

iv
v
Contents
Abstract ........................................................................................................................................................ iii
Preface ........................................................................................................................................................ vii
Introduction .................................................................................................................................................. 1
Background ................................................................................................................................................... 2
Literature Review .......................................................................................................................................... 4
What is Food Insecurity?........................................................................................................................... 4
History of Food Insecurity in the United States ........................................................................................ 4
Current Food System Patterns in the United States ................................................................................. 5
Measuring Food Insecurity ....................................................................................................................... 6
Rural and Urban Food Insecurity ........................................................................................................... 7
Food Policy Councils: A New Model.......................................................................................................... 8
FPCs: A Socio-Ecological Approach ....................................................................................................... 9
Food Policy and Food Policy Councils .................................................................................................. 10
The Role of Food Policy Councils ......................................................................................................... 10
Nevada and Food Policy Councils ........................................................................................................... 13
Nevada’s Need for Food Policy Councils ............................................................................................. 14
Washoe County Food Policy Council ................................................................................................... 17
Southern Nevada Food Council ........................................................................................................... 18
Why Research Food Policy Councils? ...................................................................................................... 19
Methods ...................................................................................................................................................... 20
Survey Development and Design ............................................................................................................ 21
Survey Administration ............................................................................................................................ 22
Results ......................................................................................................................................................... 22
Q1: Describe the geographic area your food policy council/food bank serves. .................................. 23
Q2: What is the length of existence of your policy council/food bank? .............................................. 24
Q3: How did you become a member of a food policy council/food bank? ......................................... 25
Q4: Does your FPC/food bank engage in policy work? ....................................................................... 27
Q5: What are the level(s) of policy your council/ food bank engage(s) in? ........................................ 28

vi
Q6: If you worked on policies in the past, please specify, and what policies are you currently working
on?....................................................................................................................................................... 30
Q7: In Nevada, what is the largest barrier to FPC's/ food bank policy work? .................................... 31
Q8: Please prioritize from most important (1) to least important (5) the following issues for Nevada
Food Policy Councils/food bank to address. ........................................................................................ 32
Q9: Please, rate the success of the Nevada Food Security Plan 2012 in meeting the plan's projected
goals. ................................................................................................................................................... 34
Q10: Please describe the greatest barrier to the Nevada Food Security Plan 2012 in meeting its
projected goals. ................................................................................................................................... 35
Discussion.................................................................................................................................................... 36
Evaluating the Success of FPCs in Nevada .............................................................................................. 37
Food Policy Barriers in Nevada ............................................................................................................... 42
Recommendations ...................................................................................................................................... 45
Recommendation: Nevada State Governor’s Food Council structured to include a representative from
each of the 17 counties in Nevada. ......................................................................................................... 45
Recommendation: Increase Nevada’s Opportunity to Achieve FPCs Five Potentials ............................ 46
Future Research Directions ......................................................................................................................... 47
Conclusions ................................................................................................................................................. 48
Appendix ..................................................................................................................................................... 50
Bibliography ................................................................................................................................................ 53

vii
Preface
This thesis project is being submitted to the University of Colorado as part of the
requirements to receive honors designation in the Undergraduate Environmental Studies
Program. The idea for this thesis came to me while working at a local food drive in my
hometown of Incline Village, Nevada. I recognized that there was a great need for food in
my small mountain ski town and I realized the scope of food insecurity must be far greater
Nevada’s urban centers. I questioned how food insecurity was being addressed in a state
that was so geographically diverse. Through further investigation, I discovered Nevada’s
Food Policy Councils and I was immediately intrigued by these organizations unique,
community centered approach to solving food insecurity. These organizations appeared to
be able to find diverse solutions to community based problems through tested research
and I wanted to know more about FPC’s history, structure and successes. Being raised in a
rural community and having hands-on experience with rural residents who are food
insecure I sought to ensure that these people’s needs are being addressed by food policy
equally to those living in urban areas. I have great pride for my home state and this project
allowed me to delve deeper in the policy that shapes the state’s food system in hopes of
benefitting the communities I grew up in.
I would like to express my greatest appreciation to my advisors Kelly Simmons, John
Lanterman and Dale Miller for the support and guidance through the duration of this
project. I would also like to thank my family and friends for encouraging me to challenge
myself and offering support through any difficulties this project created. Without them and
my advisors the completion of this thesis would not have been possible.

viii

1
Introduction Increasing numbers of consumers are concerned about the quality and quantity of food
reaching their plates; individuals are demanding more accountability in the way in which
their food is produced. In response to this growing consciousness, food awareness
movements have surfaced, focusing on the overall sustainability (social, economic, and
environmental) of the food supply chain. Community groups based around local food
issues assume active roles in the design and direction of their food system. These groups –
comprised of stakeholders at local, regional, state, and federal levels – bring together all
sectors of the food system, production, processing, distribution, consumption, and waste
recovery to form food policy councils (FPCs). FPCs are a relatively new form of
autonomous political organization designed to directly address a community’s food policy
needs by reducing fragmentation of more traditional food system and food policy models.
My senior honors thesis explored drivers of food insecurity in Nevada and the
impact of FPCs and other government-supported food security programs on food insecurity
in both rural and urban parts of the state. My research examined the reach of these FPCs
and food security program and potential barriers to their success. Using a survey method
approach, I asked FPC leaders and stakeholders in Nevada to describe the policy process
and scope of activities that currently address food insecurity and policy.
Because Nevada is my home state, I am deeply connected to the small, mountain
community in which I grew up. I am familiar with the geographic, economic, social, and
cultural variability that drive decisions making and politics in Nevada. Only small pockets
of the state are urban and socioeconomically sound, the rest of the state is rural, grounded
in agriculture, and economically depressed. Throughout my childhood I volunteered at

2
food drives in my hometown of Incline Village, but as I grew older I realized the need for
food in my small town was miniscule compared to the surrounding areas. Specifically, as I
spent more time in Reno food banks, I began to gain insight into the scope of food
insecurity in Nevada, which prompted my investigation into how FPCs might successfully
approach food security in urban and rural areas.
The goal of my project has been to uncover whether existing food programs and
policies in Nevada are designed to aid the entire state and not just urban, affluent pockets.
Three questions framed my research of FPCs as a modern, integrated model to minimize
food insecurity in Nevada. First, I explored whether the emergence of the FPC model in
Nevada has improved food security conditions. Next, I investigated whether FPCs extend
beyond urban centers in Nevada to address the unique policy issues of more rural areas.
Finally, I examined current policy opportunities and challenges for FPCs in Nevada. This
project was designed to analyze existing food policy and the emergence of FPCs to identify
gaps in existing food policies in Nevada. Through my findings I was able to develop
recommendations to better meet the state’s food system needs.
Background
The three food policy councils in Nevada have the goal to create long-term food security
through policy work. Without proper leadership it is difficult to develop a strategy where
food programs work together and supplement each other in all sectors of the food system.
Nevada’s FPCs have the opportunity to be the body of stakeholders that takes this role to
remedy food insecurity and hunger in the state through the creation and implementation of
the strategic Nevada Food Security Plan 2012. By following the goals and priorities of the

3
food security plan, Nevada FPCs strive to create short, mid and long-term strategies to food
security.
Figure 1. Nevada Food Policy Councils Short, Mid and Long Term Strategies to
Achieve Food Security in the State (Nevada Food Security Plan, 2012).
The Nevada Food Security Plan 2012 established four workgroups to target policy in
different sectors of the system. As stated in the 2012 plan, “The Grow Nevada workgroup
addressed food issues related to economic development and agriculture business; Feed
Nevada focused on eligibility, outreach, access, and nutrition education; Reach Nevada
dealt with logistics, execution, purchase, storage, and distribution; and finally the Lead
Nevada workgroup addressed policy and leveraging related to food security (Nevada Food
Security Plan, 2012). It is through these workgroup’s that Nevada hopes to reduce the
barriers to food insecurity in the state and better democratize the food system through
hands-on community engagement.

4
Literature Review
What is Food Insecurity?
Food security is defined by the FAO as, “exist[ing] when all people, at all times, have
physical, social and economic access to sufficient, safe and nutritious food which meets
their dietary needs and food preferences for an active and healthy life. Household food
security is the application of this concept to the family level, with individuals within
households as the focus of concern” (FAO, 2003). Food insecurity is defined as “exist[ing]
when people do not have adequate physical, social or economic access to food as defined
above” (FAO, 2003).
History of Food Insecurity in the United States
Food insecurity first emerged and was widely recognized in the United States during
the Great Depression when a large portion of the U.S. workforce was unemployed. Farmers
were struggling to pay off industrial farming equipment purchased in the wake of the
technological advances during the Industrial Revolution (Levine, 2010). These factors
contributed to all-time high food prices, despite high levels of agricultural production
(Gregory & Coleman-Jensen, 2013). In response, Congress implemented a program in 1932
allowing the government to purchase excess wheat supplies and donate them to hunger
relief charities, which improved food security and kept farm production levels high due to
sustained demand. For the next two decades, the federal government instituted additional
food support networks, including Food Stamps (now the Supplemental Nutritional
Assistance Program, or SNAP) and the National School Lunch Program, both of which
remain central in combatting food insecurity and hunger (Andrews and Clancy, 1993).

5
Until the 1980s, the United States did not face another nationwide epidemic of food
insecurity, and the programs implemented in response to the Great Depression were
successful in improving food security conditions (Andrews and Clancy, 1993). However, in
the early 1980s, an economic recession forced the federal government to cut funding for
social programs, which resurfaced hunger and food insecurity nationwide. During this
time, unemployment rates increased dramatically and many food insecure households
began to depend on food banks and faith-based food pantries for their meals. In response,
the number of food banks grew to meet the needs of intensifying food insecurity (Andrews
and Clancy, 1993). These programs have remained and become major pieces of the policy
infrastructure to battle food insecurity in the United States.
Current Food System Patterns in the United States
Food insecurity remains a significant challenge in modern America, and food system
failures have long plagued all regions of the United States. Existing patterns in food
insecurity have revealed rates that are slightly higher in the western U.S. than in the
Midwest or Northeast (Nord et al., 2008). For example, Nevada has experienced a fifty
percent increase in food insecurity in the past five years, with over 14 percent of the
population considered food insecure (Nevada Food Security Plan, 2012). A number of
characteristics drive these trends and higher rates, including economic, social,
demographic, and geographic conditions.
Currently there are 43.1 million (13.5 percent) Americans in the United States living
in poverty (Feeding America, 2015). Of those who are impoverished, 42.2 million of them
live in food insecure households comprising 29.1 million adults and 13.1 million children
(FAO, 2015). In the United States, households with children (17 percent), especially

6
households with children headed by single women (30 percent) or single men (22 percent),
Black non-Hispanic households (22 percent) and Hispanic households (19 percent) had
higher rates of food insecurity than the national average (Feeding America, 2013). In
addition to these statistics, 5.4 million (9 percent) seniors are categorized as food insecure
(Feeding America, 2013). Federal food system remedies have had limited success in
targeting local issues, often because they are so far removed from the local challenges.
Federal programs are so broad in application they typically are ineffective at directly
impacting local and regional food system failures.
The geographic drivers behind food insecurity also cannot be overlooked. A study
in 2015 found that food insecurity exists in every county of the United States with rates
ranging from 4 percent to as high as 38 percent (Feeding America, 2015). Mississippi
(20.8%), Arkansas (19.2%), Louisiana (18.4%), Alabama (17.6%), Nevada (14.9%),
Kentucky (17.6%), Ohio (16.1%), Oregon (16.1%), North Carolina (15.9%), Maine (15.8%),
Oklahoma (15.5%), Texas (15.4%) and Tennessee (15.1%) are the some of the states with
counties that rank above the national average (Feeding America 2015).
Measuring Food Insecurity
To better understand and monitor food insecurity, the United States Department of
Agriculture (USDA) created a system called the Community Food Security Assessment
Toolkit that ranks households as high, marginal, low or very low (USDA, 2016). The USDA
uses this spectrum to assign households a food security ranking. Additionally, terms like
“food desert” have emerged in recent years to serve as indicators of food insecurity. The
USDA identifies a food desert as: “parts of the country vapid of fresh fruit, vegetables, and
other healthful whole foods, usually found in impoverished areas. … largely due to a lack of

7
grocery stores, farmers’ markets, and healthy food providers” (USDA, 2016). Currently
6,500 food deserts have been identified in the United States; with 75 percent in urban areas
and the remaining 25 percent are rural (USDA, 2016). Exacerbating these conditions 11.5
million people (4.1 percent) live in low-income areas more than one mile from a
supermarket (National Coalition for the Homeless, 2016). Proximity to a grocery store is
especially problematic for rural communities and population inequalities often weight
policy to serve more populated areas (Feeding America, 2016).
Rural and Urban Food Insecurity
More households in rural communities are ranked as “very food insecure” than in
urban settings in the United States (Feeding America, 2016). According to Feeding America
2016, 15% of all rural households, or 2.8 million households, are food insecure. Fifty
percent of counties with the highest rates of food insecurity (those in the top ten percent)
are in rural areas (Feeding America, 2016). In comparison, only 26% of urban counties fall
into the same food insecurity bracket. Paradoxically, rural areas that grow the majority of
the population’s food frequently lack access to nutritious food options (National Coalition
for the Homeless, 2016).
In the most rural areas, local economics can influence the food security of the region
due to grocery stores that are difficult to keep open due of a lack of consumers and distance
from distributors (Wright, 2016). Food banks can remedy the issue, but most food banks
do not distribute fresh products. Small towns will often have convenience stores, which
also lack fresh products. Designing rural food policy can be difficult for a number of
reasons, and is exacerbated due to the definition of food deserts. Thus the focus tends to be

8
on the lack of big retail stores, which are usually not present in rural communities
(National Coalition for the Homeless, 2011).
Urban areas have far more inputs into their local food system than rural ones. Even
though urban food insecurity is more directly recognized and addressed than in rural
regions, the urban food system remains less visible in transportation, housing,
employment, or even the environment (Hawe and Noort, 2001). Because of this, food
insecurity solutions in urban areas tend to be local, or regional, in their scale.
Food Policy Councils: A New Model
Food has never figured so prominently into the public agenda as it does today - the
global population is increasing pressure on the world’s food system. Recognizing the
interdependence of hunger, malnutrition, diet-related disease, agriculture, poverty and
access to food, and economic development, FPCs are being created to address multiple
sectors of the food system (Harper, Shattuck, Holt-Gimenez, Alkon, & Lambrick, 2009). An
article in the Journal of Extension, defines a food policy council as, “[A body that] typically
identify and discusses food-related problems, brainstorms food system solutions, foster
coordination across agencies and sectors, and evaluates and influences food policies.”
These organizations are typically comprised of community residents and representatives
from the five food sectors, production, processing, distribution, consumption and waste
recovery, who collaborate to find solutions to food system problems (Hodgson, 2014).
The first FPC was started in Knoxville, Kentucky in 1982. More than 150 councils
existed at the local, county, tribal, and state levels between 2000-2011 (Winne, 2011). FPCs
can take many forms, from local government entities to nonprofit organizations, and
provide a space for the separate sectors of the food system to develop relationships and

9
collaborate on food policy issues (Alkon et al., 2012). FPCs frequently serve as the link
between local, municipal, state and federal entities responsible for food policy. The
Institute for Food and Development Policy found that the formality of a FPC’s connection to
government is strongly correlated to the jurisdiction scale of the council (2009). Half of
state-level FPCs are government agencies, and some of those that are not actually part of
government were officially created by government action. FPCs at the county and local-
levels, however, tend to be entirely independent of government (Harper et al., 2009).
Regardless of their operating level, Hodgson (2013) notes that FPCs have increasingly
reached out to a number of community partners in the private and public sector, including
urban and regional planners, to help them find pragmatic solutions.
FPCs are created in several different ways. Wekerle (2004) highlighted that FPCs
can surface through legislation, executive order, grassroots organization or the project of a
non-profit organization. Due to their diverse structure, and depending on location and
community needs, FPCs can also be organized according to where they are housed.
Government agency, citizen advisory board to a governmental agency, citizen advisory
board, non-profit organization and grassroots groups provide the structure to create an
FPC (Harper et al. 2009). FPCs are often formed in one way, but housed in another. For
example, some FPCs created by government action are not housed within government.
FPCs: A Socio-Ecological Approach
FPCs take a socio-ecological approach when addressing food insecurity, which
emphasizes the understanding of the dynamic interrelations among various personal and
environmental factors (Harper et al., 2009). A socio-ecological model bridges the gap
between behavioral theories that focus on small settings and anthropological theories that

10
analyze larger settings (Ericksen, 2009). This approach may be more successful in
addressing rural food system failure because food enters local homes in a variety of ways,
which differs from urban communities. Hunting, gathering, fishing and sharing community
gardens are more common sources of food for rural residents and capture these unique
rural behaviors (Harper et al., 2009).
Food Policy and Food Policy Councils
The Farm Bill is the largest piece of federal food policy, renewed every five years.
The Farm Bill funds a wide range of programs including SNAP benefits, agricultural
research, food safety, animal welfare, forestry, rural electricity, water supply, foreign food
aid, and subsidy payments to commodity crop producers (Philpot, 2006). The Farm Bill
also addresses nutrition and anti-hunger programs, with 66% of all funds from the 2008
Farm Bill dedicated to nutrition (Imoff, 2007). While the Farm Bill frames our nation’s food
system policy, hundreds of other pieces of federal, states and local legislation shape how
we eat. Food is regulated differently depending on if it is sourced to schools, prisons,
hospitals, government institutions, citing zoning to create or restrict community gardening,
local distribution systems and processing facilities and farmers markets. All of these
entities providing inputs into the food system require policy regulations that influence the
patterns and distributions of our food system (Imoff, 2007). Deciding who, what and how
to regulate all of these food system organizations is a difficult task requiring coordination
at every step of the food system.
The Role of Food Policy Councils
In recent decades, the food security, food justice, and food sovereignty movements
have begun to envision broad, comprehensive approaches to food policy that include all

11
aspects of the food system (Fox, 2012). In this view, food policy is multidisciplinary,
multispectral and intergenerational, and addresses social, political, economic and
environmental factors (Harper et al., 2009). FPCs take on capacity building roles by
catalyzing desire and motivation in the community to improve food security. The FPC
model of government on policy, governance and innovation brings together diverse
stakeholders to study a localized food system and offer recommendations for policy change
(Fox, 2012). According to the Food First Institute for Food and Development Policy 2009,
the objectives of different FPCs are universal yet refined for each specific community
where different councils exist. The Food First Institute highlights FPC’s main goal as:
advocating for policy change to improve a community’s food system, developing programs
that address gaps in a community’s food system, strategizing solutions that have wide
applicability to the food system, researching and analyzing the existing conditions of a
community’s food system, communicating information about a community’s food system,
cultivate partnerships among a community’s five food sectors and convene meetings that
draw diverse stakeholders of a community’s food system (Food First, 2009) . Hassanein
(2013), states the purpose of FPCs as, “offer[ing] a concrete example of a deliberate
attempt to develop the practice of food democracy” (Hassanein, 2003).
Federal food system programs are frequently underutilized in the United States due to lack
Figure 2. Food Policy Council funding sources (Harper et al., 2009)

12
of coordination and education needed to implement the program at a local level, like SNAP
benefits (Harper et al., 2009). To better utilize these programs food policy councils require
funding to make local impacts on the food system but it is often difficult for FPCs to acquire
funds. Many food policy councils have no funding at all, and survive as all-volunteer
organizations (Harper et al., 2009). Eight percent of state level FPCs, 14% of county level
FPCs, and 28% of local level FPCs have no funding. The largest funding source for state
level FPCs is government, for county level FPCs the largest funding source is individual
donations and for local level FPCs, the top funding source is grants from foundations
(Harper et al., 2009).
Figure 2 depicts the various funding sources for FPCs at the local, county and state
level; the funders that do not exist are sporadic and dispersed (Harper et al., 2009).
Additionally, the USDA has supported the creation of FPCs both directly and indirectly. For
example, the Community Food Projects Competitive Grant Program of the USDA has
provided larger grants to FPCs but these federal grants are often difficult to obtain for local
organizations (Schiff, 2007). Despite being underfunded, having multiple sources of
funding enables FPCs to become more engrained into the United States food system. It is up
to these organizations to seek out funding from multiple entities in order to function and be
impactful. FPCs are ideal to solve problems in the food system due to these organizations
socio-ecological approach, which creates more strategic localized food policy for
communities. FPCs have the possibility to be effective actors in the Nevada food system
diverse geography that calls the need for a body of stakeholders to implement and
advocate for policy at local, county and state levels.

13
Nevada and Food Policy Councils
Nevada is a geographically and
economically divided state, with two larger
urban areas with pockets of affluence, and a
significant portion of the state more
socioeconomically depressed and rural.
Figure 3 depicts the 17 counties of the state,
and of these 17 counties only one county,
Clark (indicated by the black box), has a
population over one million and only one
county, Washoe (indicated by the blue box),
has a population over 400,000 people
(Feeding America, 2016). The remaining 15
counties have populations ranging from as small as 2,000 people up to 55,000 people
(Feeding America, 2016). Seven counties have population less than 5,000 (Feeding
America, 2016). Ten of the 17 countries reported food insecurity rates above the national
average of 13.7% (Feeding America, 2015). However, the most food secure counties in
Nevada are those with the largest population nodes, highlighting the policy divide between
the urban and rural food system. Washoe and Clark Counties -those with the largest urban
centers - have active FPCs.
Nevada faces food insecurity in both rural and urban regions, and in response has
generated a statewide Food Security Plan along with two regional food security plans. Since
the emergence of these plans, three regional food policy councils have emerged in the
Figure 3. Nevada’s 17 Counties
14
northern and southern regions of the state. Washoe County Food Policy Councils, housed in
the north-western corner of the state, Southern Nevada Food Council serving the most
southern region of Nevada and the Nevada State Governors Food Council, which meets in
northern Nevada but aids the entire state.
Nevada’s Need for Food Policy Councils
Nevada is a state that suffers severely from food system failures. The 2008 economic
recession impacted Nevada’s low-income population immensely, and today one in six
Nevadans (14.9 percent) are food insecure (Feeding America, 2016) and until 2010, the
state did not have any policies to promote a healthy food system (Washoe County website,
2011). According to the U.S. Department of Agriculture, Nevada experienced a 50%
increase (from 10% -15%) in food insecure households between 2007 and 2012, (USDA,
2016). Additionally, Nevada ranks in the bottom ten states for serving the percent of
population eligible for SNAP benefits (Nevada Food Security Plan, 2012).
Since 2012, three food policy councils have been established in Nevada, Nevada
State Governor’s Food Council, Washoe County Food Policy Council and Southern Nevada
Food Council. In addition to these FPCs, the Nevada Department of Health and Human
Services (DHHS) and the Grants Management Unit (GMU) implemented a strategic planning
process to generate the 2012 Nevada Plan for Food Policy Action after the creation of the
two county FPCs. This process brought together stakeholders from different sectors in the
state and the FPCs to find solutions to growing food system failures. Food insecurity,
particularly in rural regions, was identified as the top issue (Department of Health and
Human Services, 2011). Rural residents must cope with inadequate income to obtain food,
lack of access to grocery stores due to demographics of communities and a lack of local

15
access to public offices to apply for SNAP benefits. Rural hunger in Nevada no longer means
just “lack” of food but a lack of access to healthy food that promotes health and well-being
and guards against obesity, diabetes, and other diet-related illnesses.
A traditional metric used to quantify food insecurity is to track number of meals
missed per year. According to the DHHS, Nevadans are missing a lot of meals (Nevada Food
Security Plan, 2012). Even after assistance from federal nutrition benefits, food banks, soup
kitchens, and food pantries, 16% of Nevada’s population still misses meals. Missing meals is
calculated by the number of meals per year that corresponds to the food budget shortfall
reported by food insecure individuals. – this is what creates the “meal gap” or the number
of meals that food insecure individuals could not afford (Nevada Food Security Plan, 2012).
In Nevada, 81,367,395 meals were missed in 2010 (Nevada Food Security Plan, 2012).
Additionally, many Nevadans are unaware of their eligibility for food and nutrition benefits.
Statewide poverty is high, leaving 50% of children eligible for free or reduced cost school
lunches (Nevada Food Security Plan, 2012).
Nevada’s geography and climate also make it particularly vulnerable to food
insecurity, specifically for rural residents. Farming is difficult in Nevada’s high desert
climate due to the high water demands for growing and processing food in a water scarce
region (USDA, 2016). The Food Security Plan aims to increase production, processing, and
the purchasing power of locally grown food in Nevada to make healthy food more
accessible to all members of the population. Nevada is separated from California by a
mountain range covered by snow in the winter. This physical impediment can affect
commerce and the movement of goods and people to and from this region (Nevada State
Action Plan, 2012). Some Nevadans have to travel greater distances to buy groceries, and

16
people who live in remote communities add significant mileage expenses to the cost of
obtaining their food. Often rural areas only have one place to buy groceries, which may
contribute to higher food prices and less food variety. Additionally, fluctuating gas prices
can also put an upward pressure on the cost of food.
Nevada’s Plan for Action
Nevada completed Community Needs Assessment in 2012, which identified hunger
and access to food as top priorities across the state. These findings prompted the creation
of the Office of Food Security within the Director's Office of the Department of Health and
Human Services and marked the beginning of Nevada’s food security movement and the
development of the Nevada Food Security Action Plan (2012) by the Nevada State
Governor’s Food Policy Council. The goal of Nevada’s 2012 food security movement was,
“to develop a network of local and corporate supermarkets, farmer’s markets, community
gardens and anti-hunger initiative to create a distinct food web that minimizes barriers to
food access” (Nevada Food Security Action Plan, 2012).
The 2012 Food Security Action Plan was designed in four steps to remedy different
sectors of the food system. The principles were to: 1) incorporate economic development
opportunities into food security solutions; 2) use a comprehensive, coordinated approach
to ending hunger and promoting health and nutrition, rather than just providing
emergency short-term assistance; 3) focus on strategic partnerships between all levels of
government, communities, and nonprofit organizations including foundations, private
industries, universities, and research institutions; 4) use available resources in a more
effective and efficient way and lastly, implement research-based strategies to achieve
measurable results (Nevada Food Security Action Plan, 2012). From these guidelines,

17
Nevada’s policy leaders were able to gain more comprehensive insight into the challenges
facing the Nevada food system and attempt to find/monitor solutions.
On February 12, 2014, Governor Brian Sandoval put forth an Executive Order that
formally established the Nevada Governor’s Food Security Council, one of the three FPCs in
Nevada, housed in the Department of Health and Human Services’ Office on Food Security.
The Council was created to implement the goals of the Plan and improve the quality of life
and health of Nevadans by increasing food security throughout the state (Nevada Food
Security Plan, 2012).
Washoe County Food Policy Council
The Washoe County Food Policy Council (WCFPC) was formed in 2011 from a 2010
Community Action Plan (CAP) created under a grant from the Centers for Disease Control
and Prevention (CDC) (Washoe County Food Policy Council, 2014). Through
careful examination of community data, there was an observed need for policies and
plans to address the lack of specific food policy and vision in Washoe County. The WCFPC is
currently made up of 8 council members who represent sectors of the region’s food system
including: food production, public food programs, community planning, food distribution,
food preparation, data and surveillance, consumers and three member-at-large positions
(Washoe County Food Council, 2014). The WCFPC is charged with implementing the goals
of the Washoe County Food Plan - Access to Health Food in Washoe County: A Framework for
Food System Design and reducing barriers for access to healthy food (Washoe County Food
Council, 2014). The WCFPC holds monthly meetings open to the public and also hosts work
groups, which focus on specific projects and initiatives. Community members are
encouraged to attend council meetings and to participate actively in work groups. One

18
member of the WCFPC is represented on the State Governor’s FPC.
Access to Healthy Food in Washoe County
This document was created with the goal to guide the creation of a healthy food
system in Washoe County. The principle framework of the plan includes: an awareness of
the association between food, health, and the local economy, recognition of the continuum
of food access as well as the diversity inherent in each component of the food system itself,
it takes into account the unique regional pressures to form “out of the box” solutions for
residents that face obstacles to obtain healthy food (Washoe County Food Council, 2014).
The Access to Healthy Food Plan describes local influences on food, components of the food
system, and establishes “big picture” goals of what access to healthy food in Washoe County
looks like (Access to Healthy Food in Washoe County, 2014).
Southern Nevada Food Council
The Southern Nevada Food Council (SNFC) is a body is comprised of health
education professionals who collect and analyze data to identify community needs prior to
planning, implementing, monitoring, and interpreting programs designed to encourage
healthy behaviors (Southern Nevada Health District, 2016). Housed in Clark County’s Office
of Chronic Disease Prevention and Health Promotion, SNFC supports socially, economically,
and ecologically sustainable food systems to promote the current and future health of
individuals, communities, and the natural environment (Southern Nevada Health District,
2016). SNFC describes a healthy food system as one that is health promoting, sustainable,
resilient, diverse in size, scale, geography, culture and choice, fair, economically balanced
and transparent and works to provide this for Clark county. This organization follows

19
guideline created by the Southern Nevada Food Council’s White Paper on the Food System of
Southern Nevada.
Southern Nevada Food Council White Paper
The purpose of this document was to describe the impact of the environment, social,
economic and nutritional needs of Southern Nevada and provide specific recommendations
for the Southern Nevada Food Council. It was crucial for this document to identify both the
social and physical needs of the Southern Nevadan population. The goals recommended by
the plan were to identify current capacity, build capacity, implement suggested programs
and evaluate the outcomes.
Why Research Food Policy Councils?
The need for research on the efficacy of FPCs has been cited repeatedly (Feenstra
1997; Webb, Hawe, & Noort 2001); however, there has been little research conducted on
FPCs impact on the policy process. Scherb (2012) stated why research on FPC’s policy work
is difficult -the complex, multisector work of FPCs can make their evaluation difficult. Lack
of data or evaluation procedures within individual councils may also hamper the ability of
FPCs to monitor and evaluate their efforts in the food system. Issues arise due to the lack of
evaluation data about effective FPCs and the strategies they use, which prevents successful
FPCs strategies from being replicated (Webb, Pelletier, Maretzki, & Wilkins, 1998). Food
First, a national research and advocacy organization, stated that evaluation of the
effectiveness of FPCs will be critical to their success and impact on the food system (Harper
et al., 2009).
As noted by Pothukuchi and Kaufman (1999) food policy councils, and perhaps the
eventual creation of city and state Departments of Food, will be essential to pursue a more

20
inclusive and integrated approach to food policy. Modern food security, food justice, and
food sovereignty movements have begun to envision broad, comprehensive approaches to
food policy that include all aspects of the food system involved in feeding a population
(Harper, 2009). Therefore, food policy should be designed as multidisciplinary, addressing
social, political, economic and environmental factors. This comprehensive approach to food
policy and food systems creates the need for organizations like FPCs to engage all actors in
the policy process, from formulation and decision-making to implementation and
evaluation. However, evaluation of existing FPCs is needed in places like Nevada to gain
insight into the potential impacts these organizations can have on the modern food system
landscape and shaping future food policy.
Methods
My research design enlisted a survey method to collect data on Nevada’s food policy
councils and food banks. I chose this method to access individuals with key knowledge on
food insecurity in Nevada. I selected this subset because of their intimate work in the
Nevada food system. I sought to identify those who serve on the Nevada State Governors
Food Council, Washoe County Food Council, and Southern Nevada Food Council because
this sample of people are the ones who built the plan to address food insecurity in the state.
The members of these organizations totaled less than 40 individuals. Concerned about
sample size, I chose to broaden my sample to include other important actors in Nevada’s
food policy system and individuals with direct knowledge of the state’s current food policy
programs. This group included key informant interviewees, steering committee members,
Feed Nevada workshop group members, Grow Nevada workshop group members, and

21
Reach Nevada workshop group members of the Nevada Food Security Plan 2012. By
including these additional groups, my sample size increased to 68.
Even after expanding my initial criteria, survey response was low – with only 25
respondents. Due to this low response, I expanded my research group to include the food
banks of Nevada. Food banks were ideal because FPCs frequently direct the work of food
banks in their communities. Also, two of the participating food banks staff members hold
positions on the State Governor’s Food Policy Council. Six out of nine food banks in the
state were willing to participate in the survey: the Food Bank of Northern Nevada, Three
Square Food Bank, Colorado River Food Bank, Helping Hands of Vegas Valley Food Bank,
Food For Thought Food Bank and the Carson Valley Community Food Closet. I was able to
collect a total of 38 individual responses, which was a large enough sample to come to
conclusions from my collected data points.
Survey Development and Design
The purpose of this survey was to collect qualitative data and empirical evidence on
the workings of the Nevada food system. My survey was designed with a total of 10 open-
and close-ended questions, with each individual serving as my unit of analysis. The
questions were designed to capture that role of FPCs and food system related organizations
in the Nevada landscape; what barriers FPCs and food policy actors face in policy
engagement; and the scale and scope of policy activities and range of topics.
Survey questions were informed by the CFSC Evaluation Toolkit (CFSC, 2006) and
supplemented with questions applying specifically to Nevada. The CFSC Toolkit asks
questions developed to access the growing food needs of local communities and to measure
ongoing data after policy has been implemented. Specifically, the questions are designed to

22
evaluate the impact and effectiveness of food system work in various environments. My
questions were designed to evaluate success/failures and barriers to food policy in Nevada
and the niche that FPCs fill. Two questions, one open-ended (Q10) and one ranking (Q9),
directly assessed the Nevada Food Security Plan 2012 success in meeting its projected
goals. Another open-ended question (Q7) identified the biggest barriers to successful
implementation of Nevada food policies and (Q6) was an open-ended question, which
identified current polices being work on. Q8 identified the current prioritized food policies
issues where resources are being spent. The remaining five questions (Q1, Q2, Q3, Q4, Q5)
were designed to group food system actors by geography, demographic served, policy
work/level engagement and a ranking of the most persistent issues with Nevada’s food
system. These data offered evidence on implementation objectives of food policy in Nevada.
Survey Administration
I emailed the chair of each FPC in Nevada to aid in the administration of my survey
and key members of the Nevada Food Security Plan 2012 and food banks. Survey
participants were provided a short narrative on the purpose of the survey and a link to the
Qualtrics survey. The survey was administered between November 15, 2016 and February
10, 2017.
Results
Of the 68 representatives from FPCs, food banks and key members of the Nevada
Food Security Plan I invited to participate, 38 responded to the survey for a response rate
of 55.8 percent. One respondent initiated, but did not complete the survey.

23
Q1: Describe the geographic area your food policy council/food bank serves.
Number of Respondents
Figure 1. Survey results showing geographic scale/scope at which FPCs operate
Answer % Count
City 2.94% 1
County 47.06% 16
Region 32.35% 11
State 17.65% 6
Total 100% 34
Table 1. Percentages/count reported to the geographic scope of the FPCs/food policy
actor’s organization
Question 1 investigated the primary scale (city level, across a county, or at a regional
or state) at which an FPC/food policy organization implements its work. Thirty-four of 38
those surveyed responded to this question. Results revealed that 47.06% (n=16) operate at
the county level, 32.35% (n=11) focus at the regional level, and 17.65%(n=6) work at the
state level. Only one respondent identified a focus at the city level (2.94%). Respondents
could only select one geographic level that their organization serves.
To further interpret these results, I categorize the responses into two groups “local”
Geo
grap
hic
Are
a

24
(city/county) and “nonlocal” (state/region). Fifty percent identified as serving “local”
regions while the other half worked at the broader, “nonlocal” scales. These patterns
highlight that the actors in Nevada’s food policy system are relatively evenly divided into
local and nonlocal regions.
Q2: What is the length of existence of your policy council/food bank?
Number of Respondents
Figure 2. Length of existence of FPCs/food policy actor
Answer % Count
<1 year 5.88% 2
1-3 years 11.76% 4
>3 years 82.35% 28
Total 100% 34
Table 2. Percentages/count of the length of existence of FPC/ food policy actor
Question 2 was asked to explore how long FPCs have existed to see if there presence
affected future policy. More than 80% (n = 28) of collected responses reported that their
FPC or food policy organization has existed more than 3 years. 11.76 percent (n=4) have
Yea
rs

25
only existed for 1-3 # years. 5.88 percent (n=2) have existed for less than a year.
Summarizing these findings, 82.35% of Nevada Food Policy organizations have existed for
more than three years and 17.64% have existed for less than three years.
Q3: How did you become a member of a food policy council/food bank?
Nomination Style
Figure 3. How an individual became a member of food policy organization/actor
Nu
mb
er o
f R
esp
on
den
ts

26
Answer % Count
Total 100% 33
Nominated and voted in
by FPC 33.33% 11
Self- selecting 27.27% 9
Appointed by someone
in authority 24.24% 8
Other 15.15% 5
Table 3. Percentage/count of how individuals became members of a food policy
organization or actor
Question 3 describes how each FPC or food-policy organization is structured. This
gave insight into how each council in the state formed. 33 of 38 respondents answered this
question with 11 individuals reported being nominated and voted in by a FPC, 9 individuals
were self-selected (personally created position without outside influence), 8 were
appointed by someone of authority, and 5 reported “other”.
27
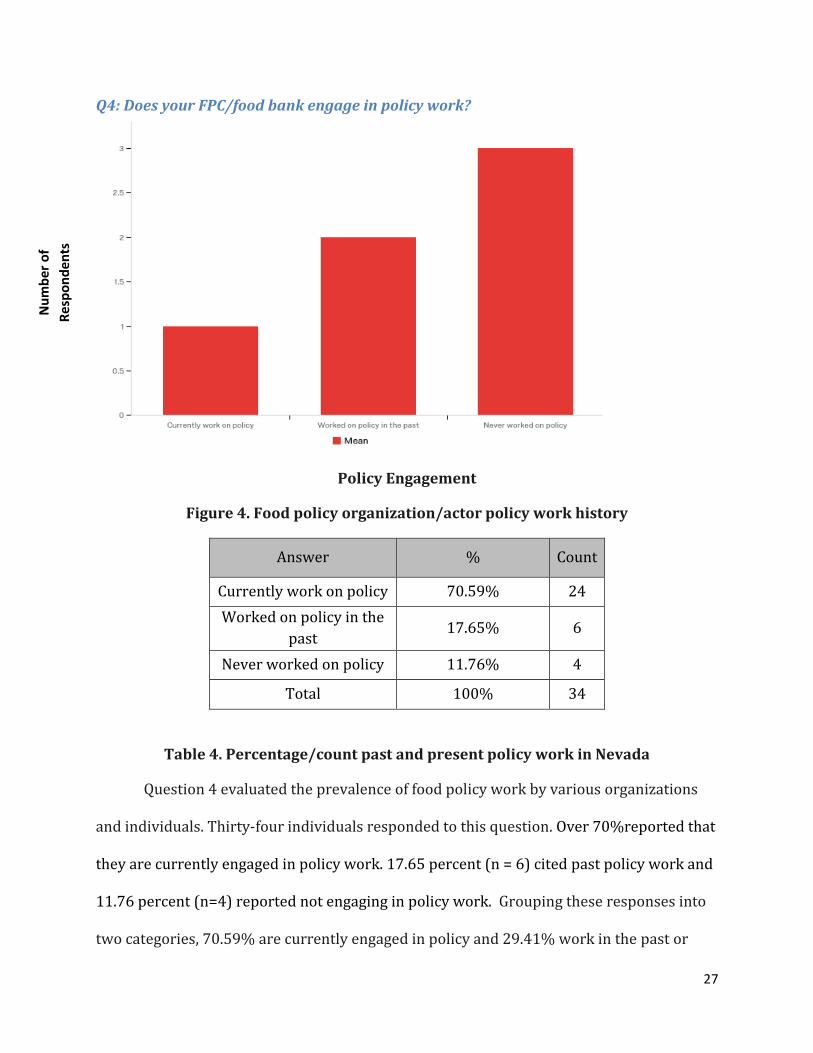
Q4: Does your FPC/food bank engage in policy work?
Policy Engagement
Figure 4. Food policy organization/actor policy work history
Answer % Count
Currently work on policy 70.59% 24
Worked on policy in the
past 17.65% 6
Never worked on policy 11.76% 4
Total 100% 34
Table 4. Percentage/count past and present policy work in Nevada
Question 4 evaluated the prevalence of food policy work by various organizations
and individuals. Thirty-four individuals responded to this question. Over 70%reported that
they are currently engaged in policy work. 17.65 percent (n = 6) cited past policy work and
11.76 percent (n=4) reported not engaging in policy work. Grouping these responses into
two categories, 70.59% are currently engaged in policy and 29.41% work in the past or
Nu
mb
er o
f
Re
spo
nd
ents

28
never engaged in policy work.
Q5: What are the level(s) of policy your council/ food bank engage(s) in?
Level of Engagement
Figure 5. Results Showing the Level of Engagements of FPCs/Food Policy
Organizations and Actors in Nevada
Nu
mb
er o
f R
esp
on
den
ts

29
Answer % Count
Total 100% 31
State 70.97% 22
County 67.74% 21
City 61.29% 19
Institutional (e.g.,
schools, private sector) 32.26% 10
Regional 32.26% 10
Federal 29.03% 9
Table 5. Percentage/count of the level of policy engagement of FPC/food policy
organization and actors in Nevada
Question 5 investigated the scope of engagement in policy for a FPC or food policy
organization. The primary level of engagement in policy work for these organizations was
reported as county (67.74%), state (70.97%) and city (61.29%). From my sample, the
majority of respondents worked most frequently at the state and county level. I divided
these data points into three categories: local (city, county, institutional), non-local
(state/region) and federal level of policy work. . For each of my created categories, the
percentage reflects more than 100% because respondents could submit more than one
answer choice, except for federal.

30
Q6: If you worked on policies in the past, please specify, and what policies are you
currently working on?
Figure 6. Results showing policies addressed by scale in correlation with reported
policy work
1. City and regional planning* 2. School gardens and hoop houses* 3. SNAP* 4. WIC at farmers markets 5. School breakfast* 6. Food Day Proclamation 7. Qualified Allocation plan for housing 8. Statewide Cottage Food Statute 9. Statewide Craft Food Statute 10. Healthy Food Resolution 11. Nevada Housing Division Qualified Allocation Plan 12. Breakfast After the Bell* 13. State and Federal 14. Breakfast After the Bell* 15. Recommendations to the Governor 16. Breakfast After the Bell * 17. Breakfast After the Bell and several pieces to increase
physical activity in schools* 18. SNAP* 19. Child Reauthorization 20. School Gardens* 21. Reno and Sparks City Plans
Table 6. List of Reported Policy Work by FPCs in Nevada
0
10
20
30
40
50
60
Local Nonlocal Federal
State
Regional
Institutional
Federal
County
City

31
Question 6 was an open-ended response question that correlated current policy
work with level of policy engagement. Twenty-one data points were collected and some
responses included more than one policy. Table 1 highlights a list response received for 21
identified types of current policy work, answers with asterisks were cited more than once.
I categorized the open-ended responses into the same groups as identified in Q5.
38% (n = 19) were at the city level, 42% (n=21) were at the county and 20% (n=10) were
‘institutional, 68% identified state (n= 22) and 31.25% were regional (n = 10). Twenty-
nine percent (n = 9) reported working on policies at the federal level.
Q7: In Nevada, what is the largest barrier to FPC's/ food bank policy work?
Question 7 was designed to help identify gaps in current policy work and challenges
to the implementation of legislation. Twenty-three data points were collected from the
open-ended responses and some answers cited more than one barrier.
The data was organized into six categories to highlight: the themes of each
structural barriers (i.e. lack of collaboration between levels of government or
underrepresentation of rural communities, represented 21.7%), (influence i.e. garner
participation from all food system organizations/implement policy the reaches both urban
and rural locations) was 13%), lack of time to properly implement/work on policy
represented 17.3%, policy failure was 8.7%, lack of funding was 17.3%, and lack of
education (i.e. knowledge of eligibility to food programs like discounted school lunch of
8.7%).

32
Answer % Count
Structure 21.70% 5
Influence 13.00% 3
Time 17.30% 4
Policy Failure
8.70% 2
Money 17.30% 4
Education 8.70% 2
Table 7. Reported policies ranked into categories of types of barriers
Q8: Please prioritize from most important (1) to least important (5) the following
issues for Nevada Food Policy Councils/food bank to address.
Number of Respondents
Figure 8. Food policy issue prioritization in the Nevadan food system
Question 8 examined the highest priority challenges within the food system to shape policy
work. Respondents were given the option to put “other” and record an open-ended
response, which included:
Sele
ctio
n o
f P
rio
riti
zed
Fo
od
Sys
tem
Se
cto
r to
Ad
dre
ss

33
1. Food insecurity and hunger
2. Community and Culture
3. Food wholesaling, retailing and marketing
4. Farming and food production
5. Nutrition and public health
a. Other
i. Urban agricultural innovation
ii. Community awareness of both the need and availability of services
iii. Availability of jobs paying living wage
iv. Maximizing federal programs
v. Funding resources
Twenty-three data points were collected and the most important issue facing Nevada was
food insecurity and hunger with nutrition and public health ranking the least important
policy issue to address.

34
Q9: Please, rate the success of the Nevada Food Security Plan 2012 in meeting the
plan's projected goals.
Success Ranking of the Nevada Food Security Plan 2012
Figure 9. Depicts the ranking of success of Nevada Food Security Plan 2012
Answer % Count
Total 100% 31
Moderately Successful 51.61% 16
I Do Not Know 29.03% 9
Somewhat Successful 9.68% 3
Not Very Successful 6.45% 2
Very Successful 3.23% 1
Not Successful at All 0.00% 0
Table 8. Percentage/count of the successfulness of the Nevada food security plan
2012
Nu
mb
er o
f R
esp
on
den
ts

35
Question 9 evaluated the success of the Nevada Food Security Plan 2012. 51.61%
(n=16) cited that the plan was moderately successful, 29.03% (n=9) did not have
knowledge of the plan, 9.68% (n=3) ranked it as somewhat successful, 6.45% (n=2) as not
very successful, and 3.23% (n=1) as very successful.
Q10: Please describe the greatest barrier to the Nevada Food Security Plan 2012 in
meeting its projected goals.
Question 10 investigated limitations to the successful implementation of policy
related to the Nevada Food Security Plan 2012. The greatest barriers to meeting the
projected goals of the Nevada Food Security Plan 2012 were organized into the following
four categories: 1) Lack of Collaboration/Implementation/Commitment Strategies was
60%; 2) Time (i.e. time to meet with all sectors of food system was 15%); 3) Education (i.e.
general populations unawareness of available food subsidy programs was 15%); and 4)
Other (i.e. Unfamiliarity with the Nevada Food Security Plan 2012/did not hold policy
position during the plans creation was 10%)
Answer % Count Collaboration, Implementation, Commitment 60% 12
Time 15% 3
Education 15% 3
Other 10% 2
Table 9. Barriers to the Nevada Food Security Plan 2012 categorized by Barrier Type

36
Discussion
The primary goal of my project was to evaluate the success of FPCs in alleviating
food insecurity, particularly in comparison to more traditional interventions, like food
banks. I also wanted to explore the geography and scope of FPCs in Nevada’s landscape as
rural areas are often overlooked and underserved by more traditional food policy
approaches. Little research has been done to evaluate the scope of FPCs in the policy
process and to identify opportunities and barriers to the successful implementation of FPCs
in Nevada. This project provided an opportunity to use social science to explore the FPC
model in Nevada’s modern landscape and evaluate how a socio-ecological framework
minimizes food insecurity through a more holistic approach. Based on the survey
responses, I was able to discern some barriers and identify potential opportunities to
improve the policy conditions and implementation of FPCs in Nevada.
My sample size and survey design were limiting factors in answering the full scope
of my original research questions. However, there was still useful information that can
inform an evaluation of FPC success in Nevada. To do this, I focused on the most relevant
data and information - specifically questions 1, 2, 5, 6, 7, 8, 9 and 10. While I was not able to
quantify the success of the FPCs in Nevada at remedying food system failures, my survey
increased my understanding of the patterns and potential gaps where FPCs may want to
focus moving forward in the Nevada landscape My questions and results highlighted
potential barriers to the successful implementation of Nevada’s food policy programs and
some insight into opportunities to improve the role that FPCs play.

37
Evaluating the Success of FPCs in Nevada
My survey questions revealed that the food policy organizations and FPCs in
Nevada’s food policy system focus their work at both local and nonlocal scales. However,
my sampling design may have introduced some bias as many of the respondents work for
the Washoe or Clark County and are members of a government agency housed in an urban
center. Since the completion of the 2012 Nevada Food Security Plan, statewide food
insecurity has decreased by 2%, with much of the focus in urban areas. Multiple food
system polices have been implemented due to the Nevada Food Security Plan 2012 that
focus largely on the most vulnerable populations of elderly and children but less so on
statewide food insecurity in rural areas.
Questions 5 and 6 indicate that FPCs are working according to the Nevada Food
Security Plan 2012’s goals, which focused on the most food insecure populations (children,
elderly etc.) at the county and state levels. Federal program tend to be more traditional,
with a concentration on SNAP benefits and other federal programs that can be
administered locally like Meal on Wheels. Federal policy is supposed to have a large scope
of impact that benefits the entire state but a lack of accessibility/knowledge of programs in
the rural regions of Nevada is a barrier to this population receiving these benefits. FPCs in
Nevada are effective at finding community based solutions to these problems.
Despite particular barriers, evidenced by Nevada’s geography and heavily urban
focused food policies, the state’s FPCs have had success in implementing programs using
the socio-ecological model. In question 9 survey respondents ranked the Nevada Food
Security Plan 2012 as “moderately successful”. As supported, by question 10 it has been
difficult to disseminate the plan outside of state organizations but, Nevada overall has

38
benefited from a more strategic investment into the state’s food system since 2012. My
results in question 6 emphasized reported policy work, although mostly at the county level
(question 5) the reported polices offer evidence to the three food security bills introduced
and passed in 2015. One notable success of the Nevada Food Security Plan 2012 through
the State Governor’s Council is the access to subsidized school breakfast increasing 110%
to those eligible because of program SB 503, Breakfast After the Bell (Governors Council on
Food Insecurity Annual Report, 2015). The State Governor’s Council was able to gain hands
on knowledge through the socio-ecological approach to understand that communities were
unaware of subsidized school breakfast and federal SNAP benefits and began implementing
programs to bridge the education barrier. Question 6 of my survey gives insight into the
push to create a better school breakfast program with policy work and created a solution to
the education barrier devised by the Nevada First Lady’s weekly public service
announcements, educating Nevadans on food insecurity and eligibility to programs
(Governors Council on Food Insecurity Annual Report, 2015). My sample size was small but
by evaluating the listed food policy programs in question 6, it was clear that FPCs in the
state have had moderate success (question 9) in dealing with food insecurity and hunger
(question 8) despite the barriers reported in question 7 and 10.
What became abundantly clear from my survey results is that food policy programs
overlap at multiple scales, and that collaboration is a key to successful implementation.
Question 1 and 5 portray the geographic scope and level of policy engagement overlap as
focused specifically on the county level, which requires the use of collaboration if county
policy can have a larger opportunity to reach more of the state. In question 8, food
insecurity and hunger were ranked as the most urgent and important aspects of policy in
39
Nevada, and this is where FPCs are focusing their efforts. Question 6 highlights the
reported policy work as directly addressing food insecurity and hunger more so than the
other options in question 8. Every policy reported in question 6 tied to food insecurity and
hunger more than the other options of community and culture, farming and food
production, food wholesaling, marketing and retailing or nutrition and public health.
Unfortunately, despite the common focus on programs to eliminate food insecurity and
hunger, there is clearly an issue with a lack of collaboration among food policy
organizations that is creating a barrier to achieving greater success.
While the Washoe County Food Council and Southern Nevada Food Council continue
to work on local issues such as Reno and Spark school gardens and physical activity in Las
Vegas Schools as cited in question 6, the State Governor’s Council has impacted larger
portions of the state through continued work under the goals of the Food Security Plan
2012. Question 6 reported work on a Craft Food Initiative, which profits small scale
canning operations and farms. The State Council identified a need in the community that
larger policy makers would have had difficulty seeing through hands on community
engagement and focus groups (Governors Council on Food Insecurity Annual Report,
2015). This effort resulted in the Acidified Foods (Pickle Bill) SB 144, a craft food initiative
that created a value-added opportunity for small farmers to increase their income. Nevada
FPC’s work is often specific and does not have a large enough scale to impact all of the
population. If the identified barrier of a lack of collaboration among levels of food policy
organizations (question 10) was addressed it is the possibility that Nevada FPC/food policy
organizations and actors would be more than “moderately successful”.

40
Question 7 and 10’s open-ended responses display the barrier of lack of
collaboration as the largest block to the success for FPCs/food policy organizations and
actors. One respondent reported the largest barrier to the Nevada Food Security 2012
implementation as, “It [State Governors Food Security Plan 2012] was not disseminated to
the local food councils and they [state council] only engaged their members - they didn't
share it outside of their governor's council.” A lack of collaboration between state and local
policy actors is apparent from this statement. However, even with the difficulty generating
collaboration among food policy organizations in Nevada, the state is on a more strategic
and insightful path to becoming more food secure because of the three FPCs. My survey
results reveal a deep investment into solving food insecurity and hunger and highlight
successful movements towards the goals of the Nevada Food Security Plan 2012.
Food Policy Councils in Nevada are relatively new organizations; none of the
councils have existed for more than three years. It takes great effort by many different
actors in the food system, under diverse pressures, to implement a new style of policy like
the socio-ecological approach as a remedy to food insecurity and hunger. In short, it takes
time to fully develop these programs and even more time to realize their benefits. The
FPCs in Nevada are still young, and my survey results highlight that even though the policy
process is difficult and frustrating, the addition of FPCs into Nevada’s food system offer a
strategic opportunity to achieve a stronger, more collective, and ultimately successful,
structure to remedy food insecurity for the long-term.
Food Policy Councils in Urban and Rural Settings
The main analysis from my survey results was the correlation of level of policy work
(Q5) with the current policy initiatives (Q6). The data portrayed largely county and

41
regional level work. To supplement my data I analyzed current food system polices that the
state council has enacted (e.g., XX ) and the majority of these programs focus on urban
populations and centers. Food system failures in the rural population are currently not well
represented in the food policy system.
Nevada’s geography and spread out population nodes offer challenges to create
policy that is impactful in both an urban and rural settings. The creation of food policy to
address food insecurity and hunger in Reno, Las Vegas, and Carson City target challenges
and identify solutions that are inherently different than in smaller, more rural communities
like Ely, Dayton, and West Wendover. In Nevada, the most food insecure counties, Mineral
(17.8%), Lincoln (15.7%), Nye (15.6%), Churchill (15.3%) and Esmeralda (14.7%) are also
in the most rural counties (Feeding America, 2015). Thus, one of the biggest challenges for
food security in Nevada is accessibility - the most vulnerable populations to food system
failures are also the least visible and the most likely to be disconnected from traditional
food programs. A survey respondent to question 7 stated, “Nevada is one of the driest
states in the US, there are very rural areas with difficultly in accessing any food, let alone a
wide variety of healthy foods.”
The creation of FPCs in Nevada is the best method for overcoming this lack of
accessibly to food assistance and programs because it is a systemic issue, and one that is
most effectively addressed through a socio-ecological approach. FPCs can delve more
deeply into food system failures in rural areas than other policy actors and develop
research-based solutions to community acknowledged problems. The survey responses to
the food system barriers that identified issues such as “proximity to resources”, “lack of
resources” and a “lack of clout” highlight the difficulty that more urban, centralized food

42
programs have had disseminating impactful programs into rural regions. Nevada’s three
FPCs have been working on policy for less than three years and it will take more time to
create policy that will see impacts on a statewide level.
Despite the reported “moderate success” (question 9) to the Nevada Food Security
Plan 2012, FPCs are situated as the most effective body of stakeholders to tackle food
insecurity and hunger at an appropriate scale in Nevada, particularly given the state’s
unique geography. Urban and rural food issues are being analyzed with greater attention to
detail because of these organizations. Updates to the Nevada Food Security Plan 2012
detail reassessing priorities, continued examination of opportunities, and greater public
policy efforts to solve Nevada’s food system failures with more validity than before the
presence of FPCs.
Food Policy Barriers in Nevada
To identify t the largest barriers to food policy in Nevada, I crafted connections
between the open-ended responses by identifying patterns of current policy work
(question 6) with the reported barriers in the state (question 7) and specific challenges in
the Nevada Food Security Plan 2012 (question 10). Based on this, I created a Wordle to
display the most frequently cited obstacles (see Figure XX). A Wordle is a system that
organizes responses into a word cloud and gives prominence to words that appear more
frequently in source text. “Collaboration” surfaces as the most cited barrier to success of
Nevada’s FPCs.

43
Figure XI. Question 10 Wordle showing a lack of collaboration among different levels of the food policy system as the greatest barrier to FPC success.
Creating collaboration in multiple sectors of government does not happen quickly.
One respondent stated, “The goals [of the Nevada Food Security Plan] were pretty broad
and not necessarily within the scope of the FPC but rather require collaborative efforts
across our communities.” Policy implementation in a geographically diverse state is a
challenging process, and generating collaboration to solve food insecurity in both local and
non-local governments is time consuming. Another respondent stated,“…not enough time
and leadership put by state agencies into state, regional and local collaboration; to some
degree associated turf issues.” This again highlights the collaboration problem among
actors in Nevada’s food system.
Under the socio-ecological model, collaboration in all five sectors of the food system:
production, consumption, processing, distribution, and waste recycling is necessary to
ensure success in minimizing food insecurity and hunger on all policy levels. The Nevada
State Governor’s FPCs pushed to increase collaboration between private and public sectors

44
with 2015 passage of Bill AB107, Report of Accountability for Public Schools which
requires school breakfast and lunch eligibility and participation numbers to be reported
(State Governor’s Council on Food Security Annual Report, 2015). The state council is able
to collect these data to better understand the policy gap to increase collaboration among
sectors. In 2012 Nevada ranked 53rd in the US, behind Guam and Puerto Rico and
Washington D.C. for school meal program participation in food insecure populations
(Nevada Food Security Plan, 2012). Due to the work of the state council and the Nevada
First Lady’s School Breakfast Challenge, there is a statewide increase in breakfast
participation of 1.9% and some counties saw an increase in participation as high as 4.73% -
a 110% increase statewide (State Governor’s Council on Food Security Annual Report,
2015).
Nevada is on the right path to increase collaboration in all sectors of the food system
but this process takes time and a strategic effort from all five sectors of the food production
system. Despite reported barriers, Nevada’s food policy actors are making the rights steps
to explore new opportunities and meet new challenges to combat food insecurity and
hunger in the state. FPCs, as new autonomous food policy organizations in Nevada, are
implementing long-term strategies to increase food access and minimize barriers as new
key components of the food system.

45
Recommendations
After analyzing my results I have two recommendations for Nevada FPCs and food
organizations to increase the likelihood of successful policy implementation.
Recommendation: Nevada State Governor’s Food Council structured to include a
representative from each of the 17 counties in Nevada.
Because lack of collaboration was so prevalent in my survey results, it is my
recommendation that Nevada State Governor’s Food Policy Council include representative
from each of the 17 counties. Each representative could participate or have expertise in any
of the five stages of the food production system, but would help establish a well-rounded,
state level organization to create long-term, impactful policy in both rural and urban areas.
With improved representation from each county, individuals in rural areas will have equal
participation and the ability to influence decision-making regarding food system policies
and programs. The intention behind this policy recommendation is to influence the
effectiveness and impact of future decisions at scale throughout Nevada.
The Nevada Food Security Plan 2012 is organized into four parts: Lead, Feed, Grow
and Reach. The “reach” piece of the plan should be updated to better address the gap that
still remains for rural populations. Two goals drive the “Reach” piece of the Food Security
Plan:
1. Change the current models of purchase (commodities) and distribution of nutritious foods to increase economies of scale, and link frequency of deliveries, and availability of local food to the specific needs of communities throughout the State (rural, urban, and food deserts).
2. Develop the technology to connect and share data among multiple state agencies, regional food banks, community agencies, and faith-based organizations for efficient and effective targeting of services and populations (State Governor’s Council on Food Security Annual Report, 2015).

46
The objective is to have Food Policy Councils enact policy programs that reaches the entire
state’s population, and this is an area in which the Food Security Plan is still falling short.
As evidenced by my results, this issue may be successfully remedied by simply improving
representation that may lead to improvements in collaboration. If a member from each
county were represented on the state level FPC, then the specific needs of each community
could be better reflected in agenda setting and policy outcomes.
Recommendation: Increase Nevada’s Opportunity to Achieve FPCs Five Potentials
The Nevada Food Security Plan 2012 and the three food policy councils in Nevada
established goals similar to the five stated potentials in Food First Institutes analysis of
food policy councils in, Food Policy Councils: Lessons Learned (Harper et al., 2009).
According the Harper (2009) food policy councils have five potentials:
1. Address public health through food access, hunger and food insecurity, and
quality of food
2. Affect national and state level policy debates
3. Potential to bring local food policy into the mainstream
4. Potential to address poverty and inequality
5. Potential to boost local economies
Nevada has the possibility to achieve these five potentials and better democratize Nevada’s
food system. The goals established in the Nevada Food Security Plan 2012-lead, feed, grow
and reach-are similar to the five potentials and can be expanded on to create more
successful councils. Nevada stakeholders can achieve potential one by enacting more policy
to fix the grocery store gap. A large portion of Nevada is a food desert, without access to
fresh food. If the state-level FPC were to increase the number of rural stakeholders, the
food desert gap could be better addressed through improved collaboration that bridges the
47
cultural, geographic and educational barrier to fresh food access. Efforts to achieve
potential one could increase public health statewide. Nevada has the opportunity to
achieve potential two through local councils lobbying the state council to create policy that
has a greater scope outside of urban areas. This can be achieved by increasing the number
of rural members on the state council to establish more statewide policy. The First Lady of
Nevada, Kathleen Sandoval, conducts weekly public service announcements about food
insecurity. If these announcements were expanded to identify more local food issues,
potential three could be realized in the state. Nevada has programs to address poverty and
inequality but could improve current food assistance programs by merging the WIC and
SNAP application to streamline the process for applicants. Through doing so, Nevada could
accomplish potential four by combining existing programs to make them more effective
and increase the existing program’s scope. Lastly, potential five is possible in Nevada
through state policy makers focusing more on bills that directly effect local economies like
the SB 144 Acidified Food Bill. Bills like SB 144 are purposed for rural farmers and
communities. Local economies could be greatly impacted through the implementation of
more localized policies.
Future Research Directions
My thesis and the survey I conducted provide the foundation for more
comprehensive evaluation of the Nevada food system and all its various actors and
organizations. Organizing and analyzing my results surfaced additional questions that
could be more deeply explored. For example, there needs to be a more direct exploration
of the differences in food insecurity in urban and rural regions and how to best address

48
those differences through policy implementation. My survey lacked sufficient data points
from rural areas, and focusing on this geography would provide a more complete picture to
inform policy implementation practices and recommendations for improvement. For future
research, I propose expanding the data sample to specific geographic regions and focus on
the different scales of policy implementation.
An additional step is to shift the focus of research to conduct personal interviews
with just the members of the State Governor’s Food Council. This council has the largest
scope of influence and by conducting personal interviews I would be able to directly
question and design my research questions to cull more quantitative data.
Additionally, to further develop my project to better understand food insecurity
from a rural perspective, I would conduct personal interviews of food insecure households
in the five most food insecure counties in the state. This would create data to better relate
the barriers to the food system policy from a different, more rural perspective. By
interviewing households, I could collect data to reveal a different viewpoint than that of
policy actors. My thesis offers a narrow window into Nevada’s food system, but lays the
groundwork from future projects to delve more deeply into specific aspects of food policy
and FPCs.
Conclusions
It was my goal to provide information to those who work on Nevada’s food policy
with useful information and a policy suggestion to improve the food system in the state. My
survey results provided empirical evidence, although mostly limited to qualitative results,
of the successes and barriers to Nevada’s food policy. This evidence offers Nevada FPCs,
food banks and key contributors to food policy an approach to become a more successful

49
government body by increasing collaboration among levels of food policy work. My
research has the potential to bring together the various stakeholders in the Nevadan food
system to make more informed decisions through seeing the overlap of similar concerns in
the state and how the socio-ecological approach is crucial to properly address these policy
problems.
Through my thesis process, I learned a lot about social science and how crucial
survey design is to collect, evaluate, and interpret results with significant meaning. This
was my first experience conducting a social science experiment on this scale and it
definitely taught me that it is difficult to design a strategic and insightful survey that will
elicit quantifiable results. My FPC survey was successful at collecting qualitative data that
offered insight into the patterns in the Nevada Food System and current work of FPC
members. However, my project would have benefitted from a much greater sample size to
be able to analyze more quantitative data. For my survey to give better insight into if
Nevada FPCs are successful or not I would have needed to collect far more data points. I
learned that for a survey based approach project to not have explicit biases in responses
the research design large enough in scale to collect enough information to come to a solid
conclusion. FPC’s in Nevada are mostly successful in meeting their projected goals and
benchmarks as projected by the Nevada Food Security Plan 2012. My research design,
although limited in scope does offer information to FPCs/food policy organizations and
actors to better serve the state.

50
Appendix
1: Survey

51

52
53
Bibliography
Allen, Patricia. Together at the Table: Sustainability and Sustenance in the American Agrifood System. University Park, Penna.: Pennsylvania State UP, 2004. Print.
Aliber, M, and T GB Hart. “Should Subsistence Agriculture Be Supported as a Strategy to Address Rural Food Insecurity?” Agrekon 48.4 (2009): 434–458. Web.
Alkon, Alison Hope, and Teresa Marie Mares. “Food Sovereignty in US Food Movements: Radical Visions and Neoliberal Constraints.” Agriculture and Human Values 29.3 (2012): 347–359. Web. Andrews, Margaret S., and Katherine L. Clancy. "The Political Economy of the Food Stamp
Program in the United States." , 1993. Beitel, Karl. 2005. U.S. Farm Subsidies and the Farm Economy: Myths, Realities, Alternatives Food First Backgrounder, Institute for Food and Development Policy.
Boone-Heinonen J, Gordon-Larsen P, Kiefe CI, Shikany JM, Lewis CE, Popkin BM. Fast Food Restaurants and Food Stores: Longitudinal Associations With Diet in Young to Middle-aged Adults: The CARDIA Study. Arch Intern Med. 2011;171(13):1162-1170. doi:10.1001/archinternmed.2011.283.
Bourque, Martin. "Berkeley Food Policy Council." Interview. Academia.edu, 9 Aug. 2009. Web. 28 Nov. 2016.
Breyer, Betsy, and Adriana Voss-Andreae. “Food Mirages: Geographic and Economic Barriers to Healthful Food Access in Portland, Oregon.” Health & Place 24 (2013): 131 – 139. Web.
Briefel, Ronette R., Ander Wilson, and Philip M. Gleason. “Consumption of Low-Nutrient, Energy-Dense Foods and Beverages at School, Home, and Other Locations among School Lunch Participants and Nonparticipants.” Journal of the American Dietetic Association 109.2, Supplement (2009): S79 – S90. Web.
Carbery, F. A. (2012). Dayton food pantry: 2012 Data summary. Healthy Communities Coalition.
Christian A. Gregory, Alisha Coleman-Jensen; Do High Food Prices Increase Food Insecurity in the United States?. Appl Econ Perspect Policy 2013; 35 (4): 679-707. doi: 10.1093/aepp/ppt024
Clancy, Kate, Janet Hammer, and Debra Lippoldt. "Food Policy Councils Past, Present, and Future." Remaking the North American Food System: Strategies for Sustainability, University of Nebraska Press, 2007, International Bibliography of the Social Sciences (IBSS).

54
Detroit Black Community Food Security Network. 2008. A City of Detroit Policy on Food Security. “Creating a Food Secure Detroit.” http://detroitblackfoodsecurity.org/ id1.html Department of Health and Human Services. (2011). Interim summary of results: Statewide needs survey. Department of Health and Human Services, Grants Management Unit. Coleman-Jensen, Alisha, Matthew Rabbit, Christian Gregory, and Anita Singh. Household Food Security in the United States in 2015. Rep. no. ERR-215. United States Department of Agriculture, Sept. 2016. Web. 20 Nov. 2016.
Ericksen, Polly J., John SI Ingram, and Diana M. Liverman. "Food security and global environmental change: emerging challenges." (2009): 373-377.
Feenstra, G. W. "Local Food Systems and Sustainable Communities." American journal of alternative agriculture., vol. 12, no. 1, 1997., pp. 28-36 Agricultural & Environmental Science Database.
"Food Desert Locator Documentation." USDA Economic Research Service - Home Page. United States Department of Agriculture Economic Research Service.
Food Insecurity in Nevada: Nevada's Plan For Action. Rep. Nevada Department of Health and Human Services, 7 Feb. 2013. Web. 5 Oct. 2016.
"Food Insecurity in the United States." Map.feedingamerica.org. N.p., n.d. Web. 20 Nov. 2016.
Food Stamped. Dir. Yoav Potash and Shira Potash. Perf. Yoav Potash and Shira Potash. Foodstamped.com. N.p., 9 Oct. 2010. Web. 18 Sept. 2016.
Halweil, Brian. 2004. Eat Here: Reclaiming Homegrown Pleasures in a Global Supermarket. New York: Norton/ WorldWatch Books.
Hamilton, Neil D. "The Role of Law in Promoting Sustainable Agriculture." Journal of Sustainable Agriculture, vol. 1, no. 2, 1990., pp. 111-122 Sociological Abstracts.
Hamilton, Neil D. "Putting a face on our food: How state and local food policies can promote the new agriculture." Drake J. Agric. L. 7 (2002): 407.
Hattori A, An R, Sturm R. Neighborhood Food Outlets, Diet, and Obesity Among California Adults, 2007 and 2009. Prev Chronic Dis 2013;10:120123. DOI: http://dx.doi.org/10.5888/pcd10.120123 .
Harper, Alethea, et al. "Food policy councils: Lessons learned." Institute for food and development policy (2009): 1-63.
Harper, Alethea, Annie Shattuck, Eric Holt- Gimenez, Alison Alkon, and Frances Lambrick. Funding For Food Policy Councils: State, County and Local Levels. Digital image. Institute for Food and Development Policy, 2009. Web. 2 Feb. 2017.
55
Harper, Alethea, Annie Shattuck, Eric Holt-Gimenez, Alison Alkon, and Frances Lambrick. 2009. Food Policy Councils: Lessons learned. Oakland, Calif.: Food First Institute for Food and Development Policy.
Harding, Margaret. "Ohio Food Policy Council Looks to Juice Economic Development Potential of State’s Food Industry." Biz Journals [Columbus] 8 May 2009: n. pag. American City Business Journals. Web. 1 Dec. 2016. <http://www.bizjournals.com/columbus/stories/2009/05/11/tidbits4.html>.
Hassanein, Neva. "Practicing Food Democracy: A Pragmatic Politics of Transformation." Journal of Rural Studies, vol. 19, no. 1, 2003., pp. 77 Agricultural & Environmental Science Database.
Hodgson, Kimberly. Food Policy Councils-Food System Policy Briefing Paper. Issue brief. Chicago, IL: American Planning Association, 2011. American Planning Association. Web. 20 Nov. 2016.
Hodgson, Kim, Marcia Caton Campbell, and Martin Bailkey. 2011. Urban Agriculture: Growing Healthy Sustainable Places. Planning Advisory Service Report 563. Chicago: American Planning Association.
"Hunger Facts and Statistics." Feedingamerica.org. Feeding America, 2016. Web. 28 Nov. 2016.
"Hunger and Food Insecurity." Nationalhomeless.org. National Coalition for the Homeless, Nov. 2011. Web. 25 Nov. 2016.
Hunger and Food Insecurity in Nevada. 2012. The Food Bank of Northern Nevada.
Imhoff, Daniel 2007. Food Fight: he Citizen’s Guide to a Food and Farm Bill. Berkeley, California: Watershed Media and University of California Press.
Jimenez, Alejandra. "Denver's 'Food Desert' Mirage : The Road to Health Is Paved with Good Intensions." Completecolorado.com. Complete Colorado, 21 Nov. 2013. Web. 18 Sept. 2016. Johnson, Cassi. “Food Security Partners of Middle Tennessee.” Interview. Academia.edu, 28 Apr. 2009. Web. 29 Nov. 2016. Johnson-Shelton, Deb. “Lane County Food Policy Council.” Interview.
Academia.edu, 2 June. 2009. Web. 28 Nov. 2016.
"Key Statistics and Graphics." USDA.gov. United States Department of Agriculture Economic Research Service, 2016. Web. 20 Nov. 2016.
Lawson, Victoria, Lucy Jarosz, and Anne Bonds. “Building Economies from the Bottom up: (mis)representations of Poverty in the Rural American Northwest.” Social & Cultural Geography 9.7 (2008): 737–753. Web.

56
Levine S. School Lunch Politics: The Surprising History of America’s Favorite Welfare Program. Princeton University Press; 2010:272.
Mittal, Anuradha. 2005. Giving Away the Farm: The 2002 Farm Bill Food First Backgrounder, Institute for Food and Development Policy.
Morton, Lois Wright et al. “Solving the Problems of Iowa Food Deserts: Food Insecurity and Civic Structure*.” Rural Sociology 70.1 (2005): 94–112. Web.
Nestle, Marion. 2002. Food Politics: How the Food Industry Influences Nutrition and Health. Berkeley: University of California Press.
Nord, Mark. “Does It Cost Less to Live in Rural Areas? Evidence from New Data on Food Security and Hunger*.” Rural Sociology 65.1 (2000): 104–125. Web.
Quandt, Sara, and Pamela Rao. “Hunger and Food Security Among Older Adults in a Rural Community.” Human Organization 58.1 (1999): 28–35. Web.
Philpott, Tom. 2006. The 2007 Farm – and Food – Bill. Food First Backgrounder. Institute for Food and Development Policy.
Poppendieck, Janet. Free for All: Fixing School Food in America. Berkeley: U of California, 2010. Print.
Pothukuchi, Kameshwari, and Jerome L. Kaufman. 1999. “Placing the Food System on the Urban Agenda: The Role of Municipal Institutions in Food Systems Planning.” Agriculture and Human Values 16, no. 2 (1999): 213–224.
Rachel Dunifon, Lori Kowaleski‐Jones. “The Influences of Participation in the National School Lunch Program and Food Insecurity on Child Well‐Being.” Social Service Review 77.1 (2003): 72–92. Print.
Scherb, Allyson, et al. "Exploring Food System Policy: A Survey of Food Policy Councils in the United States." Journal of Agriculture, Food Systems, and Community Development, vol. 2, no. 4, 2012., pp. 1-12 Agricultural & Environmental Science Database; ProQuest Central.
Rebecca Schiff. 2007. Food Policy Councils: An Examination of Organisational Structure, Process, and Contribution to Alternative Food Movements. PhD Dissertation. Institute for Sustainability and Technology Policy. Murdoch University. Australia.
Smith, Chery, and Lois W. Morton. “Rural Food Deserts: Low-Income Perspectives on Food Access in Minnesota and Iowa.” Journal of Nutrition Education and Behavior 41.3 (2009): 176–187. Web.
"Southern Nevada Food Council." Gethealthyclarkcounty.org. Southern Nevada Health District, 2016. Web. 15 Nov. 2016.

57
Southern Nevada Food Council White Paper. Tech. Office of Chronic Disease Prevention & Health Promotion, 16 May 2016. Web. 29 Nov. 2016.
Sullivan, D. (2014). From Food Desert to Food Mirage: Race, Social Class, and Food Shopping in a Gentrifying Neighborhood. Advances in Applied Sociology, 4, 30-35. doi: 10.4236/aasoci.2014.41006.
Yeatman, Heather. 1994. Food Policy Councils in North America-Observations and Insights. In Final Report on a World Health Organization’s Traveling Fellowship: University of Wollongong.
Ver Ploeg, Michele, and Vince Breneman. "Food Access Research Atlas." Ers.usda.gov. N.p., n.d. Web. 18 Sept. 2016.
Walker, Renee E., Christopher R. Keane, and Jessica G. Burke. “Disparities and Access to Healthy Food in the United States: A Review of Food Deserts Literature.” Health & Place 16.5 (2010): 876 – 884. Web.
Wang, Ning, Naiqian Zhang, and Maohua Wang. “Wireless Sensors in Agriculture and Food industry—Recent Development and Future Perspective.” Computers and Electronics in Agriculture 50.1 (2006): 1 – 14. Web.
"Washoe County Food Policy Council." Wcfpc.org. Washoe County Food Policy Council, 2016. Web. 20 Nov. 2016.
Webb, K., P. Hawe, and M. Noort. "Collaborative Intersectoral Approaches to Nutrition in a Community on the Urban Fringe." Health education & behavior : the official publication of the Society for Public Health Education, vol. 28, no. 3, 2001., pp. 306 319 ProQuest Biological Science Collection.
Winne, Mark, [1950-]. Closing the Food Gap : Resetting the Table in the Land of Plenty / Mark Winne, Beacon Press, 2008, Agricultural & Environmental Science Database. Wright, James D. et al. “Food Deserts: What Is the Problem? What Is the Solution?” Society 53.2 (2016): 171–181. Web.

58
Recommended