Alternative ingredients in practical diets for Pacific white shrimp (Litopenaeus vannamei)
by
Xuan Qiu
A dissertation submitted to the Graduate Faculty of Auburn University
in partial fulfillment of the requirements for the Degree of
Doctor of Philosophy
Auburn, Alabama May 6, 2017
Keywords: Apparent digestibility coefficients, Bacterial biomass, Fermented yeast, Growth response, Novel soybean cultivars, Ulva meal
Copyright 2017 by Xuan Qiu
Approved by
D. Allen Davis, Chair, Professor of Aquatic Animal Nutrition Claude E. Boyd, Professor of Water Quality
Terry Hanson, Professor of Aquaculture Economics Asheber Abebe, Professor of Mathematics and Statistics
ii
ABSTRACT
It is a well-known that fish meal supplies will not increase as most fisheries are beyond
sustainable limits. If aquaculture and shrimp production in particular is expected to expand, the
industry must move away from fish meal as a primary protein source, particularly in the
production diets. As shrimp are a major aquaculture product and a primary use of fish meal it is
critical that we expand our knowledge of novel protein source which could be used to reduce fish
meal levels in production diets. Towards this goal the present study was dedicated to explore the
potential of novel ingredients (flash dried yeast, non-genetically modified soy cultivars, bacterial
biomass, fish meal analogue, and Ulva meal) as protein sources in practical diets for Pacific
white shrimp, L. vannamei.
The first study was design to evaluate the potential of a novel yeast product flash dried
yeast produced by low pH fermentation of Saccharomyces Pombe as a feed supplement in
practical shrimp feed. Under the conditions of this study, the energy and protein digestibility of
flash dried yeast are significantly lower than FM and SBM. Amino acids digestibility of FDY
was lowest among the three ingredients tested. The use of FDY at 60 g kg-1 caused significant
negative impacts on growth, feed conversion ratio and protein retention. Dietary flash dried yeast
supplementation in the practical diets for Pacific white shrimp had no effects on the proximate
composition of the whole shrimp body. Based on these results, further research regarding the
effects of the low levels (< 40 g kg-1) inclusion of FDY in practical diets on immune responses of
Pacific white shrimp is warranted.
iii
The second study explored non-genetically modified soy cultivars as protein sources in
commercial type shrimp feed formulations. The results indicate that breeding technology and
novel soy processing has the potential to increase the nutritional values of SBM for shrimp feeds.
Observed trends on immune indicators of shrimp to both independent and combined effects of
soy ingredients and fermented yeast were not easily discernible. The variable response may be
related to the difficult in working with shrimp or a suboptimal exposure period.
The third study investigated the effects of a dried fermented biomass as alternative
ingredients for fish meal or soy protein concentrate. Under the reported conditions of the study,
the use of dried fermented biomass can partially replace fish meal up to 50 g kg-1 without
causing negative effects on the growth performance of Pacific white shrimp. However,
completely replacement of fish meal (100 g kg-1) by dried fermented biomass resulted in growth
depression. These results were confirmed in a second trial, which replaced soy protein
concentrate with fermented biomass dried under two methods. The granular dried fermented
biomass worked well as a substitution for soy protein concentrate, however, the inclusion of
spray dried dry fermented biomass at 60 and 120 g kg-1 decreased the growth of shrimp. This
data demonstrates that granular dried fermented biomass is a good nutrient sources and can be
incorporated in practical shrimp feed formulations.
The aim of the fifth study was to evaluate a novel bacterial biomass as a replacement for
soybean meal in practical shrimp feeds. Under the conditions of the present study bacterial
biomass can be utilized up to 4% in shrimp feed without causing growth depression. However,
supplementations (≥ 6%) of bacterial biomass can result in negative effects on growth response,
FCR, and protein as well as amino acids retention efficiency. Negative result of dry matter
digestibility as well as no improvements in the treatments balanced on digestible protein basis
iv
infers that something other than protein is influencing performance. Given that this is a new
technology, there is a need to evaluate BB in term of possible immune stimulation as well as a
nutrient source.
The sixth study was designed to evaluate a fish meal analogue as a replacement for fish
meal in practical shrimp feed. Results indicated that in a practical diet containing 20% fish meal,
fish meal analogue can replace all of the fish meal as long as the diets are supplemented with
inorganic phosphorus without compromising the growth of shrimp. The improvement of growth
when fish meal analogue was incorporated at 4.95% across three trials was not able to be
defined. Given the good growth across the range of inclusion without any indication of a growth
depression, the digestibility of the protein of fish meal analogue would be similar to that of the
fish meal for which it was substituted. Hence, the low nutrient digestibility of fish meal analogue
may due to an atypical response or the product simply does not work with the testing technique.
The seventh study evaluated the potential of Ulva meal Ulva sp. as an alternative protein
source to fish meal and soybean meal in practical shrimp feed. Results demonstrated a clear
depressing in growth as fishmeal was replaced. This data also demonstrated significant
difference between batches of Ulva with the second batch producing the poorest results. To
elucidate if digestible protein was limiting growth, a trial was initiated for which feeds were
formulated on a digestible protein basis. In this trial, growth and survival were significantly
reduced as the level of Ulva meal (Batch 2) was increased. Although, growth and survival was
depressed this was less than that of previous trials, indicating that protein quality may be part of
the problem. However, given the level of protein replacement other components of Ulva meal are
likely to be causing poor performance. To survey possible problems caused by high levels of
minerals the meals and select diets were analyzed for mineral content. Clearly there are shifts in
v
mineral profiles; however, there is no obvious correlation to a mineral and this research team
feels that it is unlikely a mineral toxicity. Other possible reasons which are beyond the scope of
this project but would include anti-nutrients present in the algae. If Ulva meals are to be use to
their full potential, e.g. as a primary protein source, the anti-nutritional components will need to
be identified, specific lines of plants with enhanced nutrient value need to be developed and of
course processing technologies evaluated to produce a high quality commercial product.
There is a clear need to develop sustainable ingredient sources for aquaculture, the use of
soybean meal is clearly a viable option. Besides soybean meal, there are abundant alternative
sustainable ingredients such as yeast, bacterial biomass, seaweed meals, and etc, which exhibited
great potential as both immune enhancer and protein source. Therefore, it is vital for us to
evaluate these potential alternative ingredients and promote a sustainable, environmentally
friendly, and economical aquaculture.
vi
ACKNOWLEDGEMENTS
This dissertation is dedicated to my major advisor Dr. Donald A. Davis. First, I would
like to appreciate the opportunity that he provided for me to participate in his alternative
ingredients for Pacific white shrimp nutrition program. Without his patience, encouragement,
and support, I would hardly complete this thesis. Also, I am grateful to all my other committee
members, Dr. Claude E. Boyd, Dr. Hanson, and Dr. Ash Abebe for their participation and
suggestions in completing this program. Specially thanks to my parents for their infinite love,
encouragement, and support. Also, I would like to show my thanks to all the members in Dr.
Donald A. Davis nutrition lab Guillaume Salze, Melanie Rhodes, Sirirat Chatvijikul, Lay
Nguyen, May Myat Noe Lwin, Charles Roe, Mingming Duan, Ha Van To Pham Thi, Jingping
Guo, Hongyan Tian, Alexandra Amorocho, Elkin Montecino Perez, Romi Novriadi. They helped
and supported me a lot. I offer my deep appreciation to friends, colleagues, students, professors,
and staffs of Swingle Hall for their friendship, hospitality, assistance, knowledge, and support
during the completion of this project. Last but not least, many thanks to Archer Daniels Midland
Company, Binational Agricultural Research & Development Fund (BARD), Hatch Funding
Program of Alabama Agriculture Experiment Station, H.J. Baker & Brothers Inc., Knipbio Inc.,
Navita Premium Feed Ingredients Inc., for providing funding for this research.
vii
Table of Contents
ABSTRACT .................................................................................................................................... ii ACKNOWLEDGEMENTS ........................................................................................................... vi LIST OF TABLES ....................................................................................................................... xiii LIST OF FIFURES........................................................................................................................xx CHAPTER I .................................................................................................................................... 1 Introduction ..................................................................................................................................... 1 REFERENCES ............................................................................................................................... 6 CHAPTER II ................................................................................................................................. 11 EVALUATION OF FLASH DRIED YEAST AS A NUTRITIONAL SUPPLEMENT IN PLANT BASED PRACTICAL DIETS FOR PACIFIC WHITE SHRIMP Litopenaeus vannamei....................................................................................................................................................... 11 1. Introduction ............................................................................................................................... 11 2. Materials and Methods .............................................................................................................. 13
2.1 Experimental diets .......................................................................................................... 13 2.2 Growth trial ..................................................................................................................... 13 2.3 Digestibility trial ............................................................................................................. 15 2.4 Statistical analysis ........................................................................................................... 16
3. Results ....................................................................................................................................... 16 4. Discussion ................................................................................................................................. 18 5. Conclusion................................................................................................................................ 22
viii
6. References................................................................................................................................. 22 CHAPTER III ............................................................................................................................... 37 EVALUATION OF THREE NON-GENETICALLY MODIFIED SOYBEAN CULTIVARS AS INGREDIENTS AND A YEAST-BASED ADDITIVE AS A SUPPLEMENT IN PRACTICAL DIETS FOR PACIFIC WHITE SHRIMP Litopenaeus vannamei ............................................... 37 1. Introduction ............................................................................................................................... 37 2. Materials and Methods .............................................................................................................. 39
2.1 Ingredients preparation ................................................................................................... 39 2.2 Experiment design and diets ........................................................................................... 39 2.3 Growth trials ................................................................................................................... 40 2.4 Physiological assessment ................................................................................................ 41 2.5 Water quality monitoring ................................................................................................ 43 2.6 Statistical analysis ........................................................................................................... 44
3. Results ....................................................................................................................................... 44
3.1. Water quality .................................................................................................................. 44 3.2. Growth trials .................................................................................................................. 44 3.3. Physiology trial .............................................................................................................. 46
4. Discussion ................................................................................................................................. 47 5. Conclusion ................................................................................................................................ 52 References ..................................................................................................................................... 53 CHAPTER IV ............................................................................................................................... 70 EVALUATION OF DRIED FERMENTED BIOMASS AS A FEED INGREDIENT IN PLANT-BASED PRACTICAL DIETS FOR JUVENILE PACIFIC WHITE SHRIMP Litopenaeus vannamei ....................................................................................................................................... 70 1. Introduction ............................................................................................................................... 70 2. Material and Methods ............................................................................................................... 71
ix
2.1. Experimental design and diets ....................................................................................... 71 2.2. Growth trials .................................................................................................................. 72 2.3. Water quality monitoring ............................................................................................... 73 2.4. Statistical analysis .......................................................................................................... 73
3. Results ....................................................................................................................................... 74
3.1. Water quality .................................................................................................................. 74 3.2. Growth trials .................................................................................................................. 74 3.3. Whole body composition ............................................................................................... 75 3.4. ANCOVA output ........................................................................................................... 75
4. Discussion ................................................................................................................................. 75 5. Conclusion ................................................................................................................................ 81 References ..................................................................................................................................... 81 CHAPTER V ................................................................................................................................ 95 EVALUATION OF A NOVEL BACTERIAL BIOMASS AS A SUBSTITUTION FOR SOYBEAN MEAL IN PLANT-BASED PRACTICAL DIETS FOR PACIFIC WHITE SHRIMP Litopenaeus vannamei .................................................................................................................. 95 1. Introduction ............................................................................................................................... 95 2. Material and Methods ............................................................................................................... 96
2.1. Experimental design and diets ....................................................................................... 96 2.2. Growth trials .................................................................................................................. 98 2.3. Water quality monitoring ............................................................................................. 100 2.4. Digestibility trial .......................................................................................................... 100
2.5. Statistical analysis ........................................................................................................ 101
3. Results ..................................................................................................................................... 102
x
3.1. Water quality ................................................................................................................ 102 3.2. Growth trials ................................................................................................................ 102 3.3. Whole body composition ............................................................................................. 103 3.4. Protein and amino acid retentions ................................................................................ 104 3.5. Digestibility trial .......................................................................................................... 105
4. Discussion ............................................................................................................................... 105 5. Conclusion .............................................................................................................................. 110 References ................................................................................................................................... 110 CHAPTER VI ............................................................................................................................. 133 EVALUATION OF A FISH MEAL ANALOGUE AS A REPLACEMENT FOR FISH MEAL IN PRACTICAL DIETS FOR PACIFIC WHITE SHRIMP Litopenaeus vannamei ................. 133 1. Introduction ............................................................................................................................. 133 2. Materials and Methods ............................................................................................................ 134
2.1. Experimental design and diets ..................................................................................... 134 2.2. Growth trials ................................................................................................................ 135 2.3. Water quality monitoring ............................................................................................. 137 2.4. Digestibility trial .......................................................................................................... 137 2.5. Statistical analysis ........................................................................................................ 139
3. Results ..................................................................................................................................... 139
3.1. Water quality ................................................................................................................ 139 3.2. Growth trial .................................................................................................................. 140 3.3. Digestibility trial .......................................................................................................... 141
4. Discussion ............................................................................................................................... 142
xi
5. Conclusion .............................................................................................................................. 147 References ................................................................................................................................... 147 CHAPTER VII ............................................................................................................................ 168 UTILIZATION OF GREEN SEAWEED ULVA sp. AS A PROTEIN SOURCE IN PRACTICAL DIETS FOR PACIFIC WHITE SHRIMP Litopenaeus vannamei ............................................. 168 1. Introduction ............................................................................................................................. 168 2. Materials and Methods ............................................................................................................ 170
2.1. Experimental diets ....................................................................................................... 170 2.2. Growth trials ................................................................................................................ 172 2.3. Water quality monitoring ............................................................................................. 174 2.4. Digestibility trial .......................................................................................................... 174 2.5. Statistical analysis ........................................................................................................ 176
3. Results ..................................................................................................................................... 176
3.1. Water quality ................................................................................................................ 176 3.2. Growth performances ................................................................................................... 177 3.3. Proximate composition and amino acid profile of whole shrimp body ....................... 178 3.4. Protein and amino acids retention ................................................................................ 179 3.5. Regression analysis ...................................................................................................... 181 3.6. Digestibility trial .......................................................................................................... 181
4. Discussion ............................................................................................................................... 182
4.1. Ingredient composition ................................................................................................ 182 4.2. Nutrient digestibility .................................................................................................... 184 4.3. Growth performance and survival ............................................................................... 186 4.4. Body compositions ...................................................................................................... 191

xii
4.5. Protein and amino acid retention ................................................................................. 192
5. Discussion ............................................................................................................................... 194 References ................................................................................................................................... 194
xiii
LIST OF TABLES Chapter II Table 1 Formulation and chemical composition of test diets used in the growth trial. ................ 29 Table 2 Proximate composition, phosphorus content, and amino acid profile of the ingredients
used in the growth and digestibility trials. ............................................................................ 30 Table 3 Proximate composition (g kg-1 as is) and amino acid profile (% as is) of the test diets
used in the growth trial. ........................................................................................................ 31 Table 4 Composition of reference diet for the determination of digestibility coefficients of flash
dried yeast (FDY), fishmeal (FM), and soybean meal (SBM). ............................................ 32 Table 5 Performance of juvenile Pacific white shrimp L. vannamei (1.78±0.03g) offered diets
with different flash dried yeast (FDY) levels (0, 10, 20, 40, and 60 g kg-1) for six weeks. . 33 Table 6 Proximate analysis of whole shrimp body offered diets with different flash dried yeast
(FDY) levels (0, 10, 20, 40, and 60 g kg-1) for six weeks. .................................................... 34 Table 7 Apparent dry matter (ADMD), apparent energy (ADE) and apparent protein (ADP)
digestibility values for the diet (D) and ingredient (I) using 70:30 replacement technique offered to Pacific white shrimp L. vannamei. ....................................................................... 35
Table 8 Apparent amino acids (AA) digestibility value for the soybean meal (SBM), fish meal
(FM) and flash dried yeast (FDY) using 70:30 replacement technique offered to Pacific white shrimp L. vannamei. .................................................................................................... 36
Chapter III Table 1 Formulation and chemical composition of test diets used in the growth trial ................. 57 Table 2 Proximate analysis (as is g 100 g-1), trypsin inhibitors levels (TIU g-1), acid detergent
fiber (ADF) and neutral detergent fiber (NDF) (as is g 100 g-1), phosphorus (as is g 100 g-1), urease activity (pH increase), protein dispersibility index (PDI), starch (as is g 100 g-1) and amino acid (AA) profiles (as is g 100 g-1) of solvent extracted soybean meal (SBM), navita 1, 2, and 3 utilized in the trials. ............................................................................................. 59
xiv
Table 3 Proximate analysis (as is g 100 g-1), trypsin inhibitors levels (TIU/g), and amino acid (AA) profiles (as is g 100 g-1) of the test diets utilized in the trials. ..................................... 61
Table 4 Response of juvenile Litopenaeus vannamei (Initial weight 0.15±0.01g, 46 days in trial
1; initial weight 0.20±0.01g, 35 days in trial 2) offered diets with different soybean ingredients at varying levels and w/o fermented yeast. ........................................................ 63
Table 5 Principle component analysis of trypsin inhibitors and essential amino acids of diets. .. 65 Table 6 Multiple linear regression of weight gain (WG) and feed conversion ratio (FCR) with
first three principle components (PC1 PC2 and PC3). ......................................................... 66 Table 7 Pearson correlation coefficients of growth performances (final biomass, final mean
weight, and weight gain), feed conversion ratio (FCR), and survival with trypsin inhibitors, methionine and protein levels of the diets. The first line of each cell is the value of correlation coefficient and the second line of each cell is P-value. ...................................... 67
Table 8 Two-way analysis output of stress and immune response of Pacific white shrimp L.
vannamei fed with different soy sources and fermented yeast product levels. ..................... 68 Chapter IV Table 1 Composition (g kg-1 as is) of test diets utilized in trial 1. ................................................ 86 Table 2 Composition (g kg-1 as is) of test diets utilized in trial 2. ................................................ 87 Table 3 Proximate composition, and amino acid profile of dried fermented biomass used in trial
1 (DFB) and 2 (SDFB and GDFB have identical nutrient compositions), fish meal (FM), soy protein concentrate (SPC), and corn protein concentrate (CPC). ................................... 89
Table 4 Proximate composition and amino acid profile of the test diets used in trial 2. .............. 90 Table 5 Performance of juvenile shrimp L. vannamei (Initial weight 0.59 g) offered diets with
different dried fermented biomass (DFB) levels (0, 25, 50, and 100 g kg-1) for six weeks in trial 1. .................................................................................................................................... 92
Table 6 Performance of juvenile shrimp L. vannamei (Initial weight 2.34 g) when shrimp were
offered diets with different levels (0, 20, 40, 60, and 120 g kg-1) of spray dry (S) and granular (G) dried fermented biomass (DFB) for six weeks in trial 2. ................................. 93
Table 7 Proximate analysis (g kg-1) of whole shrimp body when shrimp were offered diets with
different levels (0, 20, 40, 60, and 120 g kg-1) of spray dry (S) and granular (G) dried fermented biomass (DFB) for six weeks in trial 2. ............................................................... 94
Table 8 Analysis of covariance (ANCOVA) output of performance and proximate composition
of whole shrimp body data in trial 2. .................................................................................... 95
xv
Chapter V Table 1 Composition (% as is) of test diets utilized in trial 1. .................................................... 116 Table 2 Composition (% as is) of test diets utilized in trial 2. .................................................... 117 Table 3 Composition (% as is) of test diets utilized in trial 3. .................................................... 118 Table 4 Composition of reference diet for the determination of digestibility coefficients of
bacteria biomass (BB) ......................................................................................................... 119 Table 5 Proximate composition (% as is), phosphorus content (% as is), and amino acid profile (%
as is) of the ingredients used in the growth and digestibility trials. .................................... 120 Table 6 Proximate composition (% as is) and amino acid profile (% as is) of the test diets used in
trial 1. .................................................................................................................................. 121 Table 7 Proximate composition (% as is) and amino acid profile (% as is) of the test diets used in
trial 2. .................................................................................................................................. 122 Table 8 Proximate composition1 (% as is) and mineral composition1 (g kg-1: phosphorus, sulfur,
potassium, magnesium, calcium, sodium; mg kg-1: iron, manganese, copper, zinc) of the test diets used in trial 3. ............................................................................................................. 123
Table 9 Performance of juvenile shrimp L. vannamei (Initial weight 1.51g) offered diets with
different bacterial biomass levels (0, 6, and 12 %) for six weeks in trial 1. ....................... 124 Table 10 Performance of juvenile shrimp L. vannamei (Initial weight 0.98g) offered diets with
different bacteria biomass levels (0, 1, 2, 4, 6, and 12 %) for six weeks in trial 2. ............ 125 Table 11 Performance of juvenile shrimp L. vannamei (Initial weight 0.15g) offered diets
formulated to partially replace soybean meal on a digestible protein basis for six weeks in trial 3. .................................................................................................................................. 126
Table 12 Proximate composition2 (moisture: % as is; protein and lipid: % dry weight) and amino
acid profile2 (% dry weight) of whole shrimp body offered diets with different bacteria biomass levels (0, 1, 2, 4, 6, and 12 %) for six weeks in trial 2. ........................................ 127
Table 13 Protein2 and amino acids3 retention efficiencies of Pacific white shrimp at the
conclusion of a 6-week growth trial 2 in which shrimp were offered diets formulated to contain different bacteria biomass levels (0, 1, 2, 4, 6, and 12 %). .................................... 129
Table 14 Proximate composition of whole shrimp body and protein retention efficiency (PRE)
offered diets formulated to utilize bacterial biomass (BB) partially replace soybean meal on a digestible protein basis for six weeks in trial 3. ............................................................... 131
xvi
Table 15 Apparent dry matter (ADM), apparent energy (AED) and apparent protein (APD)
digestibility values for the diet (D) and ingredient (I) using 70:30 replacement technique offered to Pacific white shrimp L. vannamei. ..................................................................... 132
Table 16 Apparent amino acids (AA) digestibility value for the soybean meal (SBM), fish meal
(FM), bacteria biomass (BB) using 70:30 replacement technique offered to Pacific white shrimp L. vannamei. ............................................................................................................ 133
Chapter VI Table 1 Composition (% as is) of test diets used in the growth trial 1 and 2. ............................ 154 Table 2 Composition (% as is) of test diets used in the growth trial 3. ...................................... 155 Table 3 Composition of reference diet for the determination of digestibility coefficients of fish
meal analogue (FMA), fish meal (FM), and soybean meal (SBM). ................................... 156 Table 4 Proximate composition1, phosphorus content1, and amino acid profile1 of the ingredients
used in the growth and digestibility trials. .......................................................................... 157 Table 5 Proximate composition1 (% as is), mineral composition (% as is: phosphorus, sulfur,
potassium, magnesium, calcium, sodium; mg kg-1 as is: iron, manganese, copper, zinc)2 and amino acid profile1 (% as is) of the test diets used in the growth trial 1 and 2. .................. 158
Table 6 Proximate composition1 (% as is), mineral composition (% as is: phosphorus, sulfur,
potassium, magnesium, calcium, sodium; mg kg-1 as is: iron, manganese, copper, zinc)2 and amino acid profile1 (% as is) of the test diets used in the growth trial 3. ........................... 160
Table 7 Performance of juvenile Pacific white shrimp L. vannamei (Initial weight: 0.47, 0.40,
0.25 g in trial 1, 2, and 3, respectively) offered diets with different fish meal analogue (FMA) levels (0, 4.85, 9.70, 14.55, and 19.44%) replacing different levels of fish meal for six weeks. ............................................................................................................................ 162
Table 8 Pearson correlation coefficients of final biomass, final mean weight, weight gain (WG),
feed conversion ratio (FCR), and survival in trial 1 and trial 2 with phosphorus levels of the diets. The first line of each cell is the value of correlation coefficient and the second line of each cell is P-value. ............................................................................................................ 164
Table 9 Whole body proximate composition (% dry weight basis), phosphorus content (P, % dry
weight basis), and protein and phosphorus retention (%) when shrimp were offered diets supplemented with different fish meal analogue levels replacing fish meal without balanced for phosphorus for six weeks in trial 2. ............................................................................... 165
Table 10 Whole body proximate1 composition, mineral composition1, and protein and
phosphorus retention when shrimp were offered diets supplemented with different fish meal

xvii
analogue levels replacing different levels of fish meal balance for phosphorus for six weeks in trial 3. .............................................................................................................................. 166
Table 11 Apparent dry matter (ADM), apparent energy (AED) and apparent protein (APD)
digestibility values for the diet (D) and ingredient (I) using 70:30 replacement technique offered to Pacific white shrimp L. vannamei. ..................................................................... 167
Table 12 Apparent amino acids (AA) digestibility value for the soybean meal (SBM), fish meal
(FM), poultry meal (PM), and fish meal analogue (FMA) using 70:30 replacement technique offered to Pacific white shrimp L. vannamei. .................................................... 168
ChapterVII Table 1 Proximate composition1, phosphorus content1, and amino acid profile1 of the primary
protein sources used in diet formulations. .......................................................................... 204 Table 2 Mineral composition1 of the three batches Ulva meal (UM1, UM2, and UM3) utilized in
feed formulations. ............................................................................................................... 205 Table 3 Proximate1 and mineral1 composition of Ulva meal 2 (UM2) utilized in trial 2 and 3
collected from seven different dates. .................................................................................. 206 Table 4a Formulation of test diets designed to evaluate Ulva meal 1 (UM1) as a replacement for
fish meal on an iso-nitrogenous basis (Trial 1). .................................................................. 207 Table 4b Proximate composition1 and amino acid profile1 of the test diets used in the trial 1. . 208 Table 4c Protein retention efficiency and growth performance of juvenile Pacific white shrimp
(0.26±0.02g) offered diets with different Ulva meal 1 levels (0, 6.35, 12.70, 19.05, and 25.40%) as a fish meal replacement over a six-week growth trial (Trial 1). ...................... 209
Table 4d Proximate3 analysis of whole shrimp body offered varying Ulva meal 1 levels (0, 6.35,
12.70, 19.05, and 25.40%) as a replacement of fish meal over a six-week growth trial (Trial 1). ........................................................................................................................................ 210
Table 5a Formulation of test diets designed to evaluate three batches of Ulva meal (UM1, UM2,
and UM3) as a replacement for soybean meal on an iso-nitrogenous basis (Trial 2). ........ 211 Table 5b Proximate composition1, phosphorus content1, and amino acid profile1 of the test diets
used in the trial 2. ................................................................................................................ 213 Table 5c Mineral profile1 of the test diets used in the trial 2. ..................................................... 214 Table 5d Growth performance of juvenile Pacific white shrimp (0.24±0.01g) offered diets with
different levels of three batches Ulva meal (UM1, UM2, and UM3) for five weeks (Trial 2).............................................................................................................................................. 215
xviii
Table 5e Proximate composition2 and amino acid profile2 of whole shrimp body offered diets
contain different levels of three batches Ulva meal (UM1, UM2, and UM3) levels in trial 2.............................................................................................................................................. 216
Table 5f Protein2 and amino acids3 retention efficiencies of Pacific white shrimp offered varying
Ulva meal 2 levels diets in trial 2 for five weeks. ............................................................... 218 Table 6a Formulation of test diets designed to evaluate Ulva meal 1, 2, and 3 as a replacement
for soybean meal on a digestible protein basis (Trial 3). .................................................... 220 Table 6b Proximate composition1, mineral composition2, and amino acid profile1 of the test diets
used in trial 3. ...................................................................................................................... 222 Table 6c Growth performance of juvenile Pacific white shrimp L. vannamei (Initial weight
0.98g) offered diets formulated to partially replace soybean meal on a digestible protein basis with three different batches of Ulva meal over six weeks (Trial 3). .......................... 224
Table 6d Proximate composition2 and amino acids profile2 of shrimp at the conclusion of a 6-
week growth trial in which shrimp were offered diets formulated to partially replace soybean meal on a digestible protein basis with three different batches of Ulva meal (Trial 3). ........................................................................................................................................ 225
Table 6e Protein2 and amino acid3 retention efficiency of Pacific white shrimp at the conclusion
of a 6-week growth trial in which shrimp were offered diets formulated to partially replace soybean meal on a digestible protein basis with three different batches of Ulva meal (Trial 3). ........................................................................................................................................ 226
Table 7a Formulation of test diets designed to evaluate Ulva meal 4 as a protein source in trial 4
............................................................................................................................................. 227 Table 7b Proximate composition1, mineral composition2 and amino acid profile1 of the test diets
used in trial 4. ...................................................................................................................... 228 Table 7c Performance of juvenile Pacific white shrimp L. vannamei (Initial weight 0.15g)
offered diets formulated to evaluate Ulva meal 4 as a replacement for soybean meal and fish meal on an iso-nitrogen basis in juvenile shrimp over six weeks (Trial 4). ....................... 230
Table 7d Proximate2 composition of shrimp at the conclusion of a 6-week growth trial in which
shrimp were offered diets formulated to evaluate Ulva meal 4 as a replacement for soybean meal and fish meal on an iso-nitrogen basis in juvenile shrimp (Trial 3). .......................... 231
Table 8a Composition of reference diet for the determination of digestibility coefficients of Ulva
meal 1 and 2. ....................................................................................................................... 232
xix
Table 8b Apparent dry matter (ADM), apparent energy (AED) and apparent protein (APD) digestibility values for the diet (D) and ingredient (I) using 70:30 replacement technique offered to Pacific white shrimp (L. vannamei) ................................................................... 233
Table 8c Apparent amino acids (AA) digestibility value for the soybean meal (SBM), fish meal
(FM), Ulva meal 1 (UM1) and Ulva meal 2 (UM2) using 70:30 replacement technique offered to Pacific white shrimp (L. vannamei) ................................................................... 233
xx
List of Figures
Figure 1 (a) In trial 1, relationship between weight gain (y) of shrimp and incorporation levels of Ulva meal 1 levels (x) in the diets. The regression line is described by y = 0.1686x3 - 6.2114x2 + 34.409x + 1797.8 (R2 = 0.4922, P < 0.0001). (b) In trial 1, relationship between FCR (y) and supplemental Ulva meal levels (x) in the diets. The regression line is described by y = 0.0276x + 1.7708 (R2 = 0.3582, P = 0.0001). (c) In trial 1, relationship between lipid content (y) of shrimp body and supplemental Ulva meal levels (x) in the diets. The regression line is described by y = -0.0962x + 7.4 (R2 = 0.3503, P = 0.0002)……………………………………………………….241 Figure 2 (a) In trial 2, relationship between weight gain (y) and Ulva meal 2 levels (x) in the diets. The regression line is described by y = 1.1925x2 -62.699x + 1713.1 (R2 = 0.6815, P < 0.0001). (b) In trial 2, relationship between FCR (y) and supplemental Ulva meal 2 levels (x) in the diets. The regression line is described by y = -0.0703x + 1.5451 (R2 = 0.4766, P < 0.0001). (c) In trial 2, relationship between survival (y) and supplemental Ulva meal 2 levels (x) in the diets. The regression line is described by y = -1.1607x + 100.27 (R2 = 0.6113, P < 0.0001). (d) In trial 2, relationship between lipid content (y) of shrimp body and supplemental Ulva meal 2 levels (x) in the diets. The regression line is described by y = 0.0078x2 - 0.4095x + 7.8033 (R2 = 0.9051, P < 0.0001)………………………………………………………………………………………..242 Figure 3 (a) In trial 4, relationship between weight gain (y) of shrimp and incorporation levels of Ulva meal 4 levels (x) in the diets. The regression line is described by y = 2.6848x2 - 119.17x + 3049.3 (R2 = 0.6934, P < 0.0001). (b) In trial 4, relationship between FCR (y) and supplemental Ulva meal 4 levels (x) in the diets. The regression line is described by y = 0.06x + 1.8532 (R2 = 0.721, P < 0.0001). (c) In trial 4, relationship between lipid content (y) of shrimp body and supplemental Ulva meal 4 levels (x) in the diets. The regression line is described by y = -0.1903x + 7.9555 (R2 = 0.7224, P < 0.0001)…………………………………………………………….243

1
CHAPTER I
Introduction
Pacific white shrimp, Litopenaeus vannamei is native to the Eastern Pacific coast from
Gulf of California, Mexico to Tumbes, North of Peru (PeÂrez Farfante and Kensley, 1997). It is
well known for its ability to grow and survive well under a wide range of environmental and
artificial culture conditions, Adaptability to commercial culture has made it the primary cultured
shrimp species as well as atop aquaculture commodity (Roy et al., 2009). The production of
Pacific white shrimp increased from 0.15 million metric tons in 2000 to 4.5 million metric tons
in 2016 (Anderson, 2016), and was estimated to increase to 9.2 million tonnes in 2020 (Tacon
and Metian, 2008). The USA was the top global import market for imported shrimp in 2015,
with 0.59 million tonnes imported, and the import value reached 5.46 billion dollars in 2015
(FAO, 2015).
Feed represents one of the largest variable costs associated with fed culture systems;
reducing feed costs can produce considerable savings (Davis and Sookying, 2009).
Manufacturing of marine shrimp feed uses 24% to 27% of the world’s fish meal (Tacon and
Metian, 2008) making them one of the prime consumers. Commercial shrimp feed formulations
historically contain from 25% to 50% fish meal, which represents the primary and most
expensive protein ingredient (Dersjant-Li, 2002; Tacon and Metian, 2008). Fish meal (FM) is
preferred among other protein sources because it is an excellent source of essential nutrients such
as protein and indispensable amino acids, essential fatty acids, cholesterol, vitamins, minerals
attractants and unidentified growth factors (Samocha et al., 2004; Swick et al., 1995). The cost of
FM has increased over time because of increased demand, limitations of availability, and
growing social and environmental concerns regarding wild fish extraction practices (Tacon and
2
Metian, 2008). Due to limited supply and increasing prices, we must shift our emphasis and use
this ingredient only when nutrient requirements of the animal demand its use (Davis and
Sookying, 2009).
To develop sustainable and environmentally friendly aquaculture, various terrestrial
plant-based ingredients that contain high protein content are potential alternative sources for fish
meal (NRC, 2011). Terrestrial plant-based protein sources such as soybean meal, canola meal,
corn gluten meal are available worldwide and have a relatively low cost compared to fish meal.
Among plant protein sources, soybean meal (SBM) is the most abundant and has received
considerable attention as a replacement for fish meal in aquatic animal feeds because of its
availability, balanced amino acid profile and consistent composition (Akiyama, 1989; Akiyama
et al., 1991; Amaya et al., 2007; Hardy, 1999; Samocha et al., 2004; Swick et al., 1995; Tacon,
2000). However, the presence of anti-nutritional factors (ANF) such as lectins, oligosaccharides,
saponins, and trypsin inhibitors, can limit the inclusion levels of SBM in some aquaculture feeds.
Moreover, as the popularity of SBM as a feed ingredient increased, its price continued to
increase from 185.02 dollars per metric ton in 2001 to 443.41 dollars per metric ton in 2016. In
addition, application of terrestrial plant protein such as SBM in aquaculture feeds may affect the
food costs for human communities in developing countries (Delgado et al., 2002; 2003).
As shrimp culture has become an expanded and intensified economic activity, the
demand for more cost-effective and sustainable protein sources continues to increase. In this
instance, incorporation of marine plant protein (i.e. macro-algae) in aquaculture feeds would be
an alternative strategy to reduce the reliance on FM and terrestrial plant protein sources such as
SBM. The chemical composition of macro-algae can be influenced by both physical and
chemical factors such as temperature, salinity, light (Lobban and Harrison, 1994) and nutrient

3
concentrations (Björnsäter and Wheeler, 1990; Floreto et al., 1996; García‐Ferris et al., 1996)
during cultivation. Therefore, the product quality including protein content, lipid content, and
tissue pigmentation of macro-algae can be somewhat manipulated by controlling the main
parameters of cultivation (i.e. nutrient loading, stocking density, mixing regime, etc.) (Guerin
and Bird, 1987; Neori, 1996; Shpigel et al., 1999). Nitrogen-enriched conditions like the
effluents of fish or shrimp farms, where seaweeds are used as bio-filters, can enhance their
protein contents (Lahaye et al., 1995; Pinchetti et al., 1998). Lipid content can be raised by
manipulations of nutrient supply and other growth parameters. Macro-algae are also rich sources
of minerals (7% to 38% dry weight basis) with a broad mineral composition including Bo, Ca,
Cl, Co, Cu, F, Fe, I, K, Mg, Mn, Mo, Na, Ni, P, S, Se, Zn.
Macro-algae can benefit from recycling waste carbon dioxide (CO2) from combustive
energy production (that otherwise pollutes the atmosphere) and waste nutrients produced by
intensive aquaculture operations, agriculture, intensive animal operations, municipal waste
treatment, and the like (Kaushik and Troell, 2010; Sargent and Tacon, 1999). In an integrated
cultivation system, the macro-algae use the metabolic residues of animals as nutrients, absorb
CO2 and produce O2 for the environment (Marinho-Soriano et al., 2008). The interaction allows
the excretion of an organism to serve as food for another (Qian et al., 1996). Presently,
significant improvements in growth and survival rate have been observed when Pacific white
shrimp, Litopenaeus vannamei (Cruz-Suárez et al., 2010), tiger shrimp, Penaeous monodon Fabr
(Izzati, 2012; Tsutsui et al., 2010), and yellowtail shrimp, Farfantepenaeus californiensis
(Portillo‐Clark et al., 2012) are co-cultured with macro-algae.
Macro-algae have been demonstrated to replace small fractions (1 to 4%) of FM content
in diets of Sea bass, Dicentrarchus labrax (Valente et al., 2006), Rainbow trout, Oncorhynchus
4
mykiss (Soler-Vila et al., 2009; Yıldırım et al., 2009) and Pacific white shrimp (Rodríguez-
González et al., 2014). Growth responses when high levels of algae are used to replace FM
content in diets of aquatic animals vary. Xu et al. (2011) reported that weight gain of teleost fish,
Siganus canaliculatus was significantly decreased when using seaweed Gracilaria
lemaneiformis to replace 10% FM. However, Stadtlander et al. (2013) indicated that 7.5 and 15%
FM replacement by red alga Nori Porphyra yezoensis Ueda did not significantly affect the
growth performance of Nile tilapia, Oreochromis niloticus.
Besides macro-algae, bacteria biomass is another potential feed ingredient as a
replacement for FM and SBM in aquaculture feeds. Rapid growth and high protein content are
well known properties of bacteria in protein production (Anupama and Ravindra, 2000; Kuhad et
al., 1997; Stringer, 1982). Methane, the main component of natural gas, which is found widely in
nature (Hanson and Hanson, 1996; Dalton, 2005) is an attractive substrate for bacterial protein
production. The abundant supply, cheap transportation, and reasonable cost of natural gas,
indicate that protein production from natural gas could be realistic on a large scale (Overland et
al., 2010).
The naturally occurring methanotroph Methylococcus capsulatus (Bath) has shown high
efficiency in production of bacterial protein from methane (Bothe et al., 2002). Considerable
researches have been carried out on the bacterial meal, produced from mainly methane by natural
gas fermentation, as a protein source for a number of fish species, including Atlantic salmon,
Salmo salar (Aas et al., 2006a; Berge et al., 2005), rainbow trout, Oncorhynchus mykiss (Aas et
al., 2006b; Kiessling and Askbrandt, 1993; Storebakken et al., 2004), and Atlantic halibut,
Hippoglossus hippoglossus (Aas et al., 2007), and Florida pompano, Trachinotus carolinus
(Melanie et al., 2015). However, the growth responses of the fish in these studies to the bacterial
5
meal are not consistent, which may due to the different fish species and various bacterial strains.
Information about the nutrient digestibility values of bacterial meal is still limited. However,
information about protein digestibility of the diets contained bacterial meal is available.
Storebakken et al., 1998 reported that the apparent protein, fat and energy digestibility of the diet
that contained 20% bacterial meal replacing 20% FM were 89.7%, 88.3%, and 82.1%,
respectively, which were close to those of FM-based diet (91.5%, 90%, and 86%, respectively).
Given the great potential of the alternative ingredients provided above, it is important for
us to explore the nutritional value of these products in order to ensure sustainability and options
for feed formulator. Therefore the purpose of this research is to evaluate the utilization of
potential alternative ingredient in practical diets for Pacific white shrimp, L. vannamei.

6
REFERENCES
Akiyama, D.M., 1989. Soybean meal utilization by marine shrimp, Proceeding of the world
congress, Vegetable protein utilization in human foods and animal feedstuffs. American
Oil Chemists Society, Champaign, Illinois, USA, pp. 252-265.
Akiyama, D.M., Dominy, W., Lawrence, A.L., 1991. Penaeid shrimp nutrition for the
commercial feed industry: Revised, Proceedings of the Aquaculture Feed Processing and
Nutrition Workshop, Thailand and Indonesia, September, pp. 19-25.
Amaya, E.A., Davis, D.A., Rouse, D.B., 2007. Replacement of fish meal in practical diets for the
Pacific white shrimp (Litopenaeus vannamei) reared under pond conditions. Aquaculture
262, 393-401.
Björnsäter, B.R., Wheeler, P.A., 1990. Effect of nitrogen and phosphorus supply on growth and
tissue composition of Ulva fenestrata and Enteromorpha intestinalis (ulvales,
chlorophyta) 1. Journal of Phycology. 26, 603-611.
Cruz-Suárez, L.E., León, A., Peña-Rodríguez, A., Rodríguez-Peña, G., Moll, B., Ricque-Marie,
D., 2010. Shrimp/Ulva co-culture: a sustainable alternative to diminish the need for
artificial feed and improve shrimp quality. Aquaculture. 301, 64-68.
Davis, D.A., Sookying, D., 2009. Strategies for reducing and/or replacing fishmeal in production
diets for the Pacific white shrimp, Litopenaeus vannamei. The rising tide 108-114.
Delgado, C.L., Rosegrant, M.W., Meijer, S., Wada, N., and Ahmed, M., 2002. Fish as Food:
Projections to 2020.
Delgado, C.L., Wada, N., Rosegrant, M.W, Siet Meijer, S., and Ahmed, M., 2003. Outlook for
Fish to 2020, Meeting Global Demand. A 2020 Vision for Food, Agriculture, and the
7
Environment Initiative, International Food Policy Research Institute, Washington,D.C.,
U.S.A. World Fish Center, Penang, Malaysia, 33 pages.
Dersjant-Li, Y., 2002. The use of soy protein in aquafeeds. Avances en Nutricion Acuicola VI.
Memorias del VI Simposium Internacional de Nutricion Acuicola. 3, 541-558.
Floreto, E.A.T., Teshima, S., Ishikawa, M., 1996. Effects of nitrogen and phosphorus on the
growth and fatty acid composition of Ulva pertusa Kjellman (Chlorophyta). Botanica
marina. 39, 69-74.
García‐Ferris, C., Ríos, A., Ascaso, C., Moreno, J., 1996. Correlated biochemical and
ultrastructural changes in nitrogen‐starved euglena gracilis1. Journal of phycology. 32,
953-963.
Guerin, J.M., and Bird, K.T., 1987. Effects of aeration period on the productivity and agar
quality of Gracilaria sp. Aquaculture, 64(2):105-110.
Hardy, R.W., 1999. Aquaculture’s rapid growth requirements for alternate protein sources. Feed
Management 50, 25-28.
Izzati, M., 2012. The role of seaweeds Sargassum polycistum and Gracilaria verrucosa on
growth performance and biomass production of tiger shrimp (Penaeous Monodon Fabr).
Journal of Coastal Development. 14, 235-241.
Kaushik, S., Troell, M., 2010. Taking the fish-in fish-out ratio a step further. Aquac. Eur.
35(1):15-17.
Lahaye, M., Gomez‐Pinchetti, J.L., del Rio, M.J., Garcia‐Reina, G., 1995. Natural decoloration
composition and increase in dietary fibre content of an edible marine algae, Ulva rigida
(Chlorophyta), grown under different nitrogen conditions. Journal of the Science of Food
and Agriculture. 68, 99-104.
8
Lobban, C.S., Harrison, P.J., 1994. Seaweed ecology and physiology. Cambridge University
Press.
Neori, A., 1996. The form of N-supply (ammonia or nitrate) determines the performance of
seaweed biofilters integrated with intensive fish culture. Israeli J. Aquacult. Bamidgeh
48:19-27.
NRC, 2011. Nutrient requirements of fish and shrimp. National academies press.
PeÂrez Farfante, I., Kensley, B., 1997. Penaeoid and sergestoid shrimps and prawns of the
world. Keys and diagnoses for the families and genera. MeÂm Mus natn Hist Nat, Paris
175, 1-79.
Pinchetti, J.L.G., del Campo Fernández, E., Díez, P.M., Reina, G.G., 1998. Nitrogen availability
influences the biochemical composition and photosynthesis of tank-cultivated Ulva rigida
(Chlorophyta). Journal of Applied Phycology. 10, 383-389.
Portillo‐Clark, G., Casillas‐Hernández, R., Servín‐Villegas, R., Magallón‐Barajas, F.J., 2012.
Growth and survival of the juvenile yellowleg shrimp Farfantepenaeus californiensis
cohabiting with the green feather alga Caulerpa sertularioides at different temperatures.
Aquaculture Research. 44, 22-30.
Samocha, T.M., Davis, D.A., Saoud, I.P., DeBault, K., 2004. Substitution of fish meal by co-
extruded soybean poultry by-product meal in practical diets for the Pacific white shrimp,
Litopenaeus vannamei. Aquaculture 231, 197-203.
Sargent J.R. and Tacon A.G., 1999. Development of farmed fish: a nutritionally necessary
alternative to meat. Proc. Nutr. Soc. 58:377-83.
9
Shpigel, M., Ragg, N.L., Lupatsch, I., Neori, A., 1999. Protein content determines the nutritional
value of the seaweed Ulva lactuca L for the abalone Haliotis tuberculata L. and H. discus
hannai INO. J. Shellfish Res. 18:227-233.
Soler-Vila, A., Coughlan, S., Guiry, M.D., Kraan, S., 2009. The red alga Porphyra dioica as a
fish-feed ingredient for rainbow trout (Oncorhynchus mykiss): effects on growth, feed
efficiency, and carcass composition. Journal of Applied Phycology. 21, 617-624.
Sororzano, L., 1969. Determination of ammonia in natural waters by the phenolhypochlorite
method. Limnol Oceanogr. 14, 799-801.
Spotte, S., 1979. Fish and invertebrate culture: water management in closed systems.
Stadtlander, T., Khalil, W.K.B., Focken, U., Becker, K., 2013. Effects of low and medium levels
of red alga Nori (Porphyra yezoensis Ueda) in the diets on growth, feed utilization and
metabolism in intensively fed Nile tilapia, Oreochromis niloticus (L.). Aquaculture
Nutrition. 19, 64-73.
Swick, R.A., Akiyama, D.M., Boonyaratpalin, M., Creswell, D.C., 1995. Use of soybean meal
and synthetic methionine in shrimp feed. American Soybean Association. Technical
Bulletin.
Tacon, A.G.J., 2000. Rendered animal by-products: a necessity in aquafeeds for the new
millennium. Global Aquaculture Advocate 3, 18-19.
Tacon, A.G.J., Metian, M., 2008. Global overview on the use of fish meal and fish oil in
industrially compounded aquafeeds: trends and future prospects. Aquaculture 285, 146-
158.
Tsutsui, I., Kanjanaworakul, P., Srisapoome, P., Aue-umneoy, D., Hamano, K., 2010. Growth of
giant tiger prawn, Penaeus monodon Fabricius, under co-culture with a discarded
10
filamentous seaweed, Chaetomorpha ligustica (Kützing) Kützing, at an aquarium-scale.
Aquaculture international. 18, 545-553.
Valente, L.M.P., Gouveia, A., Rema, P., Matos, J., Gomes, E.F., Pinto, I.S., 2006. Evaluation of
three seaweeds Gracilaria bursa-pastoris, Ulva rigida and Gracilaria cornea as dietary
ingredients in European sea bass (Dicentrarchus labrax) juveniles. Aquaculture. 252, 85-
91.
Xu, S., Zhang, L., Wu, Q., Liu, X., Wang, S., You, C., Li, Y., 2011. Evaluation of dried seaweed
Gracilaria lemaneiformis as an ingredient in diets for teleost fish Siganus canaliculatus.
Aquaculture International. 19, 1007-1018.
Yıldırım, Ö., Ergün, S., Dernekbaşı, S.Y., Türker, A., 2009. Effects of two seaweeds (Ulva
lactuca and Enteremorpha linza) as a feed additive in diets on growth peformance, feed
utilization and body composition of rainbow trout (Oncorhynchus mykiss).
11
CHAPTER II
EVALUATION OF FLASH DRIED YEAST AS A NUTRITIONAL SUPPLEMENT IN
PLANT BASED PRACTICAL DIETS FOR PACIFIC WHITE SHRIMP Litopenaeus
vannamei
1. Introduction
As shrimp culture has become an expanded and intensified economic activity, bacterial
and viral diseases are considered to threaten the further progress of semi-intensive and intensive
shrimp culture (Pérez-Sánchez et al. 2014). Antibiotics have been utilized to supplement in the
shrimp feeds for prevention and treatment of diseases (Cabello 2006; Taylor et al. 2011).
However, the use of antibiotics may develop bacterial strains that are more resistant to antibiotic
treatment, meanwhile the antibiotic residues in cultured animals may pose negative impacts on
human health (Sharifuzzaman & Austin 2009). To tackle disease problems and avoid potential
disadvantages of antibiotics, a number of alternative strategies such as the use of vaccine,
immunostimulants, probiotics, and prebiotics have received considerable attention (Li & Gatlin
2005).
The probiotics are usually members of the healthy microbiota associated with the host
(Pérez‐Sánchez et al. 2014). They can prevent bacterial diseases by producing inhibitory
compounds to create a hostile environment for pathogens, competing for essential nutrients and
adhesion sites or modulating the immune response (Merrifield et al. 2010). Probiotic effects in
aquaculture are not only limited to intestinal tract of aquatic animals, but also can improve the
health of the host by controlling pathogens and improving water quality (Verschuere et al. 2000;
Zheng et al. 2012).
12
Yeast is one of the probiotics, which is commonly used in aquaculture either alive to feed
live food organisms, or after processing, as a feed ingredient (Stones & Mills 2004). Yeast cells
contain β-glucans, nucleic acid, oligosaccharides, as well as polyamines, which may help to
improve the immune response and growth performance as well as metabolism in fish and shrimp
(Gatesoupe 2007). Yeasts are frequently used as a dietary supplement in fish and shrimp feeds to
increase growth performance, feed intake, survival and disease resistance (Deng et al. 2013; Essa
et al. 2011; Hoseinifar et al. 2011; Li & Gatlin 2003; 2004; 2005; Sheikhzadeh et al. 2012; Shen
et al. 2010; Vechklang et al. 2012; Yang et al. 2010) as well as an alternative protein sources for
fishmeal (Gause & Trushenski 2011a; b; Hauptman et al. 2014; Lunger et al. 2006; Oliva-Teles
& Gonçalves 2001; Peterson et al. 2012).
The two common yeasts that used in aquaculture feeds are brewers yeast Saccharomyces
cerevisiae (BY), which is a natural product of the brewing industry and grain distillers dried
yeast (GDDY), which is a co-product obtained from the bioethanol industry. The yeast product
utilized in the present study is flash dried yeast (FDY) that is a novel product produced by low
pH fermentation of Saccharomyces Pombe.
Albeit there are some studies demonstrating positive effects of various yeast supplements
in Pacific white shrimp diets on the disease tolerance and growth performance, there is limited
data in apparent digestibility coefficients of yeast products. Hence, The objectives of this project
was to determine the growth response of Pacific white shrimp juveniles to increasing FDY levels
in a soybean meal based feed formulation and determined apparent digestibility values for yeast
as compared to other protein sources.
13
2. Materials and Methods
2.1 Experimental diets
All test diets were formulated to be isonitrogenous and isolipidic (350 g kg-1 protein and
80 g kg-1 lipid). For the growth trial, five experimental diets were formulated. The first diet or
basal diet did not contain FDY. Whereas the next four diets contained FDY at increasing levels
(10, 20, 40, and 60 g kg-1) (Table 1). The reference diet (Table 4) for ingredient digestibility trial
was formulated to include 10 g kg-1 chromic oxide as inert marker. Test diets were made using a
70:30 mixture of the reference diet and test ingredients.
Primary ingredients (Table 2) were analyzed for proximate composition in the diets
formulated. Pre-ground dry ingredient and oil were mixed in a food mixer (Hobart Corporation,
Troy, OH, USA) for 15 min. Hot water was then blended into the mixture to obtain a consistency
appropriate for pelleting. Diets were pressure-pelleted using a meat grinder with a 3-mm die, air-
dried (< 50 °C) to a moisture content of 80-100 g kg-1. Pellets were crumbled, packed in sealed
plastic bags and stored in a freezer until needed. The diets were analyzed at University of
Missouri Agricultural Experiment Station Chemical Laboratories (Columbia, MO, USA) for
proximate composition (g kg-1 as is) and amino acid profile (% as is) (Table 3).
2.2 Growth trial
The growth trial utilized 5 treatments with 5 replicates in each treatment. It was
conducted in a semi-closed recirculation system. Juvenile shrimp were obtained from the nursery
system and selected by hand-sorting to a uniform size. Juvenile shrimp (initial weight 1.78±0.03
g) were stocked into 25 tanks with 10 shrimps in each aquarium (80 L). A sub-sample of shrimp
from the initial stocking was retained for whole body samples to be utilized for later protein
14
retention analysis. As shrimp are difficult to handle, intermittent weights were not taken.
However, shrimp were counted to readjust daily feed input on a weekly basis. Based on
historical results, a fixed ration was calculated assuming a 1.8 feed conversion ratio and 0.8 to
1.4 g week-1. Consequently, for each tank a fixed ration of 2.31 g day-1 for the first week, 2.83 g
day-1 for the second week, 2.90 g day-1 for the third week, and 3.09 g day-1 for the forth week,
3.34 g day-1 for the fifth week, and 3.6 g day-1 for the six week was offered over 4 feedings.
Dissolved oxygen (DO), temperature, and salinity were measured twice daily by using a
YSI 650 multi-parameter instrument (YSI, Yellow Springs, OH, USA). pH was measured twice
weekly by using a waterproof pHTestr30 (Oakton instrument, Vernon Hills, IL, USA). Water
samples were taken to measure total ammonia-nitrogen (TAN) and nitrite every week. TAN and
nitrite were determined by using the methods described by Solorzano (1969) and Spotte (1979),
respectively. During the experiment period DO, temperature, salinity, pH, TAN, and nitrite were
maintained within acceptable ranges for L. vannamei at 5.36±0.26 mg L-1, 29.0±1.2 °C, 13.1±0.3
g L-1, 7.45±0.33, 0.066±0.0048 mg L-1, and 0.040±0.037 mg L-1, respectively.
Shrimps were counted to readjust daily feed input on a weekly basis. At the conclusion of
6-week growth trial, shrimps were counted and group weighted. Mean final weight, feed
conversion ratio (FCR), weight gain (WG), biomass, and survival were determined. After
obtaining the final total weight of shrimps in each aquarium, 4 shrimps were randomly selected
and frozen at -20 °C for subsequent determination of whole body composition. Proximate
composition of whole shrimp was analyzed by University of Missouri-Columbia, Agriculture
Experiment Station Chemical Laboratory (Columbia, MO, USA). Protein retention was
calculated as follows:
15
Protein retention (%) = (final weight × final protein content) - (initial weight × initial protein
content) × 100 / protein offered.
2.3 Digestibility trial
The digestibility trial was conducted in the mentioned recirculation system and utilized
six shrimp per aquaria with six aquaria per dietary treatment. Once acclimated for three days to
the test diets, feces from two aquaria were pooled (n=3) and collected over a five-day period or
until adequate samples were obtained. To obtain fecal samples, the aquaria were cleaned by
siphoning before each feeding with the first collection of the day discarded. After cleaning, the
shrimp were offered an excess of feed and then about 1 hour later feed was removed and feces
were collected by siphoning onto a 500 µm mesh screen. Collected feces were rinsed with
distilled water, dried at 105 °C until a constant weight was obtained, and then stored in freezer
(−20 °C) until analyzed. Apparent digestibility coefficients for dry matter, protein, energy, and
amino acids were determined by using chromic oxide (Cr2O3, 10 g kg -1) as an inert marker.
Chromium concentrations were determined by the method of McGinnis and Kasting (1964) in
which, after a colorimetric reaction, absorbance is read on a spectrophotometer (Spectronic
genesis 5, Milton Roy Co., Rochester, NY, USA) at 540 nm. Gross energy of diets and fecal
samples were analyzed with a Semi micro-bomb calorimeter (Model 1425, Parr Instrument Co.,
Moline, IL, USA). Protein of diets and fecal samples were determined by micro-Kjeldahl
analysis (Ma and Zuazaga, 1942). Amino acids were analyzed by University of Missouri-
Columbia, Agriculture Experiment Station Chemical Laboratory. The apparent digestibility
coefficient of dry matter (ADMD), protein (ADP), energy (ADE), and amino acids (ADAA)
were calculated according to Cho et al. (1982) as follows:
16
ADMD (%)= 100 − [100 × (% Cr2O3 in feed / % Cr2O3 in feces)]
ADP, ADE, and ADAA (%)=100 − [100 × (% Cr2O3 in feed / % Cr2O3 in feces) × (% nutrient in
feces / % nutrient in feed]
The apparent digestibility coefficients of the test ingredients for dry matter, energy,
protein and amino acids were calculated according to Bureau & Hua (2006) as follows:
ADCtest ingredient = ADCtest diet + [(ADCtest diet – ADCref. diet) × (0.7 × Dref / 0.3 × Dingr)]
where Dref = % nutrient (or KJ/g gross energy) of reference diet mash (as is); Dingr = % nutrient
(or KJ/g gross energy) of test ingredient (as is).
2.4 Statistical analysis
All the data were analyzed using SAS (V9.3. SAS Institute, Cary, NC, USA). Data from
the growth and digestibility trial were analyzed using one-way ANOVA to determine significant
differences (P<0.05) among treatments followed by the Tukey’s multiple comparison test to
determine difference between treatments. Arcsine square root transformation was used prior to
analysis for the proportion data in growth and digestibility trial. False discover rate (FDR)
controlling procedures were used to adjust the P-value in order to control the FDR for the amino
acids digestibility data.
3. Results
Performances and protein retention efficiency of Pacific white shrimp, L. vannamei
offered diets contained different FDY levels are presented in Table 5. Final biomass, final mean
weight, WG, FCR, and PRE of Pacific white shrimp were not significantly influenced when
17
FDY was utilized up to 40 g kg-1 of the diet. However, significantly reduced growth, feed
utilization, and PRE were observed when FDY was supplemented at 60 g kg-1 feed.
Proximate analysis of whole shrimp body offered diets with FDY levels are presented in
Table 6. Supplementation of FDY in the practical diets of Pacific white shrimp did not affect
protein (791.9 to 810.9 g kg-1), moisture (767.5 to 776.4 g kg-1), lipid (50.0 to 65.3 g kg-1), crude
fiber (52.8 to 56.9 g kg-1), and ash (119.9 to 124.7 g kg-1) content of whole shrimp body.
ADMD, ADE, and ADP for the diet (D) and ingredient (I) using 70:30 replacement
technique offered to Pacific white shrimp are presented in Table 7. The digestibility trial
contained a range of ingredients; hence, we have provided a few other ingredients as a reference.
The analyzed proximate composition of FDY as compares to fishmeal was lower in total protein
and lipid content (Table 2). In order to confirm the results, fecal samples for basal diet and FM
diet were recollected. FM1 and FM2 represent the first collection and second collection,
respectively. Basal diet 1 and Basal diet 2 represent first collection and second collection basal
diet, respectively. The results turned out to be quite similar, which indicated that the feces
collection and samples analysis methods we utilized in the digestibility study are consistent. The
energy and protein digestibility of FDY were 38.20% and 53.47%, respectively, which are
significantly lower than fishmeal (FM) and soybean meal (SBM).
Apparent amino acids (AA) digestibility values for the SBM, FM, and FDY using 70:30
replacement technique offered to Pacific white shrimp are presented in Table 8. The analyzed
amino acids composition of FDY as compared to FM was lower in concentrations of individual
amino acids especially the two common limiting amino acids (methionine and lysine) for Pacific
white shrimp (Table 2). Apparent digestibility coefficients of alanine, arginine, aspartic acid,
cysteine, glutamic acid, histidine, isoleucine, leucine, lysine, methionine, phenylalanine, proline,
18
serine, threonine, tryptophan, tyrosine, valine and total amino acids of FDY were similar to those
of FM but significantly lower than those of SBM. Glycine and hydroxylysine digestibility of
FDY were significantly lower than both those of FM and SBM.
4. Discussion
Yeast is a feed ingredient that can originate from a wide range of sources and has shown
its potential to be used as nutritional supplement and protein source in production diets
(Achupallas et al. 2015; Gause & Trushenski 2011a). The digestibility of a feed ingredient can
provide estimates of nutrient availability in the ingredient, which helps to select ingredients that
optimize the nutritional value and cost of the formulated feed (Brunson et al. 1997).
Unfortunately, nutrient digestibility may show a high inconsistency due to the feeding practices,
environmental conditions, feed processes as well as diet digestibility approaches (Brunson et al.
1997). Protein digestibility of FM in the current study for the two collected samples (FM1 and
FM2) are 67.07% and 71.30%, respectively. Terrazas-Fierro et al. (2010) reported that protein
digestibility of various FMs for Pacific white shrimp ranged from 62.7% to 84.9%. Brunson et
al. (1997) indicated that protein digestibility of FM for white shrimp Penaeus setiferus is
75.85%. The protein availability of FM in the current study falls into the range of protein
digestibility of FMs tested by other researchers. The similar results of basal diet and FM diet
from the two fecal samples collection points to consistency in the feces collection and sample
analysis methods. With regards to the protein digestibility of SBM, it was tested to be 97.03%,
which falls into the ranges of protein digestibility (80.3% to 98.3%) of various SBMs for Pacific
whites shrimp (Cruz-Suarez et al. 2009; Fang et al. 2015; Liu et al. 2012; Yang et al. 2009; Zhou
et al. 2015).
19
In the present study, protein and energy digestibility of FDY were significantly lower
than those of FM and SBM. Amino acids digestibility of FDY was lowest among the three
ingredients tested. Yeast is not typically utilized as protein source in the production diets, hence
only a few studies have evaluated the digestibility values of the yeasts. Hauptman et al. (2014)
reported that protein digestibility (97.6%) of GDDY for rainbow trout Oncorhynchus mykiss was
similar to anchovy fishmeal (97%), soy protein concentrate (99%) and wheat gluten meal
(100%), however, digestibility coefficients for dry matter and energy of GDDY were
significantly lower than those of fishmeal which most likely due to the relatively high nitrogen
free extract content of the ingredient. Amino acids digestibility of the GDDY for rainbow trout O.
mykiss were lower than those of menhaden fishmeal (Hauptman et al. 2014). Rumsey et al.
(1991) indicated that energy and protein digestibility of intact BY and its fractions for rainbow
trout O. mykiss ranged from 62.6 to 77.9% and 63.2 to 84.7%, respectively. Energy and protein
digestibility coefficients of FDY for Pacific white shrimp were lower compared to digestibility
coefficients of GDDY and BY for rainbow trout, which most likely due to the different species
of aquatic animals and various kinds of yeasts utilized in the experiments.
Yeast can serve as a source of dietary nucleotides, which have been shown to stimulate
the immune response, metabolism, and growth in aquatic animals (Gatesoupe 2007). Dietary
yeast supplementation at low levels (no more than 20 g kg-1) as a nutritional supplement in
aquatic animals diets has been demonstrated to improve the growth performance and immune
response in many aquaculture species including African catfish Clarias gariepinus (Essa et al.
2011), hybrid striped bass Morone chrysops × M. saxatilis (Li & Gatlin 2004; 2005), rainbow
trout O. mykiss (Sheikhzadeh et al. 2012), channel catfish Ictalurus punctatus (Li et al. 2011),
20
beluga Huso huso (Hoseinifar et al. 2011), and Pacific white shrimp L. vannamei (Deng et al.
2013; Yang et al. 2010).
With regards to the present growth trial, WG, FCR, and survival of Pacific white shrimp
were not significantly influenced when FDY was utilized up to 40 g kg-1 of the diet. However,
significantly reduced WG and FCR were detected when FDY was incorporated at 60 g kg-1 feed.
The results of present study are in agreement with Li & Gatlin (2003), who reported that WG,
feed efficiency and survival of hybrid stripped bass (Morone chrysops × M. saxatilis) were not
significantly affected when brewer yeast was utilized up to 40 g kg-1 of the diet. Similarly,
Vechklang et al (2012) indicated that WG, feed intake, and survival of Nile tilapia Oreocbromis
niloticus were not significantly influenced when brewer yeast or GroBioti-A were utilized up to
20 g kg-1 of the diet. By contrast, the use of GDDY at the inclusion level up to 300 g kg-1 could
be utilized in diets without causing adverse effects on growth performance of Pacific white
shrimp L. vannamei in a clear water system without natural foods (Achupallas et al. 2016). Also,
Achupallas et al. (2015) demonstrated that in a pond and outdoor green water trial growth
performance of Pacific white shrimp L. vannamei was not significantly affected when GDDY
was used up to 150 g kg-1 feed. GDDY has the potential to be utilized as a protein source and
included at a high level in the diets, which has been confirmed by Gause & Trushenski (2011a;b)
that GDDY at the inclusion level up to 413.3 g kg-1 could be used in diets without causing
negative impacts on the growth performance of sunshine bass and Hauptman et al. (2014) that
WG and FCR of rainbow trout O. mykiss was not affected when GDDY was used up to 112.0 g
kg-1 of the diet.
Variations in the outcome of present study and study conducted by Achupallas et al.
(2016) and Achupallas et al. (2015) may result from different yeasts types. In the present
21
digestibility trial, the protein digestibility of FDY is significantly lower than protein digestibility
of soybean meal. However, the differences of the digestible protein levels between the basal diet
and the diet contains 60 g kg-1 FDY is around 10 g kg-1, which cannot result in the reduced
growth performance of Pacific white shrimp. Also amino acids levels in all the diets (Table 2)
are above the requirements of Pacific white shrimp, thus amino acids deficiency should not be
the factor that caused the negative impact on growth response in the current study. As the
inclusion levels of FDY increased in the diet formulation, we observed the stickiness of the diets
increased during the extrusion, which may increase digesta viscosity and reduce palatability of
the experimental diets. Another possible reason for the reduced growth response may because the
over stimulation of immune response as the inclusion levels of FDY increased.
PRE was not significantly affected when FDY was utilized up to 40 g kg-1 of the diet in
the present study. However, significantly reduced PRE was observed when FDY supplemented
at 60 g kg-1 feed. Hauptman et al. (2014) reported that no significant differences were observed
in PRE when rainbow trout fed with diets contain up to 295.0 g kg-1 GDDY. By contrast, PRE of
sea bass Dicentrarchus labrax was significantly improved when BY was supplemented up to 548
g kg-1 in the diet (Oliva-Teles & Gonçalves 2001). PRE was determined by a number of factors
including dietary protein levels, feed intake, final weight and initial weight of animals as well as
the final and initial protein content of animals (Halver & Hardy 2002). In the current study, no
significant differences were found in dietary protein levels, feed offered to the shrimp, and
protein content of whole shrimp body. The significantly reduced PRE should be caused by the
decreased weight gain of shrimp in the current study.
In the current study, no significant differences were observed in whole body composition
(moisture, protein, lipid, ash, crude fiber) of Pacific white shrimp when fed with diets contain up

22
to 60 g kg-1 FDY. Similarly, Li & Gatlin (2003) reported that whole body composition of
juvenile stripped bass was not affected when brewers yeast was utilized up to 40 g kg-1 of the
diet. Vechklang et al. (2012) indicated that no significant differences were observed in whole
body composition (moisture, protein, lipid and ash) of tilapia fed with diets supplemented with
10 and 20 g kg-1 BY. In addition, many other studies also reported that dietary yeast
supplementation had no significant effects on whole body composition of fish (Essa et al. 2011;
Hauptman et al. 2014; Hoseinifar et al. 2011; Li et al. 2005; Sheikhzadeh et al. 2012). However,
it should be noted that in the present study lipid content in the whole shrimp body decreased
from 65.3 g kg-1 to 50.0 g kg-1 on a dry weight basis (P=0.0794) as the FDY supplementation
levels increased from 0 to 60 g kg-1, which indicates that FDY may have a potential to reduce
lipid content of Pacific white shrimp.
5. Conclusion
The energy and protein digestibility of flash dried yeast are significantly lower than FM
and SBM. Amino acids digestibility of FDY was lowest among the three ingredients tested. With
regards to the growth trial, the use of FDY at 60 g kg-1 caused significant negative impacts on
growth, feed conversion ratio and protein retention. Dietary flash dried yeast supplementation in
the practical diets for Pacific white shrimp had no effects on the proximate composition of the
whole shrimp body. Based on these results, further research regarding the effects of the low
levels (< 40 g kg-1) inclusion of FDY in practical diets on immune responses of Pacific white
shrimp is warranted.
23
References
Achupallas, J.M., Zhou, Y. & Davis, D.A. (2016) Use of grain distillers dried yeast in practical
diets for juvenile Pacific white shrimp, Litopenaeus vannamei. J. World Aquac. Soc. 47,
220-229.
Achupallas, J.M., Zhou, Y. & Davis, D.A. (2015) Pond production of Pacific white shrimp,
Litopenaeus vannamei, fed grain distillers dried yeast. Aquac. Nutr. DOI: 10.1111/anu.
12359 (Early view).
Brunson, J.F., Romaire, R.P. & Reigh, R.C. (1997) Apparent digestibility of selected ingredients
in diets for white shrimp Penaeus setiferus L. Aquac. Nutr. 3, 9-16.
Bureau, D.P. & Hua, K. (2006) Letter to the editor of Aquaculture. Aquaculture 252, 103-105.
Cabello, F.C. (2006) Heavy use of prophylactic antibiotics in aquaculture: a growing problem for
human and animal health and for the environment. Environ. Microbiol. 8, 1137-1144.
Cho, C.Y., Slinger, S.J. & Bayley, H.S. (1982) Bioenergetics of salmonid fishes: energy intake,
expenditure and productivity. Comp. Biochem. Physiol. B Comp. Biochem. 73, 25-41.
Cruz-Suárez, L.E., Tapia-Salazar, M., Villarreal-Cavazos, D., Beltran-Rocha, J., Nieto-López,
M.G., Lemme, A. & Ricque-Marie, D. (2009) Apparent dry matter, energy, protein and
amino acid digestibility of four soybean ingredients in white shrimp Litopenaeus
vannamei juveniles. Aquaculture 292, 87-94.
Deng, D., Mei, C., Mai, K., Tan, B.P., Ai, Q. & Ma, H. (2013) Effects of a yeast‐based additive
on growth and immune responses of white shrimp, Litopenaeus vannamei (Boone, 1931),
and aquaculture environment. Aquac. Res. 44, 1348-1357.
Essa, M.A., Mabrouk, H.A., Mohamed, R.A. & Michael, F.R. (2011) Evaluating different
additive levels of yeast, Saccharomyces cerevisiae, on the growth and production
24
performances of a hybrid of two populations of Egyptian African catfish, Clarias
gariepinus. Aquaculture 320, 137-141.
Fang, X., Yu, D., Buentello, A., Zeng, P. & Davis, D.A. (2016) Evaluation of new non-
genetically modified soybean varieties as ingredients in practical diets for Litopenaeus
vannamei. Aquaculture 451, 178-185.
Gatesoupe, F.J. (2007) Live yeasts in the gut: natural occurrence, dietary introduction, and their
effects on fish health and development. Aquaculture 267, 20-30.
Gause, B. & Trushenski, J. (2011a) Replacement of fish meal with ethanol yeast in the diets of
sunshine bass. N. Am. J. Aquac. 73, 97-103.
Gause, B. & Trushenski, J. (2011b) Production performance and stress tolerance of sunshine
bass raised on reduced fish meal feeds containing ethanol yeast. N. Am. J. Aquac. 73,
168-175.
Halver, J.E. & Hardy, R.W. (2002) Fish nutrition. Academic press, San Diego, CA, USA.
Hauptman, B.S., Barrows, F.T., Block, S.S., Gaylord, T.G., Paterson, J.A., Rawles, S.D. &
Sealey, W.M. (2014) Evaluation of grain distillers dried yeast as a fish meal substitute in
practical-type diets of juvenile rainbow trout, Oncorhynchus mykiss. Aquaculture 432, 7-
14.
Hoseinifar, S.H., Mirvaghefi, A. & Merrifield, D.L. (2011) The effects of dietary inactive
brewer's yeast Saccharomyces cerevisiae var. ellipsoideus on the growth, physiological
responses and gut microbiota of juvenile beluga (Huso huso). Aquaculture 318, 90-94.
Li, M.H., Oberle, D.F. & Lucas, P.M. (2011) Evaluation of corn distillers dried grains with
solubles and brewers yeast in diets for channel catfish Ictalurus punctatus (Rafinesque).
Aquac. Res. 42, 1424-1430.
25
Li, P. & Gatlin, D.M. (2003) Evaluation of brewers yeast (Saccharomyces cerevisiae) as a feed
supplement for hybrid striped bass (Morone chrysops × M. saxatilis). Aquaculture 219,
681-692.
Li, P. & Gatlin, D.M. (2004) Dietary brewers yeast and the prebiotic Grobiotic™ AE influence
growth performance, immune responses and resistance of hybrid striped bass (Morone
chrysops × M. saxatilis) to Streptococcus iniae infection. Aquaculture 231, 445-456.
Li, P. & Gatlin, D.M. (2005) Evaluation of the prebiotic GroBiotic®-A and brewers yeast as
dietary supplements for sub-adult hybrid striped bass (Morone chrysops × M. saxatilis)
challenged in situ with Mycobacterium marinum. Aquaculture 248, 197-205.
Li, P., Burr, G.S., Goff, J., Whiteman, K.W., Davis, K.B., Vega, R.R., Neill, W.H. & Gatlin,
D.M. (2005) A preliminary study on the effects of dietary supplementation of brewers
yeast and nucleotides, singularly or in combination, on juvenile red drum (Sciaenops
ocellatus). Aquac. Res. 36, 1120-1127.
Liu, X.H., Ye, J.D., Kong, J.H., Wang, K. & Wang, A.L. (2013) Apparent digestibility of 12
protein-origin ingredients for Pacific white shrimp Litopenaeus vannamei. N. Am. J.
Aquac. 75, 90-98.
Lunger, A.N., Craig, S.R. & McLean, E. (2006) Replacement of fish meal in cobia
(Rachycentron canadum) diets using an organically certified protein. Aquaculture 257,
393-399.
Ma, T. & Zuazaga, G. (1942) Micro-Kjeldahl determination of nitrogen. A new indicator and an
improved rapid method. Inc. Eng. Chem. 14, 280-282.
McGinnis, A.J. & Kasting, R. (1964) Chromic oxide indicator method for measuring food
utilization in a plant-feeding insect. Science 144, 1464-1465.
26
Merrifield, D.L., Dimitroglou, A., Foey, A., Davies, S.J., Baker, R.T.M., Bøgwald, J., Castex, M.
& Ringø, E. (2010) The current status and future focus of probiotic and prebiotic
applications for salmonids. Aquaculture 302, 1-18.
Oliva-Teles, A. & Gonçalves, P. (2001) Partial replacement of fishmeal by brewers yeast
(Saccaromyces cerevisae) in diets for sea bass (Dicentrarchus labrax) juveniles.
Aquaculture 202, 269-278.
Pérez‐Sánchez, T., Ruiz‐Zarzuela, I., Blas, I. & Balcázar, J.L. (2014) Probiotics in aquaculture: a
current assessment. Rev. Aquac. 6, 133-146.
Peterson, B.C., Booth, N.J. & Manning, B.B. (2012) Replacement of fish meal in juvenile
channel catfish, Ictalurus punctatus, diets using a yeast‐derived protein source: the effects
on weight gain, food conversion ratio, body composition and survival of catfish
challenged with Edwardsiella ictaluri. Aquac. Nutr. 18, 132-137.
Rumsey, G.L., Hughes, S.G., Smith, R.R., Kinsella, J.E. & Shetty, K.J. (1991) Digestibility and
energy values of intact, disrupted and extracts from brewer's dried yeast fed to rainbow
trout (Oncorhynchus mykiss). Anim. Feed Sci. Technol. 33, 185-193.
Sharifuzzaman, S.M. & Austin, B. (2009) Influence of probiotic feeding duration on disease
resistance and immune parameters in rainbow trout. Fish Shellfish Immunol. 27, 440-445.
Sheikhzadeh, N., Heidarieh, M., Pashaki, A.K., Nofouzi, K., Farshbafi, M.A. & Akbari, M.
(2012) Hilyses®, fermented Saccharomyces cerevisiae, enhances the growth
performance and skin non-specific immune parameters in rainbow trout (Oncorhynchus
mykiss). Fish Shellfish Immunol. 32, 1083-1087.

27
Shen, W.Y., Fu, L.L., Li, W.F. & Zhu, Y.R. (2010) Effect of dietary supplementation with
Bacillus subtilis on the growth, performance, immune response and antioxidant activities
of the shrimp (Litopenaeus vannamei). Aquac. Res. 41, 1691-1698.
Solorzano, L. (1969) Determination of ammonia in natural waters by the phenolhypochlorite
method. Limnol. Oceanogr. 14, 799-801.
Spotte, S. (1979) Fish and invertebrate culture: water management in closed systems, 2nd
edition. Wiley, New York.
Stones, C.S. & Mills, D.V. (2004) The use of live yeast and yeast culture products in
aquaculture. Int. Aquat. Feed 7, 28-34.
Taylor, N.G.H., Verner-Jeffreys, D.W. & Baker-Austin, C. (2011) Aquatic systems: maintaining,
mixing and mobilising antimicrobial resistance? Trends Ecol. Evol. 26, 278-284.
Terrazas-Fierro, M., Civera-Cerecedo, R., Ibarra-Martínez, L., Goytortúa-Bores, E., Herrera-
Andrade, M. & Reyes-Becerra, A. (2010) Apparent digestibility of dry matter, protein,
and essential amino acid in marine feedstuffs for juvenile whiteleg shrimp Litopenaeus
vannamei. Aquaculture 308, 166-173.
Vechklang, K., Lim, C., Boonanuntanasarn, S., Welker, T., Ponchunchuwong, S., Klesius, P.H.
& Wanapu, C. (2012) Growth performance and resistance to Streptococcus iniae of
juvenile Nile tilapia (Oreochromis niloticus) fed diets supplemented with GroBiotic-A
and Brewtech dried brewers yeast. J. Appl. Aquac. 24, 183-198.
Verschuere, L., Rombaut, G., Sorgeloos, P. & Verstraete, W. (2000) Probiotic bacteria as
biological control agents in aquaculture. Microbiol. Mol. Biol. Rev. 64, 655-671.
28
Yang, Q., Zhou, X., Zhou, Q., Tan, B., Chi, S. & Dong, X. (2009) Apparent digestibility of
selected feed ingredients for white shrimp Litopenaeus vannamei, Boone. Aquac. Res. 41,
78-86.
Yang, S.P., Wu, Z.H., Jian, J.C. & Zhang, X.Z. (2010) Effect of marine red yeast
Rhodosporidium paludigenum on growth and antioxidant competence of Litopenaeus
vannamei. Aquaculture 309, 62-65.
Zheng, F., Liu, H., Sun, X., Qu, L. & Liu, J. (2012) Selection, identification and application of
antagonistic bacteria associated with skin ulceration and peristome tumescence of
cultured sea cucumber Apostichopus japonicus (Selenka). Aquaculture 334, 24-29.
Zhou, Y.G., Davis, D.A. & Buentello, A. (2015) Use of new soybean varieties in practical diets
for the Pacific white shrimp, Litopenaeus vannamei. Aquac. Nutr. 21, 635-643.
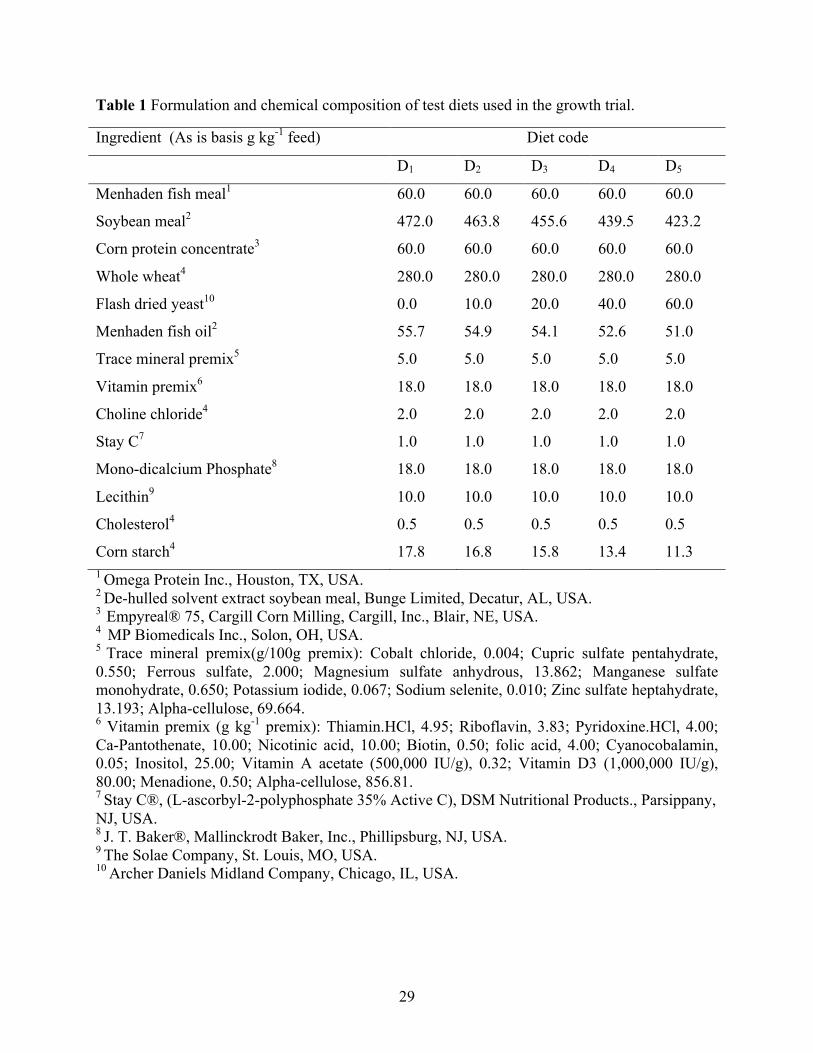
29
Table 1 Formulation and chemical composition of test diets used in the growth trial.
Ingredient (As is basis g kg-1 feed) Diet code
D1 D2 D3 D4 D5
Menhaden fish meal1 60.0 60.0 60.0 60.0 60.0
Soybean meal2 472.0 463.8 455.6 439.5 423.2
Corn protein concentrate3 60.0 60.0 60.0 60.0 60.0
Whole wheat4 280.0 280.0 280.0 280.0 280.0
Flash dried yeast10 0.0 10.0 20.0 40.0 60.0
Menhaden fish oil2 55.7 54.9 54.1 52.6 51.0
Trace mineral premix5 5.0 5.0 5.0 5.0 5.0
Vitamin premix6 18.0 18.0 18.0 18.0 18.0
Choline chloride4 2.0 2.0 2.0 2.0 2.0
Stay C7 1.0 1.0 1.0 1.0 1.0
Mono-dicalcium Phosphate8 18.0 18.0 18.0 18.0 18.0
Lecithin9 10.0 10.0 10.0 10.0 10.0
Cholesterol4 0.5 0.5 0.5 0.5 0.5
Corn starch4 17.8 16.8 15.8 13.4 11.3 1 Omega Protein Inc., Houston, TX, USA. 2 De-hulled solvent extract soybean meal, Bunge Limited, Decatur, AL, USA. 3 Empyreal® 75, Cargill Corn Milling, Cargill, Inc., Blair, NE, USA. 4 MP Biomedicals Inc., Solon, OH, USA. 5 Trace mineral premix(g/100g premix): Cobalt chloride, 0.004; Cupric sulfate pentahydrate, 0.550; Ferrous sulfate, 2.000; Magnesium sulfate anhydrous, 13.862; Manganese sulfate monohydrate, 0.650; Potassium iodide, 0.067; Sodium selenite, 0.010; Zinc sulfate heptahydrate, 13.193; Alpha-cellulose, 69.664. 6 Vitamin premix (g kg-1 premix): Thiamin.HCl, 4.95; Riboflavin, 3.83; Pyridoxine.HCl, 4.00; Ca-Pantothenate, 10.00; Nicotinic acid, 10.00; Biotin, 0.50; folic acid, 4.00; Cyanocobalamin, 0.05; Inositol, 25.00; Vitamin A acetate (500,000 IU/g), 0.32; Vitamin D3 (1,000,000 IU/g), 80.00; Menadione, 0.50; Alpha-cellulose, 856.81. 7 Stay C®, (L-ascorbyl-2-polyphosphate 35% Active C), DSM Nutritional Products., Parsippany, NJ, USA. 8 J. T. Baker®, Mallinckrodt Baker, Inc., Phillipsburg, NJ, USA. 9 The Solae Company, St. Louis, MO, USA. 10 Archer Daniels Midland Company, Chicago, IL, USA.
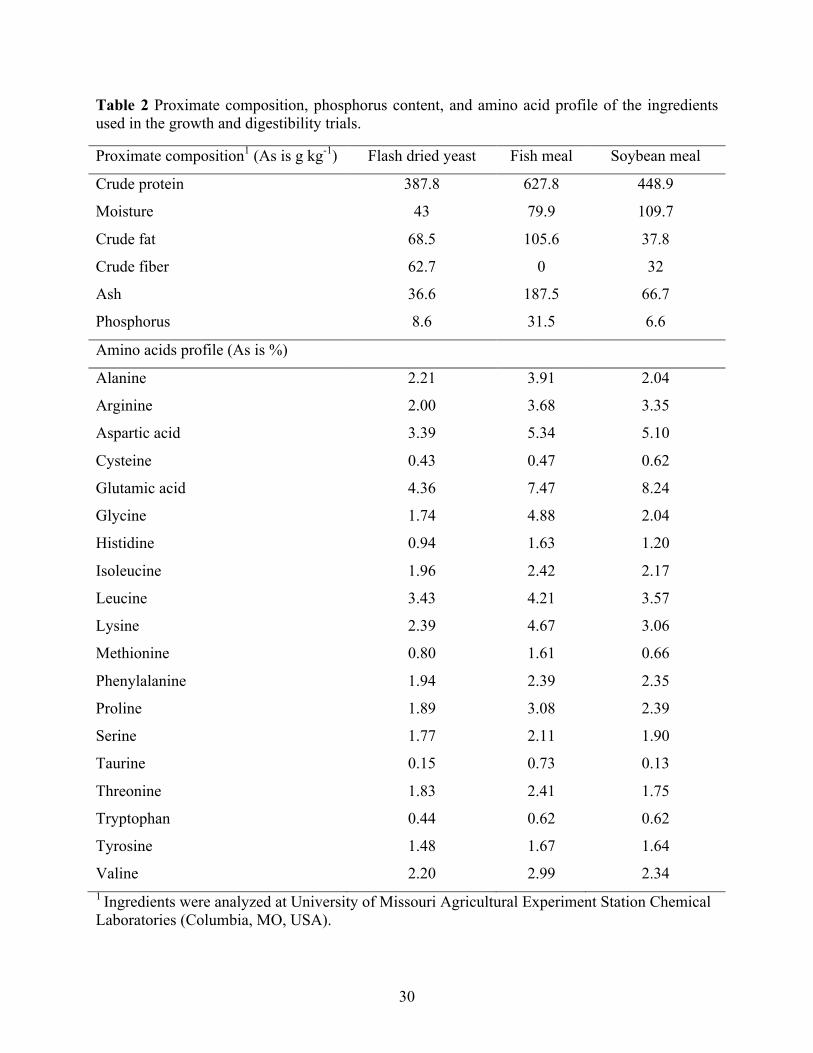
30
Table 2 Proximate composition, phosphorus content, and amino acid profile of the ingredients used in the growth and digestibility trials.
Proximate composition1 (As is g kg-1) Flash dried yeast Fish meal Soybean meal
Crude protein 387.8 627.8 448.9
Moisture 43 79.9 109.7
Crude fat 68.5 105.6 37.8
Crude fiber 62.7 0 32
Ash 36.6 187.5 66.7
Phosphorus 8.6 31.5 6.6
Amino acids profile (As is %)
Alanine 2.21 3.91 2.04
Arginine 2.00 3.68 3.35
Aspartic acid 3.39 5.34 5.10
Cysteine 0.43 0.47 0.62
Glutamic acid 4.36 7.47 8.24
Glycine 1.74 4.88 2.04
Histidine 0.94 1.63 1.20
Isoleucine 1.96 2.42 2.17
Leucine 3.43 4.21 3.57
Lysine 2.39 4.67 3.06
Methionine 0.80 1.61 0.66
Phenylalanine 1.94 2.39 2.35
Proline 1.89 3.08 2.39
Serine 1.77 2.11 1.90
Taurine 0.15 0.73 0.13
Threonine 1.83 2.41 1.75
Tryptophan 0.44 0.62 0.62
Tyrosine 1.48 1.67 1.64
Valine 2.20 2.99 2.34 1 Ingredients were analyzed at University of Missouri Agricultural Experiment Station Chemical Laboratories (Columbia, MO, USA).
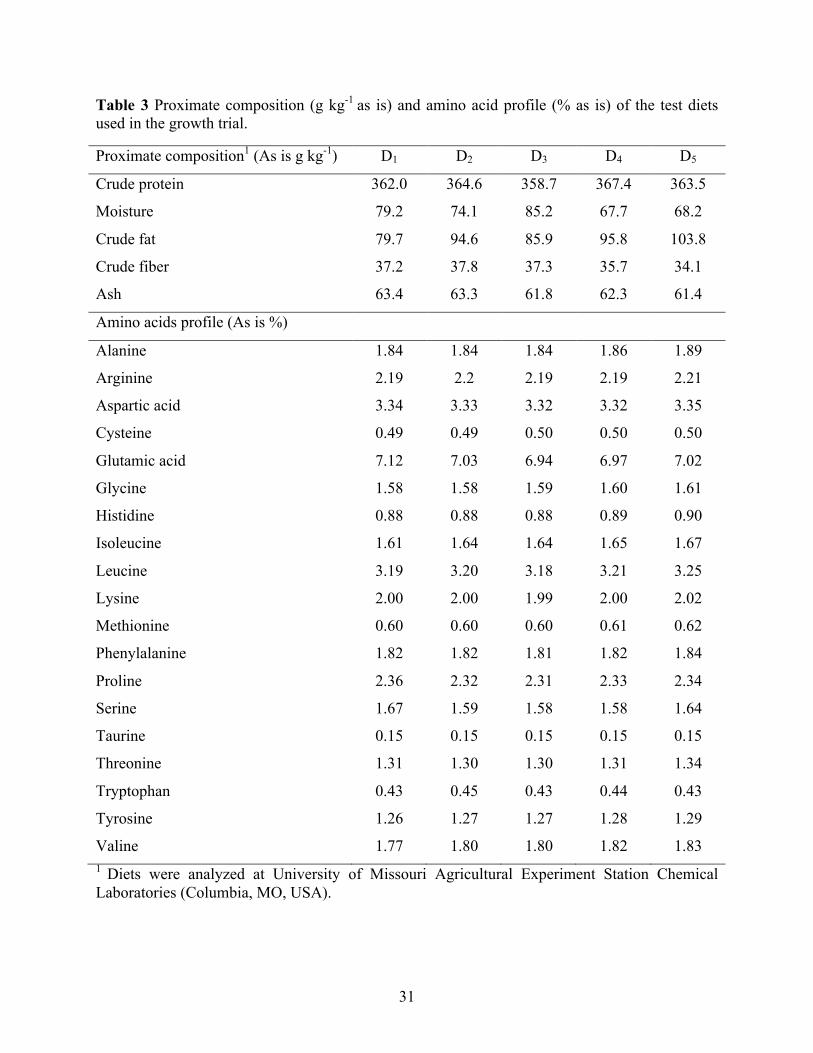
31
Table 3 Proximate composition (g kg-1 as is) and amino acid profile (% as is) of the test diets used in the growth trial.
Proximate composition1 (As is g kg-1) D1 D2 D3 D4 D5
Crude protein 362.0 364.6 358.7 367.4 363.5
Moisture 79.2 74.1 85.2 67.7 68.2
Crude fat 79.7 94.6 85.9 95.8 103.8
Crude fiber 37.2 37.8 37.3 35.7 34.1
Ash 63.4 63.3 61.8 62.3 61.4
Amino acids profile (As is %)
Alanine 1.84 1.84 1.84 1.86 1.89
Arginine 2.19 2.2 2.19 2.19 2.21
Aspartic acid 3.34 3.33 3.32 3.32 3.35
Cysteine 0.49 0.49 0.50 0.50 0.50
Glutamic acid 7.12 7.03 6.94 6.97 7.02
Glycine 1.58 1.58 1.59 1.60 1.61
Histidine 0.88 0.88 0.88 0.89 0.90
Isoleucine 1.61 1.64 1.64 1.65 1.67
Leucine 3.19 3.20 3.18 3.21 3.25
Lysine 2.00 2.00 1.99 2.00 2.02
Methionine 0.60 0.60 0.60 0.61 0.62
Phenylalanine 1.82 1.82 1.81 1.82 1.84
Proline 2.36 2.32 2.31 2.33 2.34
Serine 1.67 1.59 1.58 1.58 1.64
Taurine 0.15 0.15 0.15 0.15 0.15
Threonine 1.31 1.30 1.30 1.31 1.34
Tryptophan 0.43 0.45 0.43 0.44 0.43
Tyrosine 1.26 1.27 1.27 1.28 1.29
Valine 1.77 1.80 1.80 1.82 1.83 1 Diets were analyzed at University of Missouri Agricultural Experiment Station Chemical Laboratories (Columbia, MO, USA).
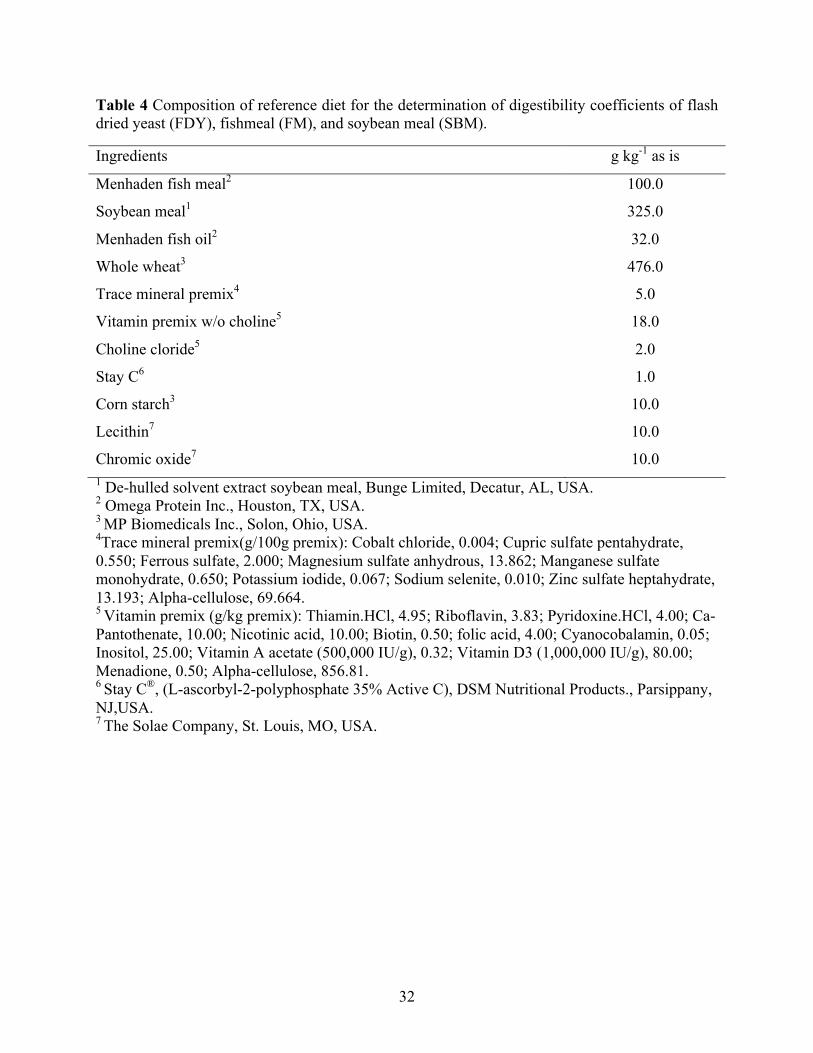
32
Table 4 Composition of reference diet for the determination of digestibility coefficients of flash dried yeast (FDY), fishmeal (FM), and soybean meal (SBM).
Ingredients g kg-1 as is
Menhaden fish meal2 100.0
Soybean meal1 325.0
Menhaden fish oil2 32.0
Whole wheat3 476.0
Trace mineral premix4 5.0
Vitamin premix w/o choline5 18.0
Choline cloride5 2.0
Stay C6 1.0
Corn starch3 10.0
Lecithin7 10.0
Chromic oxide7 10.0 1 De-hulled solvent extract soybean meal, Bunge Limited, Decatur, AL, USA. 2 Omega Protein Inc., Houston, TX, USA. 3 MP Biomedicals Inc., Solon, Ohio, USA. 4Trace mineral premix(g/100g premix): Cobalt chloride, 0.004; Cupric sulfate pentahydrate, 0.550; Ferrous sulfate, 2.000; Magnesium sulfate anhydrous, 13.862; Manganese sulfate monohydrate, 0.650; Potassium iodide, 0.067; Sodium selenite, 0.010; Zinc sulfate heptahydrate, 13.193; Alpha-cellulose, 69.664. 5 Vitamin premix (g/kg premix): Thiamin.HCl, 4.95; Riboflavin, 3.83; Pyridoxine.HCl, 4.00; Ca-Pantothenate, 10.00; Nicotinic acid, 10.00; Biotin, 0.50; folic acid, 4.00; Cyanocobalamin, 0.05; Inositol, 25.00; Vitamin A acetate (500,000 IU/g), 0.32; Vitamin D3 (1,000,000 IU/g), 80.00; Menadione, 0.50; Alpha-cellulose, 856.81. 6 Stay C®, (L-ascorbyl-2-polyphosphate 35% Active C), DSM Nutritional Products., Parsippany, NJ,USA. 7 The Solae Company, St. Louis, MO, USA.
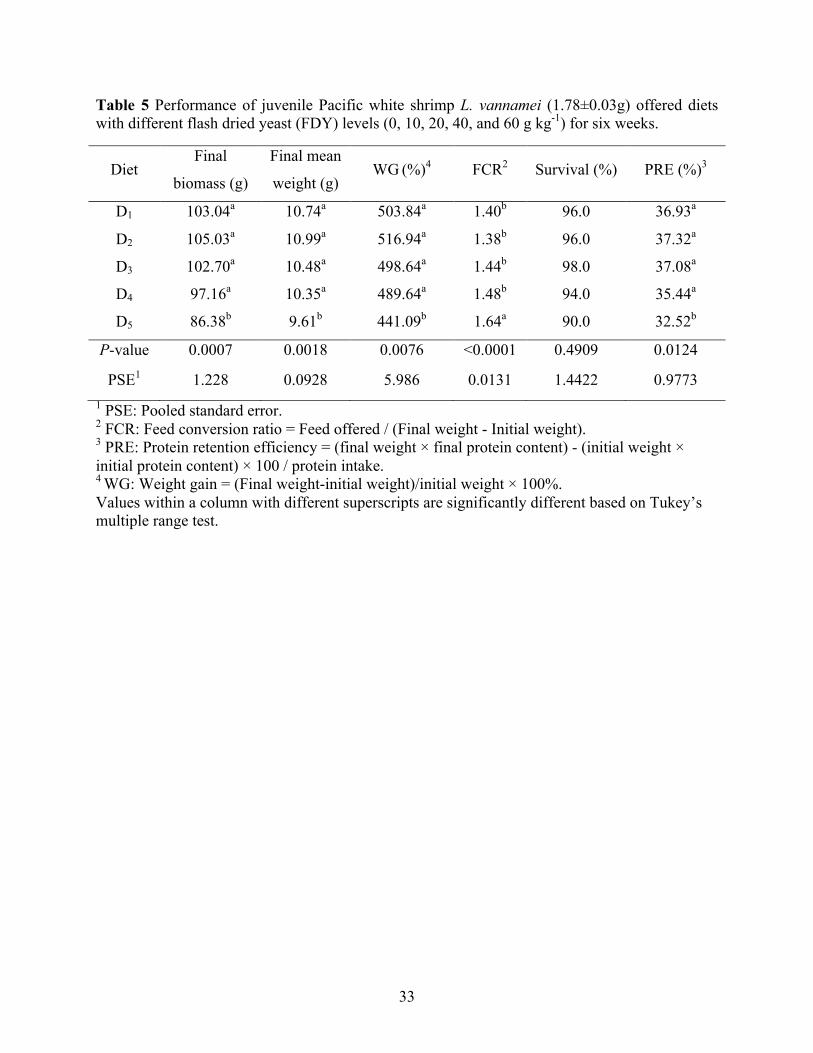
33
Table 5 Performance of juvenile Pacific white shrimp L. vannamei (1.78±0.03g) offered diets with different flash dried yeast (FDY) levels (0, 10, 20, 40, and 60 g kg-1) for six weeks.
Diet Final
biomass (g)
Final mean
weight (g) WG (%)4 FCR2 Survival (%) PRE (%)3
D1 103.04a 10.74a 503.84a 1.40b 96.0 36.93a
D2 105.03a 10.99a 516.94a 1.38b 96.0 37.32a
D3 102.70a 10.48a 498.64a 1.44b 98.0 37.08a
D4 97.16a 10.35a 489.64a 1.48b 94.0 35.44a
D5 86.38b 9.61b 441.09b 1.64a 90.0 32.52b
P-value 0.0007 0.0018 0.0076 <0.0001 0.4909 0.0124
PSE1 1.228 0.0928 5.986 0.0131 1.4422 0.9773 1 PSE: Pooled standard error. 2 FCR: Feed conversion ratio = Feed offered / (Final weight - Initial weight). 3 PRE: Protein retention efficiency = (final weight × final protein content) - (initial weight × initial protein content) × 100 / protein intake. 4 WG: Weight gain = (Final weight-initial weight)/initial weight × 100%. Values within a column with different superscripts are significantly different based on Tukey’s multiple range test.
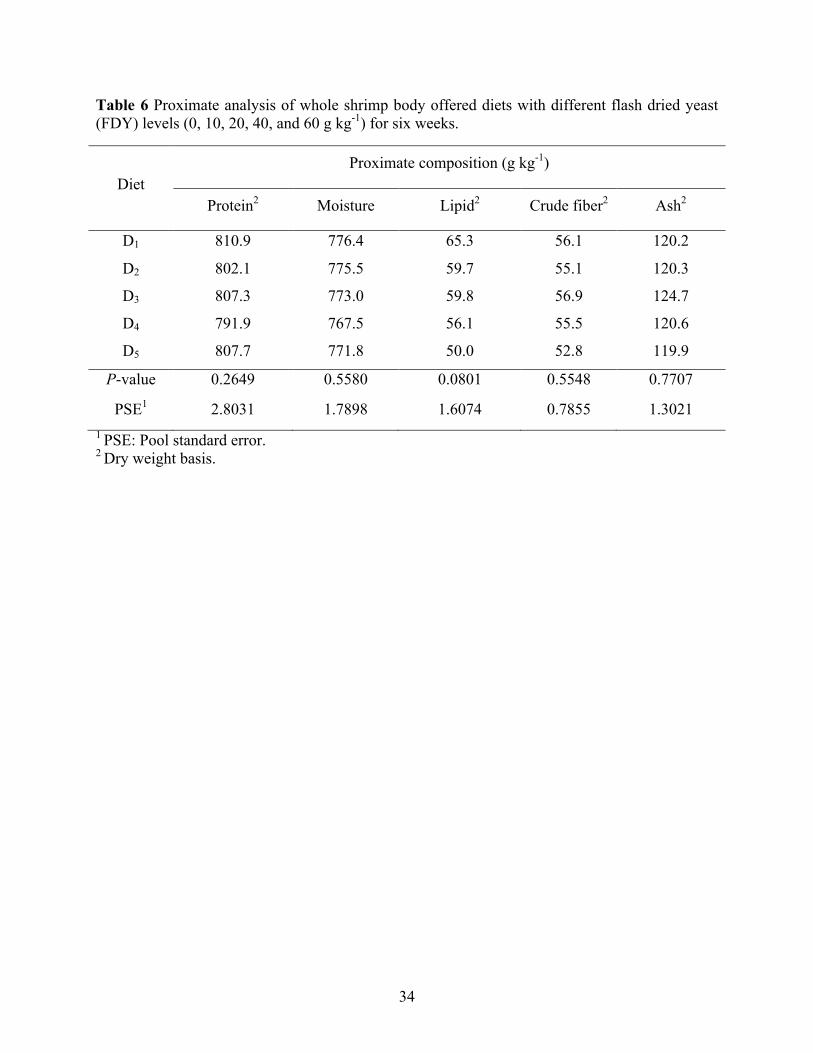
34
Table 6 Proximate analysis of whole shrimp body offered diets with different flash dried yeast (FDY) levels (0, 10, 20, 40, and 60 g kg-1) for six weeks.
Diet Proximate composition (g kg-1)
Protein2 Moisture Lipid2 Crude fiber2 Ash2
D1 810.9 776.4 65.3 56.1 120.2
D2 802.1 775.5 59.7 55.1 120.3
D3 807.3 773.0 59.8 56.9 124.7
D4 791.9 767.5 56.1 55.5 120.6
D5 807.7 771.8 50.0 52.8 119.9
P-value 0.2649 0.5580 0.0801 0.5548 0.7707
PSE1 2.8031 1.7898 1.6074 0.7855 1.3021 1 PSE: Pool standard error. 2 Dry weight basis.
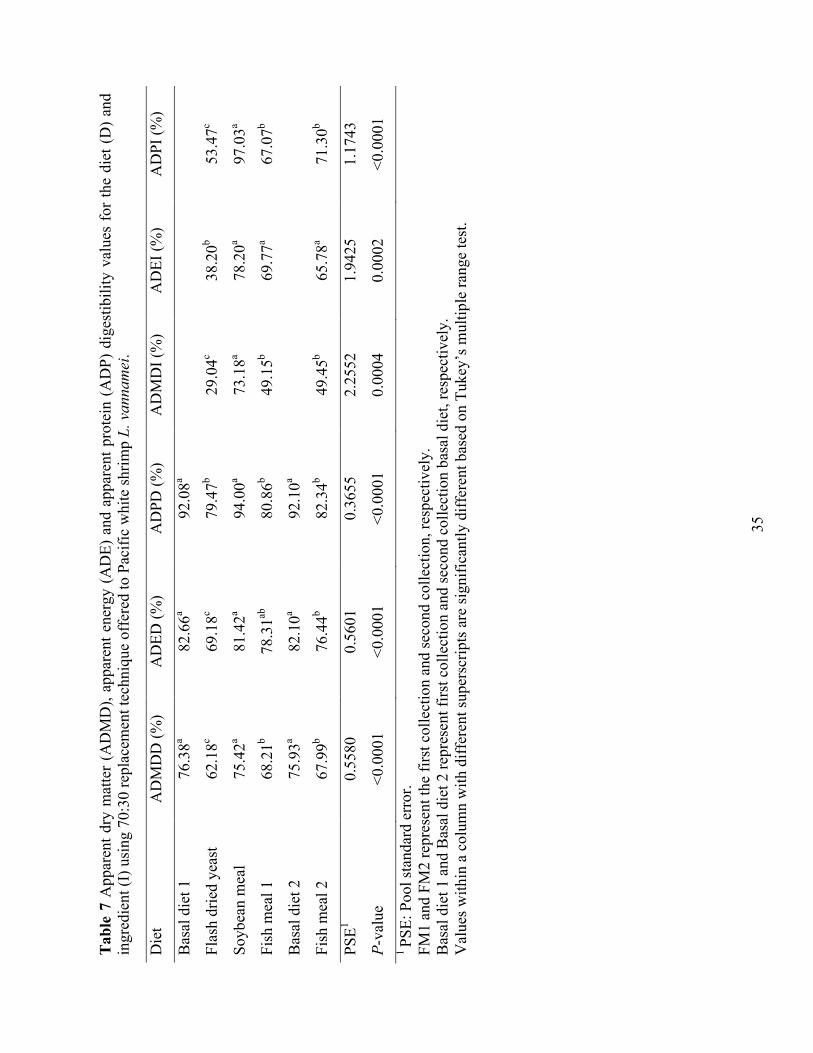
35
Tab
le 7
App
aren
t dry
mat
ter
(AD
MD
), ap
pare
nt e
nerg
y (A
DE)
and
app
aren
t pro
tein
(A
DP)
dig
estib
ility
val
ues
for
the
diet
(D
) an
d in
gred
ient
(I) u
sing
70:
30 re
plac
emen
t tec
hniq
ue o
ffer
ed to
Pac
ific
whi
te s
hrim
p L.
van
nam
ei.
Die
t A
DM
DD
(%)
AD
ED (%
) A
DPD
(%)
AD
MD
I (%
) A
DEI
(%)
AD
PI (%
)
Bas
al d
iet 1
76
.38a
82.6
6a 92
.08a
Fl
ash
drie
d ye
ast
62.1
8c 69
.18c
79.4
7b 29
.04c
38.2
0b 53
.47c
Soyb
ean
mea
l 75
.42a
81.4
2a 94
.00a
73.1
8a 78
.20a
97.0
3a
Fish
mea
l 1
68.2
1b 78
.31ab
80
.86b
49.1
5b 69
.77a
67.0
7b
Bas
al d
iet 2
75
.93a
82.1
0a 92
.10a
Fish
mea
l 2
67.9
9b 76
.44b
82.3
4b 49
.45b
65.7
8a 71
.30b
PSE1
0.55
80
0.56
01
0.36
55
2.25
52
1.94
25
1.17
43
P-va
lue
<0.0
001
<0.0
001
<0.0
001
0.00
04
0.00
02
<0.0
001
1 PS
E: P
ool s
tand
ard
erro
r. FM
1 an
d FM
2 re
pres
ent t
he fi
rst c
olle
ctio
n an
d se
cond
col
lect
ion,
resp
ectiv
ely.
B
asal
die
t 1 a
nd B
asal
die
t 2 re
pres
ent f
irst c
olle
ctio
n an
d se
cond
col
lect
ion
basa
l die
t, re
spec
tivel
y.
Val
ues
with
in a
col
umn
with
diff
eren
t sup
ersc
ripts
are
sig
nific
antly
diff
eren
t bas
ed o
n Tu
key’
s m
ultip
le ra
nge
test
.
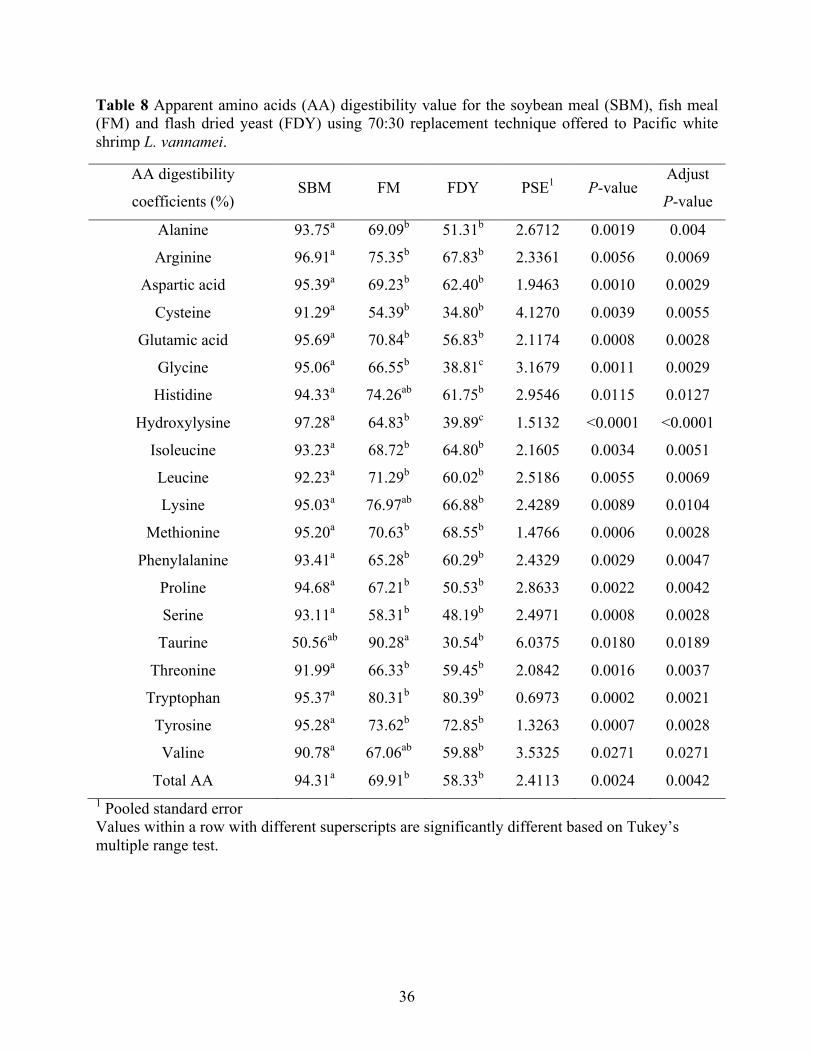
36
Table 8 Apparent amino acids (AA) digestibility value for the soybean meal (SBM), fish meal (FM) and flash dried yeast (FDY) using 70:30 replacement technique offered to Pacific white shrimp L. vannamei.
AA digestibility
coefficients (%) SBM FM FDY PSE1 P-value
Adjust
P-value
Alanine 93.75a 69.09b 51.31b 2.6712 0.0019 0.004
Arginine 96.91a 75.35b 67.83b 2.3361 0.0056 0.0069
Aspartic acid 95.39a 69.23b 62.40b 1.9463 0.0010 0.0029
Cysteine 91.29a 54.39b 34.80b 4.1270 0.0039 0.0055
Glutamic acid 95.69a 70.84b 56.83b 2.1174 0.0008 0.0028
Glycine 95.06a 66.55b 38.81c 3.1679 0.0011 0.0029
Histidine 94.33a 74.26ab 61.75b 2.9546 0.0115 0.0127
Hydroxylysine 97.28a 64.83b 39.89c 1.5132 <0.0001 <0.0001
Isoleucine 93.23a 68.72b 64.80b 2.1605 0.0034 0.0051
Leucine 92.23a 71.29b 60.02b 2.5186 0.0055 0.0069
Lysine 95.03a 76.97ab 66.88b 2.4289 0.0089 0.0104
Methionine 95.20a 70.63b 68.55b 1.4766 0.0006 0.0028
Phenylalanine 93.41a 65.28b 60.29b 2.4329 0.0029 0.0047
Proline 94.68a 67.21b 50.53b 2.8633 0.0022 0.0042
Serine 93.11a 58.31b 48.19b 2.4971 0.0008 0.0028
Taurine 50.56ab 90.28a 30.54b 6.0375 0.0180 0.0189
Threonine 91.99a 66.33b 59.45b 2.0842 0.0016 0.0037
Tryptophan 95.37a 80.31b 80.39b 0.6973 0.0002 0.0021
Tyrosine 95.28a 73.62b 72.85b 1.3263 0.0007 0.0028
Valine 90.78a 67.06ab 59.88b 3.5325 0.0271 0.0271
Total AA 94.31a 69.91b 58.33b 2.4113 0.0024 0.0042 1 Pooled standard error Values within a row with different superscripts are significantly different based on Tukey’s multiple range test.
37
CHAPTER III
EVALUATION OF THREE NON-GENETICALLY MODIFIED SOYBEAN
CULTIVARS AS INGREDIENTS AND A YEAST-BASED ADDITIVE AS A
SUPPLEMENT IN PRACTICAL DIETS FOR PACIFIC WHITE SHRIMP Litopenaeus
vannamei
1. Introduction
Soybean meal (SBM) is usually considered as the most reliable ingredient and cost-
effective protein source in shrimp feed because of its worldwide availability, low price, relatively
balanced amino acid profile, and consistent composition (Amaya et al. 2007b; Davis & Arnold
2000). There have been a number of studies demonstrating the successful use of conventional
SBM in practical diets for Pacific white shrimp, Litopenaeus vannamei (Amaya et al. 2007b;
Roy et al. 2009; Sookying & Davis 2011; Zhu et al. 2013). Albeit commodity SBM is still an
acceptable protein source with good digestibility for shrimp, it also has some potential
limitations associated with insufficient levels of essential amino acids (EAA) such as methionine
and lysine, presence of anti-nutritional factors (ANFs) for example trypsin inhibitors, and poor
palatability, which may limit its potential use in feed formulations (Dersjant-Li 2002).
Traditionally, supplementation methionine and lysine and inclusion of attractants or palatability
enhancers in SBM-based diets to meet the shrimp requirement is recommended to provide a
good growth response (Akiyama 1989). Also, ANFs such as trypsin inhibitors present in raw
soybean can negatively affect nutrient digestion and availability but this can be reduced or
eliminated through heat processing (Dersjant-Li 2002; New 1987).
38
Alternatively, novel soy breeding technology can be used to develop new soybean
cultivars, which selectively decrease certain heat-resistant ANFs (such as oligosaccharides),
while increasing the protein content of the resulting meals. Building on this progress,
unconventional, non-thermal (energy-saving), nutrient-preserving processing methods can be
used to produce these novel meals. The resulting meals are of considerable interest in
aquaculture because they may potentially provide improved feed ingredients with no need for
genetic modifications of the native soy DNA, therefore, resulting in nutritionally superior
products (Fang et al. 2016). In addition, selective soy breeding allows for a tight control on some
functional compounds that may promote immunogenicity in shrimp. As shrimp culture has
become an expanded and intensified economic activity, bacterial and viral diseases are
considered a threat to the future progress of semi-intensive and intensive shrimp culture (Pérez‐
Sánchez et al. 2014). Traditional antibiotics supplementation can prevent or treat diseases but it
may also develop resistant bacterial strains immune to antibiotic treatment. In addition, the
antibiotic residues in cultured animals may act in detriment of human health (Cabello 2006;
Sharifuzzaman & Austin 2009; Taylor et al. 2011). To tackle disease problems and avoid
potential disadvantages of antibiotic use, alternative strategies, for example the use of probiotics
(e.g., yeast) and prebiotics has received considerable attention in recent years (Li & Gatlin 2005).
Products of various fermented yeast, not containing live/viable cells, often contain
primary metabolites, such as nucleotides, polysaccharides, small peptides, organic acids and
lipids. Some of these materials have been demonstrated to improve the growth, survival, and
immune response of L. vannamei in several studies (Deng et al. 2013; Tipsemongkol et al. 2009).
Our laboratory has already evaluated digestibility values of some new non-genetically
modified (non-GM) soybean cultivars and the effects on the growth performance of L.vannamei
39
(Fang et al. 2016; Zhou et al. 2015). However, information about the impacts of novel
processing on selected soybean cultivars on immune response is still needed. Therefore, the
purposes of this study were to investigate the effects of three new, non-GM soybean cultivars
processed with novel technologies on the growth performance and immune responses of L.
vannamei and to verify the effects of a fermented yeast product on growth and immunity of L.
vannamei.
2. Materials and Methods
2.1 Ingredients preparation
Four sources of SBM, including three new, non-GM soybean cultivars, were obtained for
evaluation of their potential use as ingredients in L. vannamei feeds. Commodity SBM soy was
obtained from Bunge Limited, Decatur, AL, USA. The non-GM ingredients were processed via
proprietary technology and donated by NavitaTM Premium Feed Ingredients (NPFI), West Des
Moines, IA, USA. They were analyzed at University of Missouri Agricultural Experiment
Station Chemical Laboratories (Columbia, MO, USA) for proximate composition, phosphorus
content, trypsin inhibitor, urease activity, acid detergent fiber (ADF), neutral detergent fiber
(NDF), protein dispersibility index (PDI), starch, and amino acid profiles in the diets were
formulated (Tables 2).
2.2 Experiment design and diets
Two growth trials were conducted to evaluate biological response of shrimp to three
novel soybean cultivars and a fermented yeast commercial product in practical diets with regards

40
to growth and feed utilization. All test diets were formulated to be iso-nitrogenous and iso-lipidic
(35% protein and 8% lipid). A total of 9 experimental diets were formulated (Table 1). The basal
diet (1) was primarily composed of a commodity SBM, fishmeal (FM), whole wheat, corn
protein concentrate, poultry by-product meal (PM, pet food grade) and corn starch. For the
experimental diets, either low (L) or high (H) inclusion levels of three novel soybean ingredients
(N1-N3) were utilized to replace all the conventional SBM and to partially substitute FM and
PM in the basal diet. Additionally, the last two diets (8 and 9) were essentially the same as diets
1 and 3 but supplemented with a commercially available fermented yeast product.
Pre-ground dry ingredient and oil were mixed in a food mixer (Hobart Corporation, Troy,
OH, USA) for 15 minutes. Hot water was then blended into the mixture to obtain a consistency
appropriate for pelleting. Diets were pressure-pelleted using a meat grinder with a 3 mm die, air-
dried (<50 °C) to a moisture content of 8-10%. Pellets were crumbled, packed in sealed plastic
bags and stored in a freezer (-20 °C) until needed. As the ingredients, the diets were also
analyzed at University of Missouri for proximate composition (g 100 g-1 as is) and amino acid
profile (g 100 g-1 as is) (Table 3).
2.3 Growth trials
Two trials were conducted at the E.W. Shell Fisheries Research Station, Auburn
University (Auburn, AL, USA). Pacific white shrimp post larvae (PL) were obtained from
Shrimp Improvement Systems (Islamorada, Florida) and nursed in an indoor recirculating
system. PLs were fed a commercial feed (Zeigler Bros., Inc., Gardners, Pennsylvania, USA)
using an automatic feeder for ~1 week, and then switched to crumbled commercial shrimp feed
(Rangen® Inc., Buhl, Idaho, USA) for ~1- 2 weeks.
41
At the end of the nursery phase, juvenile shrimp (initial mean weight 0.15 g for trial 1;
0.20 g for trial 2) were obtained from the nursery system and hand-sorted to uniform size. Both
growth trials utilized 9 treatments with 6 replicates in each treatment. In trial 1, juvenile shrimp
were stocked into 54 tanks with 15 shrimp per aquarium in a semi-recirculation system. In trial
2, juvenile shrimp were stocked into 54 tanks with 10 shrimp per aquarium in the same semi-
recirculation system as the trial 1. The semi-recirculation system consisted of 54 aquaria (60 L)
connected to a common reservoir, biological filter, bead filter, fluidized biological filter and
recirculation pump.
During the two trials, shrimp were fed four times daily over 46 days for trial 1 and 35
days for trial 2. Daily allowances of feed were adjusted based on observed feed consumption,
weekly counts of the shrimp and mortality. Based on the historic results in our laboratory, daily
feed rations were initially calculated assuming a 1.8 FCR and doubling in size the first three
weeks for trial 1, first two weeks for trial 2 and an increment of 0.8 g/week thereafter.
Consequently, for each tank in trial 1, a fixed ration of 0.58 g day-1 for the first week, 1.16 g day-
1 for the second week, 2.31 g day-1 for the third week, and 3.09 g day-1 for the remaining
culturing period was offered, partitioned in 4 feedings each day. For each tank in trial 2, a fixed
ration of 0.51 g day-1 for the first week, 1.03 g day-1 for the second week, 1.85 g day-1 for the
third, forth, and fifth week was also allotted in 4 portions per day. At the conclusion of each
growth trial, shrimp were counted and group-weighted. Mean final weight, FCR, WG, biomass,
and survival were determined (Table 4).
42
2.4 Physiological assessment
A second recirculation system was used to condition sub-adult shrimp for the collection
of physiological samples. The culture system was equivalent to the previously described system
but utilized a series of 130 L aquaria which were stocked with 6 sub-adult shrimp (14.8 g mean
weight). Shrimp were offered diets 1, 3, 8, and 9 to slight excess over a 15 days period. At the
conclusion of the conditioning period the shrimp were sacrificed and hemolymph samples were
collected for assessment of total hemocyte count (THC), hyaline cells count (HCC), granular
cells count (GCC), semi-granular cells count (SGCC), hemolymph glucose (HG), hemolymph
packed cells volume (HPCV), hemolymph protein (HP), hemocyte phagocytic capacity (HPC),
and hemocyte respiratory burst activity (HRBA) (Table 8). A sample of hemolymph was
obtained from each shrimp using a 25 gauge needle through the dorsal surface, and the glucose
level was determined using a handheld glucometer (Abbott Diabetic Care, Inc., Alameda, CA).
The remainder of each sample was loaded into a hematocrit tube, capped and centrifuged at
10,000 rpm for 5 minutes, and the packed hemocyte volume was read using a Micro-Hematocrit
Capillary Tube Reader (Monoject Scientific, St. Louis, MO). After this step, the hemolymph
protein content was determined by placing a drop of the supernatant onto a handheld protein
refractometer (VEEGEE Scientific Inc. Kirkland, WA). An additional sample of hemolymph was
collected into an equal volume of anticoagulant and a 20 µl aliquot of the hemolymph and
anticoagulant mixture was added to an equal volume of Trypan Blue and allowed to sit for 1
minute. Cells were counted using a hemocytometer, and one corner of 16 squares was read. Cell
number per ml for both total and differential counts was determined by the following formula:
cell number x dilution factor (4) x 106. After cell counting was completed, the cell numbers were
standardized using PBS to dilute the samples. The respiratory burst activity of the cells was

43
assessed in the following manner using the standardized samples: 100 µl of sample and 100 µl of
zymosan solution were added in triplicate to a 96-well plate and incubated at room temperature
for 30 minutes. The zymosan solution was then removed, the wells were rinsed three times with
100 µl PBS, and 100 µl of NBT solution was added and incubated for 30 minutes and removed.
The wells were then fixed with absolute methanol, and rinsed three times with 70% methanol.
Subsequently, 120 µl of KOH and 140 µl DMSO were added to dissolve the DBT diforazon
precipitate. Plates were then read in a spectrophotometer at 600 nm for comparison of
absorbance (Yeh et al. 2004). To determine phagocytic capacity, an additional sample of 50 µl of
hemolymph with anticoagulant was loaded induplicate on Esco Fluor glass slides and incubated
at room temperature for 90 minutes. After incubation, 50 µl of zymosan solution was added and
incubated at room temperature for 60 minutes. The slides were then washed with PBS, air dryed,
and fixed in methanol, and stained with Wright stain. At least 100 hemocytes per slide were
microscopically examined at 100 x magnification for evidence of phagocytic activity, and
phagocytic capacity was determined by the percentage containing 5 or more zymosan particles
(Mustafa et al. 2000).
2.5 Water quality monitoring
For both trials, dissolved oxygen (DO), water temperature and salinity were measured
twice daily by using a YSI 650 multi-parameter instrument (YSI, Yellow Springs, OH, USA).
Hydrogen potential (pH) was measured twice weekly by using a waterproof pHTestr30 (Oakton
instrument, Vernon Hills, IL, USA). Total ammonia-nitrogen (TAN) and nitrite were evaluated
every week by using the methods described by Sororzano (1969) and Spotte (1979).
44
2.6 Statistical analysis
All data was analyzed using SAS (V9.3. SAS Institute, Cary, NC, USA). For the growth
trial data was analyzed using one-way ANOVA to determine significant differences (P < 0.05)
among treatments followed by Tukey’s multiple comparison test to determine difference
between treatment means. Principle component analysis (PCA) was performed to reduce the
dimensions. Multiple linear regression was utilized to detect the relationship of WG or FCR with
principle components selected from PCA. Correlation coefficient analysis was utilized to identify
the relationships between trypsin inhibitor, methionine and lysine levels in the diets and the
shrimp’s biological responses. Data from the physiological assessment was analyzed using two-
way ANOVA to evaluate soy sources across fermented yeast product supplementation levels.
3. Results
3.1 Water quality
In trial 1, DO, temperature, salinity, pH, TAN, and nitrite were maintained at
6.01±0.38mg L-1, 27.8±1.1°C, 7.4±0.3ppt, 7.21±0.20, 0.068±0.037mg L-1, and 0.201±0.090mg
L-1, respectively. In trial 2, DO, temperature, salinity, pH, TAN, and nitrite were maintained at
5.63±0.28mg L-1, 29.3±0.4°C, 5.1±0.1ppt, 7.67±0.22, 0.030±0.023mg L-1, and 0.023±0.016mg
L-1, respectively. Water quality conditions in both of the trials were suitable for normal growth
and survival of this species.
3.2 Growth trials
Growth performance of juvenile L. vannamei offered diets with different ingredients are
presented in Table 4. In trial 1, significant differences were detected in final biomass, final mean
45
weight, WG, FCR, and survival when shrimp were fed with various diets. Highest final biomass
(65.74 g) was observed in shrimp fed with the basal diet. Shrimp fed diets 2 and 3 (LN1 and
HN1, respectively) exhibited the highest final mean weight (5.08 g) and WG (3,463%), while
shrimp fed diet 5 (HN2) had the lowest values for those two indicators (4.06 g and 2,627%,
respectively). The FCR range spanned from 1.38 to 1.75 and the lowest value was observed in
shrimp fed diet 2 (LN1), while the highest FCR was found in shrimp fed diet 3 (HN2). Survival
ranged from 65.6 to 91.1% and the lowest survival was observed in shrimp fed diets 2 and 3. In
contrast, the highest survival was documented for shrimp fed the basal diet.
Similarly, trial 2 revealed that final biomass, final mean weight, WG, and FCR were
significantly affected by dietary treatment. Shrimp fed diet 2 had the highest final biomass, final
mean weight, and WG (36.72 g, 4.02 g, and 2,050%, respectively), while shrimp fed diet 3
exhibited the lowest values for these indices (27.32 g, 3.29 g, 1,519%, respectively). In trial 2
FCR ranged from 1.34 to 1.74 and the lowest value was observed in shrimp fed diet 8, while the
highest FCR was found in animals fed diet 3. In this second trial survival ranged from 78.3 to
93.3% but no significant differences were observed among shrimp fed the various diets.
Principle component analysis (PCA) of trypsin inhibitors and essential amino acids and
their loadings of experimental diets are presented in Table 5. The first principle component (PC)
explained 71.1% of total sample variance. Collectively, the first three PCs explained 92.86% of
total samples variance. Loadings of essential amino acids are similar in PC1 (ranged from 0.234
to 0.347). The only negative loading in PC1 is trypsin inhibitor (-0.153). In PC2, loadings of
methionine and lysine are -0.495 and -0.205 respectively. Trypsin inhibitor (loading=0.836) is in
charge of the third PC.

46
The results of multiple linear regression of WG and FCR on the first three PCs (PC1,
PC2, and PC3) are presented in Table 6. P-value for all the models are less than 0.05. In trial 1,
PC3 has a significantly negative impact on WG while it has positive effect on FCR. In trial 2,
PC2 and PC3 have significantly negative influence on WG, however they have positive effect on
FCR. The first PC has significantly positive effect on WG while it has negative effect on FCR.
Combined the results of PCA and multiple linear regression, we may conclude that the
significantly reduced growth may be attributed to the high trypsin inhibitor level and relatively
insufficient essential amino acids (mainly methionine and lysine) levels as well as their
combined effects.
Pearson correlation coefficients of growth performances (final biomass, final mean
weight, and WG), FCR and survival with dietary trypsin inhibitor, methionine or protein levels
are presented in Table 7. In trial 1 and 2, dietary trypsin inhibitor levels negatively correlated
with growth performance, while positively correlating with FCR. Similarly, dietary lysine
positively correlated with WG while negatively correlating with FCR. Finally, methionine levels
positively correlated with WG while negatively correlating with FCR in trial 2. However, no
correlations of methionine levels were found for WG or FCR in trial 1.
3.3 Physiology trial
The two-way ANOVA analysis for stress and immune responses of L. vannamei fed
different soy ingredients and fermented yeast are presented in Table 8. The combined effect
soy*yeast was significant (P = 0.035) for hemolymph glucose (HG) but the most significant
effect (P = 0.003) was found for the fermented yeast significantly reducing granular cells counts
(GCC). Another important effect was identified when soy ingredients significantly reduced the
47
hemolymph pack cells volume (HPCV). No significant differences were observed in total
hemocyte counts (THC), hyaline cells counts (HCC), semi-granular cells counts (SGCC),
hemolymph protein (HP), hemocyte phagocytic capacity (HPC), or hemocyte respiratory burst
activity (HPBA).
4. Discussion
Dietary protein is one of the most important factors affecting growth performance of
shrimp and feed cost (Hu et al. 2008). Reducing or replacing costly animal protein sources
through the use of more economical plant protein sources such as SBM could result in
substantial saving in feed cost. However, the presence of ANFs in SBM may affect the digestion
and reduce nutrient availability to shrimp (Dersjant-Li 2002), thus limiting the inclusion level of
SBM in practical shrimp diets. By using novel soybean breeding technology, improved soybean
varieties with reduced levels of ANFs and enhanced protein and lipid content could improve
nutrient bioavailability, and therefore allow for the supplementation of these ingredients in
practical shrimp feeds at higher concentrations preventing adverse effects on the digestive
physiology of shrimp. An added benefit of these novel ingredients, compared to commodity
SBM is that these typically have higher protein content which could help meet the shrimp’s
dietary protein requirement at a lower inclusion level; thus, opening more formulation space in
the diet (Fang et al. 2016).
SBM has been successfully utilized as a protein source in practical diets for Pacific white
shrimp. Amaya et al. (2007b) demonstrated that FM could be completely replaced with plant
protein by including 39.52% SBM in combination with 16% PM in practical shrimp feeds
without compromising production or economic performance of L. vannamei reared in ponds. In a
48
different study, Amaya et al. (2007a) also confirmed that good performance can be attained when
shrimp is fed a plant protein-based feed with 56.46% solvent extracted SBM in combination with
1% squid meal (SM). Moreover, SBM levels up to 58% have been demonstrated to be feasible in
practical shrimp diets without adversely affecting WG, survival, or FCR (Roy et al. 2009;
Sookying & Davis 2011). The apparent success of such high dietary SBM levels indicates that
this product can serve as the primary protein source in practical shrimp diets and thus, the further
evaluation of novel soy cultivars and processing technologies is paramount to further enhance
shrimp aquaculture.
Protein quality of SBM is linked to both the reduction of ANFs and the optimization of
protein digestibility. Of tests commonly used, the evaluation of urease activity (UI) and trypsin
inhibitors are especially useful to identify under processed SBM (Căpriţă et al. 2010). PDI
measures the dispersibility of proteins in water and is generally used as qualitative parameter of
protein denaturation upon thermal processing of SBM (Qin et al. 1996). Manufacturers of soy-
based fish and shrimp feeds require low PDI values to prevent losses of valuable protein into the
aquatic environment (Reinitz 1984). Combining results from PDI and urease tests could become
a useful tool to monitor SBM quality. In the current study, protein contents of ingredients N1-3
(55.33, 47.61, and 49.38 % versus 45.98 %) and lipid contents of N2 and N3 were enhanced
(4.98 and 6.66 % versus 1.54 %) compared to the commodity SBM by using the novel soy
breeding technology (Table 2). However, the trypsin inhibitor levels, urease activity, and PDI of
N2 and N3 were also higher than the commodity SBM (18,423 and 16,943 TIU g-1 vs 8,656 TIU
g-1, 2.27 and 2.20 vs 0.04, and 49.17 and 85.19 vs 26.69) (Table 2). This is due to the fact that
N1 originates in a different cultivar than N2 and N3 and although the second cultivar has
significantly less trypsin inhibitors, the novel processing options utilized were not able to
49
sufficiently reduce these indices to levels comparable to traditional roasting of SBM. Because as
oil is extracted a concomitant concentration of protein occurs in soy products and due to the fact
that both the Kunitz and Bowman-Birk protease inhibitors are proteins, more research is needed
to fine tune the non-thermal novel processing options such that these are able to attain similar
levels of ANFs inactivation as traditional heat treatments (DiPietro & Liener 1989). The
suboptimal inactivation resulted in higher trypsin inhibitors levels in the diets (Table 4).
Trypsin inhibitors have been demonstrated to result in growth depression and pancreatic
hypertrophy in numerous experimental animals (Lim & Akiyama 1992), such as Atlantic salmon
Salmo salar (Olli et al. 1994) and Rainbow trout Oncorhynchus mykiss (Kaushik et al. 1995) as
well as Pacific white shrimp (Fang et al. 2016; Zhou et al. 2015). Negative effects on protein
digestibility have been attributed to trypsin inhibitors due to their capacity to bind digestive
enzymes (Francis et al. 2001), which may negatively affect growth performance of the Pacific
white shrimp. In the present study, shrimp fed diet 5 (HN2) showed significantly reduced WG
compared to the shrimp fed diets 2 (LN1) in trial 1 and 2, as well as compared to shrimp fed with
diets 1, 3 and 8 in trial 2. The FCR was significantly increased when shrimp consumed diet 3
(HN2) in contrast with shrimp fed with diets 1, 2, 3, and 8 in trial 1 and 2 as well as compared to
shrimp fed diet 6 (LN3) in trial 2. The trends of the WG and FCR in trial 1 were similar to those
in trial 2, which points to consistency between results of the two trials. There were slight
differences in the statistics analysis results, which may have resulted from data variation.
In both of the trials, shrimp fed diet 5 exhibited lowest growth across all the treatments.
As diet 5 contained highest trypsin inhibitor level and lowest methionine and lysine levels, we
suspect if trypsin inhibitor level and methionine and lysine levels caused the depressed growth.
In order to demonstrate our thoughts, PCA and multiple regression analysis were performed. In
50
trial 1, the multiple regression results showed that PC3 had a significantly negative impact on
WG while it had positive effect on FCR. From the loading of PC3 (Table 5), PC3 is positively
dominated by trypsin inhibitor level (loading=0.836). Combined the results of PCA and multiple
regression analysis in trial 1, we can infer that trypsin inhibitor pose negative effect on WG but
positive effect on FCR. In trial 2, PC2 and PC3 have significantly negative influence on WG,
however they have positive effect on FCR. PC2 is negatively dominated by lysine (loading=-
0.495) followed by methionine (-0.205). Combined the results of PCA and multiple regression
analysis in trial 2, we can infer that trypsin inhibitor pose negative effect on WG but positive
effect on FCR. Methionine and lysine levels had positive effect on WG but negative effect on
FCR. Therefore, from the results of PCA and multiple regression analysis, we may infer that the
significantly reduced growth may be attributed to the high trypsin inhibitor level and relatively
insufficient essential amino acids (typically methionine and lysine) levels as well as their
combined effects. Also, the results of correlation analysis in the present experiment confirmed
that protease inhibitor levels in the diets negatively correlated with shrimp growth while
positively correlated with FCR. Similarly, Zhou et al. (2015) and Fang et al. (2016) reported that
the growth performance of Pacific white shrimp was significantly improved when shrimp fed
with diets contained different soybean cultivars with a reduced level of trypsin inhibitors. Based
on correlation analysis, trypsin inhibitors levels in the soybean meal cultivars were confirmed to
be negatively correlated with protein digestibility (Zhou et al. 2015) and shrimp growth (Fang et
al. 2016).
Methionine and lysine are generally the most limiting amino acids in the plants and
rendered animal byproducts. The correlation analysis in the current study demonstrated that
lysine level in the diets positively correlates with growth performance while negatively
51
correlating with FCR in both trial 1 and 2. No correlation of methionine with WG and FCR were
observed in trial 1, while methionine positively correlated with WG while negatively correlated
with FCR in trial 2. The dietary lysine requirement for the Pacific white shrimp estimated by the
broken-line model based on specific growth rate (SGR) was 2.05% of diet (dry weight basis) or
4.93% of dietary protein (Xie et al. 2012). With regards to the methionine requirement, the
information for Pacific white shrimp is still limited. In the present study, dietary lysine and
methionine levels (Table 4) were both lowest for diets 5 (lysine: 1.89% of diet, methionine:
0.51% of the diet) which might partially explained relatively reduced WG and increased FCR in
this treatment.
In the current study, fermented yeast supplementation at 0.13% of diet did not affect the
WG of the shrimp. Similarly, Tipsemongkol et al. (2009) reported that 0.125% supplementation
of a fermented yeast product did not affect the WG of Pacific white shrimp. However, WG of
shrimp was significantly improved when the supplementation increased to 0.25%. By contrast,
Deng et al. (2013) indicated that final mean weight of Pacific white shrimp was significantly
improved under pond conditions when a fermented yeast product was included at both 1.0 and
1.5 g kg-1. In pond trials, natural food is available to shrimp, which may probably mask the
effects of fermented yeast products on the growth performance of shrimp, thus causing the
differences among these studies.
As for the physiological trial, independent and combined effects of the fermented yeast
product and the soy ingredients were evaluated in a 2 × 2 factorial design (Table 7). An elevation
of hemolymph glucose (HG) is considered as indicator of stress responses in invertebrates
(Chang et al. 2016). Hemolymph packed cells volume (HPCV) measures the volume percentage
of red blood cells in vertebrates and hemocytes in shrimp. A higher HPCV level is indicative of
52
an increased capacity of the hemocoel to transport oxygen (Birchard 1997). In the current study,
the shrimp fed diets 3, 8 and 9 (HN1, and yeast product) exhibited a significantly higher HG and
lower HPCV content, which indicates that the shrimp in these treatments were stressed. No other
independent or combined effects of these particular diets were observed on immune responses
(THC, HC, SGC, and HPC) of shrimp. However, GC in shrimp fed diets containing the yeast
product was significantly lower than those fed yeast-free diets. Since no decreasing trends were
observed in other immune responses indicators, the reduction of GC in the current study might
be odd or due to the testing errors. Similarly, Tipsemongkol et al. (2009), reported that immune
responses (THC, percentage phagocytosis, superoxide dismutase, and phenol oxidase activity) of
Pacific white shrimp were not affected after 10, 20, and 30 days of feeding with a fermented
yeast product at 0.125%. However, in the same study 0.125% supplementation of a fermented
yeast product in shrimp diets significantly enhanced immune responses after 40 and 50 days of
feeding with the product at 0.125% (Tipsemongkol et al. 2009). The time frame for the present
physiological evaluation was only 15 days, which may be insufficient for immune system of
shrimp to develop detectable responses to the inclusion of dietary fermented yeast.
5. Conclusion
In the present study, the growth performance of shrimp fed N1 diets was highest among
the novel soy ingredients and the commodity SBM. This indicates that breeding technology and
novel soy processing has the potential to increase the nutritional values of SBM for shrimp feeds.
Observed trends on immune indicators of shrimp to both independent and combined effects of
soy ingredients and fermented yeast were not easily discernible and may be related to a
suboptimal exposure period.
53
References
Akiyama, D.M. (1989) Soybean meal utilization by marine shrimp, In: Applewhite, T.H. (Ed.),
Proceeding of the world congress, Vegetable protein utilization in human foods and
animal feedstuffs, pp. 252-265. American Oil Chemists Society, Champaign, Illinois,
USA.
Amaya, E., Davis, D.A. & Rouse, D.B. (2007a) Alternative diets for the Pacific white shrimp
Litopenaeus vannamei. Aquaculture 262, 419-425.
Amaya, E.A., Davis, D.A. & Rouse, D.B. (2007b) Replacement of fish meal in practical diets for
the Pacific white shrimp Litopenaeus vannamei reared under pond conditions.
Aquaculture 262, 393-401.
Birchard, G.F. (1997) Optimal hematocrit: theory, regulation and implications. Am. Zool. 37, 65-
72.
Cabello, F.C. (2006) Heavy use of prophylactic antibiotics in aquaculture: a growing problem for
human and animal health and for the environment. Environ. Microbiol. 8, 1137-1144.
Căpriţă, R., Căpriţă, A. & Creţescu, I. (2010) Protein solubility as quality index for processed
soybean. J. Anim. Sci. Biotechnol. 43, 375-378.
Chang, C.C., Chang, H.C., Liu, K.F. & Cheng, W. (2016) The known two types of
transglutaminases regulate immune and stress responses in white shrimp, Litopenaeus
vannamei. Dev. Comp. Immunol. 59, 164-176.
Davis, D.A. & Arnold, C.R. (2000) Replacement of fish meal in practical diets for the Pacific
white shrimp, Litopenaeus vannamei. Aquaculture 185, 291-298.
DiPietro, C,M. & Liener, I.E. (1989) Heat inactivation of the Kunitz and Bowman-Birk soybean
protease inhibitors. J. Agric. Food Chem. 37, 39-44.
54
Deng, D., Mei, C., Mai, K., Tan, B.P., Ai, Q. & Ma, H. (2013) Effects of a yeast-based additive
on growth and immune responses of white shrimp, Litopenaeus vannamei (Boone, 1931),
and aquaculture environment. Aquac. Res. 44, 1348-1357.
Dersjant-Li, Y. (2002) The use of soy protein in aquafeeds. In: Cruz-Suarez, L.E., Ricque-Marie,
D., Tapia-Salazar, M., Gaxiola-Cortes, M.G., Simoes, N. (Eds.), Avances en Nutricion
Acuicola VI - Memorias del VI Simposium Internacional de Nutricion Acuicola. 3-6 de
Septiembre del 2002. Universidad Autonoma de Nuevo Leon, Monterrey, México, pp.
541-558. Cancun, Quintana Roo, México.
Fang, X., Yu, D., Buentello, A., Zeng, P. & Davis, D.A. (2016) Evaluation of new non-
genetically modified soybean varieties as ingredients in practical diets for Litopenaeus
vannamei. Aquaculture 451, 178-185.
Francis, G., Makkar, H.P.S. & Becker, K. (2001) Antinutritional factors present in plant-derived
alternate fish feed ingredients and their effects in fish. Aquaculture 199, 197-227.
Hu, Y., Tan, B., Mai, K., Ai, Q., Zheng, S. & Cheng, K. (2008) Growth and body composition of
juvenile white shrimp, Litopenaeus vannamei, fed different ratios of dietary protein to
energy. Aquac. Nutr. 14, 499-506.
Kaushik, S.J., Cravedi, J.P., Lalles, J.P., Sumpter, J., Fauconneau, B. & Laroche, M. (1995)
Partial or total replacement of fish meal by soybean protein on growth, protein utilization,
potential estrogenic or antigenic effects, cholesterolemia and flesh quality in rainbow
trout, Oncorhynchus mykiss. Aquaculture 133, 257-274.
Li, P. & Gatlin, D.M. (2005) Evaluation of the prebiotic GroBiotic®-A and brewers yeast as
dietary supplements for sub-adult hybrid striped bass (Morone chrysops× M. saxatilis)
challenged in situ with Mycobacterium marinum. Aquaculture 248, 197-205.
55
Lim, C. & Akiyama, D.M. (1992) Full-fat soybean meal utilization by fish. Asian Fish. Sci. 5,
181-197.
Mustafa, A., MacWilliams, C., Fernandez, N., Matchett, K., Conboy, G.A. & Burka, J.F. (2000)
Effects of Sea Lice (Lepeophtheirussalmonis Kroyer, 1837) infestation on macrophage
functions in Atlantic salmon (Salmo salar L.). Fish Shellfish Immunol. 10, 47-59
New, M.B. (1987) Feed and feeding of fish and shrimp: A manual on the preparation of
compound feeds for shrimp and fish in aquaculture. FAO, ADCP, Roma, pp. 275.
Olli, J.J., Hjelmeland, K. & Krogdahl, Å. (1994) Soybean trypsin inhibitors in diets for Atlantic
salmon (Salmo salar, L): effects on nutrient digestibilities and trypsin in pyloric caeca
homogenate and intestinal content. Comp. Biochem. Physiol. A 109, 923-928.
Pérez‐Sánchez, T., Ruiz‐Zarzuela, I., Blas, I. & Balcázar, J.L. (2014) Probiotics in aquaculture: a
current assessment. Rev. Aquac. 6, 133-146.
Qin, G., Ter Elst, E.R., Bosch, M.W. & Van der Poel, A.F.B. (1996) Thermal processing of
whole soya beans: Studies on the inactivation of antinutritional factors and effects on
ileal digestibility in piglets. Anim. Feed Sci. Technol. 57, 313-324.
Reinitz, G. (1984) Protein dispersibility index (PDI) as a quality control measure for soy flour
used in brown trout starter feed. Prog. Fish Cult. 46, 161-164.
Roy, L.A., Bordinhon, A., Sookying, D., Davis, D.A., Brown, T.W. & Whitis, G.N. (2009)
Demonstration of alternative feeds for the Pacific white shrimp, Litopenaeus vannamei,
reared in low salinity waters of west Alabama. Aquac. Res. 40, 496-503.
Sharifuzzaman, S.M. & Austin, B. (2009) Influence of probiotic feeding duration on disease
resistance and immune parameters in rainbow trout. Fish Shellfish Immunol. 27, 440-445.
56
Sookying, D. & Davis, D.A. (2011) Pond production of Pacific white shrimp Litopenaeus
vannamei fed high levels of soybean meal in various combinations. Aquaculture 319,
141-149.
Sororzano, L. (1969) Determination of ammonia in natural waters by the phenolhypochlorite
method. Limnol. Oceanogr. 14, 799-801.
Spotte, S. (1979) Fish and invertebrate culture: water management in closed systems, 2nd
edition. Wiley, New York.
Taylor, N.G.H., Verner-Jeffreys, D.W. & Baker-Austin, C. (2011) Aquatic systems: maintaining,
mixing and mobilising antimicrobial resistance? Trends Ecol. Evol. 26, 278-284.
Tipsemongkol, C., Purivirojkul, W. & Chuchird, N. (2009) Effects of DVAQUA® on the
growth, survival and immune characteristics of Pacific White Shrimp Litopenaeus
vannamei. Kasersart University Fisheries Rsearch Bulletin, 33, 15-26.
Xie, F., Zeng, W., Zhou, Q., Wang, H., Wang, T., Zheng, C. & Wang, Y. (2012) Dietary lysine
requirement of juvenile Pacific white shrimp, Litopenaeus vannamei. Aquaculture 358,
116-121.
Yeh, S.T., Liu, C.H. & Chen, J.C. (2004) Effect of copper sulfate on the immune response and
susceptibility to Vibrio alginolyticus in the white shrimp Litopenaeus vannamei. Fish
Shellfish Immunol. 17, 437-446
Zhou, Y.G., Davis, D.A. & Buentello, A. (2015) Use of new soybean varieties in practical diets
for the Pacific white shrimp, Litopenaeus vannamei. Aquac. Nutr. 21, 635-643.
Zhu, X., Davis, D.A., Roy, L.A., Samocha, T.M. & Lazo, J.P. (2013) Response of Pacific white
shrimp, Litopenaeus vannamei, to three sources of solvent extracted soybean meal. J.
World Aquac. Soc. 44, 396-404.
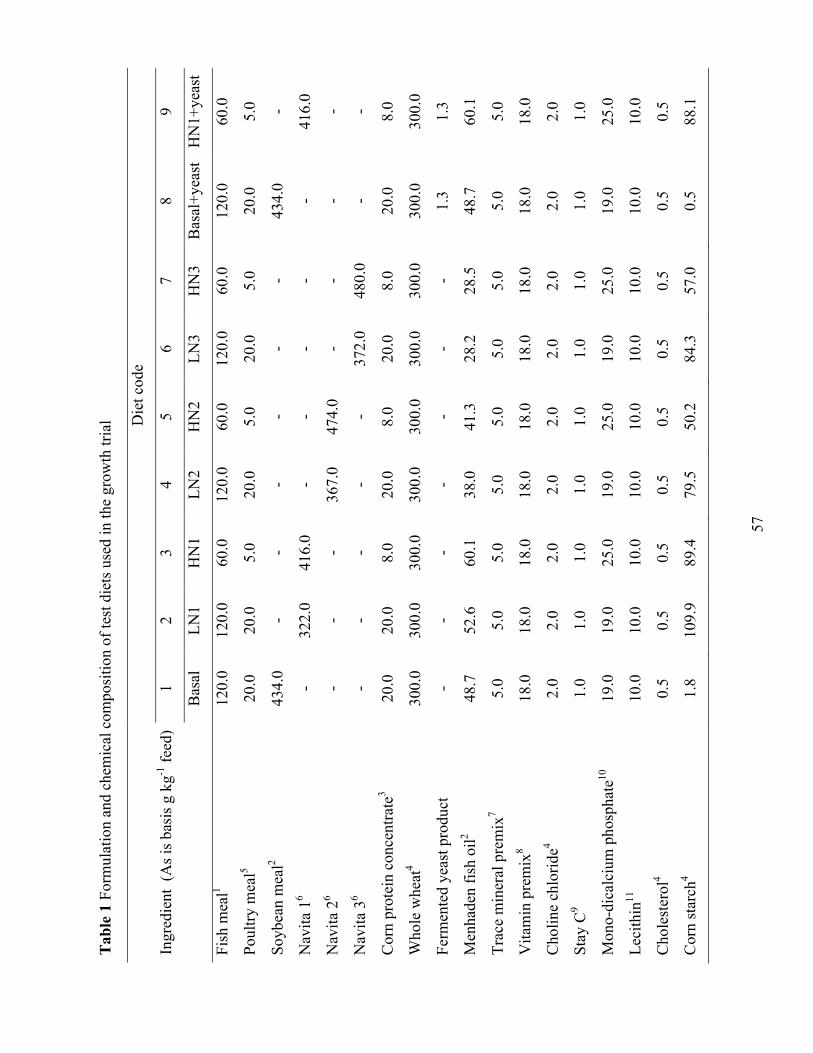
57
Tab
le 1
For
mul
atio
n an
d ch
emic
al c
ompo
sitio
n of
test
die
ts u
sed
in th
e gr
owth
tria
l
Ingr
edie
nt (
As i
s bas
is g
kg-1
feed
)
Die
t cod
e
1 2
3 4
5 6
7 8
9
Bas
al
LN1
HN
1 LN
2 H
N2
LN3
HN
3 B
asal
+yea
st
HN
1+ye
ast
Fish
mea
l1 12
0.0
120.
0 60
.0
120.
0 60
.0
120.
0 60
.0
120.
0 60
.0
Poul
try m
eal5
20.0
20
.0
5.0
20.0
5.
0 20
.0
5.0
20.0
5.
0
Soyb
ean
mea
l2 43
4.0
- -
- -
- -
434.
0 -
Nav
ita 1
6 -
322.
0 41
6.0
- -
- -
- 41
6.0
Nav
ita 2
6 -
- -
367.
0 47
4.0
- -
- -
Nav
ita 3
6 -
- -
- -
372.
0 48
0.0
- -
Cor
n pr
otei
n co
ncen
trate
3 20
.0
20.0
8.
0 20
.0
8.0
20.0
8.
0 20
.0
8.0
Who
le w
heat
4 30
0.0
300.
0 30
0.0
300.
0 30
0.0
300.
0 30
0.0
300.
0 30
0.0
Ferm
ente
d ye
ast p
rodu
ct
- -
- -
- -
- 1.
3 1.
3
Men
hade
n fis
h oi
l2 48
.7
52.6
60
.1
38.0
41
.3
28.2
28
.5
48.7
60
.1
Trac
e m
iner
al p
rem
ix7
5.0
5.0
5.0
5.0
5.0
5.0
5.0
5.0
5.0
Vita
min
pre
mix
8 18
.0
18.0
18
.0
18.0
18
.0
18.0
18
.0
18.0
18
.0
Cho
line
chlo
ride4
2.0
2.0
2.0
2.0
2.0
2.0
2.0
2.0
2.0
Stay
C9
1.0
1.0
1.0
1.0
1.0
1.0
1.0
1.0
1.0
Mon
o-di
calc
ium
pho
spha
te10
19
.0
19.0
25
.0
19.0
25
.0
19.0
25
.0
19.0
25
.0
Leci
thin
11
10.0
10
.0
10.0
10
.0
10.0
10
.0
10.0
10
.0
10.0
Cho
lest
erol
4 0.
5 0.
5 0.
5 0.
5 0.
5 0.
5 0.
5 0.
5 0.
5
Cor
n st
arch
4 1.
8 10
9.9
89.4
79
.5
50.2
84
.3
57.0
0.
5 88
.1
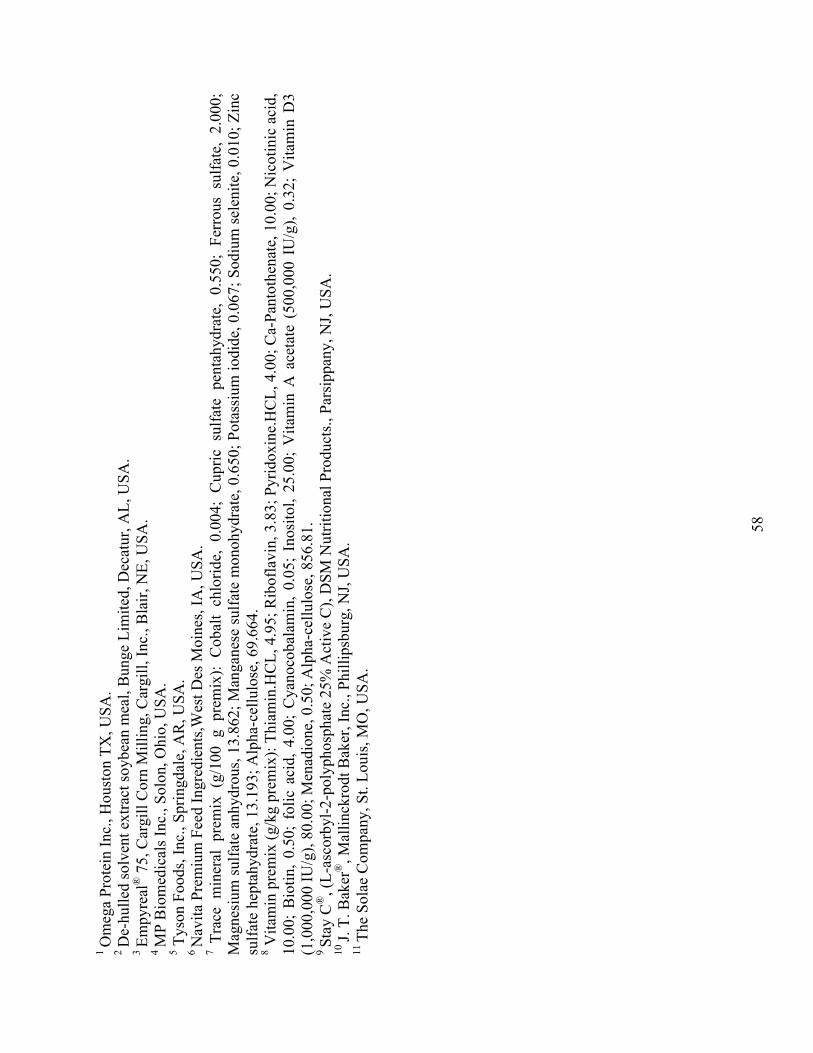
58
1 O
meg
a Pr
otei
n In
c., H
oust
on T
X, U
SA.
2 D
e-hu
lled
solv
ent e
xtra
ct so
ybea
n m
eal,
Bun
ge L
imite
d, D
ecat
ur, A
L, U
SA.
3 Em
pyre
al®
75,
Car
gill
Cor
n M
illin
g, C
argi
ll, In
c., B
lair,
NE,
USA
. 4 M
P B
iom
edic
als I
nc.,
Solo
n, O
hio,
USA
. 5 T
yson
Foo
ds, I
nc.,
Sprin
gdal
e, A
R, U
SA.
6 N
avita
Pre
miu
m F
eed
Ingr
edie
nts,W
est D
es M
oine
s, IA
, USA
.
7 Tr
ace
min
eral
pre
mix
(g/
100
g pr
emix
): C
obal
t ch
lorid
e, 0
.004
; C
upric
sul
fate
pen
tahy
drat
e, 0
.550
; Fe
rrou
s su
lfate
, 2.
000;
M
agne
sium
sulfa
te a
nhyd
rous
, 13.
862;
Man
gane
se su
lfate
mon
ohyd
rate
, 0.6
50; P
otas
sium
iodi
de, 0
.067
; Sod
ium
sele
nite
, 0.0
10; Z
inc
sulfa
te h
epta
hydr
ate,
13.
193;
Alp
ha-c
ellu
lose
, 69.
664.
8 V
itam
in p
rem
ix (g
/kg
prem
ix):
Thia
min
.HC
L, 4
.95;
Rib
ofla
vin,
3.8
3; P
yrid
oxin
e.H
CL,
4.0
0; C
a-Pa
ntot
hena
te, 1
0.00
; Nic
otin
ic a
cid,
10
.00;
Bio
tin, 0
.50;
fol
ic a
cid,
4.0
0; C
yano
coba
lam
in, 0
.05;
Ino
sito
l, 25
.00;
Vita
min
A a
ceta
te (
500,
000
IU/g
), 0.
32;
Vita
min
D3
(1,0
00,0
00 IU
/g),
80.0
0; M
enad
ione
, 0.5
0; A
lpha
-cel
lulo
se, 8
56.8
1.
9 St
ay C
®, (
L-as
corb
yl-2
-pol
ypho
spha
te 2
5% A
ctiv
e C
), D
SM N
utrit
iona
l Pro
duct
s., P
arsi
ppan
y, N
J, U
SA.
10 J.
T. B
aker
®, M
allin
ckro
dt B
aker
, Inc
., Ph
illip
sbur
g, N
J, U
SA.
11 Th
e So
lae
Com
pany
, St.
Loui
s, M
O, U
SA.
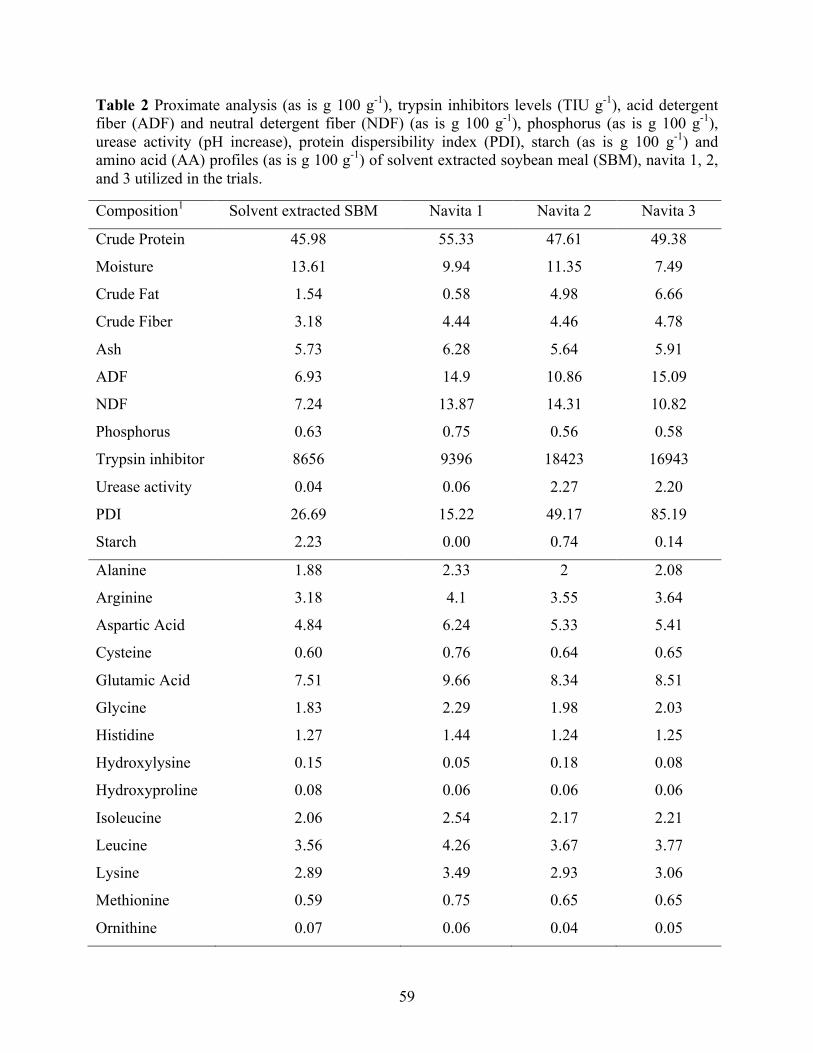
59
Table 2 Proximate analysis (as is g 100 g-1), trypsin inhibitors levels (TIU g-1), acid detergent fiber (ADF) and neutral detergent fiber (NDF) (as is g 100 g-1), phosphorus (as is g 100 g-1), urease activity (pH increase), protein dispersibility index (PDI), starch (as is g 100 g-1) and amino acid (AA) profiles (as is g 100 g-1) of solvent extracted soybean meal (SBM), navita 1, 2, and 3 utilized in the trials.
Composition1 Solvent extracted SBM Navita 1 Navita 2 Navita 3
Crude Protein 45.98 55.33 47.61 49.38
Moisture 13.61 9.94 11.35 7.49
Crude Fat 1.54 0.58 4.98 6.66
Crude Fiber 3.18 4.44 4.46 4.78
Ash 5.73 6.28 5.64 5.91
ADF 6.93 14.9 10.86 15.09
NDF 7.24 13.87 14.31 10.82
Phosphorus 0.63 0.75 0.56 0.58
Trypsin inhibitor 8656 9396 18423 16943
Urease activity 0.04 0.06 2.27 2.20
PDI 26.69 15.22 49.17 85.19
Starch 2.23 0.00 0.74 0.14
Alanine 1.88 2.33 2 2.08
Arginine 3.18 4.1 3.55 3.64
Aspartic Acid 4.84 6.24 5.33 5.41
Cysteine 0.60 0.76 0.64 0.65
Glutamic Acid 7.51 9.66 8.34 8.51
Glycine 1.83 2.29 1.98 2.03
Histidine 1.27 1.44 1.24 1.25
Hydroxylysine 0.15 0.05 0.18 0.08
Hydroxyproline 0.08 0.06 0.06 0.06
Isoleucine 2.06 2.54 2.17 2.21
Leucine 3.56 4.26 3.67 3.77
Lysine 2.89 3.49 2.93 3.06
Methionine 0.59 0.75 0.65 0.65
Ornithine 0.07 0.06 0.04 0.05
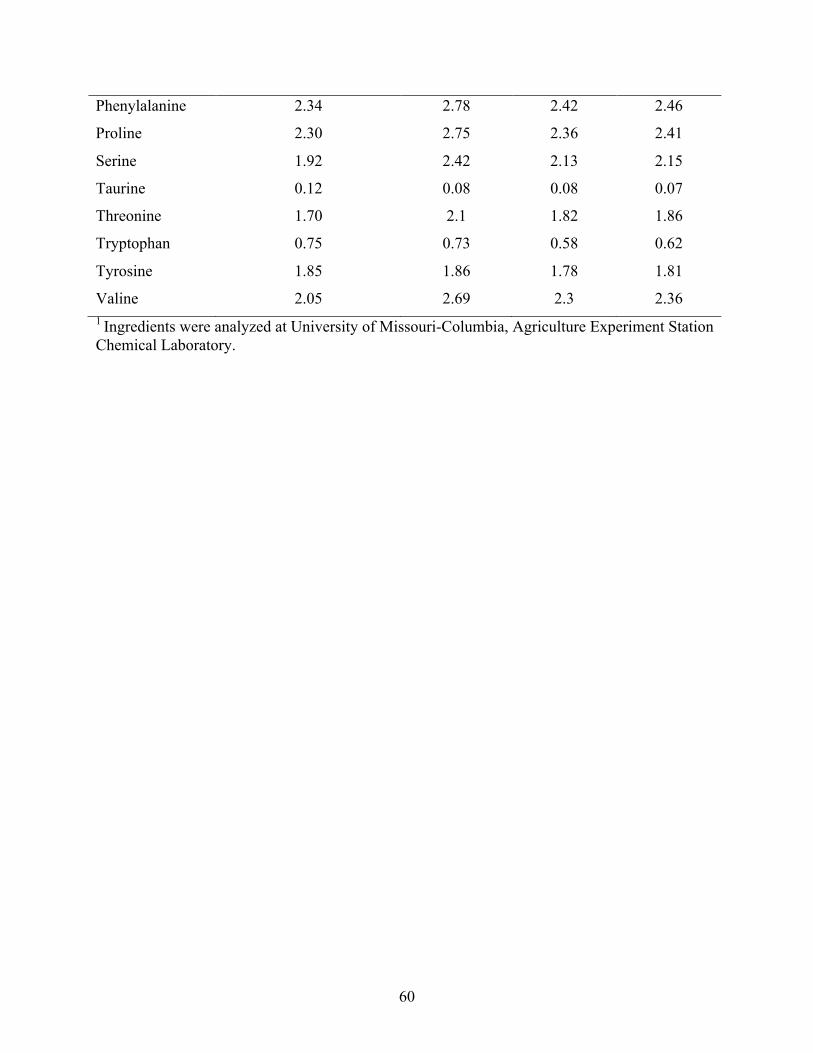
60
Phenylalanine 2.34 2.78 2.42 2.46
Proline 2.30 2.75 2.36 2.41
Serine 1.92 2.42 2.13 2.15
Taurine 0.12 0.08 0.08 0.07
Threonine 1.70 2.1 1.82 1.86
Tryptophan 0.75 0.73 0.58 0.62
Tyrosine 1.85 1.86 1.78 1.81
Valine 2.05 2.69 2.3 2.36 1 Ingredients were analyzed at University of Missouri-Columbia, Agriculture Experiment Station Chemical Laboratory.
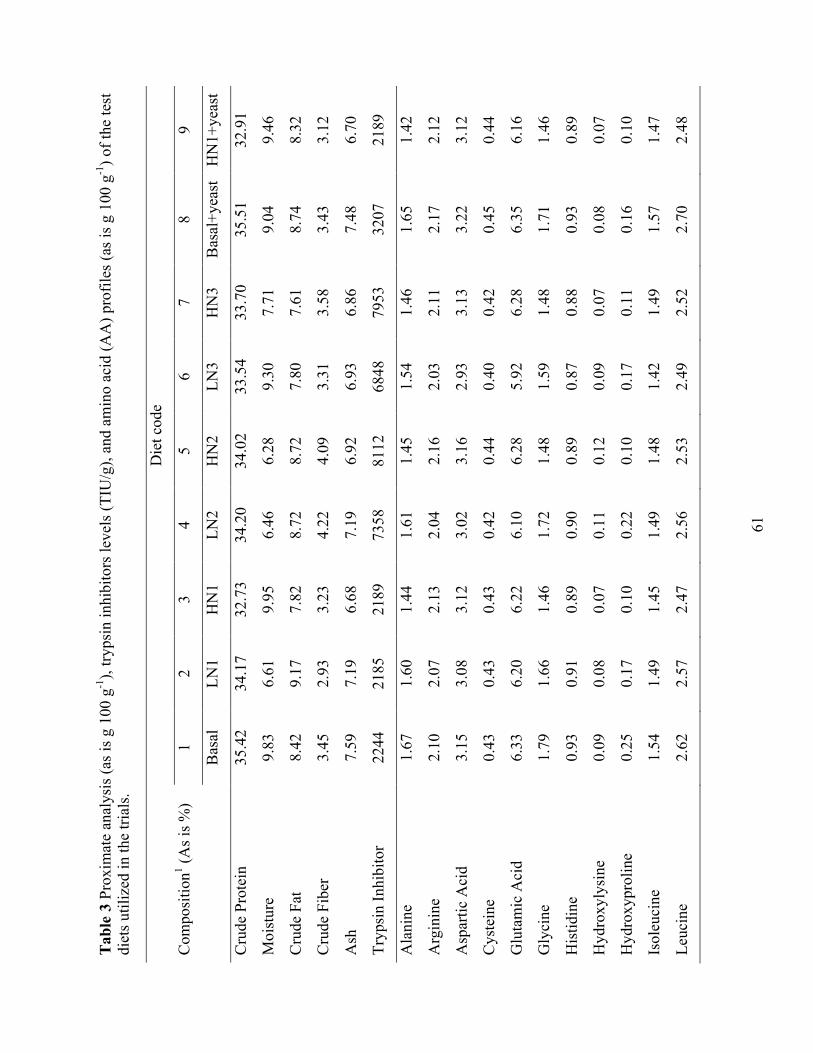
61
Tab
le 3
Pro
xim
ate
anal
ysis
(as i
s g 1
00 g
-1),
tryps
in in
hibi
tors
leve
ls (T
IU/g
), an
d am
ino
acid
(AA
) pro
files
(as i
s g 1
00 g
-1) o
f the
test
di
ets u
tiliz
ed in
the
trial
s.
Com
posi
tion1 (A
s is %
)
Die
t cod
e
1 2
3 4
5 6
7 8
9
Bas
al
LN1
HN
1 LN
2 H
N2
LN3
HN
3 B
asal
+yea
st
HN
1+ye
ast
Cru
de P
rote
in
35.4
2 34
.17
32.7
3 34
.20
34.0
2 33
.54
33.7
0 35
.51
32.9
1
Moi
stur
e 9.
83
6.61
9.
95
6.46
6.
28
9.30
7.
71
9.04
9.
46
Cru
de F
at
8.42
9.
17
7.82
8.
72
8.72
7.
80
7.61
8.
74
8.32
Cru
de F
iber
3.
45
2.93
3.
23
4.22
4.
09
3.31
3.
58
3.43
3.
12
Ash
7.
59
7.19
6.
68
7.19
6.
92
6.93
6.
86
7.48
6.
70
Tryp
sin
Inhi
bito
r 22
44
2185
21
89
7358
81
12
6848
79
53
3207
21
89
Ala
nine
1.
67
1.60
1.
44
1.61
1.
45
1.54
1.
46
1.65
1.
42
Arg
inin
e 2.
10
2.07
2.
13
2.04
2.
16
2.03
2.
11
2.17
2.
12
Asp
artic
Aci
d 3.
15
3.08
3.
12
3.02
3.
16
2.93
3.
13
3.22
3.
12
Cys
tein
e 0.
43
0.43
0.
43
0.42
0.
44
0.40
0.
42
0.45
0.
44
Glu
tam
ic A
cid
6.33
6.
20
6.22
6.
10
6.28
5.
92
6.28
6.
35
6.16
Gly
cine
1.
79
1.66
1.
46
1.72
1.
48
1.59
1.
48
1.71
1.
46
His
tidin
e 0.
93
0.91
0.
89
0.90
0.
89
0.87
0.
88
0.93
0.
89
Hyd
roxy
lysi
ne
0.09
0.
08
0.07
0.
11
0.12
0.
09
0.07
0.
08
0.07
Hyd
roxy
prol
ine
0.25
0.
17
0.10
0.
22
0.10
0.
17
0.11
0.
16
0.10
Isol
euci
ne
1.54
1.
49
1.45
1.
49
1.48
1.
42
1.49
1.
57
1.47
Leuc
ine
2.62
2.
57
2.47
2.
56
2.53
2.
49
2.52
2.
70
2.48

62
Lysi
ne
2.05
1.
99
1.93
1.
92
1.89
1.
89
1.92
2.
07
1.89
Met
hion
ine
0.58
0.
57
0.50
0.
57
0.51
0.
55
0.50
0.
61
0.51
Orn
ithin
e 0.
03
0.02
0.
02
0.02
0.
02
0.02
0.
02
0.02
0.
02
Phen
ylal
anin
e 1.
64
1.59
1.
59
1.59
1.
62
1.54
1.
61
1.68
1.
60
Prol
ine
1.96
1.
74
1.67
1.
92
1.70
1.
81
1.68
1.
83
1.78
Serin
e 1.
53
1.49
1.
49
1.44
1.
45
1.38
1.
47
1.49
1.
41
Taur
ine
0.20
0.
22
0.18
0.
21
0.16
0.
20
0.16
0.
20
0.16
Thre
onin
e 1.
27
1.22
1.
18
1.20
1.
20
1.17
1.
19
1.27
1.
17
Tryp
toph
an
0.44
0.
46
0.40
0.
43
0.44
0.
41
0.47
0.
48
0.46
Tyro
sine
1.
01
0.98
1.
07
0.96
1.
10
1.06
1.
01
1.12
1.
08
Val
ine
1.59
1.
55
1.52
1.
55
1.53
1.
49
1.52
1.
65
1.50
1 D
iets
wer
e an
alyz
ed a
t Uni
vers
ity o
f Mis
sour
i-Col
umbi
a, A
gric
ultu
re E
xper
imen
t Sta
tion
Che
mic
al L
abor
ator
y.
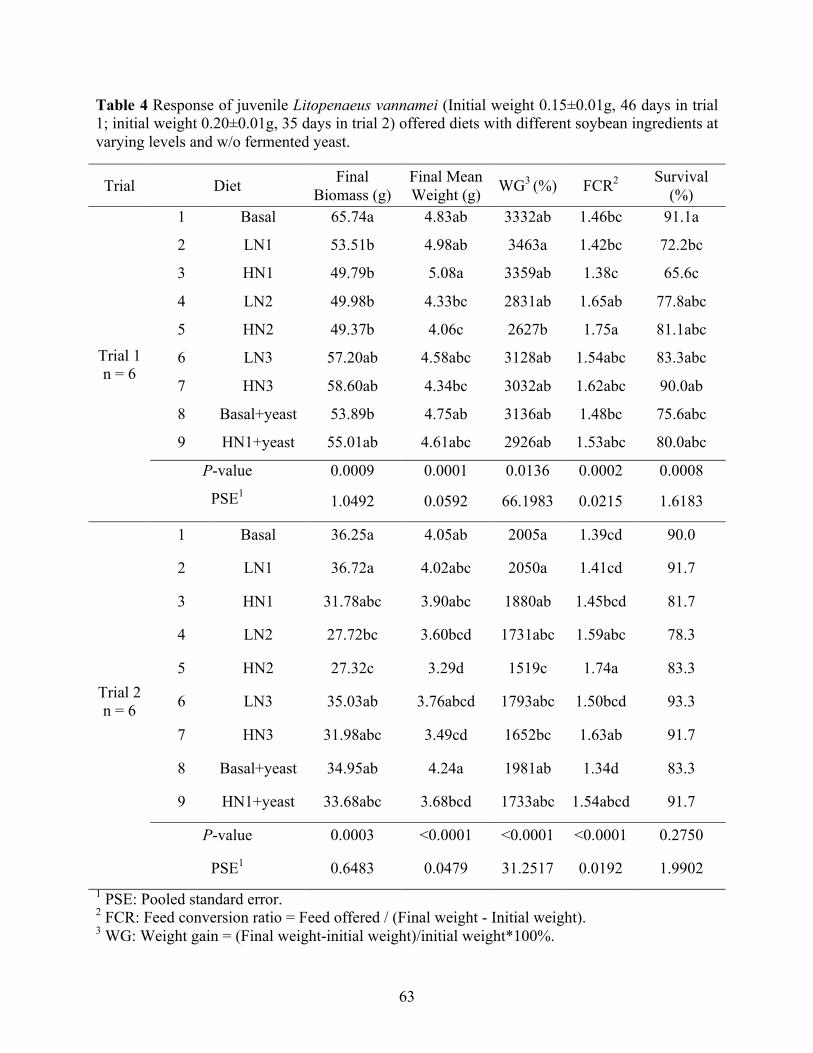
63
Table 4 Response of juvenile Litopenaeus vannamei (Initial weight 0.15±0.01g, 46 days in trial 1; initial weight 0.20±0.01g, 35 days in trial 2) offered diets with different soybean ingredients at varying levels and w/o fermented yeast.
Trial Diet Final Biomass (g)
Final Mean Weight (g) WG3 (%) FCR2 Survival
(%)
Trial 1 n = 6
1 Basal 65.74a 4.83ab 3332ab 1.46bc 91.1a
2 LN1 53.51b 4.98ab 3463a 1.42bc 72.2bc
3 HN1 49.79b 5.08a 3359ab 1.38c 65.6c
4 LN2 49.98b 4.33bc 2831ab 1.65ab 77.8abc
5 HN2 49.37b 4.06c 2627b 1.75a 81.1abc
6 LN3 57.20ab 4.58abc 3128ab 1.54abc 83.3abc
7 HN3 58.60ab 4.34bc 3032ab 1.62abc 90.0ab
8 Basal+yeast 53.89b 4.75ab 3136ab 1.48bc 75.6abc
9 HN1+yeast 55.01ab 4.61abc 2926ab 1.53abc 80.0abc
P-value 0.0009 0.0001 0.0136 0.0002 0.0008
PSE1 1.0492 0.0592 66.1983 0.0215 1.6183
Trial 2 n = 6
1 Basal 36.25a 4.05ab 2005a 1.39cd 90.0
2 LN1 36.72a 4.02abc 2050a 1.41cd 91.7
3 HN1 31.78abc 3.90abc 1880ab 1.45bcd 81.7
4 LN2 27.72bc 3.60bcd 1731abc 1.59abc 78.3
5 HN2 27.32c 3.29d 1519c 1.74a 83.3
6 LN3 35.03ab 3.76abcd 1793abc 1.50bcd 93.3
7 HN3 31.98abc 3.49cd 1652bc 1.63ab 91.7
8 Basal+yeast 34.95ab 4.24a 1981ab 1.34d 83.3
9 HN1+yeast 33.68abc 3.68bcd 1733abc 1.54abcd 91.7
P-value 0.0003 <0.0001 <0.0001 <0.0001 0.2750
PSE1 0.6483 0.0479 31.2517 0.0192 1.9902 1 PSE: Pooled standard error. 2 FCR: Feed conversion ratio = Feed offered / (Final weight - Initial weight). 3 WG: Weight gain = (Final weight-initial weight)/initial weight*100%.

64
Values within a column with different letters are significantly different based on Tukey’s multiple range test.
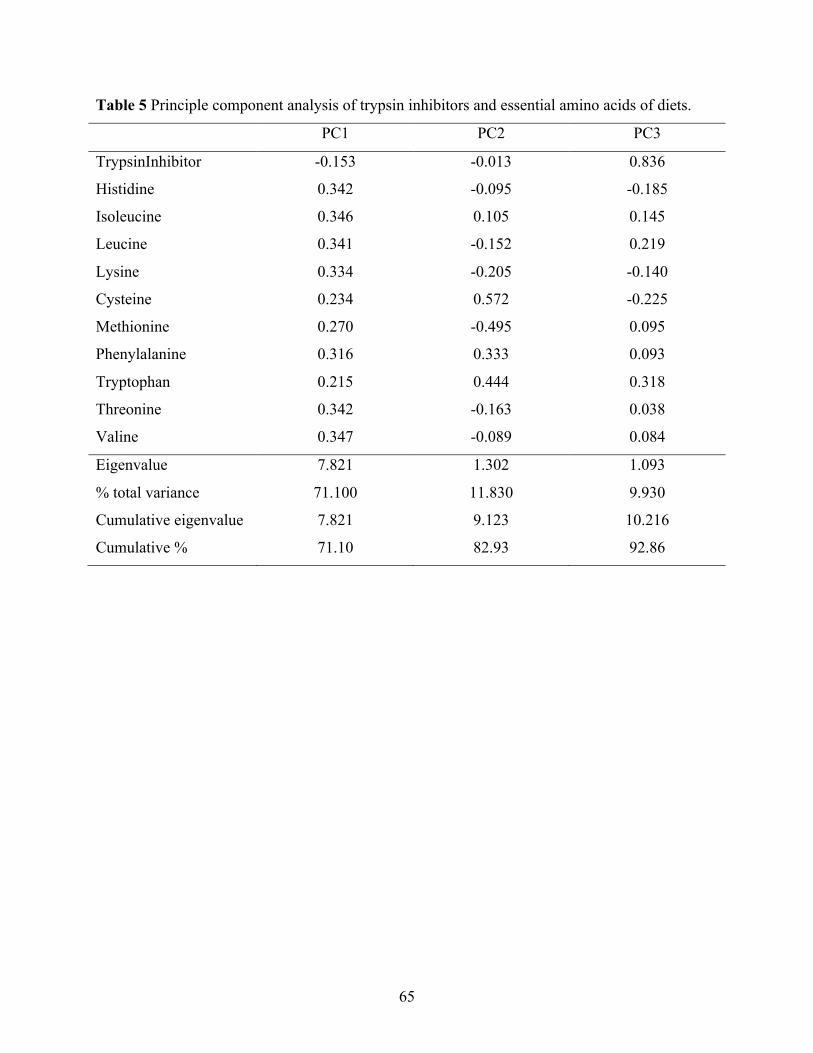
65
Table 5 Principle component analysis of trypsin inhibitors and essential amino acids of diets.
PC1 PC2 PC3
TrypsinInhibitor -0.153 -0.013 0.836
Histidine 0.342 -0.095 -0.185
Isoleucine 0.346 0.105 0.145
Leucine 0.341 -0.152 0.219
Lysine 0.334 -0.205 -0.140
Cysteine 0.234 0.572 -0.225
Methionine 0.270 -0.495 0.095
Phenylalanine 0.316 0.333 0.093
Tryptophan 0.215 0.444 0.318
Threonine 0.342 -0.163 0.038
Valine 0.347 -0.089 0.084
Eigenvalue 7.821 1.302 1.093
% total variance 71.100 11.830 9.930
Cumulative eigenvalue 7.821 9.123 10.216
Cumulative % 71.10 82.93 92.86
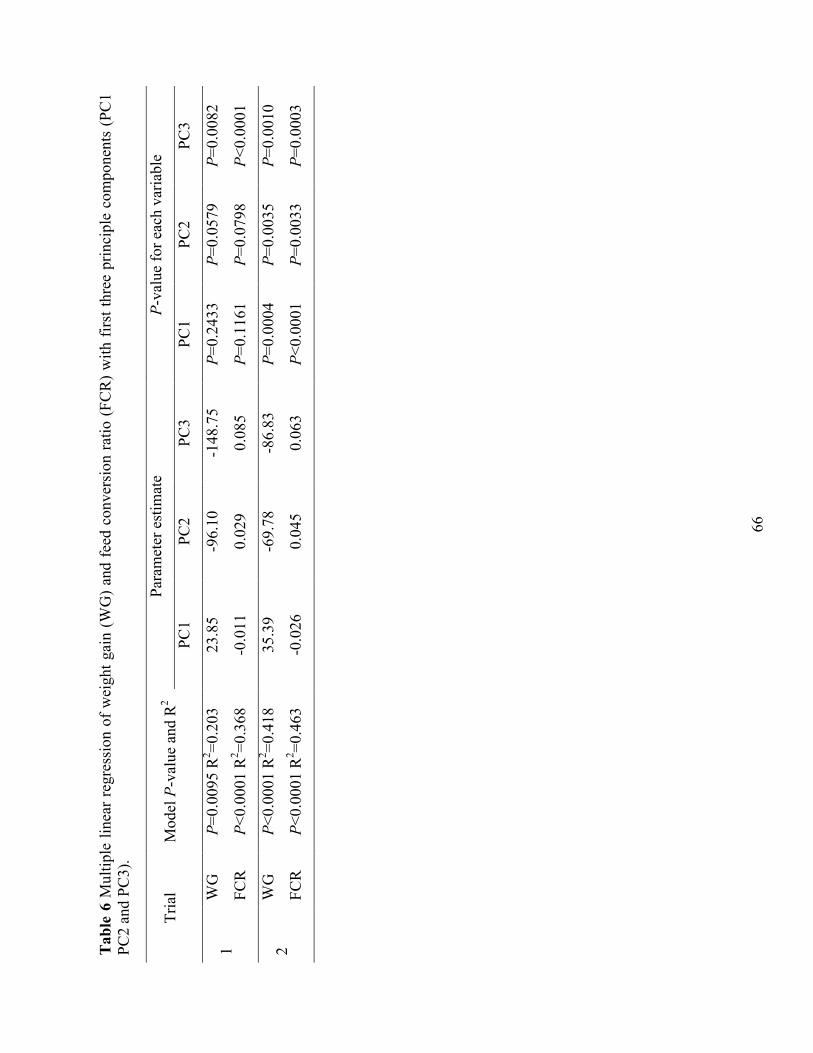
66
Tab
le 6
Mul
tiple
line
ar r
egre
ssio
n of
wei
ght g
ain
(WG
) an
d fe
ed c
onve
rsio
n ra
tio (
FCR
) w
ith f
irst t
hree
prin
cipl
e co
mpo
nent
s (P
C1
PC2
and
PC3)
.
Tria
l M
odel
P-v
alue
and
R2
Para
met
er e
stim
ate
P-va
lue
for e
ach
varia
ble
PC1
PC2
PC3
PC1
PC2
PC3
1 W
G
P=0.
0095
R2 =0
.203
23
.85
-96.
10
-148
.75
P=0.
2433
P=
0.05
79
P=0.
0082
FCR
P<
0.00
01 R
2 =0.3
68
-0.0
11
0.02
9 0.
085
P=0.
1161
P=
0.07
98
P<0.
0001
2 W
G
P<0.
0001
R2 =0
.418
35
.39
-69.
78
-86.
83
P=0.
0004
P=
0.00
35
P=0.
0010
FCR
P<
0.00
01 R
2 =0.4
63
-0.0
26
0.04
5 0.
063
P<0.
0001
P=
0.00
33
P=0.
0003
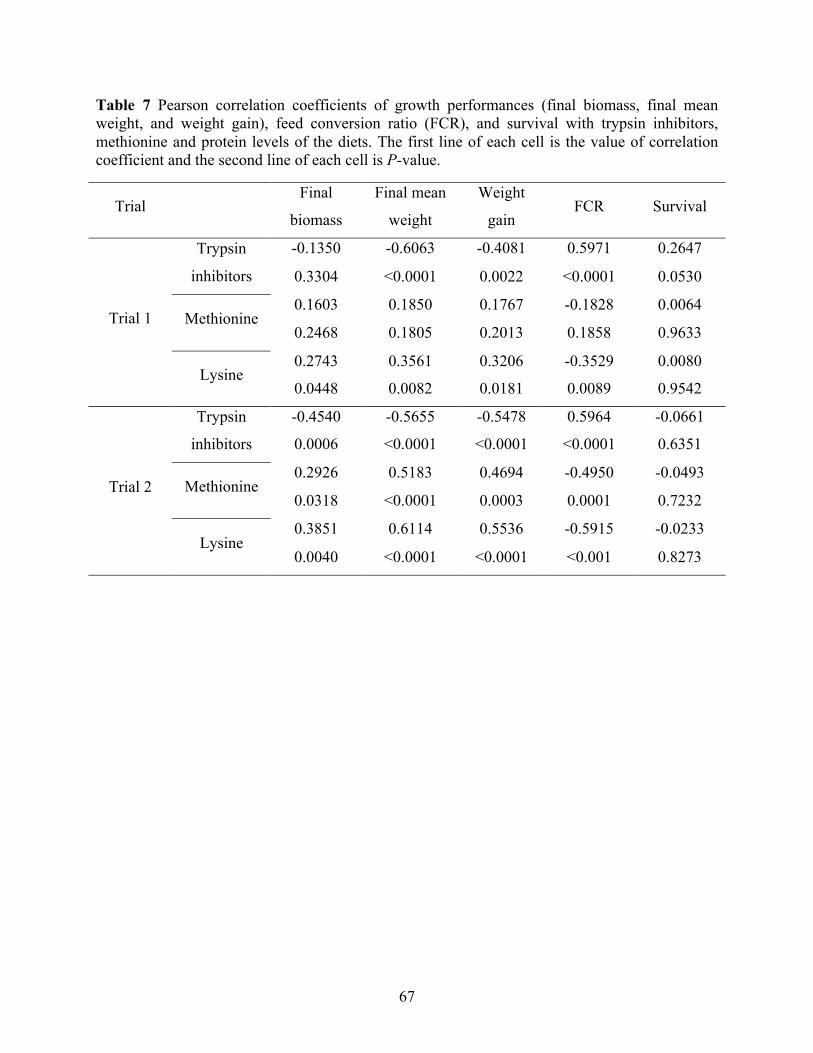
67
Table 7 Pearson correlation coefficients of growth performances (final biomass, final mean weight, and weight gain), feed conversion ratio (FCR), and survival with trypsin inhibitors, methionine and protein levels of the diets. The first line of each cell is the value of correlation coefficient and the second line of each cell is P-value.
Trial Final
biomass
Final mean
weight
Weight
gain FCR Survival
Trial 1
Trypsin
inhibitors
-0.1350 -0.6063 -0.4081 0.5971 0.2647
0.3304 <0.0001 0.0022 <0.0001 0.0530
Methionine 0.1603 0.1850 0.1767 -0.1828 0.0064
0.2468 0.1805 0.2013 0.1858 0.9633
Lysine 0.2743 0.3561 0.3206 -0.3529 0.0080
0.0448 0.0082 0.0181 0.0089 0.9542
Trial 2
Trypsin
inhibitors
-0.4540 -0.5655 -0.5478 0.5964 -0.0661
0.0006 <0.0001 <0.0001 <0.0001 0.6351
Methionine 0.2926 0.5183 0.4694 -0.4950 -0.0493
0.0318 <0.0001 0.0003 0.0001 0.7232
Lysine 0.3851 0.6114 0.5536 -0.5915 -0.0233
0.0040 <0.0001 <0.0001 <0.001 0.8273
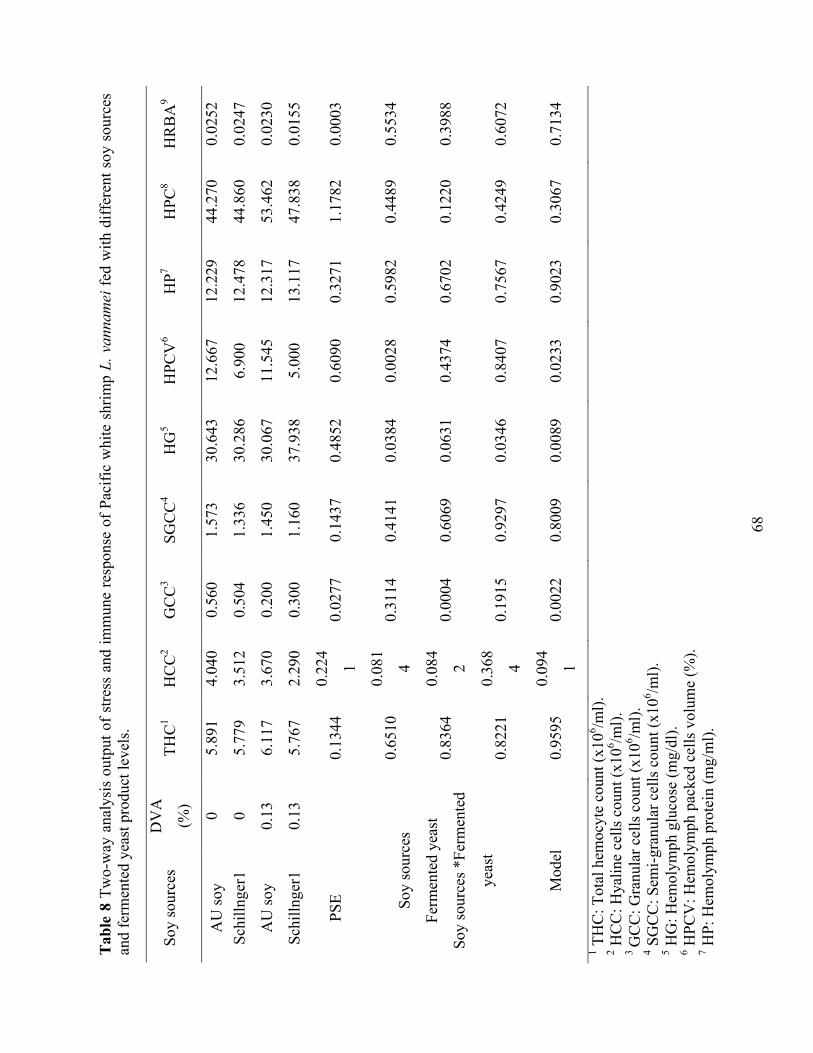
68
Tab
le 8
Tw
o-w
ay a
naly
sis
outp
ut o
f stre
ss a
nd im
mun
e re
spon
se o
f Pac
ific
whi
te s
hrim
p L.
van
nam
ei fe
d w
ith d
iffer
ent s
oy s
ourc
es
and
ferm
ente
d ye
ast p
rodu
ct le
vels
.
Soy
sour
ces
DV
A
(%)
THC
1 H
CC
2 G
CC
3 SG
CC
4 H
G5
HPC
V6
HP7
HPC
8 H
RB
A9
AU
soy
0 5.
891
4.04
0 0.
560
1.57
3 30
.643
12
.667
12
.229
44
.270
0.
0252
Schi
llnge
r1
0 5.
779
3.51
2 0.
504
1.33
6 30
.286
6.
900
12.4
78
44.8
60
0.02
47
AU
soy
0.13
6.
117
3.67
0 0.
200
1.45
0 30
.067
11
.545
12
.317
53
.462
0.
0230
Schi
llnge
r1
0.13
5.
767
2.29
0 0.
300
1.16
0 37
.938
5.
000
13.1
17
47.8
38
0.01
55
PSE
0.
1344
0.
224
1 0.
0277
0.
1437
0.
4852
0.
6090
0.
3271
1.
1782
0.
0003
Soy
sour
ces
Ferm
ente
d ye
ast
Soy
sour
ces *
Ferm
ente
d
yeas
t
0.65
10
0.08
1
4 0.
3114
0.
4141
0.
0384
0.
0028
0.
5982
0.
4489
0.
5534
0.83
64
0.08
4
2 0.
0004
0.
6069
0.
0631
0.
4374
0.
6702
0.
1220
0.
3988
0.82
21
0.36
8
4 0.
1915
0.
9297
0.
0346
0.
8407
0.
7567
0.
4249
0.
6072
Mod
el
0.95
95
0.09
4
1 0.
0022
0.
8009
0.
0089
0.
0233
0.
9023
0.
3067
0.
7134
1 TH
C: T
otal
hem
ocyt
e co
unt (
x106 /m
l).
2 HC
C: H
yalin
e ce
lls c
ount
(x10
6 /ml).
3 G
CC
: Gra
nula
r cel
ls c
ount
(x10
6 /ml).
4 S
GC
C: S
emi-g
ranu
lar c
ells
cou
nt (x
106 /m
l).
5 HG
: Hem
olym
ph g
luco
se (m
g/dl
). 6 H
PCV
: Hem
olym
ph p
acke
d ce
lls v
olum
e (%
). 7 H
P: H
emol
ymph
pro
tein
(mg/
ml).
69
8 HPC
: Hem
ocyt
e ph
agoc
ytic
cap
acity
(%).
9 HR
BA
: Hem
ocyt
e re
spira
tory
bur
st a
ctiv
ity (O
D).

70
CHAPTER IV
EVALUATION OF DRIED FERMENTED BIOMASS AS A FEED INGREDIENT IN
PLANT-BASED PRACTICAL DIETS FOR JUVENILE PACIFIC WHITE SHRIMP
Litopenaeus vannamei
1. Introduction
As shrimp consumption is expected to continue to increase globally, it is important to
develop sustainable alternative ingredients in shrimp diets to support the rapid expansion of the
shrimp industry (Achupallas et al., 2016). A range of traditional plant protein products from
agricultural production such as soybean meal (SBM) and corn gluten meal (CGM) have been
identified as appropriate alternative ingredients to complement or replace fish meal (FM) in
shrimp feeds. To further enhance the protein composition of SBM and CGM, various processes
have been utilized to create concentrates which have been used with good success in practical
shrimp feed formulations (Alam et al. 2005; Bauer et al. 2012; Fang et al. 2016; Paripatananont
et al. 2001; Qiu & Davis 2016a; b; c; d; Sookying & Davis 2012; Zhou et al. 2015). The
successful replacement of FM by soy- and corn-based products can result in reduced cost of feed
to a certain extent, however, the higher protein products are also somewhat expensive.
Coproducts of manufacturing processes have been gaining interests as alternative protein
sources in shrimp feeds as they have high nutritional value for less cost, because these are
derived from secondary streams of various commodity processing applications. Corn and wheat
coproducts such as distiller’s dried grains with solubles, fermented bacterial biomass, and
ethanol yeast are the most popular coproducts from the biofuels and ethanol industries.
Fermented bacterial biomass received considerable attention because of its well-known
71
properties of rapid growth and protein accretion in protein production (Kuhad et al. 1997;
Stringer 1982). Various strains of bacteria with a carbohydrate sugar source such as molasses,
sucrose, or glucose were utilized in the fermentation process for L-threonine (Melanie et al.
2015). This process results in a dried fermented biomass which is derived from the manufacture
of L-thereonine by fermentation using Escherichia coli. It has a high protein content (up to 800 g
kg-1) and good amino acid (AA) composition, which may serve as a potential alternative protein
ingredient in the aqua feed industry.
This DFB product has been confirmed to successfully replace FM and SBM in nursery
diets for pigs (Perez et al. 2011) and served as a substitution for FM in practical diets for Florida
pompano, Trachinotus carolinus (Melanie et al. 2015). However, information about the
application of DFB in practical shrimp feed is still limited. Therefore, the purposes of this study
were to determine the biological responses of Pacific white shrimp, L. vannamei to dietary DFB
supplementation as a replacement for FM or soy protein concentrate (SPC) w/o corn protein
concentrate (CPC). Additionally, the effects of two drying processes on nutritional value of the
meals to shrimp were assessed.
2. Material and Methods
2.1. Experimental design and diets
All test diets were formulated to be iso-nitrogenous and iso-lipidic (350 g kg-1 protein and
80 g kg-1 lipid). In trial 1, the basal diet was primarily composed of FM, SBM, corn gluten meal,
and whole wheat. Four experimental diets (DF0, DFB25, DFB50, and DFB100) were formulated
to utilize increasing levels (0, 25, 50, and 100 g kg-1) of DFB as a replacement of FM (Table 1).
In trial 2, the basal diet was primarily consisted of FM, SBM, corn protein concentrate (CPC),
72
and soy protein concentrate (SPC). Nine experiment diets were formulated to be supplemented
with increasing levels (0, 20, 40, 60, and 120 g kg-1) of SDFB and GDFB) to replace SPC w/o
CPC (Table 2).
Primary ingredients were analyzed at University of Missouri Agricultural Experiment
Station Chemical Laboratories (Columbia, MO, USA) for proximate and amino acid composition
(Table 3). All experimental diets were produced at the Aquatic Animal Nutrition Laboratory at
the School of Fisheries, Aquaculture, and Aquatic Sciences, Auburn University (Auburn, AL,
USA), using standard procedures for shrimp feeds. Briefly, diets were prepared by mixing the
pre-ground dry ingredients in a food mixer (Hobart, Troy, OH, USA) for 10–15 minutes. Hot
water was then blended into the mixture to obtain a consistency appropriate for pelleting. Diets
were pressure-pelleted using a meat grinder with a 3-mm die in trial and a 2.5-mm die in trial 2.
The moist pellets were then placed into a fan-ventilated oven (< 50 °C) overnight in order to
attain a moisture content of less than 10%. Dry pellets were crumbled, packed in sealed bags,
and stored in a freezer until use. The diets from trial 2 were analyzed at University of Missouri
Agricultural Experiment Station Chemical Laboratories (Columbia, MO, USA) for proximate
and amino acid composition (Table 4)
2.2. Growth trials
Two trials were conducted at the E.W. Shell Fisheries Research Station, Auburn
University (Auburn, AL, USA). Pacific white shrimp post larvae (PL) were obtained from
Shrimp Improvement Systems (Islamorada, Florida) and nursed in an indoor recirculating
system. PLs were fed a commercial feed (Zeigler Bros., Inc., Gardners, Pennsylvania, USA)
using an automatic feeder for ~1 week, and then switched to crumbled commercial shrimp feed
(Zeigler Bros., Inc., Gardners, Pennsylvania, USA) for ~1- 2 weeks.
73
In trial 1, the recirculating system consisted of 16 square tanks (340 L) connected to a
common reservoir, biological filter, bead filter, fluidized biological filter and recirculation pump.
Four replicate groups of shrimp (0.59 g initial mean weight; 10 shrimp / tank) were offered diets
using our standard feeding protocol over 6 weeks. Based on historic results, feed inputs were
pre-programmed assuming the shrimp would double their weight weekly up to one gram then
gain 0.8 g weekly with a feed conversion ratio (FCR) of 1.8. Daily allowances of feed were
adjusted based on observed feed consumption, weekly counts of the shrimp and mortality.
Consequently, for each tank in trial 1, a fixed ration of 1.5 g day-1 for the first and second week
and 2.1 g day-1 for the remaining culturing period was offered, partitioned in 4 feedings each
day.
In trial 2, the recirculating system consisted of 45 aquaria (80 L) connected to a common
reservoir, biological filter, bead filter, fluidized biological filter and recirculation pump. Four
replicate groups of shrimp (2.34 g initial mean weight, 10 shrimp / tank) were offered diets using
a standard feeding protocol over 6 weeks. Based on historic results, feed inputs were pre-
programmed assuming the shrimp would double their weight weekly up to one gram then gain
0.8-1.4 g weekly with a feed conversion ratio (FCR) of 1.8. Daily allowances of feed were
adjusted based on observed feed consumption, weekly counts of the shrimp and mortality.
Consequently, for each tank in trial 2, a fixed ration of 2.1 g day-1 for the first week, 2.6 g day-1
for the second week, 2.8 g day-1 for the third week, 3.3 g day-1 for the fourth and fifth week, and
3.6 g day-1 for the last week was allotted in 4 portions per day.
At the conclusion of each growth trial, shrimp were counted and group-weighed. Mean
final weight, FCR, WG, biomass, and survival were determined (Table 5 and Table 6). After
obtaining the final total weight of shrimps in each aquarium, four shrimps from each tank in trial
74
2 were frozen at -20 °C for subsequent determination of whole body composition. Proximate
composition of whole shrimp was analyzed by Midwest Laboratories (Omaha, NE, USA).
Protein retention was calculated as follows:
Protein retention efficiency (PRE, %) = (final weight × final protein content) - (initial weight ×
initial protein content) × 100 / protein offered.
2.3. Water quality monitoring
For both trials, dissolved oxygen (DO), water temperature and salinity were measured
twice daily using a YSI 650 multi-parameter instrument (YSI, Yellow Springs, OH, USA).
Hydrogen potential (pH) was measured twice weekly using a waterproof pHTestr30 (Oakton
instrument, Vernon Hills, IL, USA). Total ammonia-nitrogen (TAN) and nitrite were evaluated
every week using the methods described by Solorzano (1969) and Spotte (1979).
2.4. Statistical analysis
All the data were analyzed using SAS (V9.3. SAS Institute, Cary, NC, USA). Data from
trial 1 and 2 were analyzed using one-way ANOVA to determine significant differences (P <
0.05) among treatments followed by Tukey’s multiple comparison test to determine difference
between treatment means in each trial. The pooled standard errors were used across growth trials,
as the variance of each treatment is the same. Analysis of covariance (ANCOVA) was performed
to determine the importance of the processing methods (covariate) in trial 2.
75
3. Results
3.1. Water quality
In trial 1, DO, temperature, and salinity were maintained at 6.18 ± 0.41 mg L-1, 29.7 ± 0.8
°C, and 2.8 ± 0.4 ppt, respectively. In trial 2, DO, temperature, salinity, pH, TAN, and nitrite
were maintained at 6.94 ± 0.47 mg L-1, 28.5 ± 0.7 °C, 8.6 ± 0.7 ppt, 7.2 ± 0.4, 0.05 ± 0.05 mg L-
1, and 0.05 ± 0.05 mg L-1, respectively. Water quality conditions in both of the trials were
suitable for normal growth and survival of this species.
3.2. Growth trials
Performances of Pacific white shrimp offered diets with various DFB levels in Trials 1
and 2 are presented in Tables 5 and 6, respectively. In trial 1, final mean weight, WG and FCR
were not negatively affected when shrimp fed with diets contained up to 50 g kg-1 DFB as a
replacement of FM. However, a level of 100 g kg-1 DFB significantly decreased WG but
increased FCR. No significant differences were detected in final biomass (57% to 62.7%) or
survival (100%) across all the treatments.
In trial 2, shrimp fed with diet contained 20 g kg-1 GDFB performed the best across all
the treatments in terms of final mean weight, WG, and FCR. GDFB can be utilized up to 120 g
kg-1 to replace SPC and CPC without causing negative effects on growth performance and FCR.
However, dietary SDFB supplementation at 60 and 120 g kg-1 significantly reduced final mean
weight and WG of shrimp, while increased FCR compared to the treatment contained 20 g kg-1
GDFB. No significant impacts were detected in final biomass (80.4 to 92.2 g), survival (84 to 90
%), and PRE (27.5 to 35.9 %).
76
3.3. Whole body composition
Whole body proximate composition of shrimp when animals were offered diets contained
various DFB levels from two sources are presented in Table 7. Shrimp fed with diets
supplemented with 120 g kg-1 GDFB exhibited significantly lower body lipid level than those fed
with diets containing 40 and 120 g kg-1 SDFB. Significant differences were detected in carcass
moisture content among dietary treatments, however, Tukey’s multiple comparison did not
determine significant differences between the treatments, which may due to the variance. No
significant differences were observed in protein (676.2 to 756.4 g kg-1) or ash (83.1 to 119.4 g
kg-1) contents of whole shrimp body.
3.4. ANCOVA output
ANCOVA output of performance and proximate composition of whole shrimp body is
presented in Table 8. The main effect (DFB inclusion levels) and the covariate effect (processing
methods) had significant effects on final mean weight, WG, and FCR. A combined effect of DFB
inclusion levels and processing methods was observed on the lipid content of whole shrimp
body. No differences were detected in survival, PRE, and moisture, protein, and ash content of
whole shrimp body.
4. Discussion
Feed represents over 50% of the cost for aquaculture producers, which is an important
economic part that can be improved upon. Identification of suitable protein sources as FM
substitutes in shrimp feeds may result in reduced feed costs and foster an economically feasible,
expanded, and sustainable shrimp industry. The analyzed proximate composition indicates that
77
DFB has a higher protein content (790 and 805.1 g kg-1) than FM (627.8 g kg-1), SPC (649.3 g
kg-1), and CPC (780.7 g kg-1). When FM is replaced with alternative protein sources, it is critical
to balance the amino acid profile in the diets. Methionine and lysine are two essential amino
acids (AA) that are typically most limiting AA in the plant-derived byproducts. Concentrations
of these and other AA in DFB are similar to FM and much higher than in SPC and CPC (Table
3). As a consequence, AA levels in diets supplemented with DFB were higher than those of the
basal diet (Table 4).
In trial 1, data indicates that DFB can be utilized up to 50 g kg-1 in shrimp diets to
replace FM without compromising the growth. However, a significant reduction in WG and
increase in FCR were observed when shrimp were fed with the diet supplemented with 100 g kg-
1 DFB. A number of studies have evaluated the feasibility of inclusion of bacterial biomass as a
substitute for FM. Only a few of them were conducted on coproducts from AA production such
as fermented bacterial biomass. The same product (DFB) has been demonstrated to be suitable
for complete replacement of FM (120 g kg-1) in Florida pompano Trachinotus carolinus diets
containing 8% poultry byproduct meal (Rhodes et al. 2015) and nursery pig diets (Perez et al.
2011), without resulting in negative effects on growth of experiment animals or FCR. A similar
dried bacterial biomass from L-lysine manufacture using fermenting bacteria, Micrococcus
glutamicus was used up to 100 g kg-1 as a replacement of FM without causing negative effects on
the growth of tilapia, Oreochromis mossambicus; however, significant reduction on growth and
increase in FCR were detected when lysine biomass was supplemented at higher levels (150 and
200 g kg-1) in tilapia diets (Davies & Wareham 1988).
Aside from AA bacterial byproducts, using methane-oxidizing bacteria as protein and AA
sources in aquatic animal nutrition recently received considerable attention due to the abundant
78
supply, cheap transportation, and reasonable cost of natural gas (Øverland et al. 2010). A
bacterial protein meal (BPM) consisting of M. capsulatus, Alcaligenes acidovorans, Bacillus
brevis and B. firnus was produced in a process that converts natural gas into protein (Aas et al.
2007). Aas et al. (2006a) reported that BPM can be utilized up to 360 g kg-1 to replace FM in the
diets for Atlantic salmon, Salmo salar, without compromising growth. Similar results were
demonstrated by Berge et al. (2005) and Storebakken et al. (2004) who documented that BPM
can be supplemented in S. salar diets at 200 and 193 g kg-1, respectively. The inclusions of BPM
up to 270 g kg-1 were also confirmed to be successfully applied in the diets for rainbow trout
Oncorhynchus mykiss as a substitute for FM (Aas et al. 2006b). In contrast, Aas et al. (2007)
indicated that BPM can be used up to 90 g kg-1 in the diets for Atlantic halibut Hippoglossus
hippoglossus but supplementation of BPM at 180 g kg-1 caused growth depression in this
species.
Results from the researches listed above demonstrated that partial replacement of FM by
bacterial biomass proteins are appropriate for several aquatic species. However, the effects of
high inclusion levels of bacterial biomass proteins in diets for aquatic animals are still
contradictory among those studies. Variations among these researches may be attributed to
various strains utilized to produce the bacterial biomass proteins, processing of the meal, and
different species of experimental animals. The failure of complete FM replacement by DFB in
the present study may due to the palatability or nutritional imbalances in the diet devoid of FM.
Soy protein concentrate is produced through a series of different extraction and
precipitation process from high-quality de-hulled soybeans, and its crude protein content can
reach up to 700 g kg-1 (Sookying & Davis 2012). Corn protein concentrate (CPC) is produced
through wet milling and refined to contain up to 800 g kg-1 crude protein (AAFCO 2007). The
79
application of SPC in shrimp feeds were demonstrated to be feasible in multiple studies (Alam et
al. 2005; Bauer et al. 2012; Paripatananont et al. 2001; Sookying & Davis 2012). Inclusion
levels of CPC at 47-60 g kg-1 were widely applied in practical diets for Pacific white shrimp as a
good source for protein and methionine (Fang et al. 2016; Zhou et al. 2015; Qiu & Davis 2016a;
b; c; d). Based on the information provided by trial 1 in the present study, a follow up growth
trial (trial 2) further explored different inclusion levels (0, 20, 40, 60, 120 g kg-1) of DFB
products produced by two different processing methods (SDFB and GDFB) as a substitution for
SPC w/o CPC in a low FM-based diet. Results indicated that GDFB can be utilized up to 120 g
kg-1 to replace SPC and CPC without causing negative effects on growth performance and FCR.
However, significantly reduced final mean weight and WG as well as increased FCR were
detected when dietary SDFB were supplemented at 60 and 120 g kg-1. Analysis of covariance
detected a significant effect of the processing method on the final biomass, final mean weight,
WG of shrimp and FCR. Shrimp fed with GDFB performed significantly better in terms of
growth than those fed with SDFB. The research on bacterial biomass proteins for utilization as
replacements for SPC and CPC in aquatic animal feeds is still limited. Based on information
provided in the FM replacement researches conducted in the current study and by many other
researchers, the successfully replacement of SPC w/o CPC by GDFB could be easily understood
because of the balanced amino acid profile and suitable palatability. However, the significant
reduction on the shrimp performances resulted from 60 and 120 g kg-1 SDFB supplementation
indicated that spray drying method may not be the most appropriate processing option for
proteinaceous bacterial meal.
In the present study, PRE was not significantly affected when either SDFB or GDFB
were utilized up to 120 g kg-1. Similarly, Aas et al. (2006) documented that inclusion of BPM up
80
to 270 g kg-1 did not affect PRE in rainbow trout. Also in agreement, Aas et al. (2007) and Berge
et al. (2005) reported that PRE in Atlantic salmon was not significantly affected when BPM was
supplemented up to 180 and 200 g kg-1 as a replacement of FM. PRE was determined by a
number of factors including dietary protein level, feed intake, final weight and initial weight of
animals as well as the final and initial protein content of animals (Halver & Hardy, 2002). In the
current study, no significant differences were found in dietary protein levels, feed offered to the
shrimp, initial weight of shrimp, and protein content of shrimp carcass. The significantly reduced
final weight of shrimp fed with the diet supplemented with 60 g kg-1 SDFB resulted in
comparatively lower PRE observed in this treatment.
With regards to whole body proximate composition, lipid content in shrimp fed the diet
containing 120 g kg-1 GDFB was significant lower than those fed with diets supplemented with
40 and 120 g kg-1 SDFB. No significant differences were detected in carcass protein or ash
content. Likewise, Aas et al. (2006b) reported that no significant differences were detected in the
contents of crude lipid, crude protein, or ash in carcass of rainbow trout when BPM were utilized
up to 270 g kg-1 in the diet. In addition, other published work also documented that dietary
bacteria protein meal had no significant effect on proximate composition (protein, lipid, or ash)
of Atlantic halibut (Aas et al. 2007) and Atlantic salmon (Aas et al. 2006a; Berge et al. 2005;
Storebakken et al. 2004). In the present experiment, analysis of covariance indicated that the
combined effect of the DFB source and level significantly affected the whole lipid content of
shrimp. Generally, shrimp fed with diets containing SDFB had a relatively higher lipid level than
those fed with GDFB. The carcass lipid content decreased as the inclusion level of GDFB
increased, which may be attributed to relatively lower energy availability in this ingredient.
81
5. Conclusion
Under the reported conditions of the study, the use of DFB can partially replace FM up to
50 g kg-1 without causing negative effects on the growth performance of Pacific white shrimp.
However, completely replacement of FM (100 g kg-1) by DFB resulted in growth depression
which may due to palatability or nutrient imbalances. The use of GDFB as a substitution for SPC
w/o CPC did not significantly affect growth of shrimp. However, the inclusion of SDFB at 60
and 120 g kg-1 decreased growth of shrimp indicating a negative effect of spray drying. The
results in the current study demonstrate that GDFB is a good protein source which can be
incorporated in practical shrimp feed formulations.
82
References
AAFCO, 2007. Report of ingredient definitions committee on corn protein concentrate.
Association of American Feed Control Officials, INC., Rockville, Maryland.
Aas, T.S., Grisdale-Helland, B., Terjesen, B.F. & Helland, S.J. (2006a) Improved growth and
nutrient utilisation in Atlantic salmon (Salmo salar) fed diets containing a bacterial
protein meal. Aquaculture 259, 365-376.
Aas, T.S., Hatlen, B., Grisdale-Helland, B., Terjesen, B.F., Bakke-McKellep, A.M. & Helland,
S.J. (2006b) Effects of diets containing a bacterial protein meal on growth and feed
utilisation in rainbow trout (Oncorhynchus mykiss). Aquaculture 261, 357-368.
Aas, T.S., Hatlen, B., Grisdale‐Helland, B., Terjesen, B.F., Penn, M., Bakke‐McKellep, A.M. &
Helland, S.J. (2007) Feed intake, growth and nutrient utilization in Atlantic halibut
(Hippoglossus hippoglossus) fed diets containing a bacterial protein meal. Aquac. Res. 38,
351-360.
Achupallas, J.M., Zhou, Y., & Davis D.A (2016). Use of grain distillers dried yeast in practical
diets for juvenile Pacific white shrimp, Litopenaeus vannamei. J. World Aquac. Soc. 47,
220-229.
Alam, M.S., Teshima, S.I., Koshio, S., Ishikawa, M., Uyan, O., Hernandez, L.H.H. & Michael,
F.R. (2005) Supplemental effects of coated methionine and/or lysine to soy protein
isolate diet for juvenile kuruma shrimp, Marsupenaeus japonicus. Aquaculture 248, 13-
19.
Bauer, W., Prentice-Hernandez, C., Tesser, M.B., Wasielesky, W., & Poersch, L.H. (2012)
Substitution of fishmeal with microbial floc meal and soy protein concentrate in diets for
the pacific white shrimp Litopenaeus vannamei. Aquaculture 342, 112-116.
83
Berge, G.M., Baeverfjord, G., Skrede, A. & Storebakken, T. (2005) Bacterial protein grown on
natural gas as protein source in diets for Atlantic salmon (Salmo salar) in saltwater.
Aquaculture 244, 233-240.
Davies, S.J. & Wareham, H. (1988) A preliminary evaluation of an industrial single cell protein
in practical diets for tilapia Oreochromis mossambicus Peters. Aquaculture 73, 188-199.
Fang, X., Yu, D., Buentello, A., Zeng, P. & Davis, D.A. (2016) Evaluation of new non-
genetically modified soybean varieties as ingredients in practical diets for Litopenaeus
vannamei. Aquaculture 451, 178-185.
Kuhad, R.C., Singh, A., Tripathi, K.K., Saxena, R.K. & Eriksson, K.E.L. (1997) Microorganisms
as an alternative source of protein. Nutr. Rev. 55, 65-75.
Øverland, M., Tauson, A.H., Shearer, K. & Skrede, A. (2010) Evaluation of methane-utilising
bacteria products as feed ingredients for monogastric animals. Arch. Anim. Nutr. 64, 171-
189.
Paripatananont, T., Boonyaratpalin, M., Pengseng, P. & Chotipuntu, P. (2001) Substitution of
soy protein concentrate for fishmeal in diets of tiger shrimp Penaeus monodon. Aquac.
Res. 32, 369-374.
Pérez, V.G., Yang, H., Radke, T.R., Less, J. & Holzgraefe, D.P. (2011) Fermentation biomass
can replace protein from fish and soybean meals in nursery diets. J. Anim. Sci. 89, E-
Suppl. 1/J: 328.
Qiu, X. & Davis, D.A. (2016a) Effects of dietary phytase supplementation on growth
performance and apparent digestibility coefficients of Pacific white shrimp Litopenaeus
vannamei. Aquac. Nutr. doi: 10.1111/anu.12462.
84
Qiu, X. & Davis, D.A. (2016b) Effects of dietary carbohydrase supplementation on performance
and apparent digestibility coefficients in Pacific white shrimp Litopenaeus vannamei. J.
World Aquac. Soc. doi: 10.1111/jwas.12361.
Qiu, X. & Davis, D.A. (2016c) Evaluation of flash dried yeast as a nutritional supplement in
plant-based practical diets for Pacific white shrimp, Litopenaeus vannamei. Aquac. Nutr.
doi: 10.1111/anu.12499.
Qiu, X., Buentello, A., Shannon, R., Mustafa, A., Abebe, A. & Davis, D.A. (2016d) Evaluation
of three non-genetically modified soybean cultivars as ingredients and a yeast-based
additive as a supplement in practical diets for Pacific white shrimp, Litopenaeus
vannamei. Aquac. Nutr. In press.
Rhodes, M.A., Zhou, Y. & Davis, D.A. (2015) Use of dried fermented biomass as a fish meal
replacement in practical diets of Florida pompano, Trachinotus carolinus. J. Appl. Aquac.
27, 29-39.
Sookying, D. & Davis, D.A. (2012) Use of soy protein concentrate in practical diets for Pacific
white shrimp (Litopenaeus vannamei) reared under field conditions. Aquac. Int. 20, 357-
371.
Solorzano, L. (1969) Determination of ammonia in natural waters by the phenolhypochlorite
method. Limnol. Oceanogr. 14, 799-801.
Spotte, S. (1979) Fish and invertebrate culture: water management in closed systems, 2nd
edition. Wiley, New York.
Stringer, D.A. (1982) Industrial development and evaluation of new protein sources: micro-
organisms. Proc. Nutr. Soc. 41, 289-300.

85
Storebakken, T., Baeverfjord, G., Skrede, A., Olli, J.J. & Berge, G.M. (2004) Bacterial protein
grown on natural gas in diets for Atlantic salmon, Salmo salar, in freshwater.
Aquaculture 241, 413-425.
Zhou, Y.G., Davis, D.A. & Buentello, A. (2015) Use of new soybean varieties in practical diets
for the Pacific white shrimp, Litopenaeus vannamei. Aquac. Nutr. 21, 635-643.
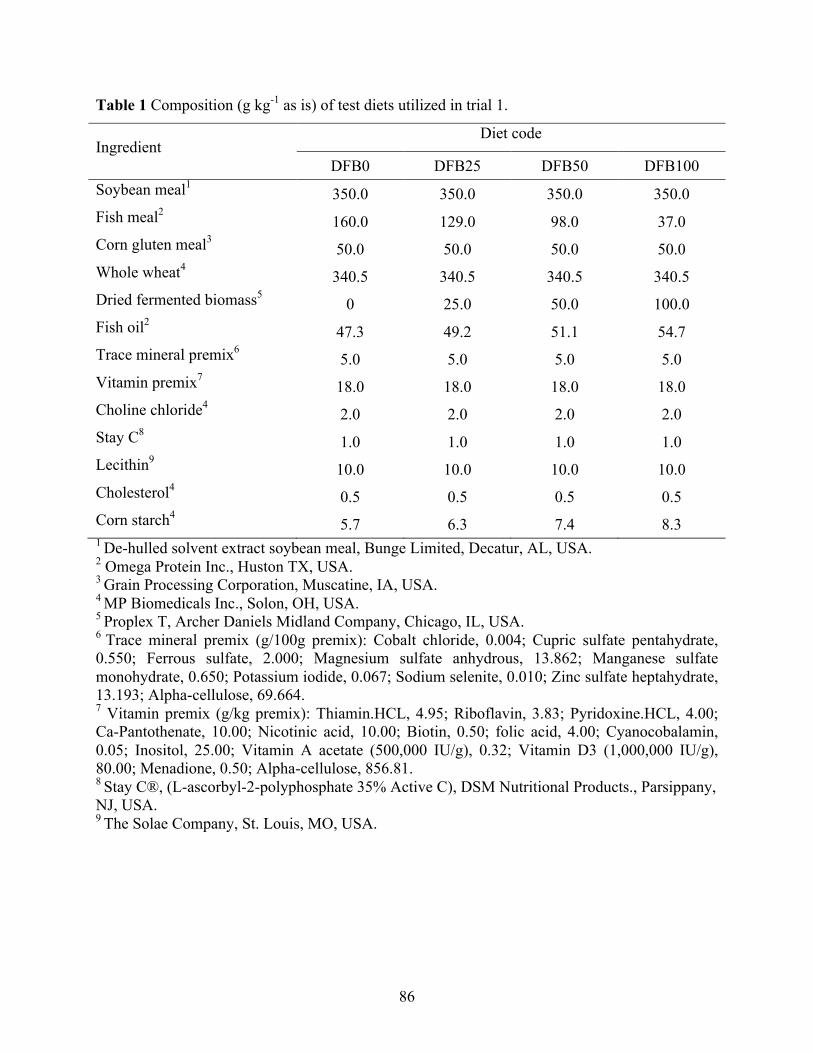
86
Table 1 Composition (g kg-1 as is) of test diets utilized in trial 1.
Ingredient Diet code
DFB0 DFB25 DFB50 DFB100 Soybean meal1 350.0 350.0 350.0 350.0 Fish meal2
160.0 129.0 98.0 37.0 Corn gluten meal3 50.0 50.0 50.0 50.0 Whole wheat4
340.5 340.5 340.5 340.5 Dried fermented biomass5
0 25.0 50.0 100.0 Fish oil2 47.3 49.2 51.1 54.7 Trace mineral premix6 5.0 5.0 5.0 5.0 Vitamin premix7 18.0 18.0 18.0 18.0 Choline chloride4 2.0 2.0 2.0 2.0 Stay C8 1.0 1.0 1.0 1.0 Lecithin9 10.0 10.0 10.0 10.0 Cholesterol4 0.5 0.5 0.5 0.5 Corn starch4 5.7 6.3 7.4 8.3 1 De-hulled solvent extract soybean meal, Bunge Limited, Decatur, AL, USA. 2 Omega Protein Inc., Huston TX, USA. 3 Grain Processing Corporation, Muscatine, IA, USA. 4 MP Biomedicals Inc., Solon, OH, USA. 5 Proplex T, Archer Daniels Midland Company, Chicago, IL, USA. 6 Trace mineral premix (g/100g premix): Cobalt chloride, 0.004; Cupric sulfate pentahydrate, 0.550; Ferrous sulfate, 2.000; Magnesium sulfate anhydrous, 13.862; Manganese sulfate monohydrate, 0.650; Potassium iodide, 0.067; Sodium selenite, 0.010; Zinc sulfate heptahydrate, 13.193; Alpha-cellulose, 69.664. 7 Vitamin premix (g/kg premix): Thiamin.HCL, 4.95; Riboflavin, 3.83; Pyridoxine.HCL, 4.00; Ca-Pantothenate, 10.00; Nicotinic acid, 10.00; Biotin, 0.50; folic acid, 4.00; Cyanocobalamin, 0.05; Inositol, 25.00; Vitamin A acetate (500,000 IU/g), 0.32; Vitamin D3 (1,000,000 IU/g), 80.00; Menadione, 0.50; Alpha-cellulose, 856.81. 8 Stay C®, (L-ascorbyl-2-polyphosphate 35% Active C), DSM Nutritional Products., Parsippany, NJ, USA. 9 The Solae Company, St. Louis, MO, USA.
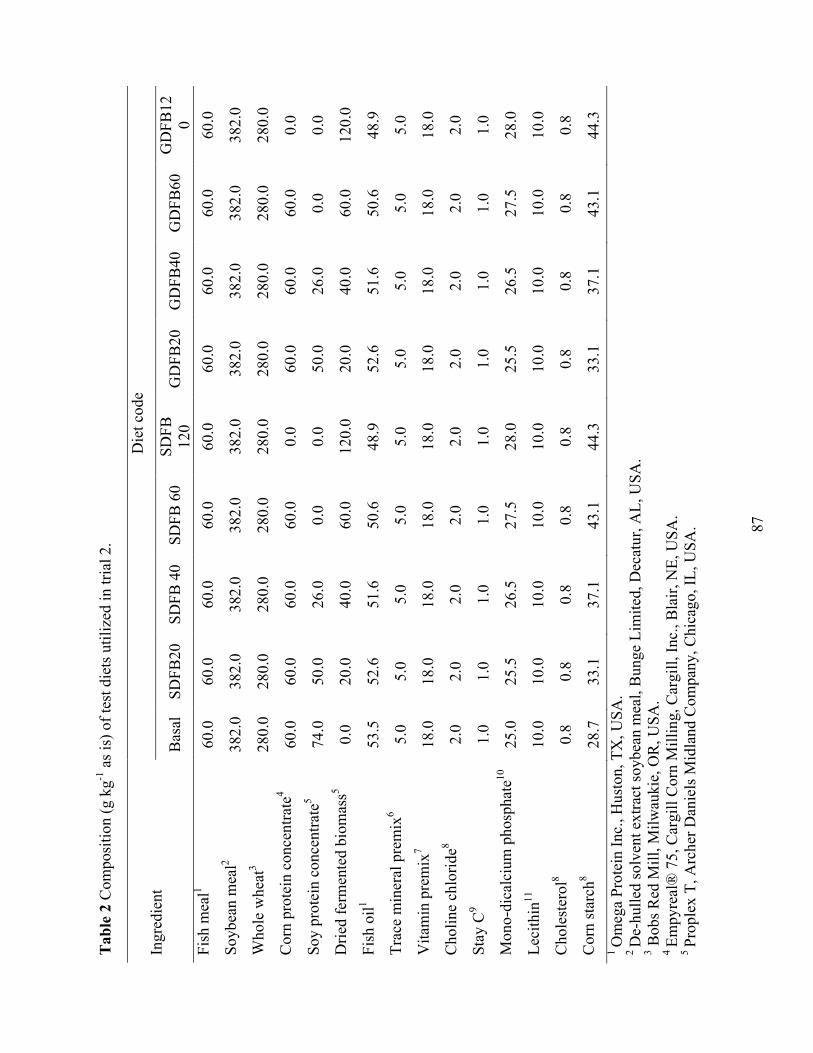
87
Tab
le 2
Com
posi
tion
(g k
g-1 a
s is)
of t
est d
iets
util
ized
in tr
ial 2
.
Ingr
edie
nt
Die
t cod
e
Bas
al
SDFB
20
SDFB
40
SDFB
60
SDFB
12
0 G
DFB
20
GD
FB40
G
DFB
60
GD
FB12
0 Fi
sh m
eal1
60.0
60
.0
60.0
60
.0
60.0
60
.0
60.0
60
.0
60.0
So
ybea
n m
eal2
382.
0 38
2.0
382.
0 38
2.0
382.
0 38
2.0
382.
0 38
2.0
382.
0 W
hole
whe
at3
280.
0 28
0.0
280.
0 28
0.0
280.
0 28
0.0
280.
0 28
0.0
280.
0 C
orn
prot
ein
conc
entra
te4
60.0
60
.0
60.0
60
.0
0.0
60.0
60
.0
60.0
0.
0 So
y pr
otei
n co
ncen
trate
5 74
.0
50.0
26
.0
0.0
0.0
50.0
26
.0
0.0
0.0
Drie
d fe
rmen
ted
biom
ass5
0.0
20.0
40
.0
60.0
12
0.0
20.0
40
.0
60.0
12
0.0
Fish
oil1
53.5
52
.6
51.6
50
.6
48.9
52
.6
51.6
50
.6
48.9
Tr
ace
min
eral
pre
mix
6 5.
0 5.
0 5.
0 5.
0 5.
0 5.
0 5.
0 5.
0 5.
0 V
itam
in p
rem
ix7
18.0
18
.0
18.0
18
.0
18.0
18
.0
18.0
18
.0
18.0
C
holin
e ch
lorid
e8 2.
0 2.
0 2.
0 2.
0 2.
0 2.
0 2.
0 2.
0 2.
0 St
ay C
9 1.
0 1.
0 1.
0 1.
0 1.
0 1.
0 1.
0 1.
0 1.
0 M
ono-
dica
lciu
m p
hosp
hate
10
25.0
25
.5
26.5
27
.5
28.0
25
.5
26.5
27
.5
28.0
Le
cith
in11
10
.0
10.0
10
.0
10.0
10
.0
10.0
10
.0
10.0
10
.0
Cho
lest
erol
8 0.
8 0.
8 0.
8 0.
8 0.
8 0.
8 0.
8 0.
8 0.
8 C
orn
star
ch8
28.7
33
.1
37.1
43
.1
44.3
33
.1
37.1
43
.1
44.3
1 O
meg
a Pr
otei
n In
c., H
usto
n, T
X, U
SA.
2 D
e-hu
lled
solv
ent e
xtra
ct so
ybea
n m
eal,
Bun
ge L
imite
d, D
ecat
ur, A
L, U
SA.
3 Bob
s Red
Mill
, Milw
auki
e, O
R, U
SA.
4 Em
pyre
al®
75,
Car
gill
Cor
n M
illin
g, C
argi
ll, In
c., B
lair,
NE,
USA
. 5 Pr
ople
x T,
Arc
her D
anie
ls M
idla
nd C
ompa
ny, C
hica
go, I
L, U
SA.

88
6 Tr
ace
min
eral
pre
mix
(g/
100g
pre
mix
): C
obal
t ch
lorid
e, 0
.004
; C
upric
sul
fate
pen
tahy
drat
e, 0
.550
; Fe
rrou
s su
lfate
, 2.
000;
M
agne
sium
sulfa
te a
nhyd
rous
, 13.
862;
Man
gane
se su
lfate
mon
ohyd
rate
, 0.6
50; P
otas
sium
iodi
de, 0
.067
; Sod
ium
sele
nite
, 0.0
10; Z
inc
sulfa
te h
epta
hydr
ate,
13.
193;
Alp
ha-c
ellu
lose
, 69.
664.
7 V
itam
in p
rem
ix (g
/kg
prem
ix):
Thia
min
.HC
L, 4
.95;
Rib
ofla
vin,
3.8
3; P
yrid
oxin
e.H
CL,
4.0
0; C
a-Pa
ntot
hena
te, 1
0.00
; Nic
otin
ic a
cid,
10
.00;
Bio
tin, 0
.50;
fol
ic a
cid,
4.0
0; C
yano
coba
lam
in, 0
.05;
Ino
sito
l, 25
.00;
Vita
min
A a
ceta
te (
500,
000
IU/g
), 0.
32;
Vita
min
D3
(1,0
00,0
00 IU
/g),
80.0
0; M
enad
ione
, 0.5
0; A
lpha
-cel
lulo
se, 8
56.8
1.
8 M
P B
iom
edic
als I
nc.,
Solo
n, O
H, U
SA.
9 Sta
y C
®, (
L-as
corb
yl-2
-pol
ypho
spha
te 3
5% A
ctiv
e C
), D
SM N
utrit
iona
l Pro
duct
s., P
arsi
ppan
y, N
J, U
SA.
10 J.
T. B
aker
®, M
allin
ckro
dt B
aker
, Inc
., Ph
illip
sbur
g, N
J, U
SA.
11 Th
e So
lae
Com
pany
, St.
Loui
s, M
O, U
SA.

89
Table 3 Proximate composition, and amino acid profile of dried fermented biomass used in trial 1 (DFB) and 2 (SDFB and GDFB have identical nutrient compositions), fish meal (FM), soy protein concentrate (SPC), and corn protein concentrate (CPC).
Composition1 (g kg-1 as is) DFB S/GDFB FM SPC CPC
Crude protein 805.1 790.0 627.8 649.3 780.7
Moisture 47.8 34.5 79.9 85.5 81.6
Crude fat 10.0 49.0 105.6 0 2.0
Crude fiber - 8.0 0 3.5 0.9
Ash - 27.0 187.5 6.3 1.0
Alanine 60.6 55.3 39.1 26.3 64.2
Arginine 52.3 49.5 36.8 44.4 22.5
Aspartic acid 85.5 78.5 53.4 68.4 42.9
Cysteine 8.2 9.0 4.7 8.0 13.0
Glutamic acid 98.4 92.4 74.7 104.4 146.8
Glycine 39.1 35.9 48.8 25.5 19.5
Histidine 18.8 17.8 16.3 17.7 14.8
Isoleucine 42.4 39.6 24.2 29.5 29.6
Leucine 76.5 70.9 42.1 50.8 129.7
Lysine 53.3 49.8 46.7 38.8 11.4
Methionine 22.2 20.9 16.1 8.3 18.0
Phenylalanine 37.6 33.3 23.9 33.3 48.0
Proline 30.9 30.1 30.8 32.9 73.1
Serine 26.9 24.3 21.1 27.1 38.0
Threonine 41.4 36.7 24.1 23.8 24.8
Tryptophan 10.8 9.9 6.2 8.6 3.7
Tyrosine 30.3 28.4 16.7 25.0 42.4
Valine 53.3 50.8 29.9 29.4 32.3 1 Ingredients were analyzed at University of Missouri Agricultural Experiment Station Chemical Laboratories (Columbia, MO, USA).
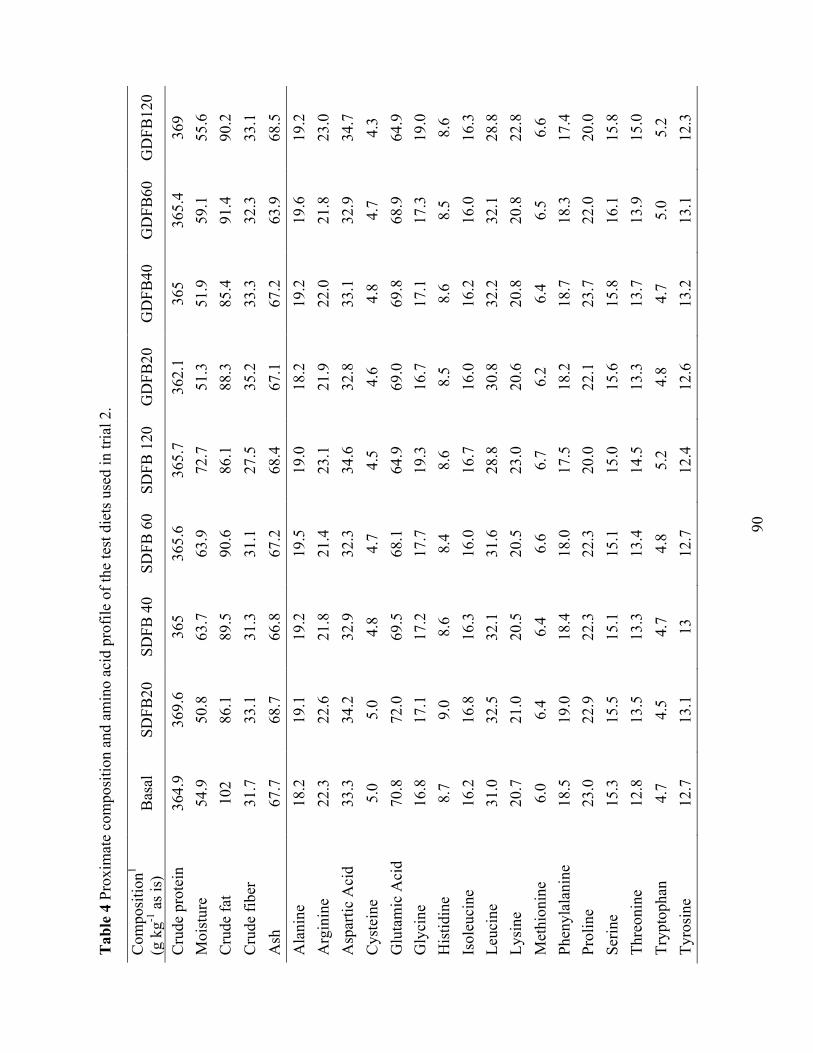
90
Tab
le 4
Pro
xim
ate
com
posi
tion
and
amin
o ac
id p
rofil
e of
the
test
die
ts u
sed
in tr
ial 2
.
Com
posi
tion1
(g k
g-1 a
s is)
B
asal
SD
FB20
SD
FB 4
0 SD
FB 6
0 SD
FB 1
20
GD
FB20
G
DFB
40
GD
FB60
G
DFB
120
Cru
de p
rote
in
364.
9 36
9.6
365
365.
6 36
5.7
362.
1 36
5 36
5.4
369
Moi
stur
e 54
.9
50.8
63
.7
63.9
72
.7
51.3
51
.9
59.1
55
.6
Cru
de fa
t 10
2 86
.1
89.5
90
.6
86.1
88
.3
85.4
91
.4
90.2
C
rude
fibe
r 31
.7
33.1
31
.3
31.1
27
.5
35.2
33
.3
32.3
33
.1
Ash
67
.7
68.7
66
.8
67.2
68
.4
67.1
67
.2
63.9
68
.5
Ala
nine
18
.2
19.1
19
.2
19.5
19
.0
18.2
19
.2
19.6
19
.2
Arg
inin
e 22
.3
22.6
21
.8
21.4
23
.1
21.9
22
.0
21.8
23
.0
Asp
artic
Aci
d 33
.3
34.2
32
.9
32.3
34
.6
32.8
33
.1
32.9
34
.7
Cys
tein
e 5.
0 5.
0 4.
8 4.
7 4.
5 4.
6 4.
8 4.
7 4.
3 G
luta
mic
Aci
d 70
.8
72.0
69
.5
68.1
64
.9
69.0
69
.8
68.9
64
.9
Gly
cine
16
.8
17.1
17
.2
17.7
19
.3
16.7
17
.1
17.3
19
.0
His
tidin
e 8.
7 9.
0 8.
6 8.
4 8.
6 8.
5 8.
6 8.
5 8.
6 Is
oleu
cine
16
.2
16.8
16
.3
16.0
16
.7
16.0
16
.2
16.0
16
.3
Leuc
ine
31.0
32
.5
32.1
31
.6
28.8
30
.8
32.2
32
.1
28.8
Ly
sine
20
.7
21.0
20
.5
20.5
23
.0
20.6
20
.8
20.8
22
.8
Met
hion
ine
6.0
6.4
6.4
6.6
6.7
6.2
6.4
6.5
6.6
Phen
ylal
anin
e 18
.5
19.0
18
.4
18.0
17
.5
18.2
18
.7
18.3
17
.4
Prol
ine
23.0
22
.9
22.3
22
.3
20.0
22
.1
23.7
22
.0
20.0
Se
rine
15.3
15
.5
15.1
15
.1
15.0
15
.6
15.8
16
.1
15.8
Th
reon
ine
12.8
13
.5
13.3
13
.4
14.5
13
.3
13.7
13
.9
15.0
Tr
ypto
phan
4.
7 4.
5 4.
7 4.
8 5.
2 4.
8 4.
7 5.
0 5.
2 Ty
rosi
ne
12.7
13
.1
13
12.7
12
.4
12.6
13
.2
13.1
12
.3
91
Val
ine
18.0
18
.8
18.4
17
.7
18.6
17
.8
18.1
17
.6
19.3
1 D
iets
wer
e an
alyz
ed a
t Uni
vers
ity o
f Mis
sour
i Agr
icul
tura
l Exp
erim
ent S
tatio
n C
hem
ical
Lab
orat
orie
s (C
olum
bia,
MO
, USA
).

92
Table 5 Performance of juvenile shrimp L. vannamei (Initial weight 0.59 g) offered diets with
different dried fermented biomass (DFB) levels (0, 25, 50, and 100 g kg-1) for six weeks in trial
1.
Diet Final biomass (g) Final mean weight (g) WG3 (%) FCR2 Survival (%)
DFB0 62.7 6.3 970.0a 1.52b 100
DFB25 61.8 6.2 944.6ab 1.55ab 100
DFB50 58.5 5.9 884.9ab 1.64ab 100
DFB100 57.0 5.7 845.4b 1.70a 100
PSE1 0.8047 0.0737 14.0715 0.0212
P-value 0.0812 0.0493 0.0337 0.0395 1 PSE: Pooled standard error. 2 FCR: Feed conversion ratio = Feed offered / (Final weight - Initial weight). 3 WG: Weight gain = (Final weight - initial weight) / initial weight × 100%. Values within a column with different superscripts are significantly different based on Tukey’s multiple range test.
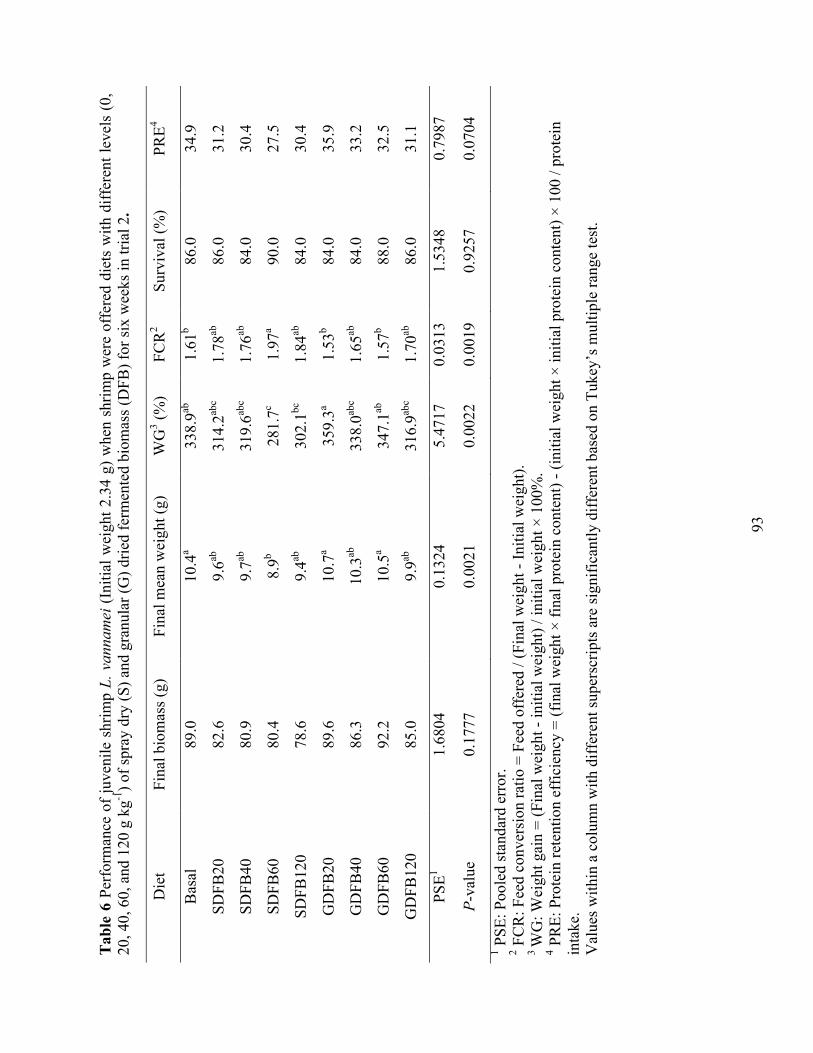
93
Tab
le 6
Per
form
ance
of
juve
nile
shr
imp
L. v
anna
mei
(In
itial
wei
ght 2
.34
g) w
hen
shrim
p w
ere
offe
red
diet
s w
ith d
iffer
ent l
evel
s (0
, 20
, 40,
60,
and
120
g k
g-1) o
f spr
ay d
ry (S
) and
gra
nula
r (G
) drie
d fe
rmen
ted
biom
ass
(DFB
) for
six
wee
ks in
tria
l 2.
Die
t Fi
nal b
iom
ass
(g)
Fina
l mea
n w
eigh
t (g)
W
G3 (%
) FC
R2
Surv
ival
(%)
PRE4
Bas
al
89.0
10
.4a
338.
9ab
1.61
b 86
.0
34.9
SDFB
20
82.6
9.
6ab
314.
2abc
1.78
ab
86.0
31
.2
SDFB
40
80.9
9.
7ab
319.
6abc
1.76
ab
84.0
30
.4
SDFB
60
80.4
8.
9b 28
1.7c
1.97
a 90
.0
27.5
SDFB
120
78.6
9.
4ab
302.
1bc
1.84
ab
84.0
30
.4
GD
FB20
89
.6
10.7
a 35
9.3a
1.53
b 84
.0
35.9
GD
FB40
86
.3
10.3
ab
338.
0abc
1.65
ab
84.0
33
.2
GD
FB60
92
.2
10.5
a 34
7.1ab
1.
57b
88.0
32
.5
GD
FB12
0 85
.0
9.9ab
31
6.9ab
c 1.
70ab
86
.0
31.1
PSE1
1.68
04
0.13
24
5.47
17
0.03
13
1.53
48
0.79
87
P-va
lue
0.17
77
0.00
21
0.00
22
0.00
19
0.92
57
0.07
04
1 PSE
: Poo
led
stan
dard
err
or.
2 FC
R: F
eed
conv
ersi
on ra
tio =
Fee
d of
fere
d / (
Fina
l wei
ght -
Initi
al w
eigh
t).
3 W
G: W
eigh
t gai
n =
(Fin
al w
eigh
t - in
itial
wei
ght)
/ ini
tial w
eigh
t × 1
00%
. 4 P
RE:
Pro
tein
rete
ntio
n ef
ficie
ncy
= (f
inal
wei
ght ×
fina
l pro
tein
con
tent
) - (i
nitia
l wei
ght ×
initi
al p
rote
in c
onte
nt) ×
100
/ pr
otei
n in
take
. V
alue
s w
ithin
a c
olum
n w
ith d
iffer
ent s
uper
scrip
ts a
re s
igni
fican
tly d
iffer
ent b
ased
on
Tuke
y’s
mul
tiple
rang
e te
st.
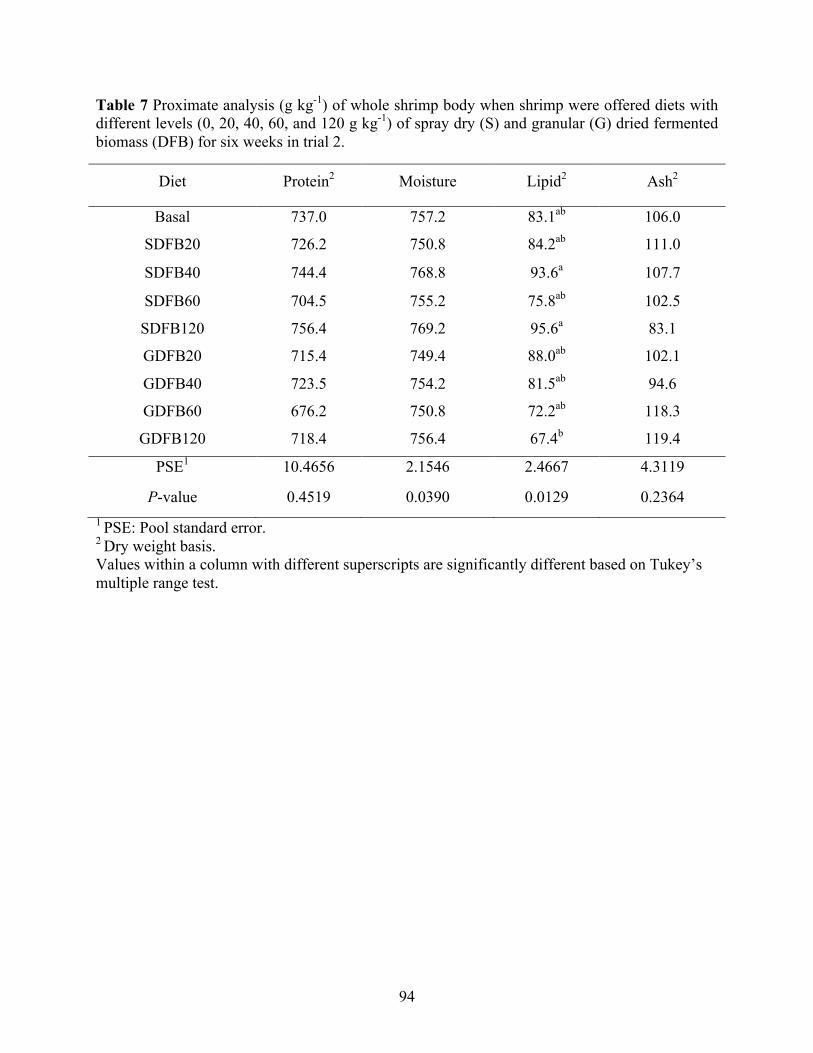
94
Table 7 Proximate analysis (g kg-1) of whole shrimp body when shrimp were offered diets with different levels (0, 20, 40, 60, and 120 g kg-1) of spray dry (S) and granular (G) dried fermented biomass (DFB) for six weeks in trial 2.
Diet Protein2 Moisture Lipid2 Ash2
Basal 737.0 757.2 83.1ab 106.0
SDFB20 726.2 750.8 84.2ab 111.0
SDFB40 744.4 768.8 93.6a 107.7
SDFB60 704.5 755.2 75.8ab 102.5
SDFB120 756.4 769.2 95.6a 83.1
GDFB20 715.4 749.4 88.0ab 102.1
GDFB40 723.5 754.2 81.5ab 94.6
GDFB60 676.2 750.8 72.2ab 118.3
GDFB120 718.4 756.4 67.4b 119.4
PSE1 10.4656 2.1546 2.4667 4.3119
P-value 0.4519 0.0390 0.0129 0.2364 1 PSE: Pool standard error. 2 Dry weight basis. Values within a column with different superscripts are significantly different based on Tukey’s multiple range test.
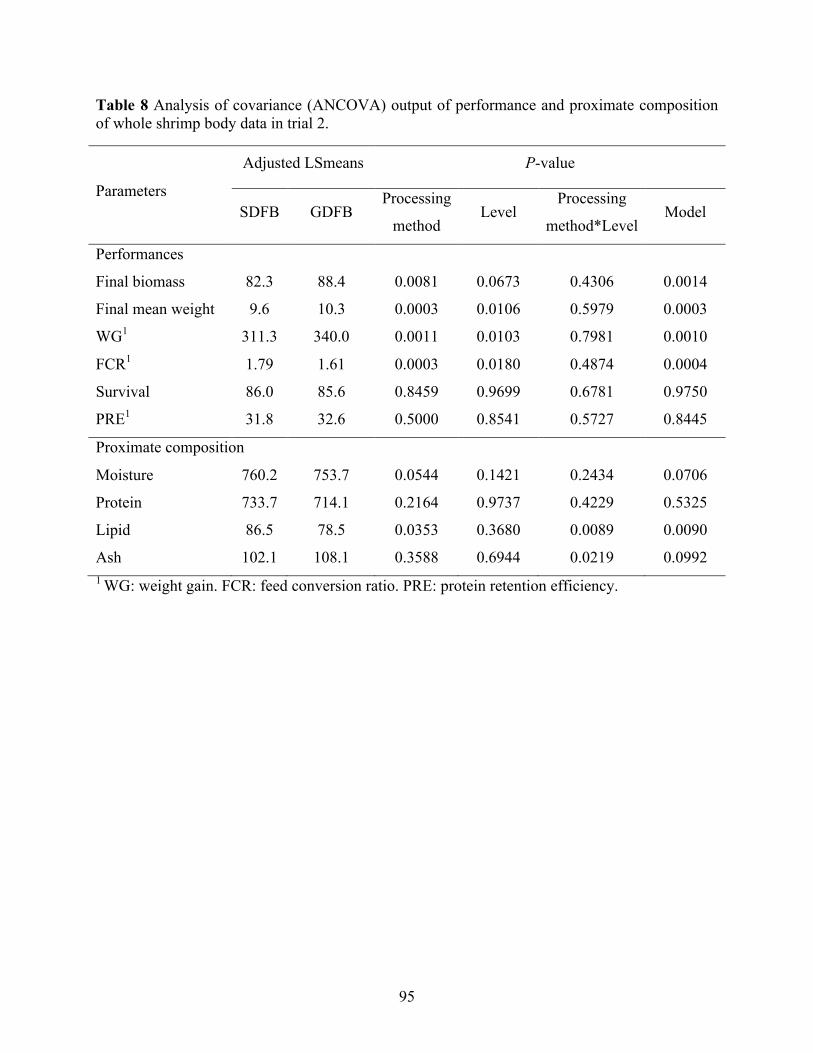
95
Table 8 Analysis of covariance (ANCOVA) output of performance and proximate composition of whole shrimp body data in trial 2.
Parameters
Adjusted LSmeans P-value
SDFB GDFB Processing
method Level
Processing
method*Level Model
Performances
Final biomass 82.3 88.4 0.0081 0.0673 0.4306 0.0014
Final mean weight 9.6 10.3 0.0003 0.0106 0.5979 0.0003
WG1 311.3 340.0 0.0011 0.0103 0.7981 0.0010
FCR1 1.79 1.61 0.0003 0.0180 0.4874 0.0004
Survival 86.0 85.6 0.8459 0.9699 0.6781 0.9750
PRE1 31.8 32.6 0.5000 0.8541 0.5727 0.8445
Proximate composition
Moisture 760.2 753.7 0.0544 0.1421 0.2434 0.0706
Protein 733.7 714.1 0.2164 0.9737 0.4229 0.5325
Lipid 86.5 78.5 0.0353 0.3680 0.0089 0.0090
Ash 102.1 108.1 0.3588 0.6944 0.0219 0.0992 1 WG: weight gain. FCR: feed conversion ratio. PRE: protein retention efficiency.
96
CHAPTER V
EVALUATION OF A NOVEL BACTERIAL BIOMASS AS A SUBSTITUTION FOR
SOYBEAN MEAL IN PLANT-BASED PRACTICAL DIETS FOR PACIFIC WHITE
SHRIMP Litopenaeus vannamei
1. Introduction
Soybean meal (SBM) is usually considered as the most reliable ingredient and cost-
effective protein source in shrimp feed because of its worldwide availability, low price, relatively
balanced amino acid profile, and consistent composition (Amaya et al., 2007; Davis and Arnold,
2000). The dietary SBM inclusions in practical shrimp feeds have been well defined in a number
of studies (Amaya et al., 2007; Roy et al., 2009; Sookying and Davis, 2011). However, as the
popularity of SBM utilized as a primary protein ingredient in animal feed formulation increased,
the price of SBM has risen from $175 per metric ton in the year 2000 to over $500 per metric ton
in 2014 (Index Mundi, 2015). Therefore, it would be necessary for us to explore novel
ingredients that are more economical and sustainable as shrimp culture has become an expanded
and intensified economic activity.
The rapid growth and high protein content of bacteria in protein production has led to
considerable attention on the potential of the application of microbial protein in animal
production. One of the attractive substrates used to produce bacterial protein is methane, which is
the main component of natural gas and distributed widely in nature (Dalton, 2005; Hanson and
Hanson, 1996). The abundant supply, cheap transportation, and reasonable cost of natural gas,
indicated that protein production from natural gas could be realistic on a large scale (Øverland et
al., 2010). Moreover, owing to the low water and no fertile soil requirements, the cultivation of
97
bacterial protein does not compete with agriculture lands and even can be achieved in dry
climates.
A number of researches have been conducted to evaluate a bacterial protein produced
from mainly methane by natural gas fermentation as a protein ingredient for several fish species
including Atlantic salmon Salmo salar (Aas et al., 2006a; Berge et al., 2005; Storebakken et al.,
1998; 1999; 2004), rainbow trout Oncorhynchus mykiss (Aas et al., 2006b; Øverland et al.,
2006), and Atlantic halibut Hippoglossus hippoglossus (Aas et al., 2007). The feeding
experiments in most of these publications recommended that the bacterial protein derived from
natural gas can be utilized as a sustainable protein source in aquaculture production.
The bacterial biomass evaluated in the present study is derived from Methylobacterium
extorquens. The application of this product as a protein source in commercial type of shrimp feed
is still limited. Therefore, the purposes of this project are to determine the growth response of
Pacific white shrimp juveniles to increasing bacterial biomass inclusion levels as a substitution
for soybean meal and determine apparent digestibility values for bacterial biomass as compared
to other traditional protein sources.
2. Material and Methods
2.1. Experimental design and diets
Three trials were conducted to evaluate the biological response of shrimp to BB in soy-
based diets in terms of the growth. In the trial 1 and 2, test diets were formulated to be
isonitrogenous and isolipidic (35% protein and 8% lipid). In trial 1, three experimental diets
(T1D1 - T1D3) were formulated to contain increasing levels (0, 6, and 12%) of BB as a
replacement of SBM (Table 1). In trial 2, to confirm the results in trial 1 and investigate the
98
effects of low inclusion levels of BB, six experimental diets (T2D1 - T2D6) were formulated to
supplement with increasing levels (0, 1, 2, 4, 6, and 12%) of BB as a replacement of SBM (Table
2). In trial 3, five experimental diets (T3D1 - T3D5) were formulated (Table 3). T3D1, T3D2, and
T3D4 are the same as diets in trial 2 that utilized 0, 6, and 12% BB to replace SBM. Whereas
T3D3 and T3D5 utilized BB to replace the same ratio of SBM as T3D2 and T3D4, respectively, on
a digestible protein basis. Additionally, a reference diet (Table 4) was utilized to determine
digestibility coefficients in conjunction with 1% chromic oxide as an inert marker and 70:30
replacement strategy.
Primary ingredients were analyzed at University of Missouri Agricultural Experiment
Station Chemical Laboratories (Columbia, MO, USA) for proximate and amino acid composition
(Table 5). All experimental diets were produced at the Aquatic Animal Nutrition Laboratory at
the School of Fisheries, Aquaculture, and Aquatic Sciences, Auburn University (Auburn, AL,
USA) using the standard procedures for the shrimp feeds described by Qiu and Davis, (2016).
Briefly, diets were prepared by mixing the pre-ground dry ingredients in a food mixer (Hobart,
Troy, OH, USA) for 10–15 minutes. Hot water was then blended into the mixture to obtain a
consistency appropriate for pelleting. Diets were pressure-pelleted using a meat grinder with a
2.5-mm die. The wet pellets were then placed into a fan-ventilated oven (< 50 °C) overnight in
order to attain a moisture content of less than 10%. Dry pellets were crumbled, packed in sealed
bags, and stored in a freezer until use. The diets were analyzed at University of Missouri
Agricultural Experiment Station Chemical Laboratories (Columbia, MO, USA) for proximate
and amino acid composition in trial 1 and 2 (Table 6 and Table 7) and at Midwest Laboratories
(Omaha, NE, USA) for proximate and mineral composition in trial 3(Table 8).
99
2.2. Growth trials
Three trials were conducted at the E.W. Shell Fisheries Research Station, Auburn
University (Auburn, AL, USA). Pacific white shrimp post larvae (PL) were obtained from
Shrimp Improvement Systems (Islamorada, Florida) and nursed in an indoor recirculating
system. PLs were fed a commercial feed (Zeigler Bros., Inc., Gardners, Pennsylvania, USA)
using an automatic feeder for ~1 week, and then switched to crumbled commercial shrimp feed
(Zeigler Bros., Inc., Gardners, Pennsylvania, USA) for ~1- 2 weeks.
In trial 1, the recirculating system consisted of 12 aquaria (160 L) connected to a
common reservoir, biological filter, bead filter, fluidized biological filter and recirculation pump.
Four replicate groups of shrimp (1.51 g initial mean weight; 8 shrimp / tank) were offered diets
using our standard feeding protocol over 6 weeks. Based on historic results, feed inputs were
pre-programmed assuming the shrimp would double their weight weekly up to one gram then
gain 0.8-1.3 g weekly with a feed conversion ratio (FCR) of 1.8. Daily allowances of feed were
adjusted based on observed feed consumption, weekly counts of the shrimp and mortality.
Consequently, for each tank in trial 1, a fixed ration of 1.65 g day-1 for the first and second week,
1.85 g day-1 for the third week, 2.26 g day-1 for the fourth week, 2.47 g day-1 for the fifth week,
and 2.67 g day-1 for the remaining culturing period was offered, partitioned in 4 feedings each
day.
In trial 2 and trial 3, the recirculating system consisted of 24 aquaria (135 L) connected to
a common reservoir, biological filter, bead filter, fluidized biological filter and recirculation
pump. Four replicate groups of shrimp (In trial 2: 0.98 g initial mean weight, 10 shrimp / tank; In
trial 3: 0.15 g initial mean weight, 10 shrimp / tank) were offered diets using our standard
feeding protocol over 6 weeks. Based on historic results, feed inputs were pre-programmed
100
assuming the shrimp would double their weight weekly up to one gram then gain 0.8-1.3 g
weekly with a feed conversion ratio (FCR) of 1.8. Daily allowances of feed were adjusted based
on observed feed consumption, weekly counts of the shrimp and mortality. Consequently, for
each tank in trial 2, a fixed ration of 2.06 g day-1 for the first week, 2.31 g day-1 for the second
week, 2.57 g day-1 for the third week, 2.83 g day-1 for the fourth week, 3.09 g day-1 for the fifth
week, and 3.34 g day-1 for the last week was allotted in 4 portions per day. For each tank in trial
3, a fixed ration of 0.39 g day-1 for the first week, 0.83 g day-1 for the second week, 1.66 g day-1
for the third week, 2.24 g day-1 for the fourth week, 2.53 g day-1 for the fifth week, and 3.05 g
day-1 for the last week was also allotted in 4 portions per day.
At the conclusion of each growth trial, shrimp were counted and group-weighted. Mean
final weight, FCR, WG, biomass, and survival were determined (Table 9, Table 10, and Table
11). After obtaining the final total weight of shrimps in each aquarium, 4 shrimps from trial 2
and trial 3 were randomly selected and frozen at -20 °C for subsequent determination of whole
body composition. Proximate composition and amino acid profile (Table 12 and Table 14) of
whole shrimp was analyzed by University of Missouri-Columbia, Agriculture Experiment
Station Chemical Laboratory (Columbia, MO, USA). Protein and amino acids retention
efficiencies were calculated as follows:
Protein retention (%) = (final weight × final protein content) - (initial weight × initial protein
content) × 100 / protein offered.
Amino acids (AA) retention (%) = (final weight × final AA content) - (initial weight × initial AA
content) × 100 / AA offered.
101
2.3. Water quality monitoring
For all trials, dissolved oxygen (DO), water temperature and salinity were measured
twice daily by using a YSI 650 multi-parameter instrument (YSI, Yellow Springs, OH, USA).
Hydrogen potential (pH) was measured twice weekly by using a waterproof pHTestr30 (Oakton
instrument, Vernon Hills, IL, USA). Total ammonia-nitrogen (TAN) and nitrite were evaluated
every week by using the methods described by Sororzano (1969) and Spotte (1979).
2.4. Digestibility trial
The digestibility trial was conducted in the mentioned recirculation system and utilized
six shrimp per aquaria with six aquaria per dietary treatment. Once acclimated for three days to
the test diets, feces from two aquaria were pooled (n=3) and collected over a five-day period or
until adequate samples were obtained. To obtain fecal samples, the aquaria were cleaned by
siphoning before each feeding with the first collection of the day discarded. After cleaning, the
shrimp were offered an excess of feed and then about 1 hour later feed was removed and feces
were collected by siphoning onto a 500 µm mesh screen. Collected feces were rinsed with
distilled water, dried at 105 °C until a constant weight was obtained, and then stored in freezer
(−20 °C) until analyzed. Apparent digestibility coefficient for dry matter, protein, energy, and
amino acids were determined by using chromic oxide (Cr2O3, 1%) as an inert marker. Chromium
concentrations were determined by the method of McGinnis and Kasting (1964) in which, after a
colorimetric reaction, absorbance is read on a spectrophotometer (Spectronic genesis 5, Milton
Roy Co., Rochester, NY, USA) at 540nm. Gross energy of diets and fecal samples were analyzed
with a Semi micro-bomb calorimeter (Model 1425, Parr Instrument Co., Moline, IL, USA).
Protein were determined by micro-Kjeldahl analysis (Ma and Zuazaga, 1942). Amino acids were

102
analyzed by University of Missouri-Columbia, Agriculture Experiment Station Chemical
Laboratory (Columbia, MO, USA). The apparent digestibility coefficient of dry matter (ADMD),
protein (APD), energy (AED), and amino acids (AAAD) were calculated according to Cho et al.
(1982) as follows:
ADMD (%) = 100 − [100 × (% Cr2O3 in feed / % Cr2O3 in feces)]
APD, AED, and AAAD (%) = 100 − [100 × (% Cr2O3 in feed / % Cr2O3 in feces) × (% nutrient
in feces / % nutrient in feed)
The apparent digestibility coefficients (ADC) of the test ingredients for dry matter,
energy, protein and amino acids were calculated according to Bureau and Hua (2006) as follows:
ADCtest ingredient = ADCtest diet + [(ADCtest diet – ADCref. diet) × (0.7 × Dref / 0.3 × Dingr)]
where Dref = % nutrient (or KJ/g gross energy) of reference diet mash (dry weight); Dingr = %
nutrient (or KJ/g gross energy) of test ingredient (dry weight).
2.5. Statistical analysis
All the data were analyzed using SAS (V9.3. SAS Institute, Cary, NC, USA). Data from
three growth trials were analyzed using one-way ANOVA to determine significant differences
(P<0.05) among treatments followed by the Tukey’s multiple comparison test to determine
difference between treatments in each trial. The pooled standard errors were used across growth
trials, as the variance of each treatment is the same. Arcsine square root transformation was used
prior to analysis for the proportion data. False discover rate (FDR) controlling procedures were
used to adjust the P-value to control the FDR for data from nutrient contents of whole body and
amino acid retention. Data from digestibility trial were analyzed using non-parametric (kruskal-
103
wallis) one-way ANOVA to determine significant differences (P<0.05) among treatments
followed by the Tukey’s multiple comparison test to determine differences between treatments.
3. Results
3.1. Water quality
In trial 1, DO, temperature, salinity, pH, TAN, and nitrite were maintained at 6.15 ± 0.49
mg L-1, 28.1 ± 1.6 °C, 9.6 ± 0.7 ppt, 7.4 ± 0.3, 0.17 ± 0.05mg L-1, and 0.16 ± 0.07 mg L-1,
respectively. In trial 2, DO, temperature, salinity, pH, TAN, and nitrite were maintained at 6.20 ±
0.73 mg L-1, 29.5 ± 0.9 °C, 8.4 ± 1.0 ppt, 7.5 ± 0.3, 0.09 ± 0.10 mg L-1, and 0.05 ± 0.04 mg L-1,
respectively. In trial 3, temperature, salinity, pH, TAN, and nitrite were maintained at 6.96 ±
0.31 mg L-1, 28.1 ± 0.3 °C, 8.2 ± 0.6 ppt, 7.0 ± 0.3, 0.05 ± 0.04 mg L-1, and 0.12 ± 0.12 mg L-1,
respectively. Water quality conditions in all three trials were suitable for normal growth and
survival of this species.
3.2. Growth trials
Performances of Pacific white shrimp offered diets with various BB levels in trial 1, 2
and 3 are presented in Table 9, 10, and 11, respectively. In trial 1, shrimp fed with diets
incorporated with BB exhibited significantly improved survival. However, final mean weight
and WG were significantly reduced when shrimp fed with diets contained 12% BB. Whereas
FCR was significantly increased when shrimp fed with diets supplemented with both 6 and 12%
BB. No significant difference was observed in final biomass (45.70 to 53.85 g) across the
treatments
104
In trial 2, final biomass was significantly reduced when 12% BB was included in the
practical shrimp diet. Significant improvements in final mean weight and WG whereas
dramatically reduced FCR were determined when shrimp fed with the diet concluded 1% BB
compared to those fed with diet supplemented with 6 and 12% BB. No significant difference was
found in survival (92.5 to 100%) across all the treatments.
In trial 3, final biomass was significantly reduced when 26.6% BB was added in the diet
compared to the diet without BB supplementation. Shrimp fed with diets contained 12% and
26.6% BB exhibited significantly lower WG than those fed with diet did not contain BB.
Significant increment in FCR was determined in the diet incorporated with 12 and 26.6% BB
compared to the treatment supplemented with 0 and 13.3% BB. No significant difference was
detected in survival (90 to 100%) across all the treatments.
3.3. Whole body composition
Proximate composition and amino acids profile of whole shrimp body in trial 2 and trial 3
are presented in Table 12 and Table 14. Dietary BB inclusion at 12% significantly improved
protein content while decreased lipid content of whole shrimp body. Moisture content of shrimp
in the treatment fed with 12% BB was significantly lower than the treatment contained 4% BB.
Arginine and glycine contents were significantly improved when BB was supplemented at 12%
than other treatments. Significant improvement was detected, whereas reduction was also
observed in the diet contained 12% BB compared to the treatment supplemented with 0, 1, and
2% BB. Threonine content of shrimp body fed with diet contained 1% BB was significantly
higher than other treatments. No significant differences were detected in alanine, aspartic acid,
cysteine, glutamic acid, histidine, hydroxylysine, hydroxyproline, isoleucine, leucine, lysine,
105
phenylalanine, serine, tryptophan, tyrosine, and valine concentrations of whole shrimp body
across all the treatments.
In trial 3, protein and ash content of shrimp fed with diet contained 26.6% BB was
significantly improved compared to those fed with diet supplemented with 0 and 6% BB. Lipid
content of shrimp fed with diet included with 13.3 and 26.6% BB was dramatically reduced in
contrast with those offered with diet contained 0 and 6% BB. No significant effects were
detected in moisture (76.1 to 77.4%) and fiber (5.25 to 5.68%) contents.
3.4. Protein and amino acid retentions
Protein and amino acids retention efficiencies of Pacific white shrimp in trial 2 and trial 3
are shown in Table 13 and Table 14. In trial 2, PRE was significantly reduced when shrimp fed
with diets contained 12% BB compared to other treatments. There were reasonable
correspondences of total AAs and individual AAs retention efficiencies to PRE. In general, total
AA and most of individual AAs retention efficiencies except hydroxylysine, hydroxyproline, and
tyrosine retention efficiency were significantly depressed when shrimp fed with diet contained
12% BB compared to other treatments. Hydroxyproline retention efficiency was significantly
higher in the diet incorporated with 4% BB than other treatments. Tyrosine retention efficiency
was significantly reduced in the treatment supplemented with 12% BB compared to the
treatments contained 0, 1, 2, and 4% BB. No significant difference was detected in the multiple
comparison of hydroxylysine, which may due to the variance. In trial 3, PRE was significantly
depressed when 26.6% BB was incorporated in the diet.
106
3.5. Digestibility trial
ADMD, APD, and AED for the diet (D) and ingredient (I) using 70:30 replacement
technique offered to Pacific white shrimp are presented in Table 15. The digestibility trial
contained a range of ingredients; hence, we have provided a few other ingredients as a reference.
To confirm the digestibility results, faecal samples for basal diet, FM diet, and BB diet were
recollected. Basal1 and Basal2, FM1 and FM2, and BB1 and BB2 represent first collection and
second collection of basal diet, FM diet, and BB diet, respectively. ADMD, AED, and APD of
BB were significantly lower than those of FM and SBM.
AAAD values for the SBM, FM and BB using 70:30 replacement technique offered to
Pacific white shrimp are presented in Table 16. Apparent digestibility coefficients of alanine,
arginine, aspartic acid, cysteine, glutamic acid, glycine, histidine, isoleucine, leucine, lysing,
methionine, phenylalanine, proline, serine, threonine, tryptophan, tyrosine, valine, and total
amino acids of BB were significantly lower than those of FM and SBM. Total AA and individual
AA digestibility coefficients were reasonably corresponded to APD.
4. Discussion
The nutrient digestibility of a feed ingredient is an important factor to evaluate the overall
nutritive value of the ingredient because it is related to the quantity of the nutrient absorbed by
the animals. SBM had the highest APD (97.03%), AED (82.56%), and AAAD (90.78 – 96.91%)
among the ingredients tested in the current study. Similar ranges of results for APD, AED, and
AAAD were reported in multiple shrimp studies (Cruz-Suárez et al., 2009; Fang et al., 2016; Liu
et al., 2013; Yang et al., 2009; Zhou et al., 2015). APD and AED of FM1 were 67.07% and
69.77%, respectively. Similar results were acquired in FM2 (APD and AED: 71.3% and 65.78%,
107
respectively). The analogous results of basal diet and FM diet from the collections under two
occasions pointed to the consistency in the feces collection and sample analysis methods. APD
of FM has been reported to be ranged from 62.7% to 91.6% in numerous studies (Lemos et al.,
2009; Liu et al., 2013; Terrazas-Fierro et al., 2010; Yang et al., 2009). ADP of FM in our study
were in the lower range of the results documented among those researches. The differences in
digestibility of FM among various studies could be attributed to several factors, such as different
raw materials, location or processing methods used to produce the products, and unknown
factors related to different production batches.
Physiologically, ADCs should not below 0% or above 100%. However, ADMD of BB1
was negative, and the same phenomenon was confirmed in the recollected faecal sample (BB2).
The negative ADMD resulted in very low values of APD, AED, and AAAD of BB for Pacific
white shrimp. Similarly, Akiyama et al. (1989) also documented negative ADMD values of some
dietary fillers (diatomaceous sand, chitin, and cellulose) for Pacific white shrimp. Unexpected
negative ADMD value may be attributed to an unidentified interaction among the ingredients of
the feed or endogenous losses by the animal from processes such an enzymatic secretion,
sloughing of gut epithelial cells, formation of the chitinous peritrophic membrane, and the
secretion of other lubricative substances (Akiyama et al., 1989). Another explanation of the
negative ADMD value may be due to the leaching of chromic oxide of the feed before
consumption or from the fecal samples. However, in the present study leaching of chromic oxide
would be negligible for short exposure time to the seawater. Hence, the negative ADMD may
indicate that BB cannot be digested by Pacific white shrimp. Ingredient digestibility data of BB
for shrimp is still limited. Two digestibility studies of BB for rainbow trout and Atlantic salmon
were available (Øverland et al., 2006; Storebakken et al., 1998). However, neither of these
108
researches documented negative values, all the digestibility values they reported were in the
normal ranges. Differences among these studies may be attributed to different aquatic animals
and bacterial proteins.
Using methane-oxidising bacteria as protein and amino acid sources in aquatic animal
nutrition recently received considerable attention due to the abundant supply, cheap
transportation, and reasonable cost of natural gas (Øverland et al., 2010). In the current study,
significantly reduced growth performance was detected when the diet was supplemented with 12%
BB in trial 1. FCR was significantly increased when the diets were incorporated with both 6 and
12% BB. To demonstrate the results from trial 1 and explore the effects of BB supplementation
at low levels, the basal diet was incorporated with 0, 1, 2, 4, 6, and 12% BB in trial 2. Our
findings indicated that no significant differences were observed in terms of growth performance
and FCR when the diets supplemented with BB up to 6%. However, dietary BB incorporation at
12% dramatically reduced the WG and increased FCR, which were in accordance with the
results documented in trial 1. Similarly, Aas et al. (2007) indicated that bacterial protein meal
(BPM) can be used up to 9% in the diets for Atlantic halibut but supplementation of BPM at 18%
caused depression in growth. By contrast, Aas et al. (2006a) reported that BPM can be utilized
up to 36% in the diets for Atlantic salmon without compromising the growth. Similar results
were demonstrated by Berge et al. (2005) and Storebakken et al. (2004) who documented that
BPM can be supplemented in Atlantic salmon diets at 20% and 19.3%, respectively. The
inclusions of BPM up to 27% were also confirmed to be successfully applied in the diets for
rainbow trout (Aas et al., 2006b). Factors caused the inconsistent results with supplemental BB
may be different strains utilized to produce BB and various aquatic animal species investigated
among the experiments.
109
To elucidate if the digestible protein is the cause of the depressed growth and increased
FCR, another growth trial (trial 3) was initiated to essentially use the same diets that contained 0,
6 and 12% BB in trial 2. Additionally, two more diets were formulated to replace the same ratio
of SBM as diets contained 6 and 12% BB, respectively, but on a digestible protein basis. Dietary
12% BB supplementation significantly reduced WG but increased FCR in trial 3, which has been
proven in both trial 1 and trial 2. The diets balanced on digestible protein basis performed
essentially the same as those did not balanced for digestible protein in terms of WG and FCR,
which may reveal that BB evaluated in the current study is not digestible by shrimp or the
digestibility of this product is still in question.
With regards to the proximate composition of whole shrimp body, lipid level was
dramatically reduced, while protein content was significantly enhanced when shrimp fed with
diet contained 12% BB in trial 2. Similar trends of protein and lipid content of whole body were
determined in trial 3. In trial 3, shrimp fed with diets contained 13.3 and 26.6% BB exhibited
significantly improved protein and depressed lipid contents. By contrast, no significant effects of
dietary BB supplementation on the protein and lipid content of fish body were detected in many
other studies (Aas et al. 2006a; b; 2007; Berge et al., 2005, Storebakken et al., 2004). The
significantly reduced lipid content of shrimp body in trial 2 and trial 3 may be caused by low
digestible energy in the diet contained 12% BB as this ingredient had significantly lower energy
digestibility than SBM. The improvements in protein content of whole body in trial 2 and trial 3
might be indirectly response to the decreased lipid content.
In the present study, PRE was significantly reduced when the diet was supplemented with
12% BB, and there was a reasonable correspondence to the total AA and individual AA amino
acids retention efficiency in trial 2. In general, total AA and most of individual AAs except
110
hydroxylysine, hydroxyproline, and tyrosine retention efficiencies were significantly depressed
when shrimp fed with diet contained 12% BB. Similarly, Aas et al. (2006b) reported that
significantly reductions were determined in PRE and most individual AA retention efficiency
when rainbow trout was fed with diet supplemented with 18% or 27% BB. In addition, Aas et al.
(2007) documented that PRE and indispensable AA retention efficiency were significantly
decreased when BB was supplemented at 18% in Atlantic halibut diet. PRE was determined by a
number of factors including dietary protein levels, feed intake, final weight and initial weight of
animals as well as the final and initial protein content of animals (Halver and Hardy, 2002). In
trial 2, no significant differences were detected in dietary protein levels, feed offered to the
shrimp, and initial weight of shrimp. Although protein content of whole shrimp body was
significantly improved in the diet contained 12% BB, its effect cannot counteract with the
significantly reduced final mean weight of shrimp in the same treatment, which is the primary
cause of reduced PRE. In trial 3, a similar decreasing trend was observed when BB was included
at 12% and 26.6%.
Survival of shrimp was significantly enhanced in trial 1 when diets were incorporated
with both 6 and 12% BB. However, no significant differences were observed in survival across
all the treatments in trial 2 and 3. Similarly, no mortality problems were reported in multiple
researches investigated BB as protein sources in different kinds of fish (Aas et al., 2006a; b;
2007; Berge et al., 2005; Storebakken et al., 2004). Survival is not repeatable as it is impossible
to conduct experiments under the same conditions in all three trials. The significantly improved
survival by BB supplementation in trial 1 indicated that BB might induce immune responses in
shrimp. Hence, further study considering the immune effects of BB supplementation at low
levels is warranted.

111
5. Conclusion
Under the conditions of the present study BB can be utilized up to 4% in shrimp feed
without causing growth depression. However, supplementations (≥ 6%) of BB can result in
negative effects on growth response, FCR, and protein as well as amino acids retention
efficiency. Given the negative result of dry matter digestibility of BB and no improvements in
the treatments balanced on digestible protein basis by using BB, we may infer that the negative
effects caused by high incorporation levels of BB may due to low nutrient digestibility of this
ingredient for shrimp. Based on dramatically enhanced survival in the treatment with BB
supplementation in trial 1, further research regarding the immune effects low inclusion levels of
BB in practical shrimp feed is warranted.
112
References
Aas, T.S., Grisdale-Helland, B., Terjesen, B.F. & Helland, S.J. (2006a) Improved growth and
nutrient utilisation in Atlantic salmon (Salmo salar) fed diets containing a bacterial
protein meal. Aquaculture 259, 365-376.
Aas, T.S., Hatlen, B., Grisdale-Helland, B., Terjesen, B.F., Bakke-McKellep, A.M. & Helland,
S.J. (2006b) Effects of diets containing a bacterial protein meal on growth and feed
utilisation in rainbow trout (Oncorhynchus mykiss). Aquaculture 261, 357-368.
Aas, T.S., Hatlen, B., Grisdale‐Helland, B., Terjesen, B.F., Penn, M., Bakke‐McKellep, A.M. &
Helland, S.J. (2007) Feed intake, growth and nutrient utilization in Atlantic halibut
(Hippoglossus hippoglossus) fed diets containing a bacterial protein meal. Aquac. Res. 38,
351-360.
Akiyama, D.M., Coelho, S.R., Lawrence, A.L. & Robinson, E.H. (1989) Apparent digestibility
of feedstuffs by the marine shrimp (Penaeus vannamei) Boone. Nippon Suisan Gakkaishi
55, 91-98.
Amaya, E., Davis, D.A. & Rouse, D.B. (2007) Alternative diets for the Pacific white shrimp
(Litopenaeus vannamei). Aquaculture 262, 419-425.
Berge, G.M., Baeverfjord, G., Skrede, A. & Storebakken, T. (2005) Bacterial protein grown on
natural gas as protein source in diets for Atlantic salmon (Salmo salar) in saltwater.
Aquaculture 244, 233-240.
Bureau, D.P. & Hua, K. (2006) Letter to the editor of Aquaculture. Aquaculture 252, 103-105.
Cho, C.Y., Slinger, S.J. & Bayley, H.S. (1982) Bioenergetics of salmonid fishes: energy intake,
expenditure and productivity. Comp. Biochem. Phys. B 73, 25-41.
113
Cruz-Suárez, L.E., Tapia-Salazar, M., Villarreal-Cavazos, D., Beltran-Rocha, J., Nieto-López,
M.G., Lemme, A. & Ricque-Marie, D. (2009) Apparent dry matter, energy, protein and
amino acid digestibility of four soybean ingredients in white shrimp (Litopenaeus
vannamei) juveniles. Aquaculture 292, 87-94.
Dalton, H. (2005) The Leeuwenhoek Lecture 2000 the natural and unnatural history of methane-
oxidizing bacteria. Philos. Trans. R. Soc. Lond. B Biol. Sci. 360, 1207-1222.
Davis, D.A. & Arnold, C.R. (2000) Replacement of fish meal in practical diets for the Pacific
white shrimp (Litopenaeus vannamei). Aquaculture 185, 291-298.
Fang, X., Yu, D., Buentello, A., Zeng, P. & Davis, D.A. (2016) Evaluation of new non-
genetically modified soybean varieties as ingredients in practical diets for (Litopenaeus
vannamei). Aquaculture 451, 178-185.
Halver, J.E. & Hardy, R.W. (2002) Fish nutrition. Academic press, San Diego, CA, USA.
Hanson, R.S. & Hanson, T.E. (1996) Methanotrophic bacteria. Microbiol. Rev. 60, 439-471.
Index Mundi, 2015. Index Mundi Commodity Prices. Retrieved online March 12th, 2015.
(http://www.indexmundi.com/commodities/?commodity).
Lemos, D., Lawrence, A.L. & Siccardi, A.J. (2009) Prediction of apparent protein digestibility of
ingredients and diets by in vitro pH-stat degree of protein hydrolysis with species-specific
enzymes for juvenile Pacific white shrimp (Litopenaeus vannamei). Aquaculture 295, 89-
98.
Liu, X.H., Ye, J.D., Kong, J.H., Wang, K. & Wang, A.L. (2013) Apparent digestibility of 12
protein-origin ingredients for Pacific white shrimp (Litopenaeus vannamei). N. Am. J.
Aquac. 75, 90-98.
114
Ma, T., Zuazaga, G. (1942) Micro-Kjeldahl determination of nitrogen. A new indicator and an
improved rapid method. Inc. Eng. Chem. 14, 280-282.
McGinnis, A.J. & Kasting, R. (1964) Chromic oxide indicator method for measuring food
utilization in a plant-feeding insect. Science 144, 1464-1465.
Øverland, M., Romarheim, O.H., Hovin, M., Storebakken, T. & Skrede, A. (2006) Apparent total
tract digestibility of unprocessed and extruded diets containing basic and autolyzed
bacterial protein meal grown on natural gas in mink and rainbow trout. Anim. Feed Sci.
Technol. 129, 237-251.
Øverland, M., Tauson, A.H., Shearer, K. & Skrede, A. (2010) Evaluation of methane-utilising
bacteria products as feed ingredients for monogastric animals. Arch. Anim. Nutr. 64, 171-
189.
Roy, L.A., Bordinhon, A., Sookying, D., Davis, D.A., Brown, T.W. & Whitis, G.N. (2009)
Demonstration of alternative feeds for the Pacific white shrimp (Litopenaeus vannamei),
reared in low salinity waters of west Alabama. Aquac. Res. 40, 496-503.
Sookying, D. & Davis, D.A. (2011) Pond production of Pacific white shrimp (Litopenaeus
vannamei) fed high levels of soybean meal in various combinations. Aquaculture 319,
141-149.
Sororzano, L. (1969) Determination of ammonia in natural waters by the phenolhypochlorite
method. Limnol. Oceanogr. 14, 799-801.
Spotte, S., 1979. Fish and invertebrate culture: water management in closed systems, 2nd edition.
Wiley, New York.
Storebakken, T., Kvien, I.S., Shearer, K.D., Grisdale-Helland, B., Helland, S.J. & Berge, G.M.
(1998) The apparent digestibility of diets containing fish meal, soybean meal or bacterial
115
meal fed to Atlantic salmon (Salmo salar): evaluation of different faecal collection
methods. Aquaculture 169, 195-210.
Storebakken, T., Kvien, I.S., Shearer, K.D., Grisdale-Helland, B. & Helland, S.J. (1999)
Estimation of gastrointestinal evacuation rate in Atlantic salmon (Salmo salar) using inert
markers and collection of faeces by sieving: evacuation of diets with fish meal, soybean
meal or bacterial meal. Aquaculture 172, 291-299.
Storebakken, T., Baeverfjord, G., Skrede, A., Olli, J.J. & Berge, G.M. (2004) Bacterial protein
grown on natural gas in diets for Atlantic salmon, Salmo salar, in freshwater.
Aquaculture 241, 413-425.
Terrazas-Fierro, M., Civera-Cerecedo, R., Ibarra-Martínez, L., Goytortúa-Bores, E., Herrera-
Andrade, M. & Reyes-Becerra, A. (2010) Apparent digestibility of dry matter, protein,
and essential amino acid in marine feedstuffs for juvenile whiteleg shrimp (Litopenaeus
vannamei). Aquaculture 308, 166-173.
Yang, Q., Zhou, X., Zhou, Q., Tan, B., Chi, S. & Dong, X. (2009) Apparent digestibility of
selected feed ingredients for white shrimp (Litopenaeus vannamei) Boone. Aquac. Res.
41, 78-86.
Zhou, Y.G., Davis, D.A. & Buentello, A. (2015) Use of new soybean varieties in practical diets
for the Pacific white shrimp (Litopenaeus vannamei). Aquac. Nutr. 21, 635-643.

116
Table 1 Composition (% as is) of test diets utilized in trial 1.
Ingredient Diet code
T1D1 T1D2 T1D3 Soybean meal1 54.10 47.40 40.50 Corn protein concentrate2 8.00 8.00 8.00 Whole wheat3
25.00 25.00 25.00 Bacterial biomass4
0.00 6.00 12.00 Fish oil2 6.05 6.14 6.24 Trace mineral premix5 0.50 0.50 0.50 Vitamin premix6 1.80 1.80 1.80 Choline chloride3 0.20 0.20 0.20 Stay C7 0.10 0.10 0.10 Mono-dicalcium phosphate8 2.50 2.50 2.50 Lecithin9 1.00 1.00 1.00 Cholesterol3 0.05 0.05 0.05 Corn starch3 0.70 1.31 2.11 1 De-hulled solvent extract soybean meal, Bunge Limited, Decatur, AL, USA. 2 Empyreal® 75, Cargill Corn Milling, Cargill, Inc., Blair, NE, USA. 3 MP Biomedicals Inc., Solon, OH, USA. 4 KnipBio Inc., Lowell, MA, USA. 5 Trace mineral premix(g/100g premix): Cobalt chloride, 0.004; Cupric sulfate pentahydrate, 0.550; Ferrous sulfate, 2.000; Magnesium sulfate anhydrous, 13.862; Manganese sulfate monohydrate, 0.650; Potassium iodide, 0.067; Sodium selenite, 0.010; Zinc sulfate heptahydrate, 13.193; Alpha-cellulose, 69.664. 6 Vitamin premix (g/kg premix): Thiamin.HCL, 4.95; Riboflavin, 3.83; Pyridoxine.HCL, 4.00; Ca-Pantothenate, 10.00; Nicotinic acid, 10.00; Biotin, 0.50; folic acid, 4.00; Cyanocobalamin, 0.05; Inositol, 25.00; Vitamin A acetate (500,000 IU/g), 0.32; Vitamin D3 (1,000,000 IU/g), 80.00; Menadione, 0.50; Alpha-cellulose, 856.81. 7 Stay C®, (L-ascorbyl-2-polyphosphate 35% Active C), DSM Nutritional Products., Parsippany, NJ, USA. 8 J. T. Baker®, Mallinckrodt Baker, Inc., Phillipsburg, NJ, USA. 9 The Solae Company, St. Louis, MO, USA.
117
Table 2 Composition (% as is) of test diets utilized in trial 2.
Ingredient Diet code
T2D1 T2D2 T2D3 T2D4 T2D5 T2D6 Fish meal1 6.00 6.00 6.00 6.00 6.00 6.00 Soybean meal2 53.00 51.90 50.80 48.60 46.50 40.10 Corn protein concentrate3 8.00 8.00 8.00 8.00 8.00 8.00 Bacteria biomass4
0.00 1.00 2.00 4.00 6.00 12.00 Fish oil2 5.92 5.93 5.94 5.95 5.97 6.01 Trace mineral premix6 0.50 0.50 0.50 0.50 0.50 0.50 Vitamin premix7 1.80 1.80 1.80 1.80 1.80 1.80 Choline chloride5 0.20 0.20 0.20 0.20 0.20 0.20 Stay C8 0.10 0.10 0.10 0.10 0.10 0.10 Mono-dicalcium phosphate9 2.50 2.50 2.60 2.60 2.80 2.90 Lecithin10 1.00 1.00 1.00 1.00 1.00 1.00 Cholesterol5 0.08 0.08 0.08 0.08 0.08 0.08 Methionine11
0.05 0.05 0.04 0.04 0.04 0.02 Lysine11
0.00 0.01 0.01 0.03 0.04 0.07 Corn starch5 20.85 20.93 20.93 21.10 20.97 21.22 1 Omega Protein Inc., Huston TX, USA. 2 De-hulled solvent extract soybean meal, Bunge Limited, Decatur, AL, USA. 3 Empyreal® 75, Cargill Corn Milling, Cargill, Inc., Blair, NE, USA. 4 KnipBio Inc., Lowell, MA, USA. 5 MP Biomedicals Inc., Solon, OH, USA. 6 Trace mineral premix(g/100g premix): Cobalt chloride, 0.004; Cupric sulfate pentahydrate, 0.550; Ferrous sulfate, 2.000; Magnesium sulfate anhydrous, 13.862; Manganese sulfate monohydrate, 0.650; Potassium iodide, 0.067; Sodium selenite, 0.010; Zinc sulfate heptahydrate, 13.193; Alpha-cellulose, 69.664. 7 Vitamin premix (g/kg premix): Thiamin.HCL, 4.95; Riboflavin, 3.83; Pyridoxine.HCL, 4.00; Ca-Pantothenate, 10.00; Nicotinic acid, 10.00; Biotin, 0.50; folic acid, 4.00; Cyanocobalamin, 0.05; Inositol, 25.00; Vitamin A acetate (500,000 IU/g), 0.32; Vitamin D3 (1,000,000 IU/g), 80.00; Menadione, 0.50; Alpha-cellulose, 856.81. 8 Stay C®, (L-ascorbyl-2-polyphosphate 35% Active C), DSM Nutritional Products., Parsippany, NJ, USA. 9 J. T. Baker®, Mallinckrodt Baker, Inc., Phillipsburg, NJ, USA. 10 The Solae Company, St. Louis, MO, USA. 11 Aldrich-Sigma, St. Louis, MO, USA.

118
Table 3 Composition (% as is) of test diets utilized in trial 3.
Ingredients Diet code
T3D1 T3D2 T3D3 T3D4 T3D5 Fish meal1 6.00 6.00 6.00 6.00 6.00 Soybean meal2 53.00 46.50 46.50 40.10 40.10 Corn protein concentrate3 8.00 8.00 8.00 8.00 8.00 Bacteria biomass4
0.00 6.00 13.30 12.00 26.60 Fish oil2 5.92 5.97 5.81 6.01 5.70 Trace mineral premix6 0.50 0.50 0.50 0.50 0.50 Vitamin premix7 1.80 1.80 1.80 1.80 1.80 Choline chloride5 0.20 0.20 0.20 0.20 0.20 Stay C8 0.10 0.10 0.10 0.10 0.10 Mono-dicalcium phosphate9 2.50 2.80 2.80 2.90 2.90 Lecithin10 1.00 1.00 1.00 1.00 1.00 Cholesterol5 0.08 0.08 0.08 0.08 0.08 Methionine11
0.05 0.04 0.03 0.02 0.02 Lysine11
0.00 0.04 0.05 0.07 0.09 Corn starch5 20.85 20.97 13.83 21.22 6.91 1 Omega Protein Inc., Huston TX, USA. 2 De-hulled solvent extract soybean meal, Bunge Limited, Decatur, AL, USA. 3 Empyreal® 75, Cargill Corn Milling, Cargill, Inc., Blair, NE, USA. 4 KnipBio Inc., Lowell, MA, USA. 5 MP Biomedicals Inc., Solon, OH, USA. 6 Trace mineral premix(g/100g premix): Cobalt chloride, 0.004; Cupric sulfate pentahydrate, 0.550; Ferrous sulfate, 2.000; Magnesium sulfate anhydrous, 13.862; Manganese sulfate monohydrate, 0.650; Potassium iodide, 0.067; Sodium selenite, 0.010; Zinc sulfate heptahydrate, 13.193; Alpha-cellulose, 69.664. 7 Vitamin premix (g/kg premix): Thiamin.HCL, 4.95; Riboflavin, 3.83; Pyridoxine.HCL, 4.00; Ca-Pantothenate, 10.00; Nicotinic acid, 10.00; Biotin, 0.50; folic acid, 4.00; Cyanocobalamin, 0.05; Inositol, 25.00; Vitamin A acetate (500,000 IU/g), 0.32; Vitamin D3 (1,000,000 IU/g), 80.00; Menadione, 0.50; Alpha-cellulose, 856.81. 8 Stay C®, (L-ascorbyl-2-polyphosphate 35% Active C), DSM Nutritional Products., Parsippany, NJ, USA. 9 J. T. Baker®, Mallinckrodt Baker, Inc., Phillipsburg, NJ, USA. 10 The Solae Company, St. Louis, MO, USA. 11 Aldrich-Sigma, St. Louis, MO, USA.
119
Table 4 Composition of reference diet for the determination of digestibility coefficients of bacteria biomass (BB)
Ingredients % as is
Soybean meal1 10.00
Fish meal2 32.50
Fish oil2 3.20
Whole wheat3 47.60
Trace mineral premix4 0.50
Vitamin premix5 1.80
Choline cloride6 0.20
Stay C7 0.10
Corn starch3 1.00
Lecethin8 1.00
Chromic oxide9 1.00 1 De-hulled solvent extract soybean meal, Bunge Limited, Decatur, AL, USA. 2 Omega Protein Inc., Houston TX, USA. 3 MP Biomedicals Inc., Solon, OH, USA 4 Trace mineral premix(g/100g premix): Cobalt chloride, 0.004; Cupric sulfate pentahydrate, 0.550; Ferrous sulfate, 2.000; Magnesium sulfate anhydrous, 13.862; Manganese sulfate monohydrate, 0.650; Potassium iodide, 0.067; Sodium selenite, 0.010; Zinc sulfate heptahydrate, 13.193; Alpha-cellulose, 69.664. 5 Vitamin premix (g/kg premix): Thiamin.HCL, 4.95; Riboflavin, 3.83; Pyridoxine.HCL, 4.00; Ca-Pantothenate, 10.00; Nicotinic acid, 10.00; Biotin, 0.50; folic acid, 4.00; Cyanocobalamin, 0.05; Inositol, 25.00; Vitamin A acetate (500,000 IU/g), 0.32; Vitamin D3 (1,000,000 IU/g), 80.00; Menadione, 0.50; Alpha-cellulose, 856.81. 6 VWR, Radnor, PA, USA. 7 Stay C®, (L-ascorbyl-2-polyphosphate 35% Active C), DSM Nutritional Products., Parsippany, NJ, USA. 8 The Solae Company, St. Louis, MO, USA. 9 Alfa Aesar, Haverhill, MA, USA.
120
Table 5 Proximate composition (% as is), phosphorus content (% as is), and amino acid profile (% as is) of the ingredients used in the growth and digestibility trials.
Composition1 Bacterial biomass Fish meal Soybean meal
Crude protein 52.42 62.78 44.89
Moisture 3.50 7.99 10.97
Crude fat 1.29 10.56 3.78
Crude fiber 0.00 0.00 3.20
Ash 4.25 18.75 6.67
Phosphorus 1.00 3.15 0.66
Alanine 3.81 3.91 2.04
Arginine 3.23 3.68 3.35
Aspartic acid 3.72 5.34 5.10
Cysteine 0.30 0.47 0.62
Glutamic acid 6.13 7.47 8.24
Glycine 2.73 4.88 2.04
Histidine 0.80 1.63 1.20
Isoleucine 1.80 2.42 2.17
Leucine 3.24 4.21 3.57
Lysine 2.79 4.67 3.06
Methionine 0.86 1.61 0.66
Phenylalanine 2.04 2.39 2.35
Proline 2.25 3.08 2.39
Serine 1.21 2.11 1.90
Taurine 0.08 0.73 0.13
Threonine 2.00 2.41 1.75
Tryptophan 0.10 0.62 0.62
Tyrosine 1.34 1.67 1.64
Valine 2.84 2.99 2.34 1 Ingredients were analyzed at University of Missouri Agricultural Experiment Station Chemical Laboratories (Columbia, MO, USA).
121
Table 6 Proximate composition (% as is) and amino acid profile (% as is) of the test diets used in trial 1.
Composition1 T1D1 T1D2 T1D3
Crude Protein 37.67 36.37 36.77 Moisture 5.41 8.34 6.66 Crude Fat 9.54 8.71 8.49 Crude Fiber 4.05 3.48 3.05 Ash 6.06 5.65 5.51 Alanine 1.90 1.92 2.01 Arginine 2.26 2.17 2.16 Aspartic Acid 3.51 3.26 3.16 Cysteine 0.55 0.52 0.49 Glutamic Acid 7.40 6.88 6.76 Glycine 1.48 1.46 1.50 Histidine 0.92 0.86 0.83 Isoleucine 1.69 1.59 1.56
Leucine 3.48 3.29 3.23 Lysine 1.92 1.83 1.81 Methionine 0.60 0.65 0.62 Phenylalanine 1.99 1.90 1.87 Proline 2.40 2.27 2.25 Serine 1.58 1.46 1.44 Taurine 0.10 0.10 0.10 Threonine 1.34 1.30 1.31 Tryptophan 0.39 0.40 0.36 Tyrosine 1.53 1.47 1.43 Valine 1.80 1.73 1.74 1 Diets were analyzed at University of Missouri Agricultural Experiment Station Chemical Laboratories (Columbia, MO, USA).
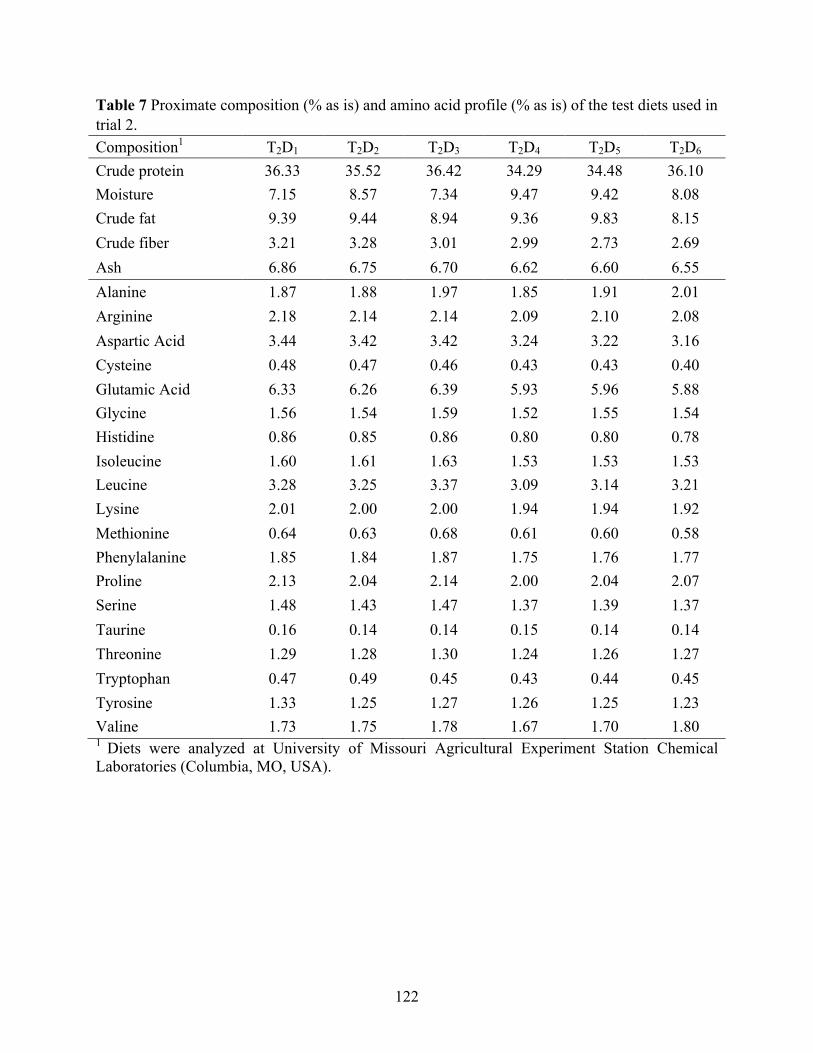
122
Table 7 Proximate composition (% as is) and amino acid profile (% as is) of the test diets used in trial 2. Composition1 T2D1 T2D2 T2D3 T2D4 T2D5 T2D6 Crude protein 36.33 35.52 36.42 34.29 34.48 36.10 Moisture 7.15 8.57 7.34 9.47 9.42 8.08 Crude fat 9.39 9.44 8.94 9.36 9.83 8.15 Crude fiber 3.21 3.28 3.01 2.99 2.73 2.69 Ash 6.86 6.75 6.70 6.62 6.60 6.55 Alanine 1.87 1.88 1.97 1.85 1.91 2.01 Arginine 2.18 2.14 2.14 2.09 2.10 2.08 Aspartic Acid 3.44 3.42 3.42 3.24 3.22 3.16 Cysteine 0.48 0.47 0.46 0.43 0.43 0.40 Glutamic Acid 6.33 6.26 6.39 5.93 5.96 5.88 Glycine 1.56 1.54 1.59 1.52 1.55 1.54 Histidine 0.86 0.85 0.86 0.80 0.80 0.78 Isoleucine 1.60 1.61 1.63 1.53 1.53 1.53 Leucine 3.28 3.25 3.37 3.09 3.14 3.21 Lysine 2.01 2.00 2.00 1.94 1.94 1.92 Methionine 0.64 0.63 0.68 0.61 0.60 0.58 Phenylalanine 1.85 1.84 1.87 1.75 1.76 1.77 Proline 2.13 2.04 2.14 2.00 2.04 2.07 Serine 1.48 1.43 1.47 1.37 1.39 1.37 Taurine 0.16 0.14 0.14 0.15 0.14 0.14 Threonine 1.29 1.28 1.30 1.24 1.26 1.27 Tryptophan 0.47 0.49 0.45 0.43 0.44 0.45 Tyrosine 1.33 1.25 1.27 1.26 1.25 1.23 Valine 1.73 1.75 1.78 1.67 1.70 1.80 1 Diets were analyzed at University of Missouri Agricultural Experiment Station Chemical Laboratories (Columbia, MO, USA).
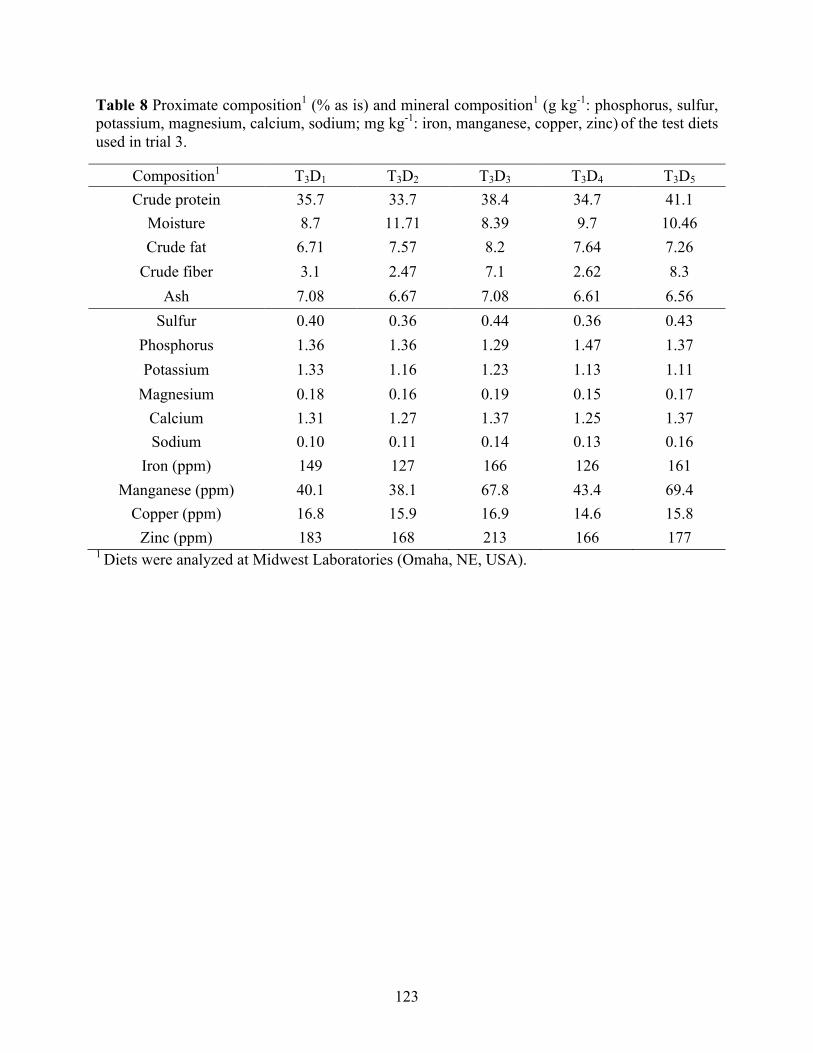
123
Table 8 Proximate composition1 (% as is) and mineral composition1 (g kg-1: phosphorus, sulfur, potassium, magnesium, calcium, sodium; mg kg-1: iron, manganese, copper, zinc) of the test diets used in trial 3.
Composition1 T3D1 T3D2 T3D3 T3D4 T3D5 Crude protein 35.7 33.7 38.4 34.7 41.1
Moisture 8.7 11.71 8.39 9.7 10.46 Crude fat 6.71 7.57 8.2 7.64 7.26
Crude fiber 3.1 2.47 7.1 2.62 8.3 Ash 7.08 6.67 7.08 6.61 6.56
Sulfur 0.40 0.36 0.44 0.36 0.43 Phosphorus 1.36 1.36 1.29 1.47 1.37 Potassium 1.33 1.16 1.23 1.13 1.11
Magnesium 0.18 0.16 0.19 0.15 0.17 Calcium 1.31 1.27 1.37 1.25 1.37 Sodium 0.10 0.11 0.14 0.13 0.16
Iron (ppm) 149 127 166 126 161 Manganese (ppm) 40.1 38.1 67.8 43.4 69.4
Copper (ppm) 16.8 15.9 16.9 14.6 15.8 Zinc (ppm) 183 168 213 166 177
1 Diets were analyzed at Midwest Laboratories (Omaha, NE, USA).
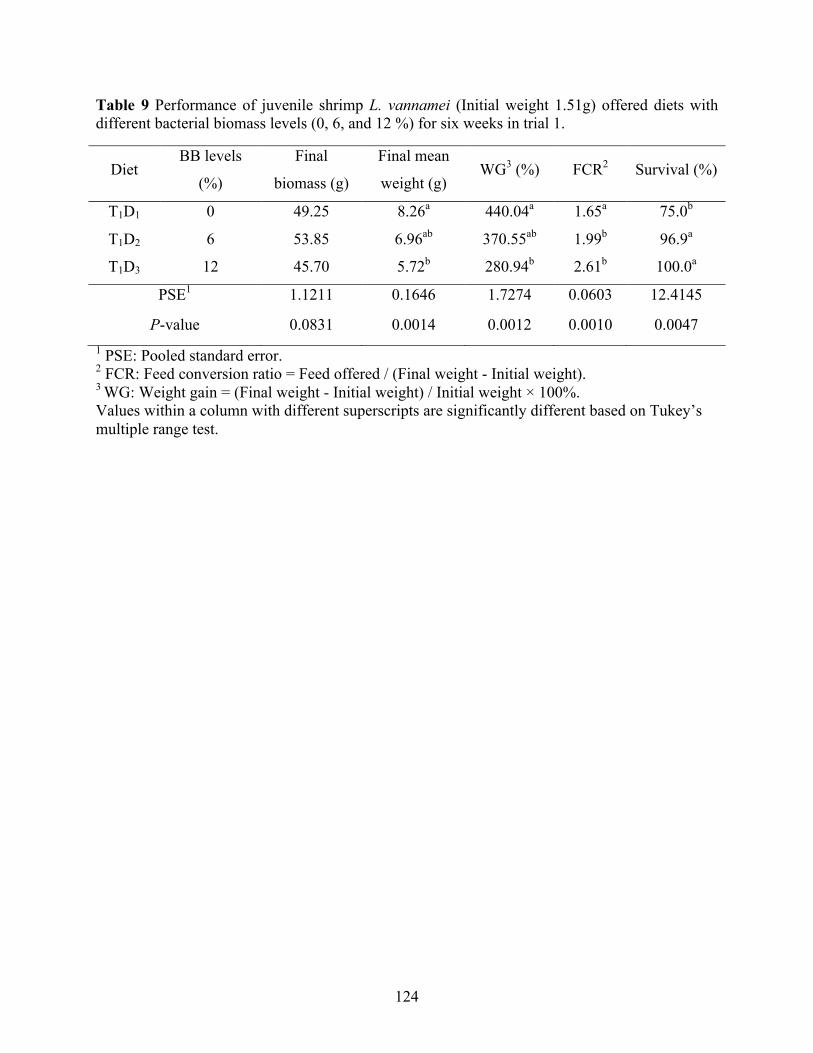
124
Table 9 Performance of juvenile shrimp L. vannamei (Initial weight 1.51g) offered diets with different bacterial biomass levels (0, 6, and 12 %) for six weeks in trial 1.
Diet BB levels
(%)
Final
biomass (g)
Final mean
weight (g) WG3 (%) FCR2 Survival (%)
T1D1 0 49.25 8.26a 440.04a 1.65a 75.0b
T1D2 6 53.85 6.96ab 370.55ab 1.99b 96.9a
T1D3 12 45.70 5.72b 280.94b 2.61b 100.0a
PSE1 1.1211 0.1646 1.7274 0.0603 12.4145
P-value 0.0831 0.0014 0.0012 0.0010 0.0047 1 PSE: Pooled standard error. 2 FCR: Feed conversion ratio = Feed offered / (Final weight - Initial weight). 3 WG: Weight gain = (Final weight - Initial weight) / Initial weight × 100%. Values within a column with different superscripts are significantly different based on Tukey’s multiple range test.
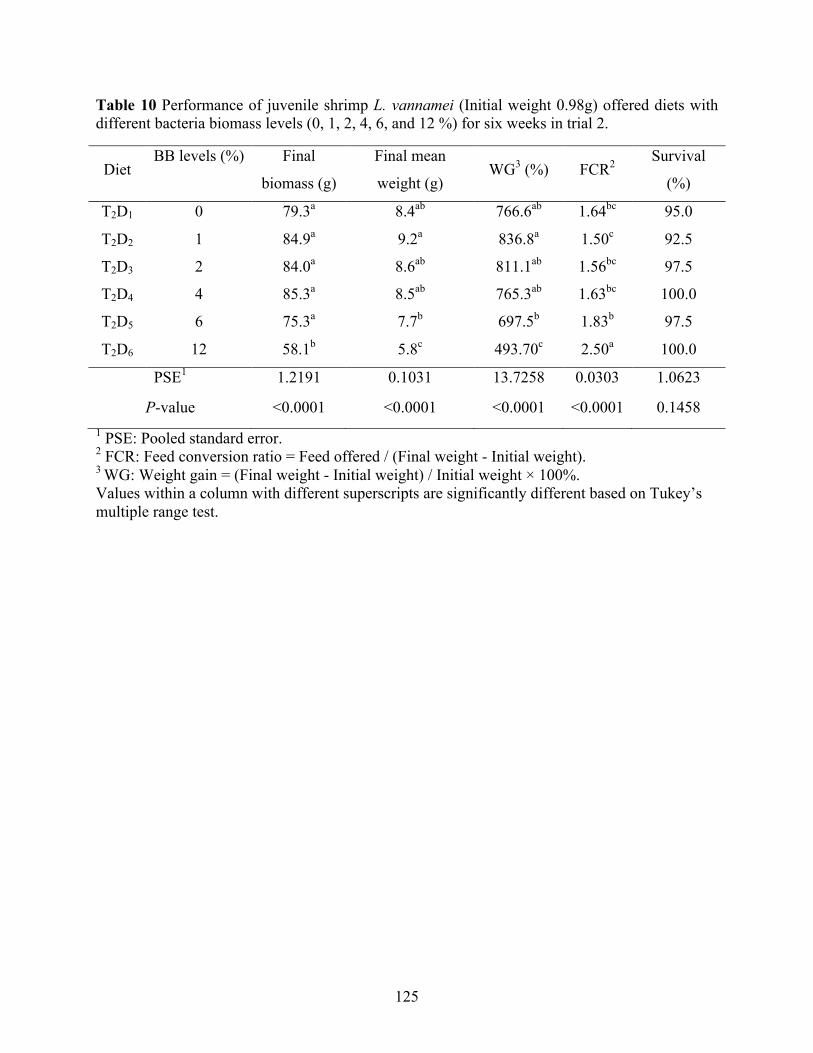
125
Table 10 Performance of juvenile shrimp L. vannamei (Initial weight 0.98g) offered diets with different bacteria biomass levels (0, 1, 2, 4, 6, and 12 %) for six weeks in trial 2.
Diet BB levels (%) Final
biomass (g)
Final mean
weight (g) WG3 (%) FCR2 Survival
(%)
T2D1 0 79.3a 8.4ab 766.6ab 1.64bc 95.0
T2D2 1 84.9a 9.2a 836.8a 1.50c 92.5
T2D3 2 84.0a 8.6ab 811.1ab 1.56bc 97.5
T2D4 4 85.3a 8.5ab 765.3ab 1.63bc 100.0
T2D5 6 75.3a 7.7b 697.5b 1.83b 97.5
T2D6 12 58.1b 5.8c 493.70c 2.50a 100.0
PSE1 1.2191 0.1031 13.7258 0.0303 1.0623
P-value <0.0001 <0.0001 <0.0001 <0.0001 0.1458 1 PSE: Pooled standard error. 2 FCR: Feed conversion ratio = Feed offered / (Final weight - Initial weight). 3 WG: Weight gain = (Final weight - Initial weight) / Initial weight × 100%. Values within a column with different superscripts are significantly different based on Tukey’s multiple range test.
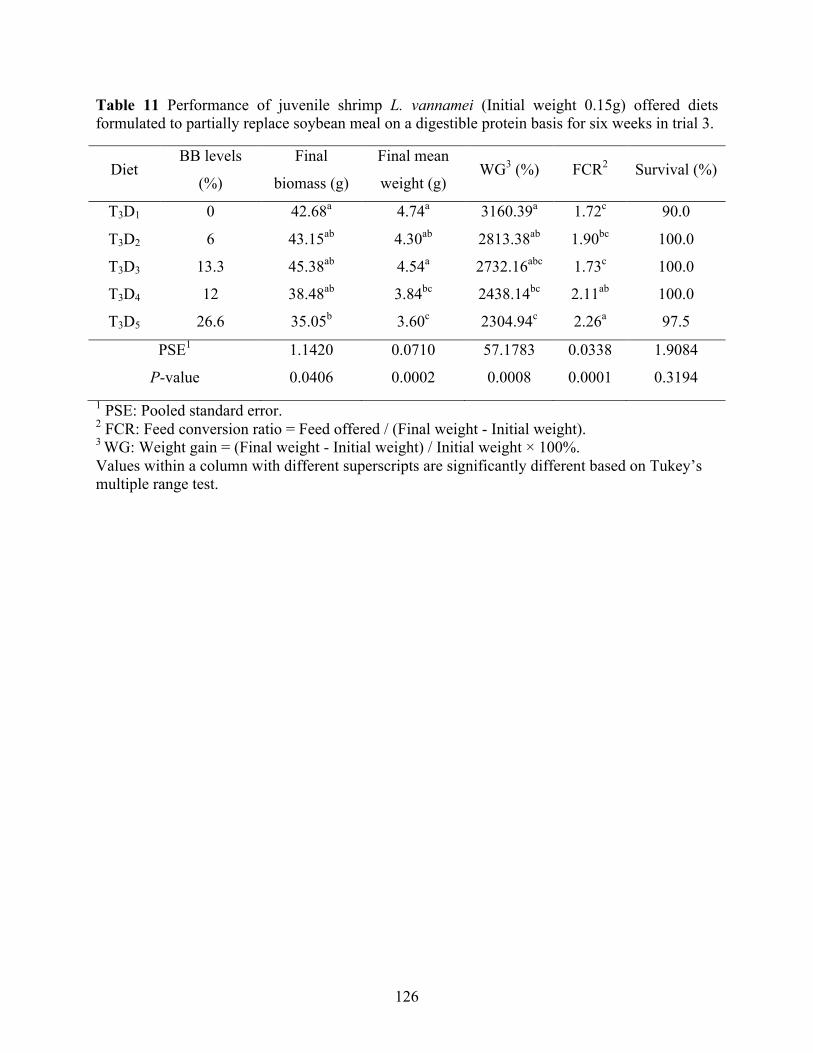
126
Table 11 Performance of juvenile shrimp L. vannamei (Initial weight 0.15g) offered diets formulated to partially replace soybean meal on a digestible protein basis for six weeks in trial 3.
Diet BB levels
(%)
Final
biomass (g)
Final mean
weight (g) WG3 (%) FCR2 Survival (%)
T3D1 0 42.68a 4.74a 3160.39a 1.72c 90.0
T3D2 6 43.15ab 4.30ab 2813.38ab 1.90bc 100.0
T3D3 13.3 45.38ab 4.54a 2732.16abc 1.73c 100.0
T3D4 12 38.48ab 3.84bc 2438.14bc 2.11ab 100.0
T3D5 26.6 35.05b 3.60c 2304.94c 2.26a 97.5
PSE1 1.1420 0.0710 57.1783 0.0338 1.9084
P-value 0.0406 0.0002 0.0008 0.0001 0.3194 1 PSE: Pooled standard error. 2 FCR: Feed conversion ratio = Feed offered / (Final weight - Initial weight). 3 WG: Weight gain = (Final weight - Initial weight) / Initial weight × 100%. Values within a column with different superscripts are significantly different based on Tukey’s multiple range test.
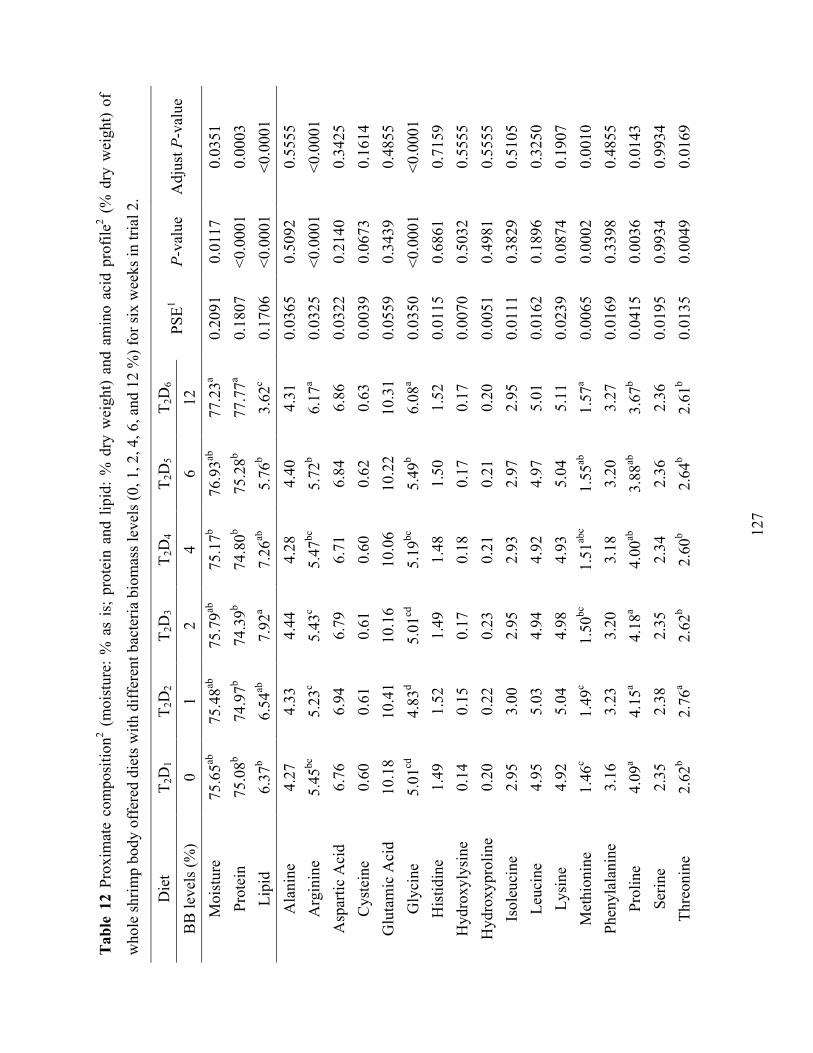
12
7
Tab
le 1
2 Pr
oxim
ate
com
posi
tion2 (
moi
stur
e: %
as
is; p
rote
in a
nd li
pid:
% d
ry w
eigh
t) an
d am
ino
acid
pro
file2 (
% d
ry w
eigh
t) of
who
le sh
rimp
body
off
ered
die
ts w
ith d
iffer
ent b
acte
ria b
iom
ass l
evel
s (0,
1, 2
, 4, 6
, and
12
%) f
or si
x w
eeks
in tr
ial 2
.
Die
t T 2
D1
T 2D
2 T 2
D3
T 2D
4 T 2
D5
T 2D
6 PS
E1 P-
valu
e A
djus
t P-v
alue
B
B le
vels
(%)
0 1
2 4
6 12
M
oist
ure
75.6
5ab
75.4
8ab
75.7
9ab
75.1
7b 76
.93ab
77
.23a
0.20
91
0.01
17
0.03
51
Prot
ein
75.0
8b 74
.97b
74.3
9b 74
.80b
75.2
8b 77
.77a
0.18
07
<0.0
001
0.00
03
Lipi
d 6.
37b
6.54
ab
7.92
a 7.
26ab
5.
76b
3.62
c 0.
1706
<0
.000
1 <0
.000
1 A
lani
ne
4.27
4.
33
4.44
4.
28
4.40
4.
31
0.03
65
0.50
92
0.55
55
Arg
inin
e 5.
45bc
5.
23c
5.43
c 5.
47bc
5.
72b
6.17
a 0.
0325
<0
.000
1 <0
.000
1 A
spar
tic A
cid
6.76
6.
94
6.79
6.
71
6.84
6.
86
0.03
22
0.21
40
0.34
25
Cys
tein
e 0.
60
0.61
0.
61
0.60
0.
62
0.63
0.
0039
0.
0673
0.
1614
G
luta
mic
Aci
d 10
.18
10.4
1 10
.16
10.0
6 10
.22
10.3
1 0.
0559
0.
3439
0.
4855
G
lyci
ne
5.01
cd
4.83
d 5.
01cd
5.
19bc
5.
49b
6.08
a 0.
0350
<0
.000
1 <0
.000
1 H
istid
ine
1.49
1.
52
1.49
1.
48
1.50
1.
52
0.01
15
0.68
61
0.71
59
Hyd
roxy
lysi
ne
0.14
0.
15
0.17
0.
18
0.17
0.
17
0.00
70
0.50
32
0.55
55
Hyd
roxy
prol
ine
0.20
0.
22
0.23
0.
21
0.21
0.
20
0.00
51
0.49
81
0.55
55
Isol
euci
ne
2.95
3.
00
2.95
2.
93
2.97
2.
95
0.01
11
0.38
29
0.51
05
Leuc
ine
4.95
5.
03
4.94
4.
92
4.97
5.
01
0.01
62
0.18
96
0.32
50
Lysi
ne
4.92
5.
04
4.98
4.
93
5.04
5.
11
0.02
39
0.08
74
0.19
07
Met
hion
ine
1.46
c 1.
49c
1.50
bc
1.51
abc
1.55
ab
1.57
a 0.
0065
0.
0002
0.
0010
Ph
enyl
alan
ine
3.16
3.
23
3.20
3.
18
3.20
3.
27
0.01
69
0.33
98
0.48
55
Prol
ine
4.09
a 4.
15a
4.18
a 4.
00ab
3.
88ab
3.
67b
0.04
15
0.00
36
0.01
43
Serin
e 2.
35
2.38
2.
35
2.34
2.
36
2.36
0.
0195
0.
9934
0.
9934
Th
reon
ine
2.62
b 2.
76a
2.62
b 2.
60b
2.64
b 2.
61b
0.01
35
0.00
49
0.01
69
12
8
Tryp
toph
an
0.87
0.
85
0.85
0.
85
0.85
0.
88
0.00
48
0.11
32
0.22
63
Tyro
sine
2.
51
2.33
2.
49
2.52
2.
45
2.57
0.
0405
0.
4536
0.
5555
V
alin
e 4.
10
4.19
4.
12
4.16
4.
17
4.00
0.
0257
0.
1632
0.
3014
To
tal
68.0
5 68
.66
68.4
9 68
.08
69.2
3 70
.23
0.25
81
0.06
29
0.16
14
1 PS
E: P
ool s
tand
ard
erro
r. 2 Pr
oxim
ate
com
posi
tion
and
amin
o ac
id p
rofil
e of
who
le b
ody
sam
ples
wer
e an
alyz
ed a
t Uni
vers
ity o
f Mis
sour
i-Col
umbi
a,
Agr
icul
ture
Exp
erim
ent S
tatio
n C
hem
ical
Lab
orat
ory
(Col
umbi
a, M
O, U
SA).
Val
ues w
ithin
a ro
w w
ith d
iffer
ent s
uper
scrip
ts a
re si
gnifi
cant
ly d
iffer
ent b
ased
on
Tuke
y’s m
ultip
le ra
nge
test
.
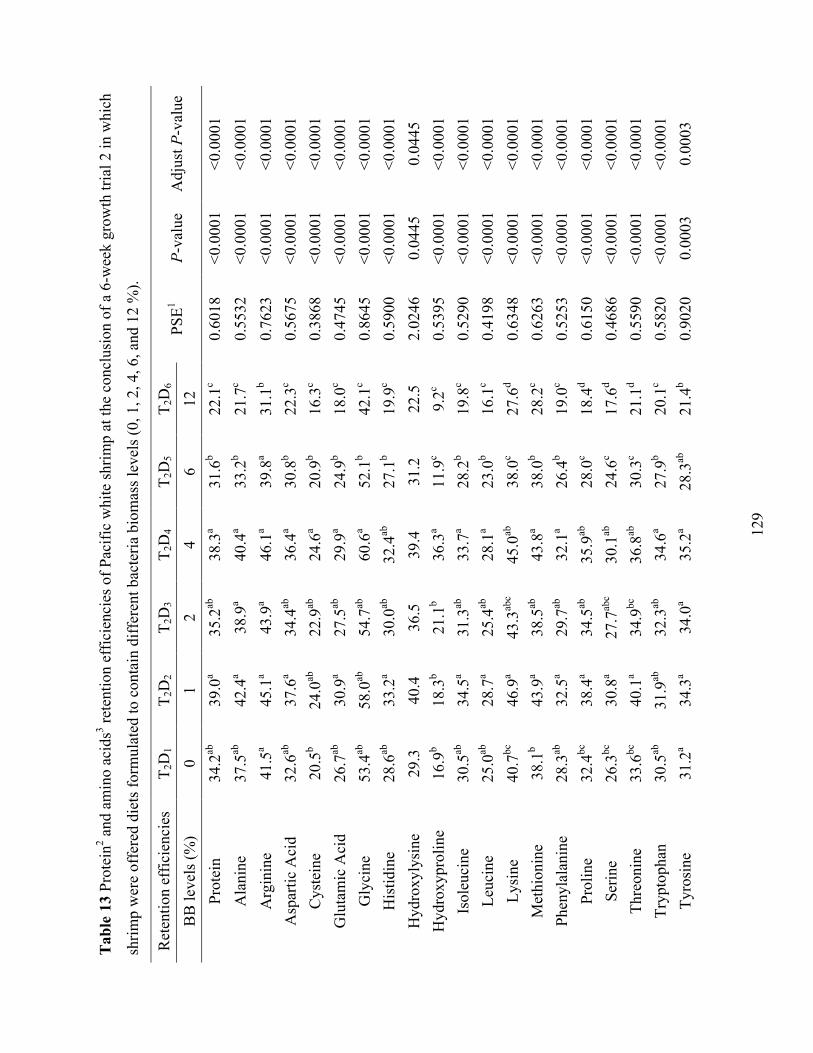
12
9
Tab
le 1
3 Pr
otei
n2 and
am
ino
acid
s3 rete
ntio
n ef
ficie
ncie
s of P
acifi
c w
hite
shrim
p at
the
conc
lusi
on o
f a 6
-wee
k gr
owth
tria
l 2 in
whi
ch
shrim
p w
ere
offe
red
diet
s for
mul
ated
to c
onta
in d
iffer
ent b
acte
ria b
iom
ass l
evel
s (0,
1, 2
, 4, 6
, and
12
%).
Ret
entio
n ef
ficie
ncie
s T 2
D1
T 2D
2 T 2
D3
T 2D
4 T 2
D5
T 2D
6 PS
E1 P-
valu
e A
djus
t P-v
alue
B
B le
vels
(%)
0 1
2 4
6 12
Pr
otei
n 34
.2ab
39
.0a
35.2
ab
38.3
a 31
.6b
22.1
c 0.
6018
<0
.000
1 <0
.000
1 A
lani
ne
37.5
ab
42.4
a 38
.9a
40.4
a 33
.2b
21.7
c 0.
5532
<0
.000
1 <0
.000
1 A
rgin
ine
41.5
a 45
.1a
43.9
a 46
.1a
39.8
a 31
.1b
0.76
23
<0.0
001
<0.0
001
Asp
artic
Aci
d 32
.6ab
37
.6a
34.4
ab
36.4
a 30
.8b
22.3
c 0.
5675
<0
.000
1 <0
.000
1 C
yste
ine
20.5
b 24
.0ab
22
.9ab
24
.6a
20.9
b 16
.3c
0.38
68
<0.0
001
<0.0
001
Glu
tam
ic A
cid
26.7
ab
30.9
a 27
.5ab
29
.9a
24.9
b 18
.0c
0.47
45
<0.0
001
<0.0
001
Gly
cine
53
.4ab
58
.0ab
54
.7ab
60
.6a
52.1
b 42
.1c
0.86
45
<0.0
001
<0.0
001
His
tidin
e 28
.6ab
33
.2a
30.0
ab
32.4
ab
27.1
b 19
.9c
0.59
00
<0.0
001
<0.0
001
Hyd
roxy
lysi
ne
29.3
40
.4
36.5
39
.4
31.2
22
.5
2.02
46
0.04
45
0.04
45
Hyd
roxy
prol
ine
16.9
b 18
.3b
21.1
b 36
.3a
11.9
c 9.
2c 0.
5395
<0
.000
1 <0
.000
1 Is
oleu
cine
30
.5ab
34
.5a
31.3
ab
33.7
a 28
.2b
19.8
c 0.
5290
<0
.000
1 <0
.000
1 Le
ucin
e 25
.0ab
28
.7a
25.4
ab
28.1
a 23
.0b
16.1
c 0.
4198
<0
.000
1 <0
.000
1 Ly
sine
40
.7bc
46
.9a
43.3
abc
45.0
ab
38.0
c 27
.6d
0.63
48
<0.0
001
<0.0
001
Met
hion
ine
38.1
b 43
.9a
38.5
ab
43.8
a 38
.0b
28.2
c 0.
6263
<0
.000
1 <0
.000
1 Ph
enyl
alan
ine
28.3
ab
32.5
a 29
.7ab
32
.1a
26.4
b 19
.0c
0.52
53
<0.0
001
<0.0
001
Prol
ine
32.4
bc
38.4
a 34
.5ab
35
.9ab
28
.0c
18.4
d 0.
6150
<0
.000
1 <0
.000
1 Se
rine
26.3
bc
30.8
a 27
.7ab
c 30
.1ab
24
.6c
17.6
d 0.
4686
<0
.000
1 <0
.000
1 Th
reon
ine
33.6
bc
40.1
a 34
.9bc
36
.8ab
30
.3c
21.1
d 0.
5590
<0
.000
1 <0
.000
1 Tr
ypto
phan
30
.5ab
31
.9ab
32
.3ab
34
.6a
27.9
b 20
.1c
0.58
20
<0.0
001
<0.0
001
Tyro
sine
31
.2a
34.3
a 34
.0a
35.2
a 28
.3ab
21
.4b
0.90
20
0.00
03
0.00
03
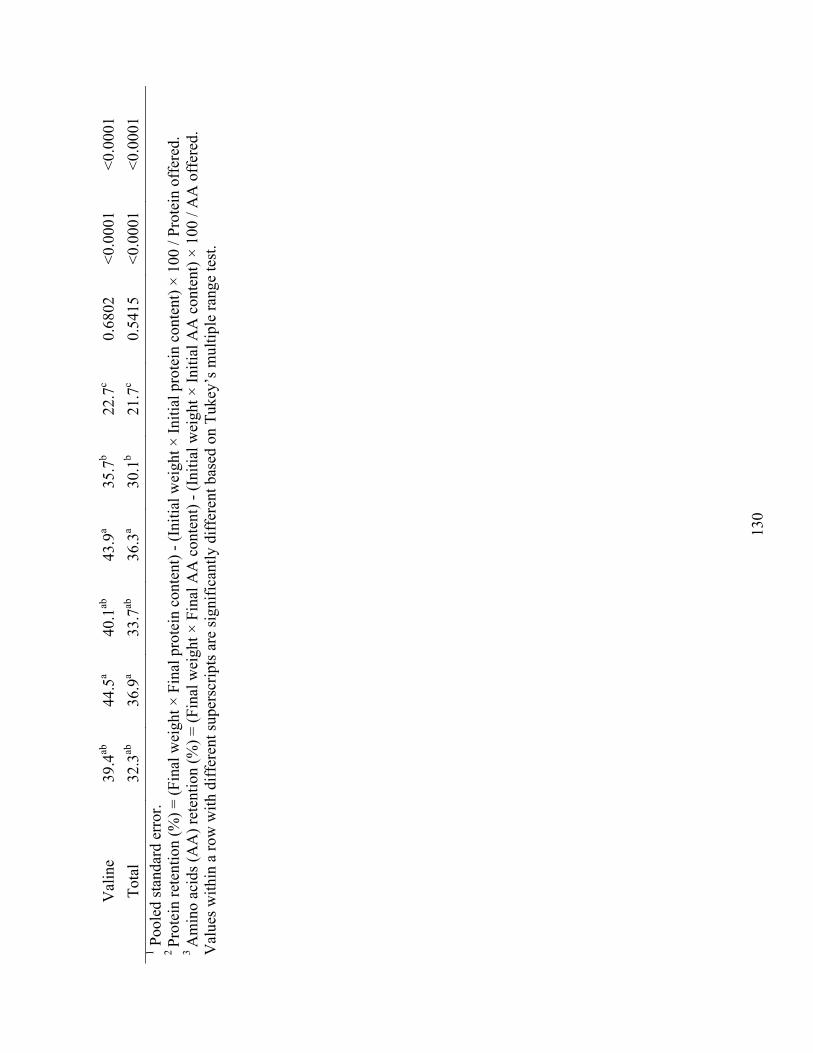
13
0
Val
ine
39.4
ab
44.5
a 40
.1ab
43
.9a
35.7
b 22
.7c
0.68
02
<0.0
001
<0.0
001
Tota
l 32
.3ab
36
.9a
33.7
ab
36.3
a 30
.1b
21.7
c 0.
5415
<0
.000
1 <0
.000
1 1 P
oole
d st
anda
rd e
rror
. 2 Pr
otei
n re
tent
ion
(%) =
(Fin
al w
eigh
t × F
inal
pro
tein
con
tent
) - (I
nitia
l wei
ght ×
Initi
al p
rote
in c
onte
nt) ×
100
/ Pr
otei
n of
fere
d.
3 A
min
o ac
ids (
AA
) ret
entio
n (%
) = (F
inal
wei
ght ×
Fin
al A
A c
onte
nt) -
(Ini
tial w
eigh
t × In
itial
AA
con
tent
) × 1
00 /
AA
off
ered
. V
alue
s with
in a
row
with
diff
eren
t sup
ersc
ripts
are
sign
ifica
ntly
diff
eren
t bas
ed o
n Tu
key’
s mul
tiple
rang
e te
st.
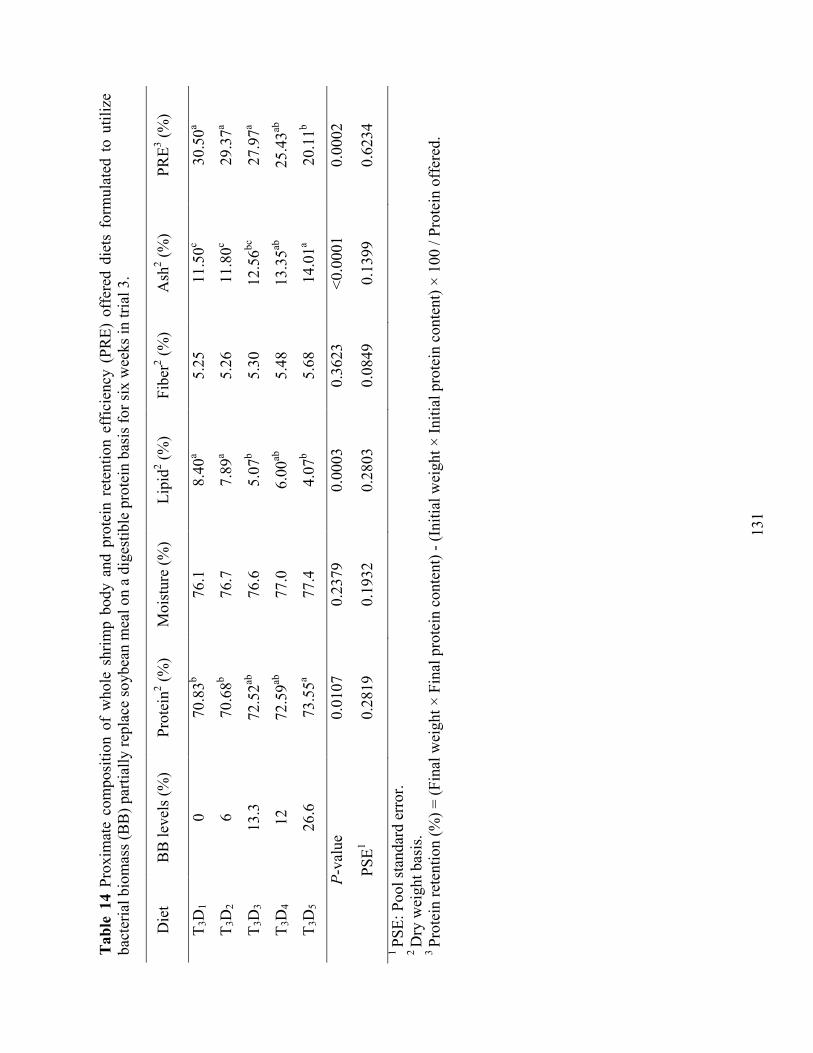
13
1
Tab
le 1
4 Pr
oxim
ate
com
posi
tion
of w
hole
shr
imp
body
and
pro
tein
ret
entio
n ef
ficie
ncy
(PR
E) o
ffer
ed d
iets
for
mul
ated
to
utili
ze
bact
eria
l bio
mas
s (B
B) p
artia
lly re
plac
e so
ybea
n m
eal o
n a
dige
stib
le p
rote
in b
asis
for s
ix w
eeks
in tr
ial 3
.
Die
t B
B le
vels
(%)
Prot
ein2 (%
) M
oist
ure
(%)
Lipi
d2 (%)
Fibe
r2 (%)
Ash
2 (%)
PRE3 (%
)
T 3D
1 0
70.8
3b 76
.1
8.40
a 5.
25
11.5
0c 30
.50a
T 3D
2 6
70.6
8b 76
.7
7.89
a 5.
26
11.8
0c 29
.37a
T 3D
3 13
.3
72.5
2ab
76.6
5.
07b
5.30
12
.56bc
27
.97a
T 3D
4 12
72
.59ab
77
.0
6.00
ab
5.48
13
.35ab
25
.43ab
T 3D
5 26
.6
73.5
5a 77
.4
4.07
b 5.
68
14.0
1a 20
.11b
P-va
lue
0.01
07
0.23
79
0.00
03
0.36
23
<0.0
001
0.00
02
PSE1
0.28
19
0.19
32
0.28
03
0.08
49
0.13
99
0.62
34
1 PS
E: P
ool s
tand
ard
erro
r. 2 D
ry w
eigh
t bas
is.
3 Pr
otei
n re
tent
ion
(%) =
(Fin
al w
eigh
t × F
inal
pro
tein
con
tent
) - (I
nitia
l wei
ght ×
Initi
al p
rote
in c
onte
nt) ×
100
/ Pr
otei
n of
fere
d.
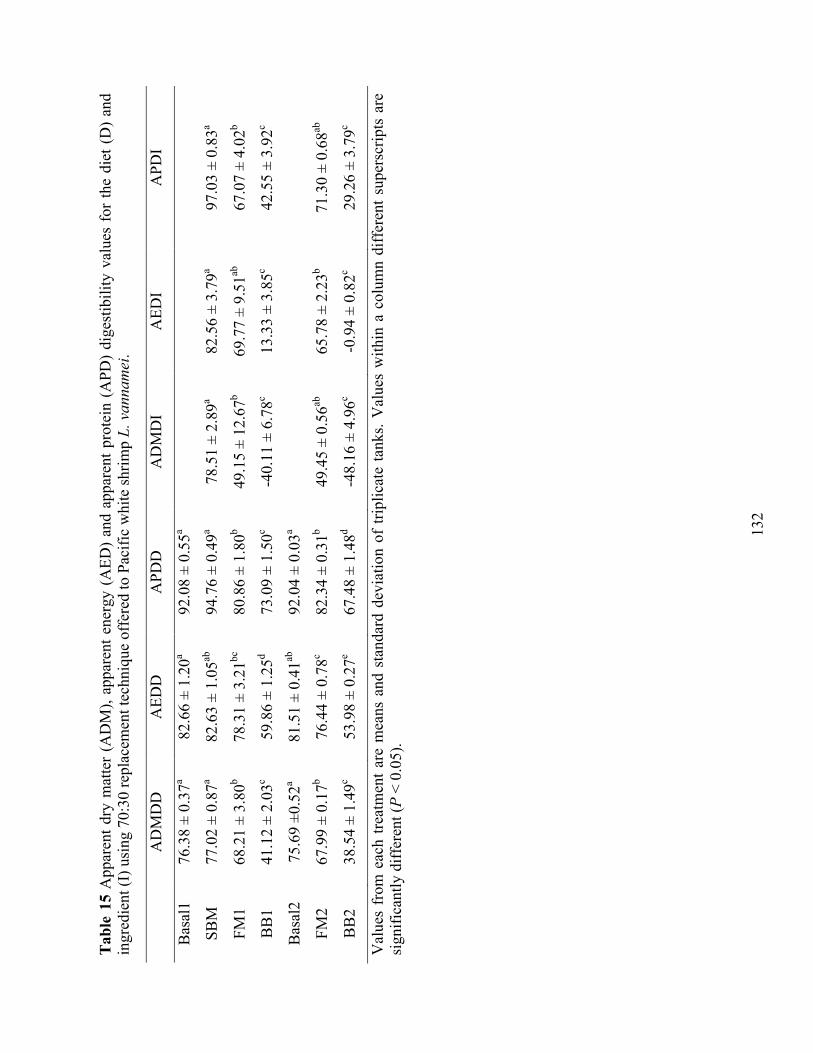
13
2
Tab
le 1
5 A
ppar
ent d
ry m
atte
r (A
DM
), ap
pare
nt e
nerg
y (A
ED)
and
appa
rent
pro
tein
(A
PD)
dige
stib
ility
val
ues
for
the
diet
(D
) an
d in
gred
ient
(I) u
sing
70:
30 re
plac
emen
t tec
hniq
ue o
ffer
ed to
Pac
ific
whi
te sh
rimp
L. v
anna
mei
.
A
DM
DD
A
EDD
A
PDD
A
DM
DI
AED
I A
PDI
Bas
al1
76.3
8 ±
0.37
a 82
.66
± 1.
20a
92.0
8 ±
0.55
a
SB
M
77.0
2 ±
0.87
a 82
.63
± 1.
05ab
94
.76
± 0.
49a
78.5
1 ±
2.89
a 82
.56
± 3.
79a
97.0
3 ±
0.83
a
FM1
68.2
1 ±
3.80
b 78
.31
± 3.
21bc
80
.86
± 1.
80b
49.1
5 ±
12.6
7b 69
.77
± 9.
51ab
67
.07
± 4.
02b
BB
1 41
.12
± 2.
03c
59.8
6 ±
1.25
d 73
.09
± 1.
50c
-40.
11 ±
6.7
8c 13
.33
± 3.
85c
42.5
5 ±
3.92
c
Bas
al2
75.6
9 ±0
.52a
81.5
1 ±
0.41
ab
92.0
4 ±
0.03
a
FM2
67.9
9 ±
0.17
b 76
.44
± 0.
78c
82.3
4 ±
0.31
b 49
.45
± 0.
56ab
65
.78
± 2.
23b
71.3
0 ±
0.68
ab
BB
2 38
.54
± 1.
49c
53.9
8 ±
0.27
e 67
.48
± 1.
48d
-48.
16 ±
4.9
6c -0
.94
± 0.
82c
29.2
6 ±
3.79
c
Val
ues
from
eac
h tre
atm
ent a
re m
eans
and
sta
ndar
d de
viat
ion
of tr
iplic
ate
tank
s. V
alue
s w
ithin
a c
olum
n di
ffer
ent s
uper
scrip
ts a
re
sign
ifica
ntly
diff
eren
t (P
< 0.
05).
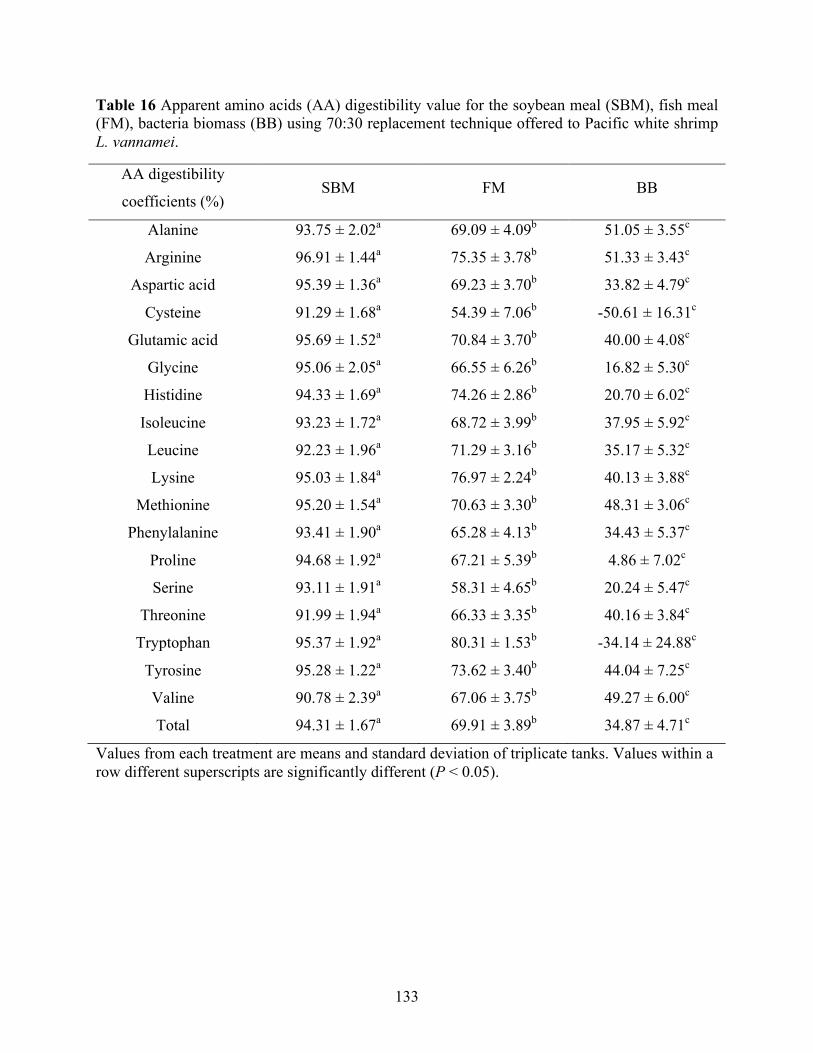
133
Table 16 Apparent amino acids (AA) digestibility value for the soybean meal (SBM), fish meal (FM), bacteria biomass (BB) using 70:30 replacement technique offered to Pacific white shrimp L. vannamei.
AA digestibility
coefficients (%) SBM FM BB
Alanine 93.75 ± 2.02a 69.09 ± 4.09b 51.05 ± 3.55c
Arginine 96.91 ± 1.44a 75.35 ± 3.78b 51.33 ± 3.43c
Aspartic acid 95.39 ± 1.36a 69.23 ± 3.70b 33.82 ± 4.79c
Cysteine 91.29 ± 1.68a 54.39 ± 7.06b -50.61 ± 16.31c
Glutamic acid 95.69 ± 1.52a 70.84 ± 3.70b 40.00 ± 4.08c
Glycine 95.06 ± 2.05a 66.55 ± 6.26b 16.82 ± 5.30c
Histidine 94.33 ± 1.69a 74.26 ± 2.86b 20.70 ± 6.02c
Isoleucine 93.23 ± 1.72a 68.72 ± 3.99b 37.95 ± 5.92c
Leucine 92.23 ± 1.96a 71.29 ± 3.16b 35.17 ± 5.32c
Lysine 95.03 ± 1.84a 76.97 ± 2.24b 40.13 ± 3.88c
Methionine 95.20 ± 1.54a 70.63 ± 3.30b 48.31 ± 3.06c
Phenylalanine 93.41 ± 1.90a 65.28 ± 4.13b 34.43 ± 5.37c
Proline 94.68 ± 1.92a 67.21 ± 5.39b 4.86 ± 7.02c
Serine 93.11 ± 1.91a 58.31 ± 4.65b 20.24 ± 5.47c
Threonine 91.99 ± 1.94a 66.33 ± 3.35b 40.16 ± 3.84c
Tryptophan 95.37 ± 1.92a 80.31 ± 1.53b -34.14 ± 24.88c
Tyrosine 95.28 ± 1.22a 73.62 ± 3.40b 44.04 ± 7.25c
Valine 90.78 ± 2.39a 67.06 ± 3.75b 49.27 ± 6.00c
Total 94.31 ± 1.67a 69.91 ± 3.89b 34.87 ± 4.71c
Values from each treatment are means and standard deviation of triplicate tanks. Values within a row different superscripts are significantly different (P < 0.05).
134
CHAPTER VI
EVALUATION OF A FISH MEAL ANALOGUE AS A REPLACEMENT FOR FISH
MEAL IN PRACTICAL DIETS FOR PACIFIC WHITE SHRIMP Litopenaeus vannamei
1. Introduction
Fish meal (FM) is the most important and preferred protein source in most shrimp feeds,
because it is an excellent source of essential nutrients such as protein and indispensable amino
acids, essential fatty acids, cholesterol, vitamins, minerals, attractants and unidentified growth
factors (Samocha et al., 2004; Swick et al., 1995). Because of FM’s comparatively high
nutritional value and limitation of availability, it has a high demand and limit supply resulting in
a corresponding high market value. Hence, we must shift our emphasis and use this ingredient
only when nutrient requirements of the animal demand its use (Davis and Sookying, 2009).
As commercial shrimp culture has become an expanded and intensified economic activity,
the demand for cost effective protein sources continues to increase because there is a
considerable cost saving in shifting protein sources when it is economical and nutritionally
viable. Partial replacement of FM in the diets for Pacific white shrimp were demonstrated to be
feasible in many studies (Cruz-Suárez et al., 2007; Goytortúa-Bores et al., 2006; Ju et al., 2012;
Liu et al., 2012; Oujifard et al., 2012; Tan et al., 2005). If the substitution strategy considers
shifts in essential nutrients, it also appears that FM can be removed from shrimp formulations if
suitable alternative sources of protein and lipids are provided to meet the nutrient requirements
of the animal (Davis et al., 2004). The use of complementary ingredients is a practice used to
obtain a more balanced nutrient profile in the feeds (i.e. essential amino acids, fatty acids) and to
increase nutrient utilization and facilitate feed processing (Samocha et al., 2004). Based on
135
numerous studies with Pacific white shrimp reared under a variety of culture conditions and
densities, FM can be successfully removed from shrimp feed formulations in properly balanced
production diets without compromising the growth of shrimp (Amaya et al., 2007a;b; Browdy et
al., 2006; Roy et al., 2009; Samocha et al., 2004; Sookying and Davis, 2011).
Aqua-Pak Pro-Cision is a blend of animal and plant protein products supplemented with
encapsulated essential amino acids and some other essential nutrients that designed for shrimp
industry as a substitution for FM. Because it has a similar balanced nutrient profile in terms of
protein, lipid, and amino acids to that of FM and has a lower price it may be suitable for
inclusion in the shrimp diets. The information of this product as a FM replacement in practical
diets for the Pacific white shrimp is still limited. Hence, the objectives of this study were to
determine the nutrient digestibility values of the ingredient and evaluate the potential effects of
this product as a replacement for FM in practical diets for Pacific white shrimp, L. vannamei.
2. Materials and Methods
2.1. Experimental design and diets
All test diets were formulated to be isonitrogenous and isolipidic (35% protein and 8%
lipid). In the growth trial 1 and 2, five experimental diets were formulated to contain increasing
level of FMA (0, 4.85, 9.70, 14.55, and 19.44%) as a replacement of FM (0, 5, 10, 15, and 20%)
(Table 1). In trial 3, five experimental diets were essentially the same as the diets used in trial 1
and 2, but balanced for P (Table 2). Additionally, a reference diet (Table 3) was utilized to
determine digestibility coefficients in conjunction with 1% chromic oxide as an inert marker and
70:30 replacement strategy.
136
Primary ingredients were analyzed at University of Missouri Agricultural Experiment
Station Chemical Laboratories (Columbia, MO, USA) for proximate composition, P content, and
amino acid profile (Table 4). All experimental diets were produced at the Aquatic Animal
Nutrition Laboratory at the School of Fisheries, Aquaculture, and Aquatic Sciences, Auburn
University (Auburn, AL, USA) using the standard procedures for the shrimp feeds. Briefly, diets
were prepared by mixing the pre-ground dry ingredients in a food mixer (Hobart, Troy, OH,
USA) for 10–15 minutes. Hot water was then blended into the mixture to obtain a consistency
appropriate for pelleting. Diets were pressure-pelleted using a meat grinder with a 2.5-mm die.
The wet pellets were then placed into a fan-ventilated oven (< 50 °C) overnight in order to attain
a moisture content of less than 10%. Dry pellets were crumbled, packed in sealed bags, and
stored in a freezer until use. The diets were analyzed at University of Missouri Agricultural
Experiment Station Chemical Laboratories (Columbia, MO, USA) and Midwest Laboratories
(Omaha, NE, USA) for proximate composition, amino acid profile, and mineral composition
(Table 5 and 6).
2.2. Growth trials
Three trials were conducted at the E.W. Shell Fisheries Research Station, Auburn
University (Auburn, AL, USA). Pacific white shrimp post larvae (PL) were obtained from
Shrimp Improvement Systems (Islamorada, Florida) and nursed in an indoor recirculating
system. PLs were fed a commercial feed (Zeigler Bros., Inc., Gardners, Pennsylvania, USA)
using an automatic feeder for ~1 week, and then switched to crumbled commercial shrimp feed
(Zeigler Bros., Inc., Gardners, Pennsylvania, USA) for ~1- 2 weeks.
137
In trial 1 and 2, the recirculating system consisted of 30 aquaria (135 L) connected to a
common reservoir, biological filter, bead filter, fluidized biological filter and recirculation pump.
Six replicate groups of shrimp (0.47 g initial mean weight, 10 shrimp/tank for trial 1; 0.40 g
initial mean weight, 10 shrimp/tank for trial 2) were offered diets using our standard feeding
protocol over 6 weeks. Based on historic results, feed inputs were pre-programmed assuming the
shrimp would double their weight weekly up to one gram then gain 0.8-1.1 g weekly with a feed
conversion ratio (FCR) of 1.8. Daily allowances of feed were adjusted based on observed feed
consumption, weekly counts of the shrimp and mortality. Consequently, for each tank in trial 1, a
fixed ration of 1.21 g day-1 for the first week, 2.06 g day-1 for the second week, 2.31 g day-1 for
the third week, 2.57 g day-1 for the fourth week, and 2.83 g day-1 for the remaining culturing
period was offered, partitioned in 4 feedings each day. For each tank in trial 2, a fixed ration of
1.03 g day-1 for the first week, 2.06 g day-1 for the second to fourth week, 2.31 g day-1 for the
fifth week, and 2.57 g day-1 for the last week was also allotted in 4 portions per day.
In trial 3, the recirculating system consisted of 20 aquaria (80 L) connected to a common
reservoir, biological filter, bead filter, fluidized biological filter and recirculation pump. Four
replicate groups of shrimp (0.25 g initial mean weight, 10 shrimp/tank) were offered diets using
our standard feeding protocol over 6 weeks. Based on historic results, feed inputs were pre-
programmed assuming the shrimp would double their weight weekly up to one gram then gain
0.8-1.1 g weekly with a feed conversion ratio (FCR) of 1.8. Daily allowances of feed were
adjusted based on observed feed consumption, weekly counts of the shrimp and mortality.
Consequently, for each tank in trial 3, a fixed ration of 0.68 g day-1 for the first week, 1.36 g day-
1 for the second week, 2.18 g day-1 for the third and fourth week, and 2.73 g day-1 for the
remaining culturing period was offered, partitioned in 4 feedings each day.
138
At the conclusion of each growth trial, shrimp were counted and group-weighted. Mean
final weight, FCR, WG, biomass, and survival were determined (Table 7). After obtaining the
final total weight of shrimps in each aquarium, 4 shrimps from trial 2 and trial 3 were randomly
selected and frozen at -20 °C for subsequent determination of whole body composition.
Proximate and mineral compositions of whole shrimp body in trial 2 and trial 3 (Table 9 and
Table 10) were analyzed by University of Missouri-Columbia, Agriculture Experiment Station
Chemical Laboratory (Columbia, MO, USA) and Midwest Laboratories (Omaha, NE, USA),
respectively. Protein and mineral retention was calculated as follows:
Protein retention (%) = (final weight × final protein content) - (initial weight × initial protein
content) × 100 / protein offered.
Mineral retention (%) = (final weight × final mineral content) - (initial weight × initial mineral
content) × 100 / mineral offered.
2.3. Water quality monitoring
For all trials, dissolved oxygen (DO), water temperature and salinity were measured
twice daily by using a YSI 650 multi-parameter instrument (YSI, Yellow Springs, OH, USA).
Hydrogen potential (pH) was measured twice weekly by using a waterproof pHTestr30 (Oakton
instrument, Vernon Hills, IL, USA). Total ammonia-nitrogen (TAN) and nitrite were evaluated
every week by using the methods described by Sororzano (1969) and Spotte (1979).
2.4. Digestibility trial
The digestibility trial was conducted in the mentioned recirculation system and utilized
six shrimp per aquaria with six aquaria per dietary treatment. Once acclimated for three days to
139
the test diets, feces from two aquaria were pooled (n=3) and collected over a 5-day period or
until adequate samples were obtained. To obtain fecal samples, the aquaria were cleaned by
siphoning before each feeding with the first collection of the day discarded. After cleaning, the
shrimp were offered an excess of feed and then about 1 hour later feed was removed and feces
were collected by siphoning onto a 500µm mesh screen. Collected feces were rinsed with
distilled water, dried at 105 °C until a constant weight was obtained, and then stored in freezer
(−20 °C) until analyzed. Apparent digestibility coefficient for dry matter, protein, energy, and
amino acids were determined by using chromic oxide (Cr2O3, 10 g kg -1) as an inert marker.
Chromium concentrations were determined by the method of McGinnis and Kasting (1964) in
which, after a colorimetric reaction, absorbance is read on a spectrophotometer (Spectronic
genesis 5, Milton Roy Co., Rochester, NY, USA) at 540nm. Gross energy of diets and fecal
samples were analyzed with a Semi micro-bomb calorimeter (Model 1425, Parr Instrument Co.,
Moline, IL, USA). Protein were determined by micro-Kjeldahl analysis (Ma and Zuazaga, 1942).
Amino acids were analyzed by University of Missouri-Columbia, Agriculture Experiment
Station Chemical Laboratory (Columbia, MO, USA). The apparent digestibility coefficient of
dry matter (ADMD), protein (APD), energy (AED), and amino acids (AAAD) were calculated
according to Cho et al. (1982) as follows:
ADMD (%) = 100 − [100 × (% Cr2O3 in feed / % Cr2O3 in feces)]
APD, AED, and AAAD (%) =100 − [100 × (% Cr2O3 in feed / % Cr2O3 in feces) × (% nutrient in
feces / % nutrient in feed]
The apparent digestibility coefficients (ADC) of the test ingredients for dry matter,
energy, protein and amino acids were calculated according to Bureau, Hua (2006) as follows:
ADCtest ingredient = ADCtest diet + [(ADCtest diet – ADCref. diet) × (0.7 × Dref / 0.3 × Dingr)]
140
where Dref = % nutrient (or KJ/g gross energy) of reference diet mash (as is); Dingr = % nutrient
(or KJ/g gross energy) of test ingredient (as is).
2.5. Statistical analysis
All the data were analyzed using SAS (V9.3. SAS Institute, Cary, NC, USA). Data from
were analyzed using one-way ANOVA to determine significant differences (P<0.05) among
treatments followed by the Tukey’s multiple comparison test to determine difference between
treatments in each trial. Pearson correlation analysis was performed to determine if there is a
correlation between dietary P levels and biological responses of shrimp. The pooled standard
errors were used across growth trials, as the variance of each treatment is the same.
3. Results
3.1. Water quality
In trial 1, DO, temperature, salinity, pH, TAN, and nitrite were maintained at
6.04±0.42mg L-1, 27.9±0.4°C, 9.7±0.3ppt, 7.8±0.2, 0.083±0.088mg L-1, and 0.020±0.019mg L-1,
respectively. In trial 2, DO, temperature, salinity, pH, TAN, and nitrite were maintained at
5.86±0.31mg L-1, 28.5±0.8°C, 8.2±1.4ppt, 7.5±0.3, 0.041±0.050mg L-1, and 0.058±0.102mg L-1,
respectively. In trial 3, DO, temperature, salinity, pH, TAN, and nitrite were maintained at
6.66±0.3 mg L-1, 28.8 ± 2.4 °C, 8.0 ± 0.9 ppt, 7.0 ± 0.3, 0.029 ± 0.036 mg L-1, and 0.121 ± 0.128
mg L-1, respectively. Water quality conditions in all trials were suitable for normal growth and
survival of this species.
141
3.2. Growth trial
Growth performance of juvenile Pacific white shrimp fed with experimental diets are
presented in Table 7. In trial 1, shrimp offered diets incorporated with 4.85% FMA replacement
exhibited significantly higher WG than treatment contained 14.55% FMA. No significantly
differences were observed in final biomass (34.68g to 37.10g), final mean weight (4.29 g to
4.85g), FCR (2.21 to 2.55), and survival (75% to 86.7%). In trial 2, shrimp fed with diets
contained 4.85 and 9.7% FMA showed significantly higher final biomass, final mean weight, and
WG, but lower FCR than shrimp offered diets supplemented with 19.4% FMA. No significant
difference was found in survival (81.7% to 91.7%). In trial 3, final mean weight and WG were
significantly improved in the treatment contained 4.85% FMA compared to the treatment
supplemented with 14.55% FMA. No significant differences were determined in biomass (35.28
to 42.35 g), FCR (1.68 to 2.20), and survival (80.0 to 87.5%).
Pearson correlation coefficients of growth performance, FCR, and survival with dietary P
levels are presented in Table 8. In trial 1 and trial 2, dietary phosphorus levels had significant
positive correlation with weight gain while negatively correlated with FCR. No correlations of
phosphorus levels with survival were observed.
Proximate and mineral compositions of whole shrimp body as well as protein and P
retention in trial 2 and trial 3 are presented in Table 9 and Table 10. In trial 2, shrimp fed with
diet containing 4.85% FMA exhibited significantly higher lipid content compared to treatment
included with 19.4% FMA. Protein content was significantly improved when shrimp was fed
with diet contained 19.4% FMA in contrast with treatments contained 0 and 4.85% FMA.
Shrimp fed with diets containing 4.85 and 9.7% FMA exhibited significantly improved protein
retention (PR) compared to those fed with the diet supplemented with 19.4% FMA. No
142
significant differences were detected in moisture (72.28 to 75.97%), crude fiber (5.71 to 6.25%),
ash (11.85 to 12.45%), and P (1.03 to 1.08%) contents of whole shrimp body and P retention
(11.49 to 14.09%) across the treatments.
In trial 3, significantly improved PR was detected in the shrimp fed diets containing
4.85% FMA. P retention in the treatment supplemented with 19.4% FMA was significantly
higher than that in the treatment containing 14.55% FMA. No significant differences were
determined in protein (74.23 to 75.8%), moisture (76.81 to 78.26%), lipid (4.65 to 5.82%), ash
(11.40 to 12.07%), sulfur (0.84 to 0.9%), phosphorus (0.99 to 1.06%), potassium (1.33 to
1.46%), magnesium (0.26 to 0.3%), calcium (3 to 3.61%), sodium (1.07 to 1.19%), iron (17.1 to
26.03 mg kg-1), manganese (2.68 to 3.53 mg kg-1), copper (69.4 to 75.85 mg kg-1), zinc (74 to
77.2 mg kg-1) contents in the whole shrimp body.
3.3. Digestibility trial
Apparent dry matter (ADM), apparent energy (AED), and apparent protein (APD)
digestibility values for the diet (D) and ingredient (I) using 70:30 replacement technique offered
to shrimp are presented in Table 11. The digestibility trial contained a range of ingredients;
hence, we have provided a few other ingredients as a reference. In terms of the proximate
composition, FMA contains a higher protein and lipid content, but lower phosphorus level than
FM (Table 2). In order to confirm the results, fecal samples for basal diets and FM diet were
recollected. The results turned out to be quite similar, which indicated that the feces collection
and samples analysis methods we utilized in the digestibility study are consistent. The energy
and protein digestibility of FMA were 53.5% and 32.4%, respectively, which were significantly
lower than those of FM.
143
Apparent amino acids (AA) digestibility values for the SBM, FM, and FMA using 70:30
replacement technique offered to Pacific white shrimp are presented in Table 12. Most individual
amino acids compositions in FMA are higher than those in FM. In terms of two of the most
limiting AAs in shrimp feeds, FMA shared similar methionine and lysine levels as FM (4.99% vs
4.67% and 1.69% vs 1.61%, respectively). The AAs digestibility corresponded to the protein
digestibility. Apparent digestibility coefficients of alanine, arginine, aspartic acid, cysteine,
glutamic acid, glycine, histidine, isoleucine, leucine, lysine, methionine, phenylalanine, proline,
serine, threonine, tryptophan, tyrosine, and valine were of FMA were significantly lower than
those of FM and SBM.
4. Discussion
The nutrient composition of FMA compared to FM exhibited higher crude protein
(68.28% vs 62.78%) and lipid (13.89% vs 10.56%) contents, but lower P level (1.68% vs
3.15%). Generally, both essential and non-essential amino acids concentrations in FMA are
superior to FM. When FM is replaced with alternative protein sources, it is crucial to balance
essential nutrients especially amino acids in the diets. Proximate compositions, amino acids
profiles, and mineral contents (excluding P levels) are consistent in all the treatments of the
growth trials (Table 5 and 6). There is a decreasing trend of P level as the inclusion level of FMA
increases in the diets for trial 1 and trial 2 (Table 5) due to the comparatively lower P content in
this ingredient. All diets in trial 3 shared a similar P content as P level was balanced by adding
inorganic P in formulation (Table 6).
The nutrient digestibility of a feed ingredient is an important factor to evaluate the overall
nutritive value of the ingredient because it is related to the quantity of the nutrient absorbed by
144
the animals. In the current study, APD and AED of FMA were significantly lower than those of
SBM and FM. The comparatively lower APD of FMA translated to lower AAAD. In general,
there was a reasonable correspondence of the AAAD to APD of FMA. SBM had the highest
APD (97.03%), AED (82.56%), and ADAA (90.78 – 96.91%) among the ingredients tested in
the current study. Similar ranges of results for APD, AED, and AAAD were reported in multiple
shrimp studies (Cruz-Suarez et al., 2009; Fang et al., 2016; Liu et al., 2013; Yang et al., 2009;
Zhou et al., 2015). ADP and ADE of FM1 were 67.07% and 69.77%, respectively. Similar
results were acquired in FM2 (ADP and ADE: 71.3% and 65.78%, respectively). The analogous
results of basal diet and FM diet from the collection of two fecal samples pointed to the
consistency in the feces collection and sample analysis methods. APD of FM has been reported
to be ranged from 62.7% to 91.6% in numerous studies (Lemos et al., 2009; Liu et al., 2013;
Terrazas-Fierro et al. 2010; Yang et al., 2009). ADP of FM in the present study were in the
lower range of the results documented among those researches. The differences could be
attributed to several factors, such as different raw materials, location or processing methods used
to produce the products, and unknown factors related to different production batches.
With regards to the growth trials, significantly reduced growth was observed in the diet
contained 14.55% FMA compared to the one supplemented with 4.85% FMA. If the growth
depression resulted from the FMA inclusion levels, the diet contained highest inclusion of FMA
should also be negatively affected. However, no difference in terms of growth was detected in
the treatment contained 19.4% FMA. Given the relatively lower survival in trial 1, the growth
results may be masked. Hence, trial 2 was initiated by applying the same diets to confirm the
results. At the end of trial 2, shrimp fed with diet contained 19.4% FMA exhibited significantly
lower WG and higher FCR than those fed with diets supplemented with 4.85 and 9.7% FMA.
145
There is a clear decreasing trend when inclusion level of FMA increased to 14.55% of the diet.
Given the balanced proximate composition and amino acid profile across the treatments, the
reduced P level might be attributed to depressed growth at the high inclusion levels of FMA.
Correlation analysis outputs (Table 8) also indicated that P level in the diets positively correlated
with WG and negatively correlated with FCR in both trial 1 and trial 2, which demonstrated our
nutritional assumption from statistical standpoint.
P is an important constituent of nucleic acids and cell membranes, a major constituent of
structural components of structural tissues, and is directly involved in all energy-producing
cellular reactions (NRC, 2011). Dietary P deficiency impairs intermediary metabolism, which
results in reduced growth and increased feed conversion. P requirement of Pacific white shrimp
is affected both by P and calcium (Ca) levels as well as presence of inhibitors (Cheng et al.,
2006; Davis et al., 1993). Cheng et al. (2006) indicated diets contained 0.93% total P in the
absence of Ca were adequate for optimal growth of Pacific white shrimp. In the current study, P
levels in diets supplemented with 14.55% and 19.4% FMA are 0.82% and 0.78%, respectively,
which may suggest P limitation in these two diets. To elucidate if decreased P was the cause of
the growth depression in trial 1 and trial 2, the third trial was conducted to essentially utilize the
same diets in trial 1 and 2, but balanced for P. Results indicated that shrimp fed with 4.95%
FMA performed significantly better in terms of growth than those fed with diets contained
14.55% FMA. No clear decreasing trend of growth was detected when diets contained FMA
were compared to the reference diet (20% FM based diet). At a conclusion of the growth trials, P
levels in the diets may limit the growth when shrimp fed with diets contained 14.55% and 19.4%
FMA in trial 1 and 2. However, reasons for the improvements in growth when FMA was
supplemented at 4.95% in all trials are not able to be defined.
146
There are numerous studies looking at the potential of alternative ingredients as FM
replacement in shrimp feeds. The results varied as different ingredient and reference diets
utilized. In general, many researches documented that partial FM replacement by alternative
ingredients in shrimp feeds was applicable (Cruz-Suárez et al., 2007; Goytortúa-Bores et al.,
2006; Ju et al., 2012; Liu et al., 2012; Oujifard et al., 2012; Suárez et al., 2009; Tan et al., 2005;
Yue et al., 2012). The failure of complete FM replacement can be attributed to many factors such
as palatability problem, imbalanced essential nutrients (protein, lipid, essential amino acids, P,
and etc.), and relatively lower nutrient availability than FM. Hence, choosing suitable alternative
ingredients and considering shifts in essential nutrients in the substitution strategy would be the
key factors to the success of complete FM replacement. In proper balanced shrimp diets,
complete FM can be replaced by suitable alternative ingredients which were reported by multiple
researchers (Amaya et al., 2007a;b; Bauer et al., 2012; Browdy et al., 2006; Roy et al., 2009;
Samocha et al., 2004; Sookying and Davis, 2011).
In the present study, lipid content of whole shrimp body was significantly decreased in
the diet contained 19.4% FMA compared to the one supplemented with 4.95% FMA in trial 2,
which may due to the comparatively lower energy availability in FMA than FM. Whereas the
protein content of whole shrimp body was dramatically improved in the diet supplemented with
19.4% FMA in contrast with the ones incorporated with 0 and 4.95% FMA, which may be a
result of reduced lipid content of shrimp as no significant difference were observed in moisture,
crude fiber, and ash content of shrimp body. Similarly, Hernández et al. (2008) indicated that
protein content of shrimp body was significantly enhanced while lipid level was significantly
reduced when porcine meat meal was incorporated in the diet to replace FM. On the contrary, no
significant differences were detected in the protein and lipid contents of shrimp body in trial 3
147
when shrimp were fed with the essentially same diets except for different P levels as in trial 2.
As energy digestibility of FMA was not dramatically lower than FM, its effect on the lipid
content may be marginal. Accordingly, no significant differences were detected in protein and
lipid contents of shrimp body in FM replacement studies (Oujifard et al., 2012; Ju et al., 2012;
Yue et al., 2012).
Although there is a decreasing trend of P content in the diets, no significant difference
was observed in the P level in shrimp body in trial 2. Similarly, Ju et al. (2012) documented that
P level of shrimp body was not affected when there was a decreasing trend of P content in the
diets using a defatted microalgae meal to replace FM. Hepatopancreas and carapace are two
good indicator tissues of the mineral status of shrimp (Davis et al., 1993). As the concentrations
of these two tissues were diluted in the whole body samples, the reflection of P status in shrimp
might be masked. In trial 3, no significant difference was detected in the P content of shrimp
body as the diets were balanced for P level.
Nutrient retention was determined by a number of factors including dietary nutrient
levels, feed intake, final weight and initial weight of animals as well as the final and initial
nutrient content of animals (Halver and Hardy, 2002). In trial 2, shrimp fed diets containing 4.85
and 9.7% FMA exhibited improved PR in contrast with those offered the diet containing 19.4%
FMA. No differences were detected in dietary protein levels, feed offered to the shrimp, and
initial weight of shrimp. Although protein content of whole shrimp body was significantly
improved in the diet contained 19.4% FMA, its effect cannot counteract with the significantly
reduced final weight of shrimp in the same treatment, which would be the primary cause of
reduced PR. In trial 3, results demonstrated that PR in the treatment supplemented with 4.95%
FMA was significantly improved, resulting by the significantly enhanced final mean weight.
148
Similarly, Hernández et al. (2008) reported PR was significantly reduced when shrimp fed with
diets supplemented with high levels of porcine meat meal to replace FM, resulting from the
significantly depressed final weight even though protein content of shrimp body was enhanced.
In both trial 2 and trial 3, no significant differences were detected in the P retention.
5. Conclusion
Under the conditions of this work, FMA can replace FM up to 20% in practical shrimp
diets supplemented with inorganic P without compromising the growth of shrimp. P limitation is
likely the reason for growth depression in the treatment devoid of FM when diets were not
balanced for P. The improvement of growth when FMA was incorporated at 4.95% across three
trials was not able to be defined. Given the good growth across the range of inclusion without
any indication of a growth depression, the digestibility of the protein of FMA would be similar to
that of the FM for which it was substituted. The low nutrient digestibility of FMA may due to an
atypical response or the product simply does not work with the testing technique.
149
References
Amaya, E., Davis, D.A. & Rouse, D.B. (2007a) Replacement of fish meal in practical diets for
the Pacific white shrimp Litopenaeus vannamei reared under pond conditions.
Aquaculture 262, 393-401.
Amaya, E., Davis, D.A. & Rouse, D.B. (2007b) Alternative diets for the Pacific white shrimp
Litopenaeus vannamei. Aquaculture 262, 419-425.
Bauer, W., Prentice-Hernandez, C., Tesser, M.B., Wasielesky, W. & Poersch, L.H. (2012)
Substitution of fishmeal with microbial floc meal and soy protein concentrate in diets for
the pacific white shrimp Litopenaeus vannamei. Aquaculture 342, 112-116.
Browdy, C., Seaborn, G., Atwood, H., Davis, D.A., Bullis, R.A., Samocha, T.M., Wirth, E. &
Leffler, J.W. (2006) Comparison of pond production efficiency, fatty acid profiles, and
contaminants in Litopenaeus vannamei fed organic plant-based and fish-meal-based diets.
J. World Aquac. Soc. 37, 437-451.
Bureau, D.P. & Hua, K. (2006) Letter to the editor of Aquaculture. Aquaculture 252, 103-105.
Cheng, K.M., Hu, C.Q., Liu, Y.N., Zheng, S.X. & Qi, X.J. (2006) Effects of dietary calcium,
phosphorus and calcium/phosphorus ratio on the growth and tissue mineralization of
Litopenaeus vannamei reared in low-salinity water. Aquaculture 251, 472-483.
Cho, C.Y., Slinger, S.J. & Bayley, H.S. (1982) Bioenergetics of salmonid fishes: energy intake,
expenditure and productivity. Comp. Biochem. Phys. B 73, 25-41.
Cruz-Suárez, L.E., Nieto-López, M., Guajardo-Barbosa, C., Tapia-Salazar, M., Scholz, U. &
Ricque-Marie, D. (2007) Replacement of fish meal with poultry by-product meal in
practical diets for Litopenaeus vannamei, and digestibility of the tested ingredients and
diets. Aquaculture 272, 466-476.

150
Cruz-Suárez, L.E., Tapia-Salazar, M., Villarreal-Cavazos, D., Beltran-Rocha, J., Nieto-López,
M.G., Lemme, A. & Ricque-Marie, D. (2009) Apparent dry matter, energy, protein and
amino acid digestibility of four soybean ingredients in white shrimp (Litopenaeus
vannamei) juveniles. Aquaculture 292, 87-94.
Davis, D.A., Lawrence, A.L. & Gatlin, D.M. (1993) Response of Penaeus vannamei to dietary
calcium, phosphorus and calcium: phosphorus ratio. J. World Aquac. Soc. 24, 504-515.
Davis, D.A., Samocha, T.M., Bullis, R.A., Patnaik, S., Browdy, C.L., Stokes, A. & Atwood, H.
(2004) Practical diets for Litopenaeus vannamei (Boone. 1931): Working towards
organic and/or all plant production diets. Pages 271-280. In: L.E. Cruz-Suárez, D.
Ricque-Marie, M.G. Nieto-López, M. Tapia-Salazar, D.A., Villarreal-Cavazos, A.C.
Puello-Cruz and A. García-Ortega, editors. Avances en Nutrición Acuícola Volumen VIII.
Memorias del VIII Simposio Internacional de Nutrición Acuícola. Universidad
Autónoma de Nuevo León. Monterrey, Nuevo León México.
Davis, D.A. & Sookying, D. (2009) Strategies for reducing and/or replacing fishmeal in
production diets for the Pacific white shrimp, Litopenaeus vannamei. The rising tide 108-
114.
Fang, X., Yu, D., Buentello, A., Zeng, P. & Davis, D.A. (2016) Evaluation of new non-
genetically modified soybean varieties as ingredients in practical diets for (Litopenaeus
vannamei). Aquaculture 451, 178-185.
Goytortúa-Bores, E., Civera-Cerecedo, R., Rocha-Meza, S. & Green-Yee, A. (2006) Partial
replacement of red crab Pleuroncodes planipes meal for fish meal in practical diets for
the white shrimp Litopenaeus vannamei. Effects on growth and in vivo digestibility.
Aquaculture 256, 414-422.
151
Halver, J.E., Hardy, R.W., 2002. Fish nutrition. Academic press, San Diego, CA, USA.
Hernández, C., Olvera-Novoa, M.A., Aguilar-Vejar, K., González-Rodríguez, B. & de la Parra,
I.A. (2008) Partial replacement of fish meal by porcine meat meal in practical diets for
Pacific white shrimp Litopenaeus vannamei. Aquaculture 277, 244-250.
Ju, Z. Y., Deng, D. F. & Dominy, W. (2012) A defatted microalgae Haematococcus pluvialis
meal as a protein ingredient to partially replace fishmeal in diets of Pacific white shrimp
Litopenaeus vannamei, Boone, 1931. Aquaculture 354, 50-55.
Lemos, D., Lawrence, A.L. & Siccardi, A.J. (2009) Prediction of apparent protein digestibility of
ingredients and diets by in vitro pH-stat degree of protein hydrolysis with species-specific
enzymes for juvenile Pacific white shrimp (Litopenaeus vannamei). Aquaculture 295, 89-
98.
Liu, X. H., Ye, J. D., Wang, K., Kong, J. H., Yang, W. & Zhou, L. (2012) Partial replacement of
fish meal with peanut meal in practical diets for the Pacific white shrimp, Litopenaeus
vannamei. Aquac. Res. 43, 745-755.
Liu, X.H., Ye, J.D., Kong, J.H., Wang, K. & Wang, A.L. (2013) Apparent digestibility of 12
protein-origin ingredients for Pacific white shrimp (Litopenaeus vannamei). N. Am. J.
Aquac. 75, 90-98.
Ma, T. & Zuazaga, G. (1942) Micro-Kjeldahl determination of nitrogen. A new indicator and an
improved rapid method. Inc. Eng. Chem. 14, 280-282.
McGinnis, A.J. & Kasting, R. (1964) Chromic oxide indicator method for measuring food
utilization in a plant-feeding insect. Science 144, 1464-1465.
NRC, (2011) Nutrient requirements of fish and shrimp. National academies press, Washington
D.C.
152
Oujifard, A., Seyfabadi, J., Kenari, A.A. & Rezaei, M. (2012) Fish meal replacement with rice
protein concentrate in a practical diet for the Pacific white shrimp, Litopenaeus vannamei
Boone, 1931. Aquac. Int. 20, 117-129.
Roy, L.A., Bordinhon, A., Sookying, D., Davis, D.A., Brown, T.W. & Whitis, G.N. (2009)
Demonstration of alternative feeds for the Pacific white shrimp, Litopenaeus vannamei,
reared in low salinity waters of west Alabama. Aquac. Res. 40, 496-503.
Samocha, T.M., Davis, D.A., Saoud, I.P. & DeBault, K. (2004) Substitution of fish meal by co-
extruded soybean poultry by-product meal in practical diets for the Pacific white shrimp,
Litopenaeus vannamei. Aquaculture 231, 197-203.
Sookying, D. & Davis, D.A. (2011) Pond production of Pacific white shrimp Litopenaeus
vannamei fed high levels of soybean meal in various combinations. Aquaculture 319,
141-149.
Sororzano, L. (1969) Determination of ammonia in natural waters by the phenolhypochlorite
method. Limnol. Oceanogr. 14, 799-801.
Spotte, S. (1979) Fish and invertebrate culture: water management in closed systems, 2nd
edition. Wiley, New York.
Suárez, J.A., Gaxiola, G., Mendoza, R., Cadavid, S., Garcia, G., Alanis, G., Suárez, A., Faillace,
J. & Cuzon, G. (2009) Substitution of fish meal with plant protein sources and energy
budget for white shrimp Litopenaeus vannamei (Boone, 1931). Aquaculture 289, 118-123.
Swick, R.A., Akiyama, D.M., Boonyaratpalin, M. & Creswell, D.C. (1995) Use of soybean meal
and synthetic methionine in shrimp feed. American Soybean Association. Technical
Bulletin.
153
Tan, B., Mai, K., Zheng, S., Zhou, Q., Liu, L. & Yu, Y. (2005) Replacement of fish meal by
meat and bone meal in practical diets for the white shrimp Litopenaeus vannamai
(Boone). Aquac. Res. 36, 439-444.
Terrazas-Fierro, M., Civera-Cerecedo, R., Ibarra-Martínez, L., Goytortúa-Bores, E., Herrera-
Andrade, M. & Reyes-Becerra, A. (2010) Apparent digestibility of dry matter, protein,
and essential amino acid in marine feedstuffs for juvenile whiteleg shrimp (Litopenaeus
vannamei). Aquaculture 308, 166-173.
Yang, Q., Zhou, X., Zhou, Q., Tan, B., Chi, S. & Dong, X. (2009) Apparent digestibility of
selected feed ingredients for white shrimp (Litopenaeus vannamei) Boone. Aquac. Res.
41, 78-86.
Yue, Y.R., Liu, Y.J., Tian, L.X., Gan, L., Yang, H.J. & Liang, G.Y. (2012) Effects of replacing
fish meal with soybean meal and peanut meal on growth, feed utilization and
haemolymph indexes for juvenile white shrimp Litopenaeus vannamei, Boone. Aquac.
Res. 43, 1687-1696.
Zhou, Y.G., Davis, D.A. & Buentello, A. (2015) Use of new soybean varieties in practical diets
for the Pacific white shrimp (Litopenaeus vannamei). Aquac. Nutr. 21, 635-643.
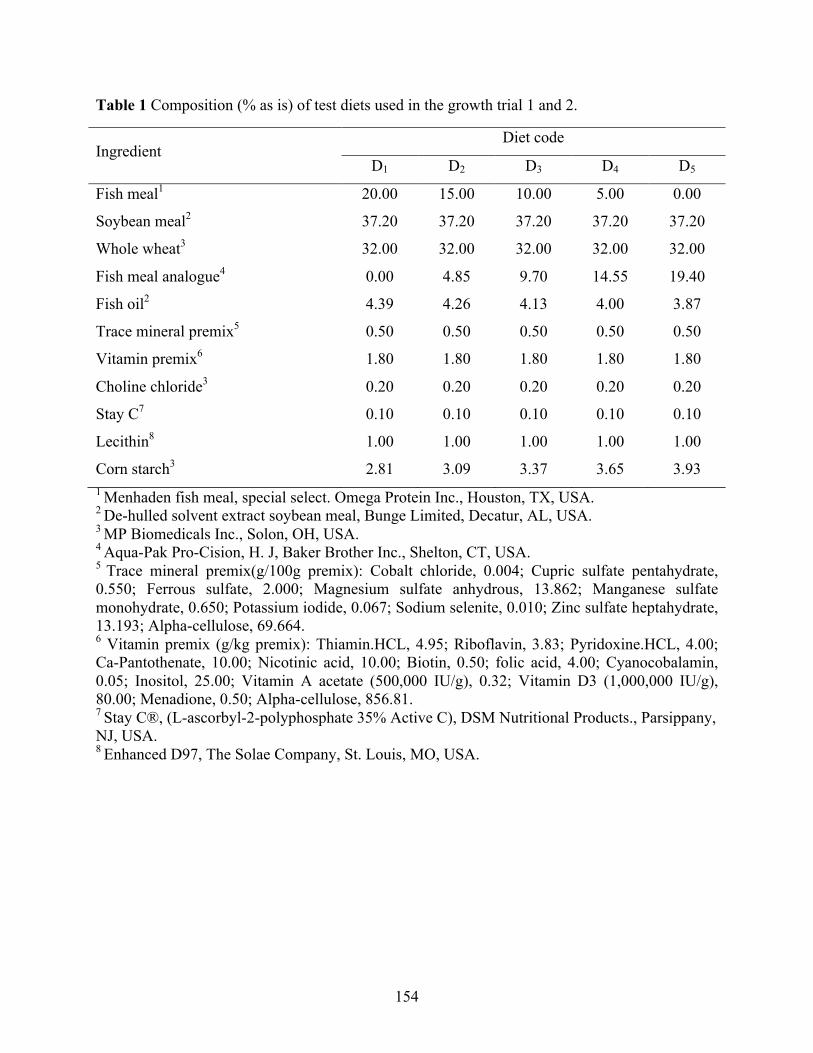
154
Table 1 Composition (% as is) of test diets used in the growth trial 1 and 2.
Ingredient Diet code
D1 D2 D3 D4 D5
Fish meal1 20.00 15.00 10.00 5.00 0.00
Soybean meal2 37.20 37.20 37.20 37.20 37.20
Whole wheat3 32.00 32.00 32.00 32.00 32.00
Fish meal analogue4 0.00 4.85 9.70 14.55 19.40
Fish oil2 4.39 4.26 4.13 4.00 3.87
Trace mineral premix5 0.50 0.50 0.50 0.50 0.50
Vitamin premix6 1.80 1.80 1.80 1.80 1.80
Choline chloride3 0.20 0.20 0.20 0.20 0.20
Stay C7 0.10 0.10 0.10 0.10 0.10
Lecithin8 1.00 1.00 1.00 1.00 1.00
Corn starch3 2.81 3.09 3.37 3.65 3.93 1 Menhaden fish meal, special select. Omega Protein Inc., Houston, TX, USA. 2 De-hulled solvent extract soybean meal, Bunge Limited, Decatur, AL, USA. 3 MP Biomedicals Inc., Solon, OH, USA. 4 Aqua-Pak Pro-Cision, H. J, Baker Brother Inc., Shelton, CT, USA. 5 Trace mineral premix(g/100g premix): Cobalt chloride, 0.004; Cupric sulfate pentahydrate, 0.550; Ferrous sulfate, 2.000; Magnesium sulfate anhydrous, 13.862; Manganese sulfate monohydrate, 0.650; Potassium iodide, 0.067; Sodium selenite, 0.010; Zinc sulfate heptahydrate, 13.193; Alpha-cellulose, 69.664. 6 Vitamin premix (g/kg premix): Thiamin.HCL, 4.95; Riboflavin, 3.83; Pyridoxine.HCL, 4.00; Ca-Pantothenate, 10.00; Nicotinic acid, 10.00; Biotin, 0.50; folic acid, 4.00; Cyanocobalamin, 0.05; Inositol, 25.00; Vitamin A acetate (500,000 IU/g), 0.32; Vitamin D3 (1,000,000 IU/g), 80.00; Menadione, 0.50; Alpha-cellulose, 856.81. 7 Stay C®, (L-ascorbyl-2-polyphosphate 35% Active C), DSM Nutritional Products., Parsippany, NJ, USA. 8 Enhanced D97, The Solae Company, St. Louis, MO, USA.
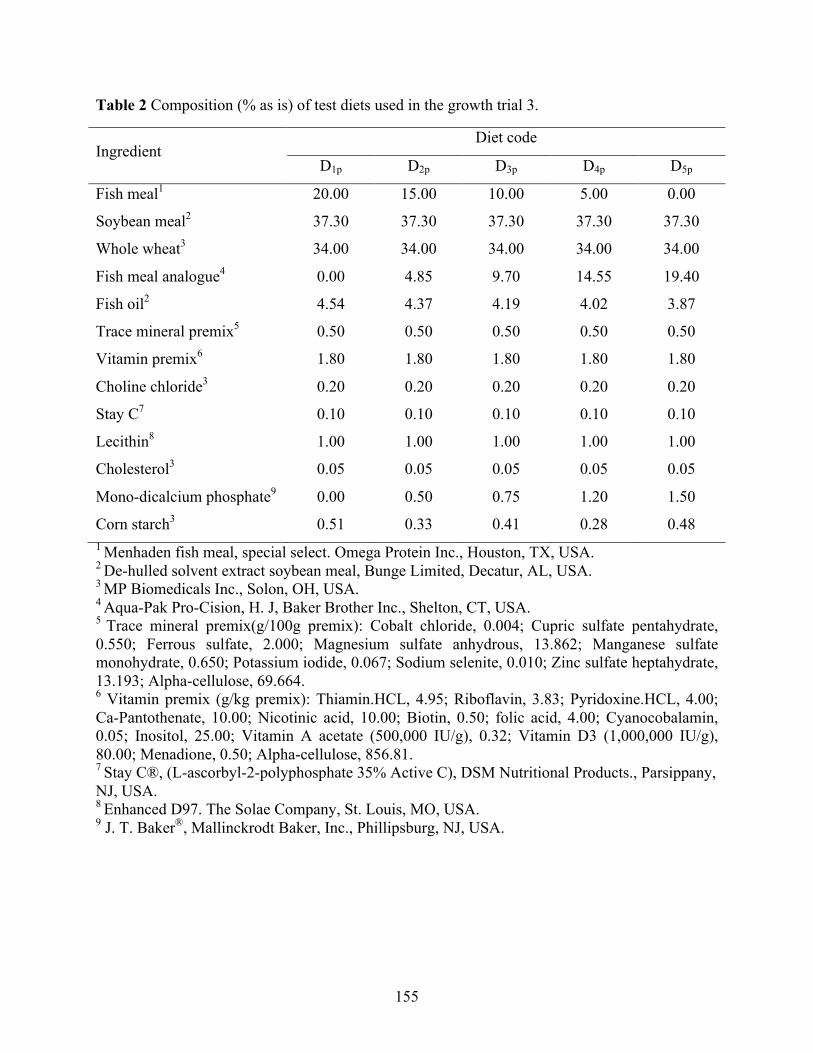
155
Table 2 Composition (% as is) of test diets used in the growth trial 3.
Ingredient Diet code
D1p D2p D3p D4p D5p
Fish meal1 20.00 15.00 10.00 5.00 0.00
Soybean meal2 37.30 37.30 37.30 37.30 37.30
Whole wheat3 34.00 34.00 34.00 34.00 34.00
Fish meal analogue4 0.00 4.85 9.70 14.55 19.40
Fish oil2 4.54 4.37 4.19 4.02 3.87
Trace mineral premix5 0.50 0.50 0.50 0.50 0.50
Vitamin premix6 1.80 1.80 1.80 1.80 1.80
Choline chloride3 0.20 0.20 0.20 0.20 0.20
Stay C7 0.10 0.10 0.10 0.10 0.10
Lecithin8 1.00 1.00 1.00 1.00 1.00
Cholesterol3 0.05 0.05 0.05 0.05 0.05
Mono-dicalcium phosphate9 0.00 0.50 0.75 1.20 1.50
Corn starch3 0.51 0.33 0.41 0.28 0.48 1 Menhaden fish meal, special select. Omega Protein Inc., Houston, TX, USA. 2 De-hulled solvent extract soybean meal, Bunge Limited, Decatur, AL, USA. 3 MP Biomedicals Inc., Solon, OH, USA. 4 Aqua-Pak Pro-Cision, H. J, Baker Brother Inc., Shelton, CT, USA. 5 Trace mineral premix(g/100g premix): Cobalt chloride, 0.004; Cupric sulfate pentahydrate, 0.550; Ferrous sulfate, 2.000; Magnesium sulfate anhydrous, 13.862; Manganese sulfate monohydrate, 0.650; Potassium iodide, 0.067; Sodium selenite, 0.010; Zinc sulfate heptahydrate, 13.193; Alpha-cellulose, 69.664. 6 Vitamin premix (g/kg premix): Thiamin.HCL, 4.95; Riboflavin, 3.83; Pyridoxine.HCL, 4.00; Ca-Pantothenate, 10.00; Nicotinic acid, 10.00; Biotin, 0.50; folic acid, 4.00; Cyanocobalamin, 0.05; Inositol, 25.00; Vitamin A acetate (500,000 IU/g), 0.32; Vitamin D3 (1,000,000 IU/g), 80.00; Menadione, 0.50; Alpha-cellulose, 856.81. 7 Stay C®, (L-ascorbyl-2-polyphosphate 35% Active C), DSM Nutritional Products., Parsippany, NJ, USA. 8 Enhanced D97. The Solae Company, St. Louis, MO, USA. 9 J. T. Baker®, Mallinckrodt Baker, Inc., Phillipsburg, NJ, USA.
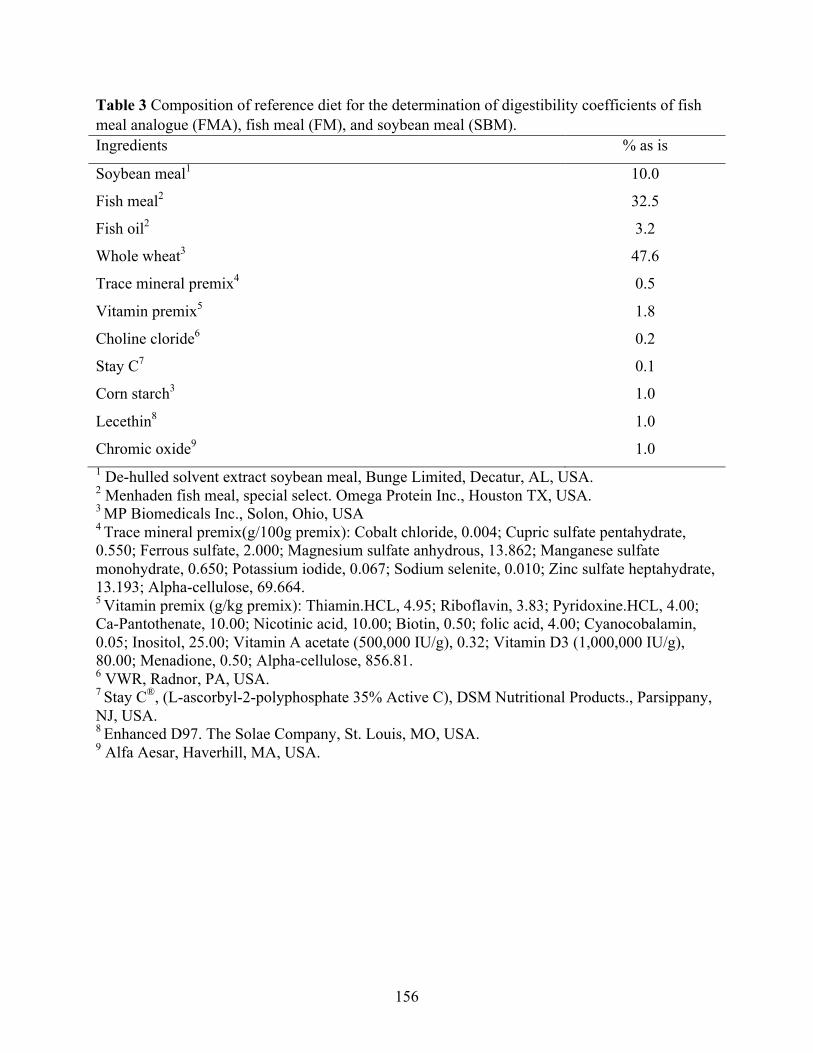
156
Table 3 Composition of reference diet for the determination of digestibility coefficients of fish meal analogue (FMA), fish meal (FM), and soybean meal (SBM). Ingredients % as is
Soybean meal1 10.0
Fish meal2 32.5
Fish oil2 3.2
Whole wheat3 47.6
Trace mineral premix4 0.5
Vitamin premix5 1.8
Choline cloride6 0.2
Stay C7 0.1
Corn starch3 1.0
Lecethin8 1.0
Chromic oxide9 1.0 1 De-hulled solvent extract soybean meal, Bunge Limited, Decatur, AL, USA. 2 Menhaden fish meal, special select. Omega Protein Inc., Houston TX, USA. 3 MP Biomedicals Inc., Solon, Ohio, USA 4 Trace mineral premix(g/100g premix): Cobalt chloride, 0.004; Cupric sulfate pentahydrate, 0.550; Ferrous sulfate, 2.000; Magnesium sulfate anhydrous, 13.862; Manganese sulfate monohydrate, 0.650; Potassium iodide, 0.067; Sodium selenite, 0.010; Zinc sulfate heptahydrate, 13.193; Alpha-cellulose, 69.664. 5 Vitamin premix (g/kg premix): Thiamin.HCL, 4.95; Riboflavin, 3.83; Pyridoxine.HCL, 4.00; Ca-Pantothenate, 10.00; Nicotinic acid, 10.00; Biotin, 0.50; folic acid, 4.00; Cyanocobalamin, 0.05; Inositol, 25.00; Vitamin A acetate (500,000 IU/g), 0.32; Vitamin D3 (1,000,000 IU/g), 80.00; Menadione, 0.50; Alpha-cellulose, 856.81. 6 VWR, Radnor, PA, USA. 7 Stay C®, (L-ascorbyl-2-polyphosphate 35% Active C), DSM Nutritional Products., Parsippany, NJ, USA. 8 Enhanced D97. The Solae Company, St. Louis, MO, USA. 9 Alfa Aesar, Haverhill, MA, USA.
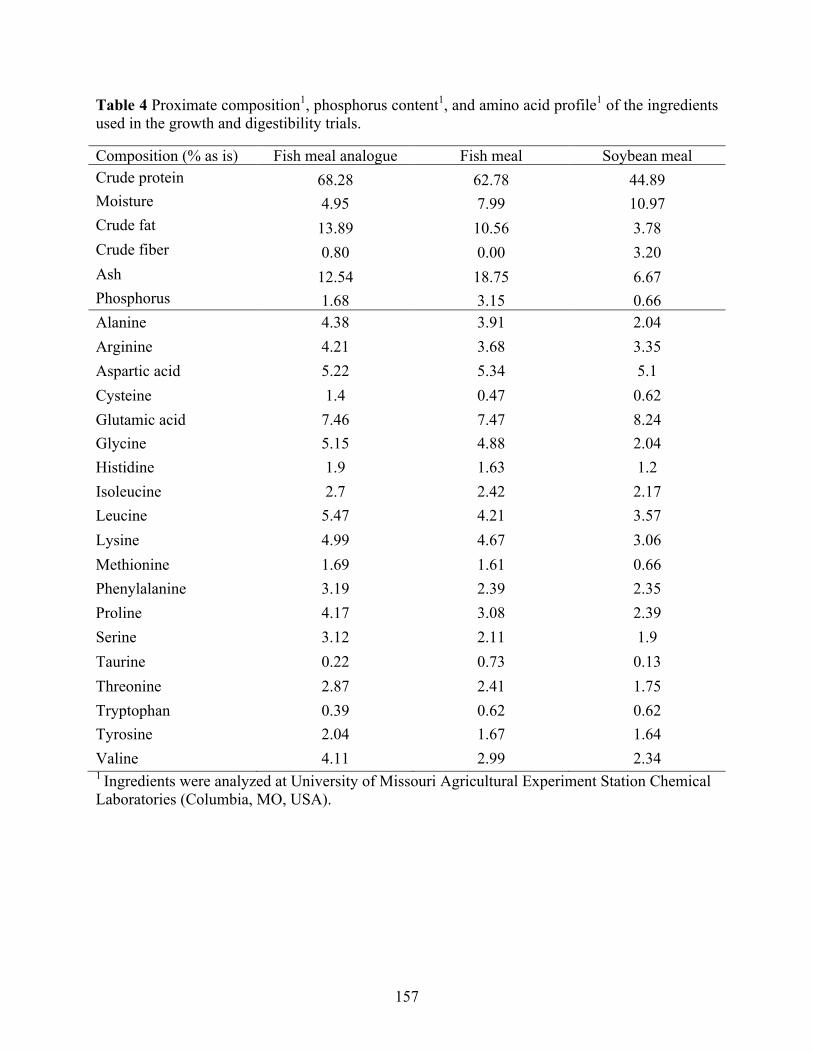
157
Table 4 Proximate composition1, phosphorus content1, and amino acid profile1 of the ingredients used in the growth and digestibility trials.
Composition (% as is) Fish meal analogue Fish meal Soybean meal Crude protein 68.28 62.78 44.89 Moisture 4.95 7.99 10.97 Crude fat 13.89 10.56 3.78 Crude fiber 0.80 0.00 3.20 Ash 12.54 18.75 6.67 Phosphorus 1.68 3.15 0.66 Alanine 4.38 3.91 2.04 Arginine 4.21 3.68 3.35 Aspartic acid 5.22 5.34 5.1 Cysteine 1.4 0.47 0.62 Glutamic acid 7.46 7.47 8.24 Glycine 5.15 4.88 2.04 Histidine 1.9 1.63 1.2 Isoleucine 2.7 2.42 2.17 Leucine 5.47 4.21 3.57 Lysine 4.99 4.67 3.06 Methionine 1.69 1.61 0.66 Phenylalanine 3.19 2.39 2.35 Proline 4.17 3.08 2.39 Serine 3.12 2.11 1.9 Taurine 0.22 0.73 0.13 Threonine 2.87 2.41 1.75 Tryptophan 0.39 0.62 0.62 Tyrosine 2.04 1.67 1.64 Valine 4.11 2.99 2.34 1 Ingredients were analyzed at University of Missouri Agricultural Experiment Station Chemical Laboratories (Columbia, MO, USA).
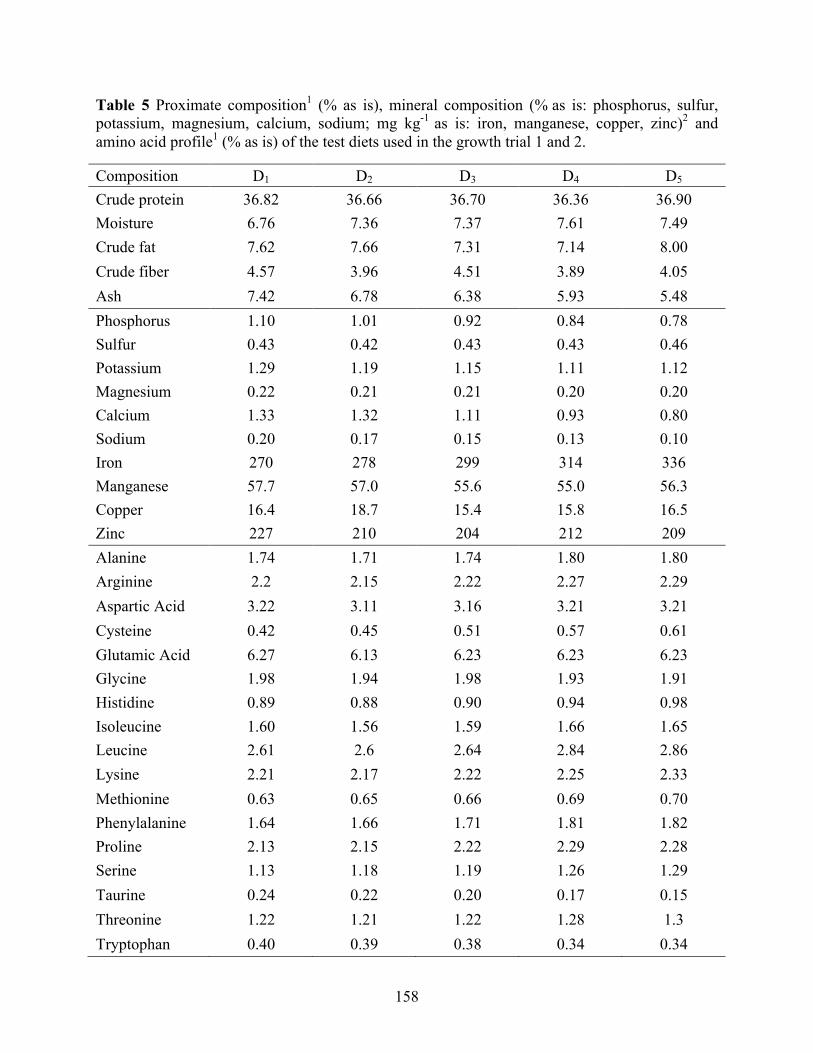
158
Table 5 Proximate composition1 (% as is), mineral composition (% as is: phosphorus, sulfur, potassium, magnesium, calcium, sodium; mg kg-1 as is: iron, manganese, copper, zinc)2 and amino acid profile1 (% as is) of the test diets used in the growth trial 1 and 2.
Composition D1 D2 D3 D4 D5 Crude protein 36.82 36.66 36.70 36.36 36.90 Moisture 6.76 7.36 7.37 7.61 7.49 Crude fat 7.62 7.66 7.31 7.14 8.00 Crude fiber 4.57 3.96 4.51 3.89 4.05 Ash 7.42 6.78 6.38 5.93 5.48 Phosphorus 1.10 1.01 0.92 0.84 0.78 Sulfur 0.43 0.42 0.43 0.43 0.46 Potassium 1.29 1.19 1.15 1.11 1.12 Magnesium 0.22 0.21 0.21 0.20 0.20 Calcium 1.33 1.32 1.11 0.93 0.80 Sodium 0.20 0.17 0.15 0.13 0.10 Iron 270 278 299 314 336 Manganese 57.7 57.0 55.6 55.0 56.3 Copper 16.4 18.7 15.4 15.8 16.5 Zinc 227 210 204 212 209 Alanine 1.74 1.71 1.74 1.80 1.80 Arginine 2.2 2.15 2.22 2.27 2.29 Aspartic Acid 3.22 3.11 3.16 3.21 3.21 Cysteine 0.42 0.45 0.51 0.57 0.61 Glutamic Acid 6.27 6.13 6.23 6.23 6.23 Glycine 1.98 1.94 1.98 1.93 1.91 Histidine 0.89 0.88 0.90 0.94 0.98 Isoleucine 1.60 1.56 1.59 1.66 1.65 Leucine 2.61 2.6 2.64 2.84 2.86 Lysine 2.21 2.17 2.22 2.25 2.33 Methionine 0.63 0.65 0.66 0.69 0.70 Phenylalanine 1.64 1.66 1.71 1.81 1.82 Proline 2.13 2.15 2.22 2.29 2.28 Serine 1.13 1.18 1.19 1.26 1.29 Taurine 0.24 0.22 0.20 0.17 0.15 Threonine 1.22 1.21 1.22 1.28 1.3 Tryptophan 0.40 0.39 0.38 0.34 0.34
159
Tyrosine 1.08 1.09 1.13 1.17 1.18 Valine 1.78 1.78 1.84 1.99 2.00 1 Proximate composition and amino acid profiles of test diets were analyzed at University of Missouri Agricultural Experiment Station Chemical Laboratories (Columbia, MO, USA). 2 Mineral composition was tested at Midwest Laboratories (Omaha, NE, USA).
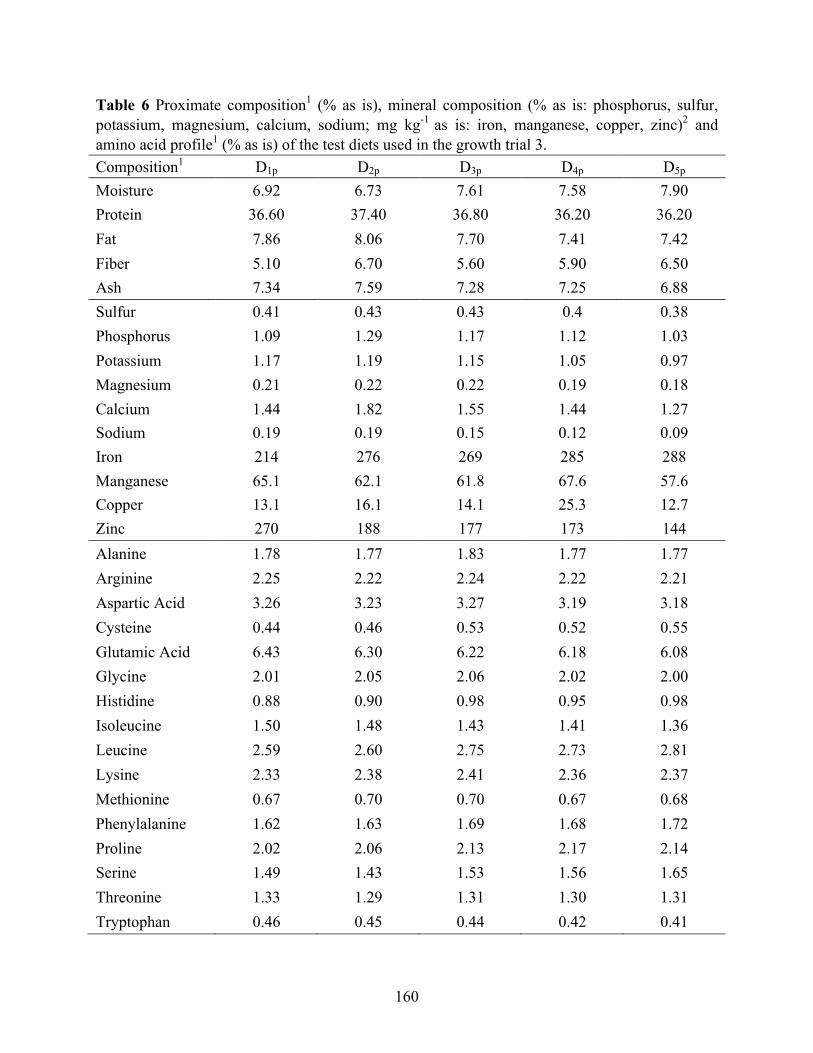
160
Table 6 Proximate composition1 (% as is), mineral composition (% as is: phosphorus, sulfur, potassium, magnesium, calcium, sodium; mg kg-1 as is: iron, manganese, copper, zinc)2 and amino acid profile1 (% as is) of the test diets used in the growth trial 3. Composition1 D1p D2p D3p D4p D5p Moisture 6.92 6.73 7.61 7.58 7.90 Protein 36.60 37.40 36.80 36.20 36.20 Fat 7.86 8.06 7.70 7.41 7.42 Fiber 5.10 6.70 5.60 5.90 6.50 Ash 7.34 7.59 7.28 7.25 6.88 Sulfur 0.41 0.43 0.43 0.4 0.38 Phosphorus 1.09 1.29 1.17 1.12 1.03 Potassium 1.17 1.19 1.15 1.05 0.97 Magnesium 0.21 0.22 0.22 0.19 0.18 Calcium 1.44 1.82 1.55 1.44 1.27 Sodium 0.19 0.19 0.15 0.12 0.09 Iron 214 276 269 285 288 Manganese 65.1 62.1 61.8 67.6 57.6 Copper 13.1 16.1 14.1 25.3 12.7 Zinc 270 188 177 173 144 Alanine 1.78 1.77 1.83 1.77 1.77 Arginine 2.25 2.22 2.24 2.22 2.21 Aspartic Acid 3.26 3.23 3.27 3.19 3.18 Cysteine 0.44 0.46 0.53 0.52 0.55 Glutamic Acid 6.43 6.30 6.22 6.18 6.08 Glycine 2.01 2.05 2.06 2.02 2.00 Histidine 0.88 0.90 0.98 0.95 0.98 Isoleucine 1.50 1.48 1.43 1.41 1.36 Leucine 2.59 2.60 2.75 2.73 2.81 Lysine 2.33 2.38 2.41 2.36 2.37 Methionine 0.67 0.70 0.70 0.67 0.68 Phenylalanine 1.62 1.63 1.69 1.68 1.72 Proline 2.02 2.06 2.13 2.17 2.14 Serine 1.49 1.43 1.53 1.56 1.65 Threonine 1.33 1.29 1.31 1.30 1.31 Tryptophan 0.46 0.45 0.44 0.42 0.41
161
Tyrosine 1.12 1.09 1.09 1.07 1.06 Valine 1.74 1.80 1.93 1.96 1.99 1 Amino acid profiles of test diets were analyzed at University of Missouri Agricultural Experiment Station Chemical Laboratories (Columbia, MO, USA). 2 Proximate composition and mineral content were tested at Midwest Laboratories (Omaha, NE, USA).
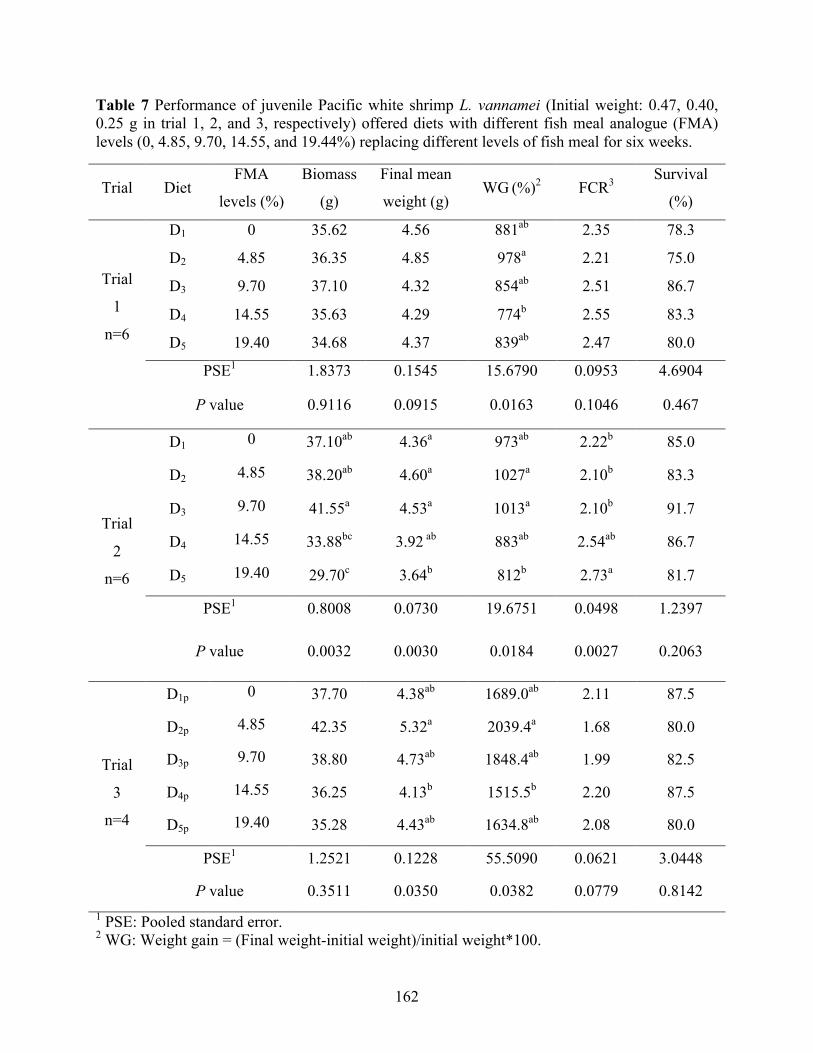
162
Table 7 Performance of juvenile Pacific white shrimp L. vannamei (Initial weight: 0.47, 0.40, 0.25 g in trial 1, 2, and 3, respectively) offered diets with different fish meal analogue (FMA) levels (0, 4.85, 9.70, 14.55, and 19.44%) replacing different levels of fish meal for six weeks.
Trial Diet FMA
levels (%)
Biomass
(g)
Final mean
weight (g) WG (%)2 FCR3 Survival
(%)
Trial
1
n=6
D1 0 35.62 4.56 881ab 2.35 78.3
D2 4.85 36.35 4.85 978a 2.21 75.0
D3 9.70 37.10 4.32 854ab 2.51 86.7
D4 14.55 35.63 4.29 774b 2.55 83.3
D5 19.40 34.68 4.37 839ab 2.47 80.0
PSE1 1.8373 0.1545 15.6790 0.0953 4.6904
P value 0.9116 0.0915 0.0163 0.1046 0.467
Trial
2
n=6
D1 0 37.10ab 4.36a 973ab 2.22b 85.0
D2 4.85 38.20ab 4.60a 1027a 2.10b 83.3
D3 9.70 41.55a 4.53a 1013a 2.10b 91.7
D4 14.55 33.88bc 3.92 ab 883ab 2.54ab 86.7
D5 19.40 29.70c 3.64b 812b 2.73a 81.7
PSE1 0.8008 0.0730 19.6751 0.0498 1.2397
P value 0.0032 0.0030 0.0184 0.0027 0.2063
Trial
3
n=4
D1p 0 37.70 4.38ab 1689.0ab 2.11 87.5
D2p 4.85 42.35 5.32a 2039.4a 1.68 80.0
D3p 9.70 38.80 4.73ab 1848.4ab 1.99 82.5
D4p 14.55 36.25 4.13b 1515.5b 2.20 87.5
D5p 19.40 35.28 4.43ab 1634.8ab 2.08 80.0
PSE1 1.2521 0.1228 55.5090 0.0621 3.0448
P value 0.3511 0.0350 0.0382 0.0779 0.8142 1 PSE: Pooled standard error. 2 WG: Weight gain = (Final weight-initial weight)/initial weight*100.
163
3 FCR: Feed conversion ratio = Feed offered / (Final weight - Initial weight). Values within a column with different superscripts are significantly different based on Tukey’s multiple range test.

164
Table 8 Pearson correlation coefficients of final biomass, final mean weight, weight gain (WG), feed conversion ratio (FCR), and survival in trial 1 and trial 2 with phosphorus levels of the diets. The first line of each cell is the value of correlation coefficient and the second line of each cell is P-value.
Trial Final
biomass
Final mean
weight WG FCR Survival
Trial 1 Phosphorus 0.0758 0.3393 0.3840 -0.3481 -0.1627
0.6905 0.0666 0.0362 0.0594 0.3904
Trial 2 Phosphorus 0.4220 0.5251 0.4662 -0.5335 0.0343
0.0202 0.0029 0.0094 0.0024 0.8571
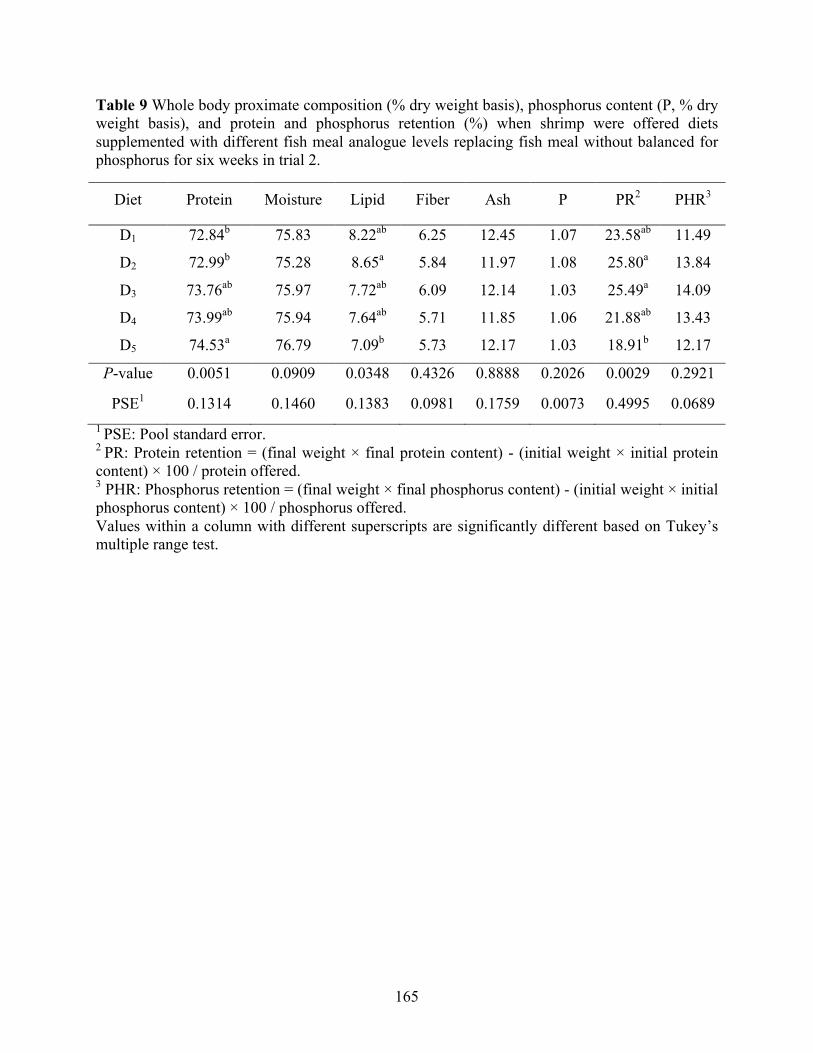
165
Table 9 Whole body proximate composition (% dry weight basis), phosphorus content (P, % dry weight basis), and protein and phosphorus retention (%) when shrimp were offered diets supplemented with different fish meal analogue levels replacing fish meal without balanced for phosphorus for six weeks in trial 2.
Diet Protein Moisture Lipid Fiber Ash P PR2 PHR3
D1 72.84b 75.83 8.22ab 6.25 12.45 1.07 23.58ab 11.49
D2 72.99b 75.28 8.65a 5.84 11.97 1.08 25.80a 13.84
D3 73.76ab 75.97 7.72ab 6.09 12.14 1.03 25.49a 14.09
D4 73.99ab 75.94 7.64ab 5.71 11.85 1.06 21.88ab 13.43
D5 74.53a 76.79 7.09b 5.73 12.17 1.03 18.91b 12.17
P-value 0.0051 0.0909 0.0348 0.4326 0.8888 0.2026 0.0029 0.2921
PSE1 0.1314 0.1460 0.1383 0.0981 0.1759 0.0073 0.4995 0.0689 1 PSE: Pool standard error. 2 PR: Protein retention = (final weight × final protein content) - (initial weight × initial protein content) × 100 / protein offered. 3 PHR: Phosphorus retention = (final weight × final phosphorus content) - (initial weight × initial phosphorus content) × 100 / phosphorus offered. Values within a column with different superscripts are significantly different based on Tukey’s multiple range test.
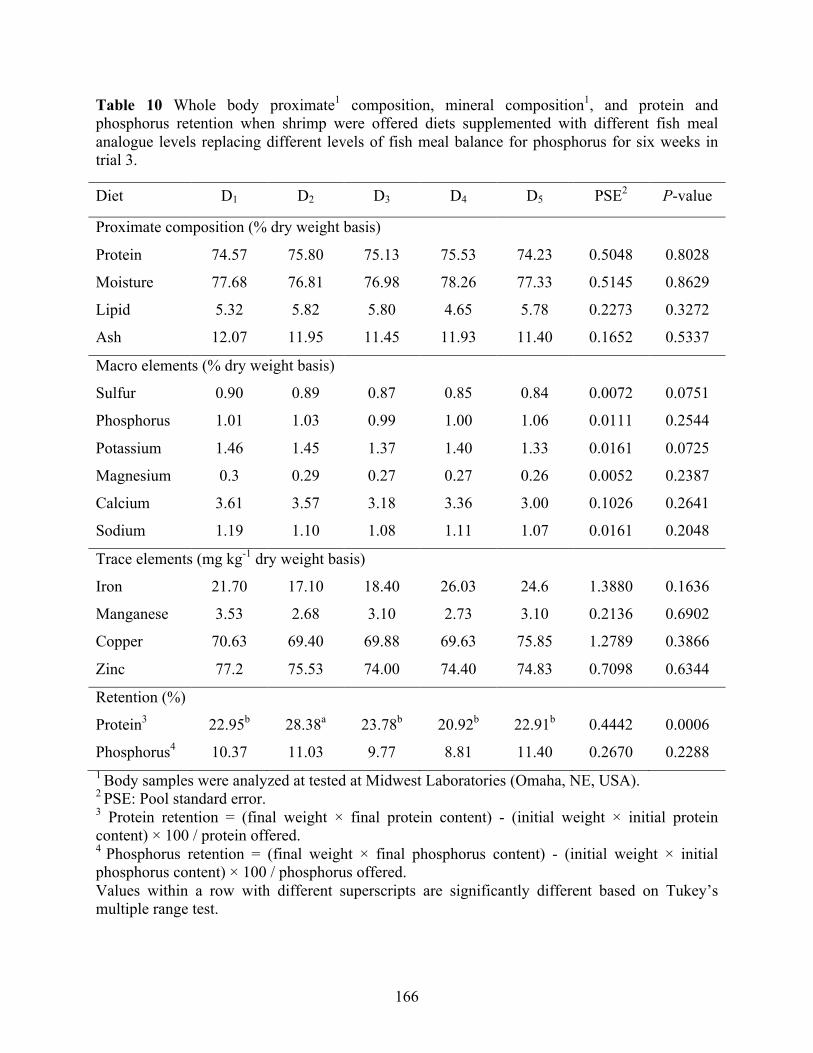
166
Table 10 Whole body proximate1 composition, mineral composition1, and protein and phosphorus retention when shrimp were offered diets supplemented with different fish meal analogue levels replacing different levels of fish meal balance for phosphorus for six weeks in trial 3.
Diet D1 D2 D3 D4 D5 PSE2 P-value
Proximate composition (% dry weight basis)
Protein 74.57 75.80 75.13 75.53 74.23 0.5048 0.8028
Moisture 77.68 76.81 76.98 78.26 77.33 0.5145 0.8629
Lipid 5.32 5.82 5.80 4.65 5.78 0.2273 0.3272
Ash 12.07 11.95 11.45 11.93 11.40 0.1652 0.5337
Macro elements (% dry weight basis)
Sulfur 0.90 0.89 0.87 0.85 0.84 0.0072 0.0751
Phosphorus 1.01 1.03 0.99 1.00 1.06 0.0111 0.2544
Potassium 1.46 1.45 1.37 1.40 1.33 0.0161 0.0725
Magnesium 0.3 0.29 0.27 0.27 0.26 0.0052 0.2387
Calcium 3.61 3.57 3.18 3.36 3.00 0.1026 0.2641
Sodium 1.19 1.10 1.08 1.11 1.07 0.0161 0.2048
Trace elements (mg kg-1 dry weight basis)
Iron 21.70 17.10 18.40 26.03 24.6 1.3880 0.1636
Manganese 3.53 2.68 3.10 2.73 3.10 0.2136 0.6902
Copper 70.63 69.40 69.88 69.63 75.85 1.2789 0.3866
Zinc 77.2 75.53 74.00 74.40 74.83 0.7098 0.6344
Retention (%)
Protein3 22.95b 28.38a 23.78b 20.92b 22.91b 0.4442 0.0006
Phosphorus4 10.37 11.03 9.77 8.81 11.40 0.2670 0.2288 1 Body samples were analyzed at tested at Midwest Laboratories (Omaha, NE, USA). 2 PSE: Pool standard error. 3 Protein retention = (final weight × final protein content) - (initial weight × initial protein content) × 100 / protein offered. 4 Phosphorus retention = (final weight × final phosphorus content) - (initial weight × initial phosphorus content) × 100 / phosphorus offered. Values within a row with different superscripts are significantly different based on Tukey’s multiple range test.
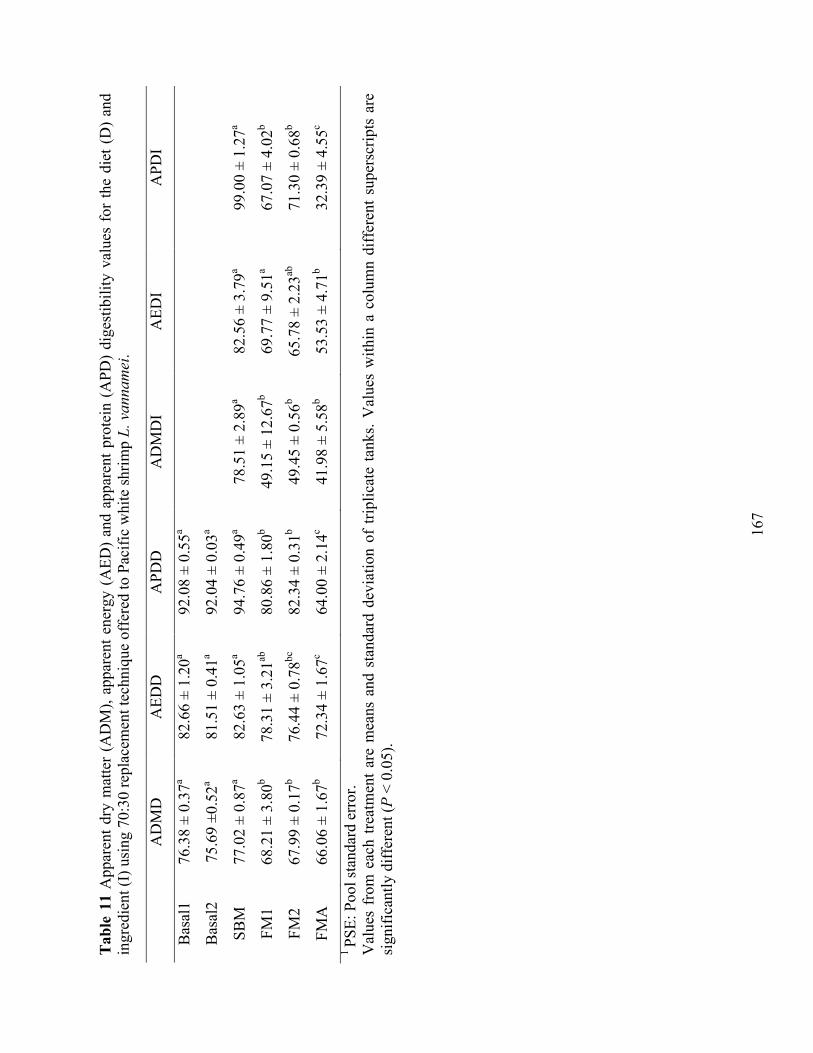
16
7
Tab
le 1
1 A
ppar
ent d
ry m
atte
r (A
DM
), ap
pare
nt e
nerg
y (A
ED)
and
appa
rent
pro
tein
(A
PD)
dige
stib
ility
val
ues
for
the
diet
(D
) an
d in
gred
ient
(I) u
sing
70:
30 re
plac
emen
t tec
hniq
ue o
ffer
ed to
Pac
ific
whi
te s
hrim
p L.
van
nam
ei.
A
DM
D
AED
D
APD
D
AD
MD
I A
EDI
APD
I
Bas
al1
76.3
8 ±
0.37
a 82
.66
± 1.
20a
92.0
8 ±
0.55
a
B
asal
2 75
.69
±0.5
2a 81
.51
± 0.
41a
92.0
4 ±
0.03
a
SBM
77
.02
± 0.
87a
82.6
3 ±
1.05
a 94
.76
± 0.
49a
78.5
1 ±
2.89
a 82
.56
± 3.
79a
99.0
0 ±
1.27
a
FM1
68.2
1 ±
3.80
b 78
.31
± 3.
21ab
80
.86
± 1.
80b
49.1
5 ±
12.6
7b 69
.77
± 9.
51a
67.0
7 ±
4.02
b
FM2
67.9
9 ±
0.17
b 76
.44
± 0.
78bc
82
.34
± 0.
31b
49.4
5 ±
0.56
b 65
.78
± 2.
23ab
71
.30
± 0.
68b
FMA
66
.06
± 1.
67b
72.3
4 ±
1.67
c 64
.00
± 2.
14c
41.9
8 ±
5.58
b 53
.53
± 4.
71b
32.3
9 ±
4.55
c
1 PS
E: P
ool s
tand
ard
erro
r. V
alue
s fr
om e
ach
treat
men
t ar
e m
eans
and
sta
ndar
d de
viat
ion
of t
riplic
ate
tank
s. V
alue
s w
ithin
a c
olum
n di
ffer
ent
supe
rscr
ipts
are
si
gnifi
cant
ly d
iffer
ent (
P <
0.05
).
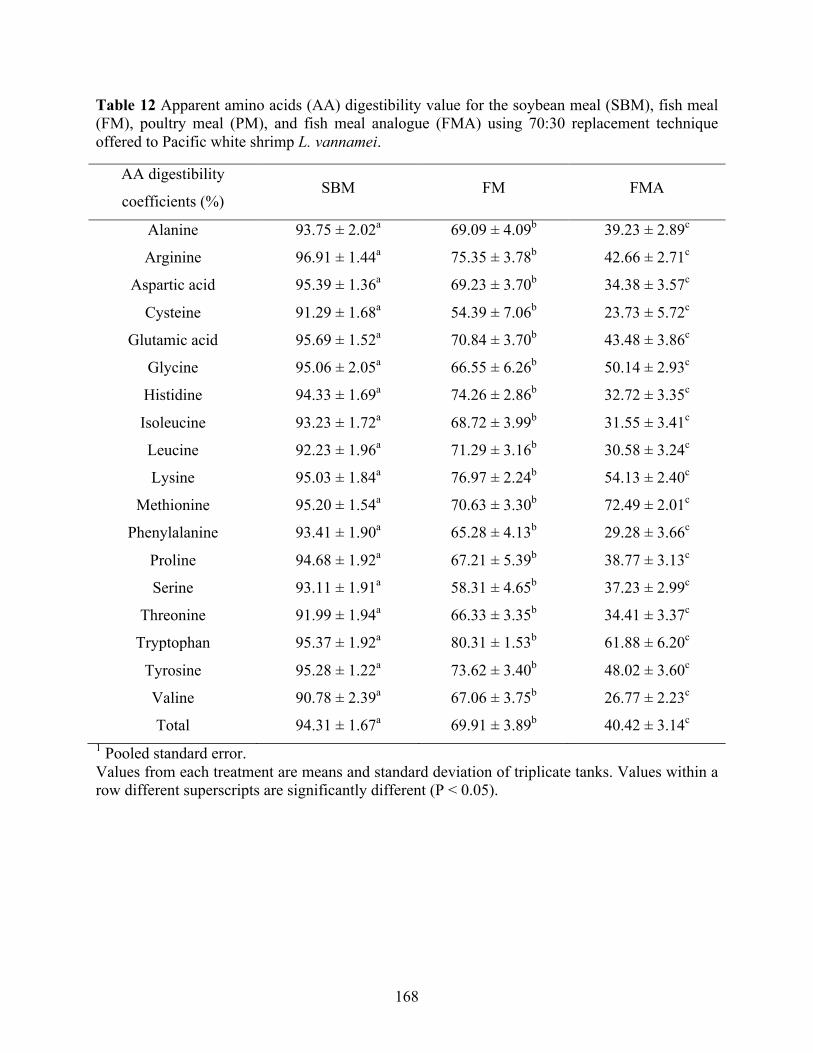
168
Table 12 Apparent amino acids (AA) digestibility value for the soybean meal (SBM), fish meal (FM), poultry meal (PM), and fish meal analogue (FMA) using 70:30 replacement technique offered to Pacific white shrimp L. vannamei.
AA digestibility
coefficients (%) SBM FM FMA
Alanine 93.75 ± 2.02a 69.09 ± 4.09b 39.23 ± 2.89c
Arginine 96.91 ± 1.44a 75.35 ± 3.78b 42.66 ± 2.71c
Aspartic acid 95.39 ± 1.36a 69.23 ± 3.70b 34.38 ± 3.57c
Cysteine 91.29 ± 1.68a 54.39 ± 7.06b 23.73 ± 5.72c
Glutamic acid 95.69 ± 1.52a 70.84 ± 3.70b 43.48 ± 3.86c
Glycine 95.06 ± 2.05a 66.55 ± 6.26b 50.14 ± 2.93c
Histidine 94.33 ± 1.69a 74.26 ± 2.86b 32.72 ± 3.35c
Isoleucine 93.23 ± 1.72a 68.72 ± 3.99b 31.55 ± 3.41c
Leucine 92.23 ± 1.96a 71.29 ± 3.16b 30.58 ± 3.24c
Lysine 95.03 ± 1.84a 76.97 ± 2.24b 54.13 ± 2.40c
Methionine 95.20 ± 1.54a 70.63 ± 3.30b 72.49 ± 2.01c
Phenylalanine 93.41 ± 1.90a 65.28 ± 4.13b 29.28 ± 3.66c
Proline 94.68 ± 1.92a 67.21 ± 5.39b 38.77 ± 3.13c
Serine 93.11 ± 1.91a 58.31 ± 4.65b 37.23 ± 2.99c
Threonine 91.99 ± 1.94a 66.33 ± 3.35b 34.41 ± 3.37c
Tryptophan 95.37 ± 1.92a 80.31 ± 1.53b 61.88 ± 6.20c
Tyrosine 95.28 ± 1.22a 73.62 ± 3.40b 48.02 ± 3.60c
Valine 90.78 ± 2.39a 67.06 ± 3.75b 26.77 ± 2.23c
Total 94.31 ± 1.67a 69.91 ± 3.89b 40.42 ± 3.14c
1 Pooled standard error. Values from each treatment are means and standard deviation of triplicate tanks. Values within a row different superscripts are significantly different (P < 0.05).

169
CHAPTER VII
UTILIZATION OF GREEN SEAWEED ULVA sp. AS A PROTEIN SOURCE IN
PRACTICAL DIETS FOR PACIFIC WHITE SHRIMP Litopenaeus vannamei
1. Introduction
Traditionally, fish meal (FM) is the most important and preferred protein source in most
shrimp feeds, because it is an excellent source of essential nutrients such as protein and
indispensable amino acids, essential fatty acids, cholesterol, vitamins, minerals, attractants and
unidentified growth factors (Samocha et al., 2004). As most fisheries are beyond sustainable
limits, fish meal supplies will not increase. Hence, the high demand and limit supply resulted in a
corresponding high market value of FM. The price of FM has risen from around $400 per metric
ton in 2000 to more than $1700 per metric ton in 2016, and the highest price reached to $2388
per metric ton in 2014 (Index Mundi, 2016).
Shrimp nutritionists have investigated numerous FM alternatives to reduce the reliance
on this costly and potential limiting resources in shrimp feed formulation. Among the potential
alternative ingredients, soybean meal (SBM) is usually considered as the most reliable, cost-
effective, and nutritionally valuable protein source in shrimp feed. The popularity of soybean
meal as a protein source is the result of a well-balanced nutrient profile, high digestibility, stead
supply, expandable production and reasonable price (Davis and Arnold, 2000, Amaya et al.,
2007a, Amaya et al., 2007b). The successful application of SBM in practical feed formulation
for Pacific white shrimp were well documented in many studies (Amaya et al., 2007a, Amaya et
al., 2007b, Davis and Arnold, 2000, Sookying and Davis, 2011, Roy et al., 2009, Samocha et al.,
2004, Qiu and Davis, 2016b, Qiu and Davis, 2016a).
170
Although FM and SBM will continue to be a mainstay in shrimp formulation in terms of
their nutritional preponderances, it is also critical to explore alternative ingredients to these two
conventional protein sources that may be more economical and sustainable to support the rapid
expansion of the shrimp industry as shrimp consumption is expected to continue to increase.
Marine macro-algae, commonly referred to seaweeds, are categorized by their pigmentation,
morphology, anatomy, and nutritional composition as red, brown or green seaweeds
(Dawczynski et al., 2007). They can benefit from recycling waste carbon dioxide (CO2) from
combustive energy production and waste nutrients produced by intensive aquaculture operations,
intensive animal operations, and municipal waste treatment (Kaushik, 2010, Sargent and Tacon,
1999). In an integrated cultivation system, the macro-algae use the metabolic residues of animals
as nutrients, absorb CO2 and produce O2 for the environment (Marinho-Soriano et al., 2007). The
interaction allows the excretion of an organism to serve as food for another. Presently, significant
improvements in growth and survival rate have been observed when Pacific white shrimp,
Litopenaeus vannamei (Cruz-Suárez et al., 2010, Brito et al., 2014a, Brito et al., 2014b), giant
tiger shrimp, Penaeous monodon Fabr (Tsutsui et al., 2010, Izzati, 2012), and yellowleg shrimp,
Farfantepenaeus californiensis (Portillo�Clark et al., 2012) are co-cultured with seaweeds.
Ulva spp belongs to the green seaweed. A number of studies have demonstrated that
dietary Ulva meal inclusion at low levels (<5% of the diet) did not affect the growth performance
in a variety of species including African catfish, Clarias gariepinus (Abdel-Warith et al., 2016),
gilthead seabream Sparus aurata (Emre et al., 2013), Pacific white shrimp (Cárdenas et al.,
2015, Rodríguez-González et al., 2014), Nile tilapia Oreochromis niloticus (Güroy et al., 2007,
Ergün et al., 2009), rainbow trout Oncorhynchus mykiss (Güroy et al., 2013). However, the
171
growth response of different fish species to the moderate and high supplementation levels of
Ulva meal are somewhat inconsistent.
The information about green seaweed Ulva sp. as a protein source in shrimp feed
formulation is still limited. Therefore, the purposes of this study were to evaluate the potential of
Ulva sp. as a protein source in comparison to FM and SBM in practical diets for Pacific white
shrimp and investigate the nutrient availability in this ingredient.
2. Materials and Methods
2.1. Experimental diets
Primary ingredients and four pooled batches of sun dried Ulva pertussa meal were
analyzed for proximate composition, amino acids and minerals (Table 1 and 2) and the diets
were formulated. Additionally, prior to pooling batch two, the 7 individual daily collections of
Ulva meal were sampled and analyzed individually (Table 3). Upon completion of analysis diets
were made by weighing pre-grounding dry ingredients and oil which was then mixed in a food
mixer (Hobart Corporation, Troy, OH, USA) for 15 min. Hot water was then blended into the
mixture to obtain a consistency appropriate for pelleting. Diets were pressure-pelleted using a
meat grinder with a 3-mm die, air-dried (< 45 °C) to a moisture content of 8-10%. Pellets were
crumbled, packed in sealed plastic bags and stored in a freezer until needed.
In trial 1, 2, 3 and 4, diets were formulated to be isonitrogenous and isolipidic (35%
protein and 8% lipid). In most diets substitution was done on a protein to protein basis however
in trial 3, ingredient replacement was done on a digestible protein basis. In trial 1, five
experimental diets were formulated to contain increasing levels (0, 6.35, 12.70, 19.05, and
25.40%) of the first batch of Ulva meal (UM1) as a replacement for fish meal (Table 4a). In trial
172
2, nine experimental diets were formulated (Table 5a). The basal diet for this and subsequent
trials was designed to have 6% fishmeal in all formulations to help stabilize nutrients as well as
palatability. The first seven diets utilized increasing levels of the second batch of Ulva meal
(UM2) (0, 5, 10, 15, 20, 25, and 30%) to replace soybean meal. Diet 8 and Diet 9 utilized high
incorporation of Ulva meal from the first and third batch, respectively. This allowed a
comparison of all three meals at equivalent levels of protein replacement. In trial 3, four
experimental diets were formulated using the first three batches of Ulva meal replacing soybean
meal on a digestible protein basis (Table 6a). In trial 4, five experimental diets were designed
utilizing different levels (0, 4.75, 9.5, 12, and 24%) of fourth batch of Ulva meal (high protein
content~38%) replacing fish meal and soybean meal. Digestibility values for the meals were
determined using standard methods and 1% chromic oxide as an inert marker (Table 8a). Test
diets were made on a dry matter basis using a 70:30 mixture of the reference diet and test
ingredients.
The ingredients (Table 1) were analyzed at University of Missouri Agricultural
Experiment Station Chemical Laboratories (Columbia, MO, USA) for proximate composition
and amino acid profile and mineral profiles (Table 2) by the Soil Lab (Auburn, AL, USA). Daily
collections of UM2 samples (Table 3) collected across seven different dates were analyzed
individually at Midwest laboratories (Omaha, NE, USA) for proximate and mineral composition.
Diets (Table 4a, Table 5a, Table 6a, and Table 7a) were analyzed at University of Missouri
Agricultural Experiment Station Chemical Laboratories (Columbia, MO, USA) for proximate
composition and amino acid profile and Soil Lab (Auburn, AL, USA) for mineral composition.
173
2.2. Growth trials
The trial 1 utilized 5 treatments with 7 replicates in each treatment. It was conducted in a
semi-closed recirculation system. Juvenile shrimp were obtained from the nursery system and
selected by hand-sorting to a uniform size. Juvenile shrimp (initial weight 0.26 ± 0.02 g) were
stocked into 35 tanks with 10 shrimp in each aquarium (135L). A sub-sample of shrimp from the
initial stocking was retained for whole body analysis to be utilized for later protein retention
analysis. As shrimp are difficult to handle, intermittent weights were not taken. However, shrimp
were counted to readjust daily feed input on a weekly basis. Based on historically results, a fixed
ration was calculated assuming a 1.8 feed conversion ratio and a doubling in size the first two
weeks and 0.8-0.9 g week-1. Therefore, for ten shrimp in a given tank, a fixed ration of 0.67 g
day-1 for the first week, 1.45 g day-1 for the second week, 2.06 g day-1 for the third week, and
2.31 g day-1 for the fourth week, 2.57 g day-1 for the fifth week, and 2.83 g day-1 for the six week
was offered over 4 feedings.
The trial 2 was conducted in the same semi-closed recirculation system which is
mentioned above. It utilized 9 treatments with 4 replicates in each treatment. Juvenile shrimp
(initial weight 0.24 ± 0.01 g) were stocked into 36 tanks with 10 shrimp in each aquarium
(135L). A sub-sample of shrimp from the initial stocking was retained for whole body samples to
be utilized for later protein and phosphorus retention analysis. Shrimp were counted to readjust
daily feed input on a weekly basis. Based on historically results, a fixed ration was calculated
assuming a 1.8 feed conversion ratio and a doubling in size the first two weeks and 0.8-0.9 g
week-1 thereafter. Consequently, for each tank a fixed ration of 0.62 g day-1 for the first week,
1.23 g day-1 for the second week, 2.06 g day-1 for the third and fourth week, and 2.31 g day-1 for
the fifth week was offered over 4 feedings.

174
The trial 3 was conducted in the same semi-closed recirculation system which is
mentioned above. It utilized 4 treatments with 4 replicates in each treatment. Juvenile shrimp
(initial weight 0.98 ± 0.01 g) were stocked into 16 tanks with 10 shrimp in each aquarium
(135L). A sub-sample of shrimp from the initial stocking was retained for whole body samples to
be utilized for later protein and phosphorus retention analysis. As shrimp are difficult to handle,
intermittent weights were not taken. However, shrimp were counted to readjust daily feed input
on a weekly basis. Based on historically results, a fixed ration was calculated assuming a 1.8
feed conversion ratio and a doubling in size the first two weeks and 0.8-1.3 g week-1 thereafter.
Consequently, for each tank of 10 shrimp a fixed ration of 2.1 g day-1 for the first week, 2.3 g
day-1 for the second week, 2.8 g day-1 for the third week, 3.1 g day-1 for the fourth week, 3.4 g
day-1 for the fifth week, and 3.7 g day-1 for the sixth week was offered over 4 feedings.
The trial 4 was conducted in a similar semi-closed recirculation system to what was
previously described. It utilized 5 treatments with 4 replicates in each treatment. Juvenile shrimp
(initial weight 0.15 ± 0.01 g) were stocked into 20 tanks with 10 shrimp in each aquarium
(135L). Based on historically results, a fixed ration was calculated assuming a 1.8 feed
conversion ratio and a doubling in size the first two weeks and 0.8-1.3 g week-1 thereafter.
Consequently, for each tank of 10 shrimp a fixed ration of 2.1 g day-1 for the first week, 2.3 g
day-1 for the second week, 2.8 g day-1 for the third week, 3.1 g day-1 for the fourth week, 3.4 g
day-1 for the fifth week, and 3.7 g day-1 for the sixth week was offered over 4 feedings.
At the end of each growth trials, shrimp were counted and group weighted. Mean final
weight, feed conversion ratio (FCR), weight gain (WG), biomass, and survival were determined
(Table 4c, 5d, 6c, 7c). After obtaining the final total weight of shrimps in each aquarium, 4
shrimps were randomly selected and frozen at -20 °C for subsequent determination of whole
175
body composition. Proximate composition (Table 4d, 5e, 6d, 7d) of whole shrimp was analyzed
by Midwest Laboratories, Inc (Omaha, NE, USA) or University of Missouri Agricultural
Experiment Station Chemical Laboratories (Columbia, MO, USA). Mineral profiles of whole
shrimp and select algae meals were analyzed by Soils lab (Auburn, AL, USA). Apparent net
protein and amino acids retention were calculated using the following equations
Protein retention (%) = (final weight × final protein content) - (initial weight × initial protein
content) × 100 / protein offered.
Amino acids (AA) retention (%) = (final weight × final AA content) - (initial weight × initial AA
content) × 100 / AA offered.
2.3. Water quality monitoring
Dissolved oxygen (DO), temperature, and salinity were measured twice daily by using a
YSI 650 multi-parameter instrument (YSI, Yellow Springs, OH, USA). The pH was measured
twice weekly by using a waterproof pHTestr30 (Oakton instrument, Vernon Hills, IL, USA).
Water samples were taken to measure total ammonia-nitrogen (TAN) and nitrite every week.
TAN and nitrite were determined by the methods described by (Solorzano, 1969) and (Spotte,
1979), respectively.
2.4. Digestibility trial
The digestibility trial was conducted in the mentioned recirculation system and utilized 6
shrimp per aquaria with 6 aquaria per dietary treatment. Once acclimated for 3 days to the test
diets, feces from two aquaria were pooled (n=3) and collected over a 5-day period or until
adequate samples were obtained. To obtain fecal samples, the aquaria were cleaned by siphoning
176
before each feeding with the first collection of the day discarded. After the aquaria were cleaned,
the shrimp were offered an excess of feed and then about 1 hour later feed was removed and
feces were collected by siphoning onto a 500µm mesh screen. Collected feces were rinsed with
distilled water, dried at 105 °C until a constant weight was obtained, and then stored in freezer (-
20 °C) until analyzed. Apparent digestibility coefficient for dry matter, protein, energy and
amino acids were determined by using chromic oxide (Cr2O3, 10 g kg -1) as an inert marker.
Chromium concentrations were determined by the method of (McGinnis and Kasting, 1964) in
which, after a colorimetric reaction, absorbance is read on a spectrophotometer (Spectronic
genesis 5, Milton Roy Co., Rochester, NY, USA) at 540nm. Gross energy of diets and fecal
samples were analyzed with a Semi micro-bomb calorimeter (Model 1425, Parr Instrument Co.,
Moline, IL, USA). Protein were determined by micro-Kjeldahl analysis (Ma and Zuazaga, 1942).
The apparent digestibility coefficient of dry matter (ADMD), protein (ADP), energy (ADE) and
amino acids (ADAA) were calculated according to (Cho et al., 1982)as follows:
ADMD (%) = 100 − [100 × (% Cr2O3 in feed / % Cr2O3 in feces)]
ADP, ADE, and ADAA (%) = 100 − [100 × (% Cr2O3 in feed / % Cr2O3 in feces) × (% nutrient
in feces / % nutrient in feed).
The apparent digestibility coefficients (ADC) of the test ingredients for dry matter,
energy, protein and amino acids were calculated according to Bureau et al. (2006) as follows:
ADCtest ingredient = ADCtest diet + [(ADCtest diet – ADCref. diet) × (0.7 × Dref / 0.3 × Dingr)]
where Dref = % nutrient (or KJ/g gross energy) of reference diet mash (as is); Dingr = % nutrient
(or KJ/g gross energy) of test ingredient (as is).
177
2.5. Statistical analysis
All the data were analyzed using SAS (V9.3. SAS Institute, Cary, NC, USA). Data from
both the growth trial and digestibility trial were analyzed using one-way ANOVA to determine
significant differences (P<0.05) among treatments followed by the Tukey’s multiple comparison
test to determine difference between treatments. Arcsine square root transformation was used
prior to analysis for the proportion data. False discover rate (FDR) controlling procedures were
applied to adjust the P-value to control the FDR for amino acid data. Linear, second- or third-
order polynomial regressions were performed to investigate the relationship between the
supplemental Ulva meal levels and weight gain, FCR, survival, and lipid content of whole
shrimp body. To identify the most appropriate regression model, we compared P-value of the
model components, R2 value, adjust R2 value, and the sum of squares for error (SSE) with
different regression models.
3. Results
3.1. Water quality
In trial 1, DO, temperature, salinity, pH, TAN, and nitrite were maintained within
acceptable ranges for L. vannamei at 6.19 ± 0.25 mg L-1, 28.4 ± 0.8 °C, 11.8 ± 0.4 ppt, 7.23 ±
0.22, 0.079 ± 0.041 mg L-1, and 0.039 ± 0.021 mg L-1, respectively. In trial 2, DO, temperature,
salinity, pH, TAN, and nitrite were maintained at 5.82 ± 0.26 mg L-1, 29.7 ± 0.8 °C, 8.6 ± 0.4
ppt, 7.5 ± 0.5, 0.052 ± 0.107 mg L-1, and 0.003 ± 0.004 mg L-1, respectively. In trial 3, DO,
temperature, salinity, pH, TAN, and nitrite were maintained at 6.20 ± 0.72 mg L-1, 29.5 ± 0.9 °C,
8.4 ± 1.0 ppt, 7.5 ± 0.3, 0.092 ± 0.103 mg L-1, and 0.050 ± 0.039 mg L-1, respectively. In trial 4,
DO, temperature, salinity, pH, TAN, and nitrite were maintained at 6.96 ± 0.31 mg L-1, 28.1 ±

178
0.3 °C, 8.2 ± 0.6 ppt, 7.0 ± 0.3, 0.05 ± 0.04 mg L-1, and 0.12 ± 0.12 mg L-1, respectively. Water
quality conditions in all the trials were suitable for normal growth and survival of this species.
3.2. Growth performances
Growth performances of juvenile Pacific white shrimp offered diets contained different
levels of Ulva meal in trial 1-4 are presented in Table 4c, 5d, 6c, and 7c. In trial 1, final biomass
was significantly reduced when UM1 was included at 25.4% compared to the treatment
supplemented with 0 and 6.35% UM1. Significant reductions in final mean weight and
increments in FCR were detected when 19.05 and 25.4% UM1 was incorporated in the diet in
contrast with diets contained 0 and 6.35% UM1. Shrimp fed with diets contained more than
12.7% UM1 exhibited significantly reduced WG than those offered with diets supplemented with
0 and 6.35% UM1. No significant difference was determined in survival across all the treatments
(82.9% to 92.9%).
In trial 2, final biomass was significantly reduced when more than 5% Ulva meal was
included in the diet. Final mean weight and WG were significantly decreased when more than
10% Ulva meal was supplemented in the diet. Significant increment in FCR was determined
when the diet contained 25% UM2. Shrimp fed with diets contained 25% and 30% UM2
exhibited significantly lower survival than those fed with diets supplemented with 0, 5, and 15%
UM2.
In trial 3, in general shrimp fed UM2 exhibited poorest performance in terms of growth,
FCR, and survival. Significant reductions in final biomass, final mean weight, WG, and survival
were determined when UM2 was supplemented in the diet compared to other treatments. FCR
was significantly increased in the treatment contained UM2 in contrast with other treatments.
179
In trial 4, shrimp fed with diets supplemented with different levels of UM4 showed
significantly reduced final biomass, final mean weight, and WG as well as increased FCR.
Survival was significantly reduced when 9.5% UM4 was included in the diet to replace 6% FM.
3.3. Proximate composition and amino acid profile of whole shrimp body
Proximate composition and amino acids profile of whole shrimp body in trial 1-4 are
presented in Table 4d, 5e, 6d, and 7d. In trial 1, shrimp fed with diets supplemented with
different levels of UM1 exhibited significantly reduced crude lipid of whole body. No significant
effects were detected in moisture (76.29% to 76.99%) and crude protein content (72.77% to
74.27%) across the treatments.
In trial 2, crude lipid content was significantly reduced when more than 5% Ulva meal
was incorporated in the diets. Shrimp fed with diets contained more than 5% UM2 exhibited
significantly improved crude protein content. No significant difference was detected in the
moisture content (75.66% to 78.05%) across all the treatments.
Shrimp fed with diet contained 25% and 30% exhibited significantly higher arginine and
glycine content than the one fed with reference diet. Cysteine and lysine contents in the treatment
fed with 15% to 30% UM2 were significantly higher than those fed with the reference diet.
Histidine content in the treatment fed with diet contained 10% to 25% UM2 and 23.6% UM3
was significantly higher than the ones fed with reference diet. Shrimp fed with diet contained
30% UM2 exhibited significantly higher methionine content than those fed with diets contained
0, 5, and 10% UM2. Phenylalanine in the treatment contained 20% UM2 was significantly
higher than the treatments contained 0 and 5% UM2 as well as 26.3% UM1. No significant
differences were observed in alanine, aspartic acid, glutamic acid, hydroxylysine,
180
hydroxyproline, isoleucine, leucine, proline, serine, threonine, tyrosine, tryptophan, valine, and
total amino acids levels in whole shrimp body across all the treatments.
In trial 3, significant reduction in crude lipid content was detected when shrimp was fed
with diet contained UM2. Shrimp fed with diet contained UM2 exhibited significantly higher
body moisture content than those fed with reference diet and diet contained UM4. No significant
difference was detected in protein content (75.08% to 76.98%) across all the treatments.
Methionine content was significantly improved when UM1, UM2, UM3 were included in
the diets. No significant differences were observed in alanine, arginine, aspartic acid, cysteine,
glutamic acid, glycine, histidine, hydroxylysine, hydroxyproline, isoleucine, leucine, lysine,
phenylalanine, proline, serine, threonine, tryptophan, tyrosine, valine, and total amino acids
contents of whole shrimp body across all the treatments.
In trial 4, moisture content in the treatment fed with diets contained 12% and 24% UM4
was significantly higher than those fed with reference diet and diet contained 4.75% UM4. Crude
protein was significantly enhanced when shrimp were fed with diet contained 24% UM4
compared to the reference diet and diet supplemented with 4.75% UM4. Crude lipid was
dramatically decreased when more than 9.5% UM4 was included in the diet. Significant
increment in ash content was observed when the diet was incorporated with 9.5% and 24% UM4
in contrast with the reference diet.
3.4. Protein and amino acids retention
Protein and amino acids retention in trial 1-4 are presented in Table 4c, 5f, 6e, and 7c. In
trial 1, shrimp fed diet contained 6.35% UM1 showed significantly improved PRE compared to
181
those fed with diets supplemented with 19.05 and 25.4% UM1. In trial 4, PRE was significantly
depressed when more than 9.5% UM4 was include in the diet
In trial 2, PRE was significantly reduced when shrimp was fed with diets supplemented
with 15 to 30% UM2, 26.3% UM1, and 23.6%UM3 compared to the one offered with reference
diet. In general, total and individual amino acids retention corresponded to PRE. Alanine,
arginine, aspartic acid, hydroxyproline, isoleucine, phenylalanine, proline, threonine, and valine
retention were significantly lower in the treatments contained 15 to 30% UM2, 26.3% UM1, and
23.6%UM3 than the reference diet. Total amino acids, cysteine, glutamic acid, glycine, leucine,
and serine retention were significantly reduced in the treatments contained 15 to 30% UM2 and
23.6% UM3. Shrimp fed with diets contained 15 to 30% UM2 exhibited significantly higher
histidine, hydroxylysine, lysine, methionine, tryptophan, and tyrosine retention than those fed
with reference diet.
In trial 3, PRE was significantly reduced when UM2 and UM3 were supplemented in the
diets. In general, total and individual amino acids retention corresponded to PRE. Arginine and
hydroxyproline retention were significantly lower in treatments incorporated with UM1-3. Total
amino acids, cysteine, serine, threonine, and valine retention in treatments supplemented with
UM2 and UM3 were significantly reduced compared to the treatments fed with reference diet.
Alanine, aspartic acid, glycine, histidine, hydroxylysine, isoleucine, leucine, lysine, methionine,
phenylalanine, proline, tryptophan, and tyrosine retention were significantly depressed when
UM2 was supplemented in the diet.
182
3.5. Regression analysis
Dietary Ulva meal levels significantly correlated with WG, FCR, and lipid content in trial
1, 2, and 4 (Figure 1, 2, and 3). In general, the trends of the relationships between
WG/FCR/lipid content of shrimp body and dietary Ulva meal levels are consistent in trial 1, 2,
and 4. WG is negatively correlated with dietary Ulva meal levels. In trial 1, 2, and 4, the
regression lines are described by y = 0.1686x3 - 6.2114x2 + 34.409x + 1797.8 (R2 = 0.4922, P <
0.0001), y = 1.1925x2 -62.699x + 1713.1 (R2 = 0.6815, P < 0.0001), and y = 2.6848x2 - 119.17x
+ 3049.3 (R2 = 0.6934, P < 0.0001), respectively (y = WG, x = Ulva meal levels). FCR is
positively associated with Ulva meal levels. In trial 1, 2, and 4, the regression lines are exhibited
as y = 0.0276x + 1.7708 (R2 = 0.3582, P = 0.0001), y = -0.0703x + 1.5451 (R2 = 0.4766, P <
0.0001), and y = 0.06x + 1.8532 (R2 = 0.721, P < 0.0001), respectively (y = FCR, x = Ulva meal
levels). Lipid content of shrimp body is negatively correlated with Ulva meal levels. In trial 1, 2,
and 4, the regression lines are described by y = -0.0962x + 7.4 (R2 = 0.3503, P = 0.0002), y =
0.0078x2 - 0.4095x + 7.8033 (R2 = 0.9051, P < 0.0001), and y = -0.1903x + 7.9555 (R2 = 0.7224,
P < 0.0001), respectively. Survival is negatively correlated with dietary Ulva meal levels in trial
2 and 4. However, no relationship is determined in trial 1. In trial 2 and 4, the regression lines are
described by y = -1.1607x + 100.27 (R2 = 0.6113, P < 0.0001) and y = -0.7625x + 90.105 (R2 =
0.2479, P = 0.0156).
3.6. Digestibility trial
Apparent dry matter (ADM), apparent energy (AED), and apparent protein (APD)
digestibility values for the diet (D) and ingredient (I) using 70:30 replacement technique offered
to shrimp are presented in Table 8b. The digestibility trial contained a range of ingredients;
183
hence, we have provided a few other ingredients as a reference. In order to confirm the results,
fecal samples for basal diets and FM diet were recollected. The results turned out to be quite
similar, which indicated that the feces collection and samples analysis methods we utilized in the
digestibility study are consistent. The energy and protein digestibility of UM1 and UM2 were
40.39% and 15.17%, and 19.11% and 43.51%, respectively, which were significantly lower than
those of FM and SBM.
Apparent amino acids (AA) digestibility values for the SBM, FM, UM1, and UM2 using
70:30 replacement technique offered to Pacific white shrimp are presented in Table 8c. In
general, the AAAD corresponded to the APD. Apparent digestibility coefficients of alanine,
arginine, aspartic acid, cysteine, glutamic acid, glycine, histidine, isoleucine, leucine, lysine,
methionine, phenylalanine, proline, serine, threonine, tryptophan, tyrosine, and valine of UM1
and UM2 were significantly lower than those of FM and SBM.
4. Discussion
4.1. Ingredient composition
Seaweeds are valuable sources of protein, fiber, vitamins, macro and trace elements, as
well as important bioactive compounds (Ortiz et al., 2006). Protein content of seaweeds is tied to
the variations in seasons (Fleurence, 1999). In the current study, differences in protein contents
were detected among the four pooled batches of Ulva meal (Table 1) and individual Ulva meal
samples collected from seven dates within the UM2 (Table 2). The protein content of seaweed
can be somewhat manipulated by controlling the nutrient loading during cultivation (Floreto et
al., 1996). In this instance, nitrogen enriched conditions like the effluents of fish or shrimp
farms, where seaweeds are utilized as bio-filters, can enhance their protein contents (Lahaye et
184
al., 1995, Pinchetti et al., 1998). Owing to the manipulation of nitrogen loading during
cultivation, the protein content of seaweed Ulva sp. can be improved up to 38.16% in the present
study, which is superior to the upper limit of the protein range (10% to 26%) of this species
reported by several researchers (Benjama and Masniyom, 2011, Fleurence, 1999, Lee et al.,
2014).
As a result of the enhanced protein content, the amino acid concentrations in the Ulva sp.
reported in the present study were improved at least by around 50% in contrast with those
documented by Lee et al. (2014) or by even more than 300% compared to those described by
Benjama and Masniyom (2011). For most seaweed species, aspartic acid and glutamic acid
constitute a large portion of the total amino acids (Lourenço et al., 2002). Similarly, the sum of
these two amino acids in UM1 to UM4 represented 22.27% to 28.6% of total amino acids in the
present study. In terms of the two most limiting amino acids (methionine and lysine) in
ingredients for shrimp, their concentrations in UM1-4 ranged from 0.26% to 0.63% and 0.82% to
1.51%, respectively. Methionine level in UM1-4 were similar to that in SBM (0.66%) but lower
than that in FM (1.61%). Lysine level in UM1-4 were low compared to both SBM (3.06%) and
FM (4.67%).
Lipid content in most seaweeds was reported less than 4% dry weight (DW), whereas
some seaweeds such as Dictyota acutiloba and D. sandvicenis contained a high level of lipid
(16.1% and 20.2 % DW, respectively) (McDermid and Stuercke, 2003). In the current study,
lipid content in UM1-4 and individual UM2 samples ranged from 0 to 0.62%. Similarly, Lee et
al. (2014) reported that Lipid content of Ulva sp. was 0.1% DW. By contrast, Benjama and
Masniyom (2011) documented that lipid content of Ulva sp. in summer and rainy season were
185
7.4% and 2.1% DW, respectively. The differences among these researches would be mainly
attributed to different nutrient loadings during the seaweed cultivation.
Seaweeds are rich sources of minerals with a broad mineral composition including Al,
As, B, Ba, Ca, Cd, Co, Cr, Cu, Fe, K, Mg, Mn, Na, Ni, P, Pb, S, Se, Si, and Zn, which has not
been observed in edible terrestrial plants (Lee et al., 2014). In the present study, the macro
elements (Ca, K, Mg, Na, P, and S) and trace elements (Al, As, B, Ba, cd, Co, Cr, Cu, Fe, Mn,
Ni, Pb, Se, Si, Zn, and Zr) of pooled UM1-3 ranged from 0.31-4.79% and 0.6-9086.7 mg kg-1,
respectively. Within the individual UM2 samples collected from seven dates, the macro elements
(Ca, K, Mg, Na, P, and S) and trace elements (Cu, Fe, Mn, and Zn) ranged from 0.31-4.38% and
7.6-6780 mg kg-1, respectively. Considerable variations were detected in the Ca, Na, and Fe
levels in the pooled UM1-3 and individual UM2 samples, which would be mainly attributed to
the nutrient loadings, temperature, and salinity during cultivation.
4.2. Nutrient digestibility
The nutrient digestibility of a feed ingredient is an important factor to evaluate the overall
nutritive value of the ingredient because it is related to the quantity of the nutrient absorbed by
the animals. SBM had the highest APD (97.03%), AED (82.56%), and AAAD (90.78 – 96.91%)
among the ingredients tested in the current study. Similar ranges of results for APD, AED, and
AAAD were reported in multiple shrimp studies (Cruz-Suárez et al., 2009, Fang et al., 2016, Liu
et al., 2013, Yang et al., 2009, Zhou et al., 2015). APD and AED of FM1 were 67.07% and
69.77%, respectively. Similar results were acquired in FM2 (APD and AED: 71.3% and 65.78%,
respectively). The analogous results of basal diet and FM diet from the collections under two
occasions pointed to the consistency in the feces collection and sample analysis methods. APD
186
of FM has been reported to be ranged from 62.7% to 91.6% in numerous studies (Lemos et al.,
2009, Liu et al., 2013, Terrazas-Fierro et al., 2010, Yang et al., 2009). ADP of FM in our study
were in the lower range of the results documented among those researches. The differences in
digestibility of FM among various studies could be attributed to several factors, such as different
raw materials, location or processing methods used to produce the products, and unknown
factors related to different production batches.
In the present study, APD and AED of UM1 and UM2 were significantly lower than
those of FM and SBM. The low APD of UM1 and UM2 translated to poor AAAD. Total amino
acids and most individual amino acids availability in UM1 and UM2 were significantly lower
than those of FM and SBM. With regards to the two batches of Ulva meal, UM1 exhibited
significantly higher AED than that of UM2. On the contrary, APD of UM1 was significantly
lower than that of UM2. Because of comparatively low APD in UM1, ADC of total amino acids
and many individual amino acids in UM1 were significantly lower than those in UM2. No
differences were detected in ADMD of UM1 and UM2. The variations in APD, AED, and
AAAD of UM1 and UM2 indicated that nutrient availability in Ulva meal would also be affected
by the conditions such as temperature, salinity, nutrient loadings during cultivation.
There are relatively few studies looking at the nutrient availability of seaweed meals in
aquatic animal feeds particularly with regards to shrimp. Cárdenas et al. (2015) documented that
APD of Nutrikelp (a brown seaweed meal is comprised of mixtures of Macrocystis,
Lessoniaceae and Lessonia) and Nutrigreen (a green seaweed meal contains mixtures of Ulva,
Caulerpa, and Enteromorpha) for L. vannamei were 85.37% and 86.81%, respectively, which
may be masked by their high ADMD (80.97% and 80.33%, respectively) accordingly. Moreover,
Pereira et al. (2012) reported that AED, and APD of four seaweeds (Ulva spp, Porphyra dioica,
187
Gracilaria vermiculophylla, and Sargassum muticum) in rainbow trout Oncorhynchus mykiss
were 72.7% and 75.6%, 66.8% and 79.5%, 62.4% and 87.8%, and 58% and 65.5%, respectively.
In the same study, the AED and APD of the four seaweeds in Nile tilapia Oreochromis niloticus
were 57.1% and 63.4%, 39.6% and 58.5%, 27.8% and 51.4%, and 54.9% and 65.1%,
respectively (Pereira et al., 2012). The variations in the nutrients availability results presented in
the researches could be mainly attributed to the use of multiple seaweed species and different
aquatic animals in the experiment.
There are several other studies investigated the nutrient availability of the test diets
supplemented with seaweed meals. Valente et al. (2006) indicated that supplementation of three
seaweeds (Gracilaria bursa-pastoris, Ulva rigida, and Gracilaria cornea) up to 10% in the diets
for European sea bass Dicentrarchus labrax did not affect the APD and ADMD of the test diets.
Moreover, Marinho et al. (2013) documented that utilization of Ulva spp up to 20% as a
replacement for 0-20% FM did not influence the APD and AED of the test diets for Nila tilapia
Oreochromis niloticus. In addition, Cyrus et al. (2015) summarized that 5% inclusion of Ulva
spp in the diets for sea urchin Tripneustes gratilla significantly improved APD, whereas
significantly reduced APD and AED were determined when Ulva spp was supplemented at 15%.
4.3. Growth performance and survival
In trial 1, UM1 can be included at 6.35% as a replacement for 2% FM without
compromising WG and FCR in a reference diet contained 10% FM. However, significant
reductions in WG and increment in FCR were determined when UM1 was supplemented from
12.7% to 25.4% as a replacement for 4% to 8% FM. Regression results demonstrate WG of
shrimp decreases as the inclusion level of UM1 increases, whereas FCR increases with
188
enhancing UM1 levels (Figure 1a and 1b). Similarly, many studies demonstrated that low
inclusion levels (≤ 5%) of seaweed meals generally did not result in poor growth performance in
African catfish Clarias gariepinus (Abdel-Warith et al., 2016, Al-Asgah et al., 2016), European
sea bass (Valente et al., 2006), gilthead seabream Sparus aurata (Emre et al., 2013), Nile tilapia
(Marinho et al., 2013, Güroy et al., 2007, Valente et al., 2016), red tilapia Oreochromis Sp. (El-
Tawil, 2010), Pacific white shrimp (Rodríguez-González et al., 2014, Cárdenas et al., 2015), and
rainbow trout (Soler-Vila et al., 2009, Güroy et al., 2013).
However, the results of the moderate and high inclusion levels of seaweeds meals are
somewhat inconsistent. Rodríguez-González et al. (2014) indicated that dietary supplementation
of Ulva lactuca meal at both 10% and 15% as a substitution for FM significantly reduced the
WG of Pacific white shrimp, whereas shrimp fed with diets contained 10% and 15% Gracilaria
parvispora meal did not exhibit growth depression. Furthermore, Felix and Brindo (2014)
reported that dietary inclusion of raw Ulva lactuca meal at 10%, 20%, and 30% resulted in
depressed growth performance in giant freshwater prawn Macrobrachium rosenbergii,
nevertheless the supplementation of fermented Ulva lactuca meal at the same levels did not
affect the growth response. Moreover, Güroy et al. (2013) indicated that no difference in terms
of growth performance was determined when 10% raw or autoclaved Ulva rigida meal were
supplemented in the diet as a supplement for rainbow trout. However, significant reductions in
WG was detected in rainbow trout fed with diets contained 10% Ulva lactuca and Enteromorpha
linza meal (Yildirim et al., 2009). In addition, several studies demonstrated that Nile tilapia fed
with diets supplemented with Ulva spp. (a mixture of Ulva rigida and Ulva lactuca) or Ulva
rigida meal up to 10% did not exhibit difference with regards to the growth response, whereas
significant reduced WG was observed when inclusion level of those seaweed meals rose to 15%
189
(Güroy et al., 2007, Marinho et al., 2013, Valente et al., 2016). Another two publications also
confirmed that dietary inclusion of Ulva lactuca and Gracilaria arcuata meals at 9% and 13.5%
significantly reduced the WG of African catfish and increased FCR (Abdel-Warith et al., 2016,
Al-Asgah et al., 2016). Variations among these researches could be attributed to the utilization of
different kinds of seaweed meal species and aquatic animal species as well as the over-
formulation of reference diet. The result might be masked as the reference diets in some of the
studies list above contained a high FM content resulting in over satisfaction of the nutrient
requirement of the target animals. As the protein, lipid, phosphorus, and amino acids
compositions are balanced in trial 1 (Table 4b), nutrient imbalances should be not counted as the
problem caused growth depression. The potential problems resulted in the reduced growth of
shrimp in trial 1 might be palatability shifts due to the reduced FM levels and the low nutrients
availability and high mineral concentrations in UM1.
As the replacement of FM results in shifts in numerous nutrients as well as possible
palatability changes of the diet, we chose to shift the nutrition model to replace a graded level of
SBM and compare the effects of three batches Ulva meal (UM1, 2, and 3) at high inclusion
levels in the trial 2. To compared the variations of Ulva meal from the three batches (UM1-3),
additional two diets (T2D8 and T2D9) basically formulated by using high levels of UM3 and
UM1, respectively, to replace the same amount of SBM as T2D5 which supplemented with UM2.
Results indicated that there was a decreasing trend of WG as the UM2 inclusion level increased
(Figure 2a). UM2 can be included up to 10% in the shrimp diet without causing growth
depression, whereas significant reduction in WG was determined when more than 15% UM2 was
supplemented in the diet. This phenomenon has been confirmed by trial 1 and multiple studies
cited above. Besides reduced growth performance, there was a decreasing trend of survival when
190
more than 20% UM2 was included in the diet (Figure 2c). Significant reduction in survival was
detected at 25% and 30% inclusion level. Similarly, a number of studies have demonstrated that
low and moderate inclusion levels (≤20%) of various seaweed meals had no effects on the
survival of a variety of fish or shrimp species including Nile tilapia (Güroy et al., 2007), Pacific
white shrimp (Rodríguez-González et al., 2014), rainbow trout (Soler-Vila et al., 2009, Yildirim
et al., 2009), and red tilapia (El-Tawil, 2010). By contrast, Felix and Brindo (2014) reported that
survival of freshwater prawn was not affected when Ulva lactuca was used up to 30%. In
addition, Al-Asgah et al. (2016) documented that dietary Gracilaria arcuata meal inclusion up
to 30% did not affect the survival of African catfish. The different results were associated with
both seaweed and aquatic animal species. Shrimp fed with UM1 (T2D9) and UM3 (T2D8)
replacing the same levels of SBM as UM2 (T2D5) exhibited higher WG and lower FCR clearly
demonstrating differences across batches. Although UM2 produced the poorest result, UM3 also
resulted in significant reduction in growth.
Given the balanced nutrient composition of the test diets (Table 5b) and identical FM
level across all the treatments, nutrient imbalances and palatability shift can be eliminated as the
problems caused growth depression. The diet supplemented with UM1 (T2D9) contained highest
mineral contents among the test diets, whereas the shrimp fed this diet performed the best
compared to those fed with UM2 and UM3 replacing the same levels of SBM, which pointed out
high mineral composition was not the problem led to the reduced growth and survival. Low
nutrient availability of Ulva meal should be one of the potential problem result in growth
reduction, which can be mediated by formulating diets on a digestible basis.
To elucidate if digestible protein was limiting growth, a third trial was initiated for which
feeds were formulated on a digestible protein basis. In trial 3, four diets utilized high levels of
191
Ulva meal from three batches to replace SBM on the digestible basis. Since methionine and
lysine are typically the two most limiting amino acids in shrimp feeds, they are also balanced on
the digestible basis. Results indicated that no significant differences in terms of WG, FCR, and
survival were detected in the diets contained UM1, however, significantly reduced growth and
survival as well as increased FCR were determined when shrimp fed with the diet contained
UM2. With regards to the supplementation of UM3, no differences were detected in WG and
FCR, however, survival was significantly reduced. The same trend for the WG was observed in
trial 2, in which reduced growth and survival as well as increased FCR were also observed for
shrimp fed with the diet supplemented with UM2. Although UM1 contained the highest level of
minerals among the three batches of Ulva meal (UM1-3), shrimp fed with UM1 performed the
best in terms of WG, FCR and survival, which also help to exclude minerals as one of the
problem. There must be some other factors affecting the growth of shrimp. The limited reduction
in performance of shrimp offered high levels of UM1 and UM3 indicated that part of the
problem is probably due to low digestibility of Ulva meal. However, this did not solve the
problem for UM2 which has both poor survival and growth. One theory that has been advanced
is that the Ulva sp. contains certain anti-nutritional factors or secretes certain secondary
poisonous metabolites which are detrimental for shrimp. However, identification of the specific
ANF or secondary poisonous metabolites was not available and beyond the scope of the current
study.
As the protein content of seaweed is tied to culture conditions, the high protein content of
Ulva meal can be achieved by culturing Ulva meal in water contains high nitrogen. The trial 4
evaluated the fourth batch Ulva meal which exhibited higher protein content (38.16%) than
UM1-3 as a replacement for FM and SBM. In general, there was a decreasing trend of WG and
192
survival as the inclusion levels of UM4 increased (Figure 3a and 3d), which was in accordance
with previous trials. Shrimp fed with diets contained UM4 exhibited significantly reduced WG as
inclusion level of UM4 increases. Survival was significantly reduced when 9.5% UM4 was
incorporated in the diet to replace 6% FM.
4.4. Body compositions
In the current study, there was a consistently decreasing trend of whole body lipid content
as inclusion rates of Ulva meal increased in trial 1, 2, and 4. Significant difference in lipid
content was detected when UM1-3 were supplemented at more than 6.35, 10, and 9.5%,
respectively, in trial 1, 2, and 4. Similarly, Al-Asgah et al. (2016) recorded lipid content of
carcass was significantly reduced when more than 20% Gracilaria arcuata meal was
supplemented in the diets for African catfish. However, other authors did not report differences
in lipid content of whole body (Abdel-Warith et al., 2016, Emre et al., 2013, Felix and Brindo,
2014, Güroy et al., 2013, Güroy et al., 2007, Marinho et al., 2013, Rodríguez-González et al.,
2014, Soler-Vila et al., 2009, Valente et al., 2016, Valente et al., 2006, Yildirim et al., 2009).
The significantly reduced lipid content in the present study would be a result of comparatively
lower energy availability in the Ulva meal in contrast with the that in the FM and SBM.
Among the first three batches of Ulva meal, shrimp fed with UM2 exhibited significantly
lower lipid content of whole body compared to those fed with diets contained UM1 and UM3
replacing the same levels of SBM in trial 2. Similarly, shrimp fed with the diet contained UM2
formulating on the digestible protein basis exhibited significantly lower lipid content than those
fed with diets contain UM1 and UM3 in trial 3. The relatively lower lipid content in shrimp fed
with UM2 would be attributed to the significantly lower energy digestibility in UM2.
193
Protein content was significantly improved when more than 10% UM2 was included in
the diets in trial 2. Similarly, in trial 4, significantly improved protein content was detected when
24% UM4 was incorporated in the diet. However, no significantly differences were observed in
the protein content in trial 1 and trial 3. A number of studies did not observe differences in the
protein content of whole body in a variety of aquatic animals (Emre et al., 2013, Felix and
Brindo, 2014, Güroy et al., 2013, Güroy et al., 2007, Valente et al., 2016, Valente et al., 2006,
Yildirim et al., 2009). By contrast, improvements in protein content were detected in African
catfish (Al-Asgah et al., 2016) and rainbow trout (Soler-Vila et al., 2009) when they are fed with
diets contained seaweed meals. The significantly improved protein content in the present study
might be an indirectly response to the dramatically reduced lipid content of shrimp body. As a
result of the enhanced protein content in trial 2, total amino acids and most individual amino
acids concentrations in shrimp body were improved in the treatments supplemented with Ulva
meal. Significant improvements were detected in the contents of arginine, cysteine, glycine,
histidine, lysine, methionine, and phenylalanine. In trial 3, no differences were determined in
total amino acids and most of individual amino acids except methionine contents in shrimp body,
which was in accordance with the unaffected protein content.
4.5. Protein and amino acid retention
In the present study, there were clearly decreasing trends of protein retention as Ulva
meal levels increased in trial 1, 2, and 4. Protein retention was determined by a number of factors
including dietary protein levels, feed offered, final weight, and initial weight of animals as well
as the final and initial protein content of animals (Halver and Hardy, 2002). In trial 1, 2, and 4,
the diets were balanced on an isonitrogenous basis. No difference was detected in the dietary
194
protein levels, feed offered and initial weight of shrimp. Although in trial 2 and trial 4, shrimp
fed with diets contained Ulva meal exhibited higher protein content of whole body, the improved
protein content cannot counteract the negative effects resulted by the significantly reduced
growth. Consequently, the significantly reduced protein retention in trial 1, 2, and 4 followed the
trends of decreased final mean weight as inclusion rates of Ulva meal enhanced. Similarly, a
number of studies have documented negative effects of seaweed meals on the protein retention in
Nile tilapia (Marinho et al., 2013), rainbow trout (Güroy et al., 2013, Soler-Vila et al., 2009,
Yildirim et al., 2009) and European sea bass (Valente et al., 2006).In trial 2, the dramatically
depressed protein retention translated to the significantly reduced amino acids retention. In
general, total amino acids and individual amino acid retention followed the decreasing trend of
protein retention as UM2 inclusion rate increased.
In trial 3, protein retention was significantly reduced when shrimp fed with diets
contained UM2 and UM3 compared to those fed with the reference diet. Among the diets
contained three batches of Ulva meal, shrimp fed diets contained UM2 performed the worst with
regards to protein retention compared to those fed with the diets supplemented with UM1 and
UM3. The test diets in trial 2 were formulated on the digestible basis. As protein digestibility of
Ulva meal is lower than that of SBM for which it substituted, more Ulva meal were included in
the diets resulting in higher protein contents in the diets supplemented with Ulva meal than the
reference diet. No differences were detected in feed offered, initial weight of shrimp, and final
and initial protein content of shrimp body. The reduced protein retention would be attributed to
the reduced final mean weight. There were reasonable correspondences between the amino acids
retention and protein retention. Total amino acids and individual amino acids retention in the
treatment contained UM2 were significantly depressed than other treatments.
195
5. Conclusions
Under the reported conditions of this study, the results demonstrated a clear depressing in
the growth of shrimp when fish meal or soybean meal was replaced by Ulva meal. Among the
first three batches of Ulva meal (UM1-3), the second batch Ulva meal produced the worst result.
The low nutrient availability of Ulva meal in contrast with fish meal and soybean meal would be
part of the problems resulting in the growth depression. Other possible reasons which are beyond
the scope of this project but would include anti-nutrients present in the algae.
196
References Abdel-Warith, A.W., Younis el, S.M. & Al-Asgah, N.A. (2016) Potential use of green
macroalgae Ulva lactuca as a feed supplement in diets on growth performance, feed
utilization and body composition of the African catfish, Clarias gariepinus. Saudi. J.
Biol. Sci. 23, 404-409.
Al-Asgah, N.A., Younis el, S.M., Abdel-Warith, A.W. & Shamlol, F.S. (2016) Evaluation of red
seaweed Gracilaria arcuata as dietary ingredient in African catfish, Clarias gariepinus.
Saudi. J. Biol. Sci. 23, 205-210.
Amaya, E., Davis, D.A. & Rouse, D.B. (2007a) Alternative diets for the Pacific white shrimp
Litopenaeus vannamei. Aquaculture 262, 419-425.
Amaya, E.A., Davis, D.A. & Rouse, D.B. (2007b) Replacement of fish meal in practical diets for
the Pacific white shrimp Litopenaeus vannamei reared under pond conditions.
Aquaculture 262, 393-401.
Benjama, O. & Masniyom, P. (2011) Nutritional composition and physicochemical properties of
two green seaweeds (Ulva pertusa and U. intestinalis) from the Pattani Bay in Southern
Thailand. Sonklanakarin J. of Sci. Technol. 33, 575.
Brito, L.O., Arana, L.A.V., Soares, R.B., Severi, W., Miranda, R.H., da Silva, S.M.B.C.,
Coimbra, M.R.M. & Gálvez, A.O. (2014a) Water quality, phytoplankton composition and
growth of Litopenaeus vannamei (Boone) in an integrated biofloc system with Gracilaria
birdiae (Greville) and Gracilaria domingensis (Kützing). Aquac. Int. 22, 1649-1664.
Brito, L.O., Chagas, A.M., Silva, E.P.d., Soares, R.B., Severi, W. & Gálvez, A.O. (2014b) Water
quality, Vibrio density and growth of Pacific white shrimp Litopenaeus vannamei
197
(Boone) in an integrated biofloc system with red seaweed Gracilaria birdiae (Greville).
Aquac. Res. 47, 940-950.
Bureau, D.P., Hua, K. & Cho, C.Y. (2006) Effect of feeding level on growth and nutrient
deposition in rainbow trout (Oncorhynchus mykiss Walbaum) growing from 150 to 600 g.
Aquac. Res. 37, 1090-1098.
Cárdenas, J.V., Gálvez, A.O., Brito, L.O., Galarza, E.V., Pitta, D.C. & Rubin, V.V. (2015)
Assessment of different levels of green and brown seaweed meal in experimental diets
for whiteleg shrimp (Litopenaeus vannamei, Boone) in recirculating aquaculture system.
Aquac. Int. 23, 1491-1504.
Cho, C.Y., Slinger, S.J. & Bayley, H.S. (1982) Bioenergetics of Salmonid Fishes: Energy Intake,
Expenditure and Productivity. Comp. Biochem. physiol. 73, 25-41.
Cruz-Suárez, L.E., León, A., Peña-Rodríguez, A., Rodríguez-Peña, G., Moll, B. & Ricque-
Marie, D. (2010) Shrimp/Ulva co-culture: a sustainable alternative to diminish the need
for artificial feed and improve shrimp quality. Aquaculture 301, 64-68.
Cruz-Suárez, L.E., Tapia-Salazar, M., Villarreal-Cavazos, D., Beltran-Rocha, J., Nieto-López,
M.G., Lemme, A. & Ricque-Marie, D. (2009) Apparent dry matter, energy, protein and
amino acid digestibility of four soybean ingredients in white shrimp Litopenaeus
vannamei juveniles. Aquaculture 292, 87-94.
Cyrus, M.D., Bolton, J.J., Scholtz, R. & Macey, B.M. (2015) The advantages of Ulva
(Chlorophyta) as an additive in sea urchin formulated feeds: effects on palatability,
consumption and digestibility. Aquac. Nutr. 21, 578-591.
Davis, D.A. & Arnold, C. (2000) Replacement of fish meal in practical diets for the Pacific white
shrimp, Litopenaeus vannamei. Aquaculture 185, 291-298.
198
Dawczynski, C., Schäfer, U., Leiterer, M. & Jahreis, G. (2007) Nutritional and toxicological
importance of macro, trace, and ultra-trace elements in algae food products. J. Agric.
Food Chem, 55, 10470-10475.
El-Tawil, N.E. (2010) Effects of green seaweeds (Ulva sp.) as feed supplements in red tilapia
(Oreochromis sp.) diet on growth performance, feed utilization and body composition. J.
Arabian Aquac. Soc. 5, 179-193.
Emre, Y., Ergün, S., Kurtoğlu, A., Güroy, B. & Güroy, D. (2013) Effects of ulva meal on growth
performance of gilthead sea bream (Sparusaurata) at different levels of dietary lipid.
Turk. J. Fish. Aquat. Sci. 13, 841-846.
Ergün, S., Soyutürk, M., Güroy, B., Güroy, D. & Merrifield, D. (2009) Influence of Ulva meal
on growth, feed utilization, and body composition of juvenile Nile tilapia (Oreochromis
niloticus) at two levels of dietary lipid. Aquac. Int. 17, 355-361.
Fang, X., Yu, D., Buentello, A., Zeng, P. & Davis, D.A. (2016) Evaluation of new non-
genetically modified soybean varieties as ingredients in practical diets for Litopenaeus
vannamei. Aquaculture 451, 178-185.
Felix, N. & Brindo, R.A. (2014) Evaluation of raw and fermented seaweed, Ulva lactuca as feed
ingredient in giant freshwater prawn Macrobrachium rosenbergii. Int. J. Fish Aquac.
Stud. 1, 199-204.
Fleurence, J. (1999) Seaweed proteins: biochemical, nutritional aspects and potential uses.
Trends Food Sci. Technol. 10, 25-28.
Floreto, E.A., Teshima, S.-i. & Koshio, S. (1996) The effects of seaweed diets on the lipid and
fatty acids of the Japanese disc abalone Haliotis discus hannai. Fish. Sci. 62, 582-588.
199
Güroy, B., Ergün, S., Merrifield, D.L. & Güroy, D. (2013) Effect of autoclaved Ulva meal on
growth performance, nutrient utilization and fatty acid profile of rainbow trout,
Oncorhynchus mykiss. Aquac. Int. 21, 605-615.
Güroy, B.K., Cirik, Ş., Güroy, D., Sanver, F. & Tekinay, A.A. (2007) Effects of Ulva rigida and
Cystoseira barbata meals as a feed additive on growth performance, feed utilization, and
body composition of Nile tilapia, Oreochromis niloticus. Turk. J. Vet. Anim. Sci. 31, 91-
97.
Halver, J.E. & Hardy, R.W. (2002) Fish nutrition, Academic press.
Izzati, M. (2012) The role of seaweeds Sargassum polycistum and Gracilaria verrucosa on
growth performance and biomass production of tiger shrimp (Penaeous Monodon Fabr).
J Coast. Dev. 14, 235-241.
KAUSHIK, S. (2010) Taking The Fish-In Fish-Out Ratio A Step Further. Aquaculture 35, 1.
Lahaye, M., Gomez-Pinchetti, J.L., del Rio, M.J. & Garcia-Reina, G. (1995) Natural
decoloration, composition and increase in dietary fibre content of an edible marine algae,
Ulva rigida (Chlorophyta), grown under different nitrogen conditions. J. Sci. Food Agric.
68, 99-104.
Lee, S.Y., Chang, J.H. & Lee, S.B. (2014) Chemical composition, saccharification yield, and the
potential of the green seaweed Ulva pertusa. Biotechnol. Bioprocess Eng. 19, 1022-1033.
Lemos, D., Lawrence, A. & Siccardi, A. (2009) Prediction of apparent protein digestibility of
ingredients and diets by in vitro pH-stat degree of protein hydrolysis with species-specific
enzymes for juvenile Pacific white shrimp Litopenaeus vannamei. Aquaculture 295, 89-
98.
200
Liu, X.H., Ye, J.D., Kong, J.H., Wang, K. & Wang, A.l. (2013) Apparent digestibility of 12
protein-origin ingredients for Pacific white shrimp Litopenaeus vannamei. N. Am. J.
Aquac. 75, 90-98.
Lourenço, S.O., Barbarino, E., De�Paula, J.C., Pereira, L.O.d.S. & Marquez, U.M.L. (2002)
Amino acid composition, protein content and calculation of nitrogen to protein
conversion factors for 19 tropical seaweeds. Phycol. Res. 50, 233-241.
Ma, T. & Zuazaga, G. (1942) Micro-Kjeldahl determination of nitrogen. A new indicator and an
improved rapid method. Ind. Eng. Chem. Anal. Ed. 14, 280-282.
Marinho, G., Nunes, C., Sousa-Pinto, I., Pereira, R., Rema, P. & Valente, L.M.P. (2013) The
IMTA-cultivated Chlorophyta Ulva spp. as a sustainable ingredient in Nile tilapia
(Oreochromis niloticus) diets. J. Appl. Phycol. 25, 1359-1367.
Marinho�Soriano, E., Camara, M.R., Cabral, T.d.M. & Carneiro, M.A.d.A. (2007) Preliminary
evaluation of the seaweed Gracilaria cervicornis (Rhodophyta) as a partial substitute for
the industrial feeds used in shrimp (Litopenaeus vannamei) farming. Aquac. Res. 38, 182-
187.
McDermid, K.J. & Stuercke, B. (2003) Nutritional composition of edible Hawaiian seaweeds. J.
Appl. Phycol. 15, 513-524.
McGinnis, A.J. & Kasting, R. (1964) Digestion in insects, colorimetric analysis of chromic oxide
used to study food utilization by phytophagous insects. J. Agric. Food Chem. 12, 259-
262.
Ortiz, J., Romero, N., Robert, P., Araya, J., Lopez-Hernández, J., Bozzo, C., Navarrete, E.,
Osorio, A. & Rios, A. (2006) Dietary fiber, amino acid, fatty acid and tocopherol
201
contents of the edible seaweeds Ulva lactuca and Durvillaea antarctica. Food chem. 99,
98-104.
Pereira, R., Valente, L.M.P., Sousa-Pinto, I. & Rema, P. (2012) Apparent nutrient digestibility of
seaweeds by rainbow trout (Oncorhynchus mykiss) and Nile tilapia (Oreochromis
niloticus). Algal Res. 1, 77-82.
Pinchetti, J.L.G., del Campo Fernández, E., Díez, P.M. & Reina, G.G. (1998) Nitrogen
availability influences the biochemical composition and photosynthesis of tank-cultivated
Ulva rigida (Chlorophyta). J. Appl. Phycol. 10, 383-389.
Portillo-Clark, G., Casillas-Hernández, R., Servín-Villegas, R. & Magallón-Barajas, F.J. (2012)
Growth and survival of the juvenile yellowleg shrimp Farfantepenaeus californiensis
cohabiting with the green feather alga Caulerpa sertularioides at different temperatures.
Aquac. Res. 44, 22-30.
Qiu, X. & Davis, D. (2016a) Effects of dietary phytase supplementation on growth performance
and apparent digestibility coefficients of Pacific white shrimp Litopenaeus vannamei.
Aquac. Nutr. In press.
Qiu, X. & Davis, D.A. (2016b) Effects of dietary carbohydrase supplementation on performance
and apparent digestibility coefficients in Pacific white shrimp, Litopenaeus vannamei. J.
World Aquac. Soc. In press.
Rodríguez-González, H., Orduña-Rojas, J., Villalobos-Medina, J.P., García-Ulloa, M., Polanco-
Torres, A., López-Álvarez, E.S., Montoya-Mejía, M. & Hernández-Llamas, A. (2014)
Partial inclusion of Ulva lactuca and Gracilaria parvispora meal in balanced diets for
white leg shrimp (Litopenaeus vannamei). J. Appl. Phycol. 26, 2453-2459.
202
Roy, L.A., Bordinhon, A., Sookying, D., Davis, D.A., Brown, T.W. & Whitis, G.N. (2009)
Demonstration of alternative feeds for the Pacific white shrimp, Litopenaeus vannamei,
reared in low salinity waters of west Alabama. Aquac. Res. 40, 496-503.
Samocha, T.M., Davis, D.A., Saoud, I.P. & DeBault, K. (2004) Substitution of fish meal by co-
extruded soybean poultry by-product meal in practical diets for the Pacific white shrimp,
Litopenaeus vannamei. Aquaculture 231, 197-203.
Sargent, J. & Tacon, A. (1999) Development of farmed fish: a nutritionally necessary alternative
to meat. Proc. Nutri. Soc. 58, 377-383.
Soler-Vila, A., Coughlan, S., Guiry, M.D. & Kraan, S. (2009) The red alga Porphyra dioica as a
fish-feed ingredient for rainbow trout (Oncorhynchus mykiss): effects on growth, feed
efficiency, and carcass composition. J. Appl. Phycol. 21, 617-624.
Solorzano, L. (1969) Determination of ammonia in natural waters by the phenolhypochlorite
method. Limnology and Oceanography. Limnol. Oceanog. 14, 799-801.
Sookying, D. & Davis, D.A. (2011) Pond production of Pacific white shrimp (Litopenaeus
vannamei) fed high levels of soybean meal in various combinations. Aquaculture 319,
141-149.
Spotte, S. (1979) Fish and Invertebrate Culture: Water Managment in Closed Systems, 2nd
Edition., Wiley, New York.
Terrazas-Fierro, M., Civera-Cerecedo, R., Ibarra-Martínez, L., Goytortúa-Bores, E., Herrera-
Andrade, M. & Reyes-Becerra, A. (2010) Apparent digestibility of dry matter, protein,
and essential amino acid in marine feedstuffs for juvenile whiteleg shrimp Litopenaeus
vannamei. Aquaculture 308, 166-173.
203
Tsutsui, I., Kanjanaworakul, P., Srisapoome, P., Aue-umneoy, D. & Hamano, K. (2010) Growth
of giant tiger prawn, Penaeus monodon Fabricius, under co-culture with a discarded
filamentous seaweed, Chaetomorpha ligustica (Kützing) Kützing, at an aquarium-scale.
Aquac. Int. 18, 545-553.
Valente, L.M., Araújo, M., Batista, S., Peixoto, M.J., Sousa-Pinto, I., Brotas, V., Cunha, L.M. &
Rema, P. (2016) Carotenoid deposition, flesh quality and immunological response of Nile
tilapia fed increasing levels of IMTA-cultivated Ulva spp. J. Appl. Phycol. 28, 691-701.
Valente, L.M.P., Gouveia, A., Rema, P., Matos, J., Gomes, E.F. & Pinto, I.S. (2006) Evaluation
of three seaweeds Gracilaria bursa-pastoris, Ulva rigida and Gracilaria cornea as
dietary ingredients in European sea bass (Dicentrarchus labrax) juveniles. Aquaculture
252, 85-91.
Yang, Q., Zhou, X., Zhou, Q., Tan, B., Chi, S. & Dong, X. (2009) Apparent digestibility of
selected feed ingredients for white shrimp Litopenaeus vannamei, Boone. Aquac. Res. 41,
78-86.
Yildirim, Ö., Ergun, S., Yaman, S. & Turker, A. (2009) Effects of two seaweeds (Ulva lactuca
and Enteromorpha linza) as a feed additive in diets on growth performance, feed
utilization, and body composition of rainbow trout (Oncorhynchus mykiss). Kafkas. Univ.
Vet. Fak. Derg. 15, 455-460.
Zhou, Y.G., Davis, D. & Buentello, A. (2015) Use of new soybean varieties in practical diets for
the Pacific white shrimp, Litopenaeus vannamei. Aquac. Nutr. 21, 635-643.
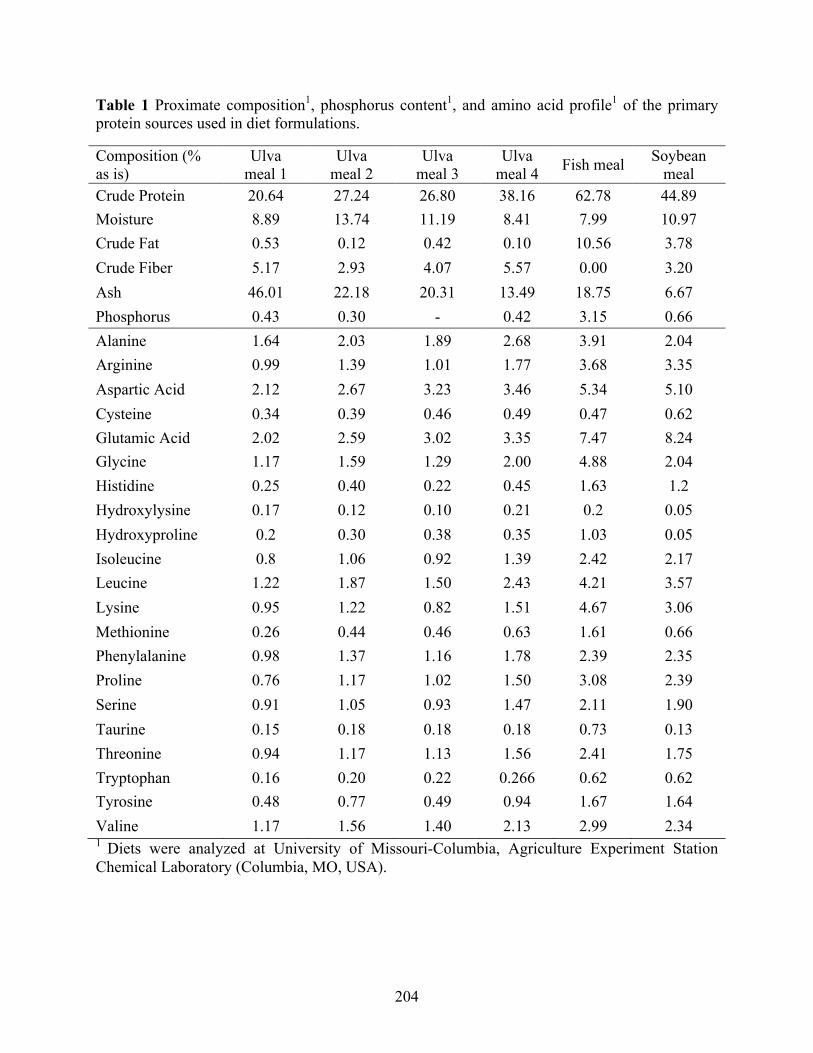
204
Table 1 Proximate composition1, phosphorus content1, and amino acid profile1 of the primary protein sources used in diet formulations.
Composition (% as is)
Ulva meal 1
Ulva meal 2
Ulva meal 3
Ulva meal 4 Fish meal Soybean
meal Crude Protein 20.64 27.24 26.80 38.16 62.78 44.89 Moisture 8.89 13.74 11.19 8.41 7.99 10.97 Crude Fat 0.53 0.12 0.42 0.10 10.56 3.78 Crude Fiber 5.17 2.93 4.07 5.57 0.00 3.20 Ash 46.01 22.18 20.31 13.49 18.75 6.67 Phosphorus 0.43 0.30 - 0.42 3.15 0.66 Alanine 1.64 2.03 1.89 2.68 3.91 2.04 Arginine 0.99 1.39 1.01 1.77 3.68 3.35 Aspartic Acid 2.12 2.67 3.23 3.46 5.34 5.10 Cysteine 0.34 0.39 0.46 0.49 0.47 0.62 Glutamic Acid 2.02 2.59 3.02 3.35 7.47 8.24 Glycine 1.17 1.59 1.29 2.00 4.88 2.04 Histidine 0.25 0.40 0.22 0.45 1.63 1.2 Hydroxylysine 0.17 0.12 0.10 0.21 0.2 0.05 Hydroxyproline 0.2 0.30 0.38 0.35 1.03 0.05 Isoleucine 0.8 1.06 0.92 1.39 2.42 2.17 Leucine 1.22 1.87 1.50 2.43 4.21 3.57 Lysine 0.95 1.22 0.82 1.51 4.67 3.06 Methionine 0.26 0.44 0.46 0.63 1.61 0.66 Phenylalanine 0.98 1.37 1.16 1.78 2.39 2.35 Proline 0.76 1.17 1.02 1.50 3.08 2.39 Serine 0.91 1.05 0.93 1.47 2.11 1.90 Taurine 0.15 0.18 0.18 0.18 0.73 0.13 Threonine 0.94 1.17 1.13 1.56 2.41 1.75 Tryptophan 0.16 0.20 0.22 0.266 0.62 0.62 Tyrosine 0.48 0.77 0.49 0.94 1.67 1.64 Valine 1.17 1.56 1.40 2.13 2.99 2.34 1 Diets were analyzed at University of Missouri-Columbia, Agriculture Experiment Station Chemical Laboratory (Columbia, MO, USA).
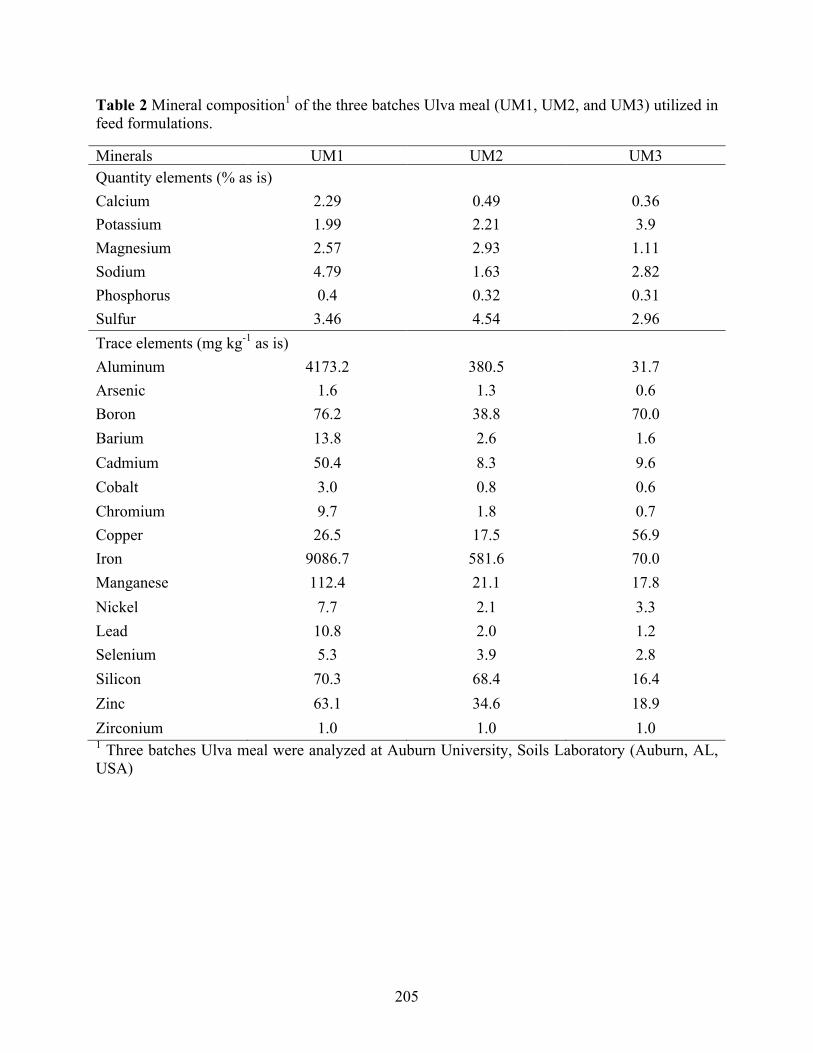
205
Table 2 Mineral composition1 of the three batches Ulva meal (UM1, UM2, and UM3) utilized in feed formulations.
Minerals UM1 UM2 UM3 Quantity elements (% as is) Calcium 2.29 0.49 0.36 Potassium 1.99 2.21 3.9 Magnesium 2.57 2.93 1.11 Sodium 4.79 1.63 2.82 Phosphorus 0.4 0.32 0.31 Sulfur 3.46 4.54 2.96 Trace elements (mg kg-1 as is) Aluminum 4173.2 380.5 31.7 Arsenic 1.6 1.3 0.6 Boron 76.2 38.8 70.0 Barium 13.8 2.6 1.6 Cadmium 50.4 8.3 9.6 Cobalt 3.0 0.8 0.6 Chromium 9.7 1.8 0.7 Copper 26.5 17.5 56.9 Iron 9086.7 581.6 70.0 Manganese 112.4 21.1 17.8 Nickel 7.7 2.1 3.3 Lead 10.8 2.0 1.2 Selenium 5.3 3.9 2.8 Silicon 70.3 68.4 16.4 Zinc 63.1 34.6 18.9 Zirconium 1.0 1.0 1.0 1 Three batches Ulva meal were analyzed at Auburn University, Soils Laboratory (Auburn, AL, USA)
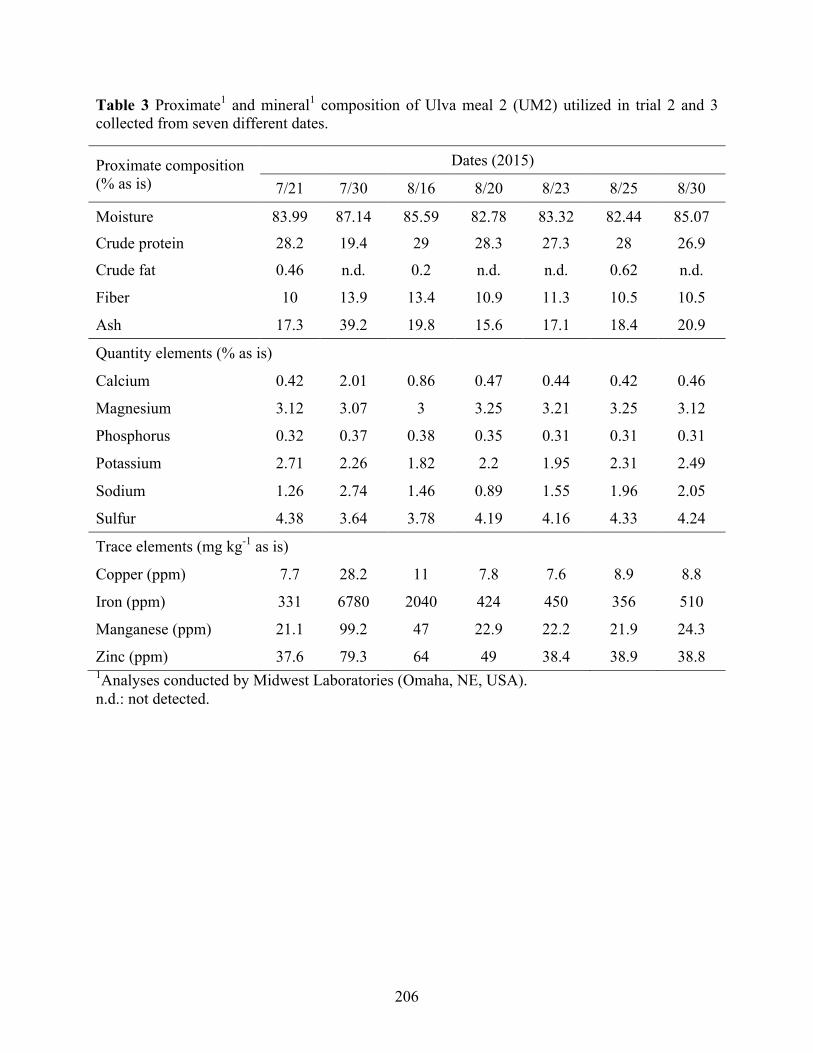
206
Table 3 Proximate1 and mineral1 composition of Ulva meal 2 (UM2) utilized in trial 2 and 3 collected from seven different dates.
Proximate composition (% as is)
Dates (2015)
7/21 7/30 8/16 8/20 8/23 8/25 8/30
Moisture 83.99 87.14 85.59 82.78 83.32 82.44 85.07
Crude protein 28.2 19.4 29 28.3 27.3 28 26.9
Crude fat 0.46 n.d. 0.2 n.d. n.d. 0.62 n.d.
Fiber 10 13.9 13.4 10.9 11.3 10.5 10.5
Ash 17.3 39.2 19.8 15.6 17.1 18.4 20.9
Quantity elements (% as is)
Calcium 0.42 2.01 0.86 0.47 0.44 0.42 0.46
Magnesium 3.12 3.07 3 3.25 3.21 3.25 3.12
Phosphorus 0.32 0.37 0.38 0.35 0.31 0.31 0.31
Potassium 2.71 2.26 1.82 2.2 1.95 2.31 2.49
Sodium 1.26 2.74 1.46 0.89 1.55 1.96 2.05
Sulfur 4.38 3.64 3.78 4.19 4.16 4.33 4.24
Trace elements (mg kg-1 as is)
Copper (ppm) 7.7 28.2 11 7.8 7.6 8.9 8.8
Iron (ppm) 331 6780 2040 424 450 356 510
Manganese (ppm) 21.1 99.2 47 22.9 22.2 21.9 24.3
Zinc (ppm) 37.6 79.3 64 49 38.4 38.9 38.8 1Analyses conducted by Midwest Laboratories (Omaha, NE, USA). n.d.: not detected.
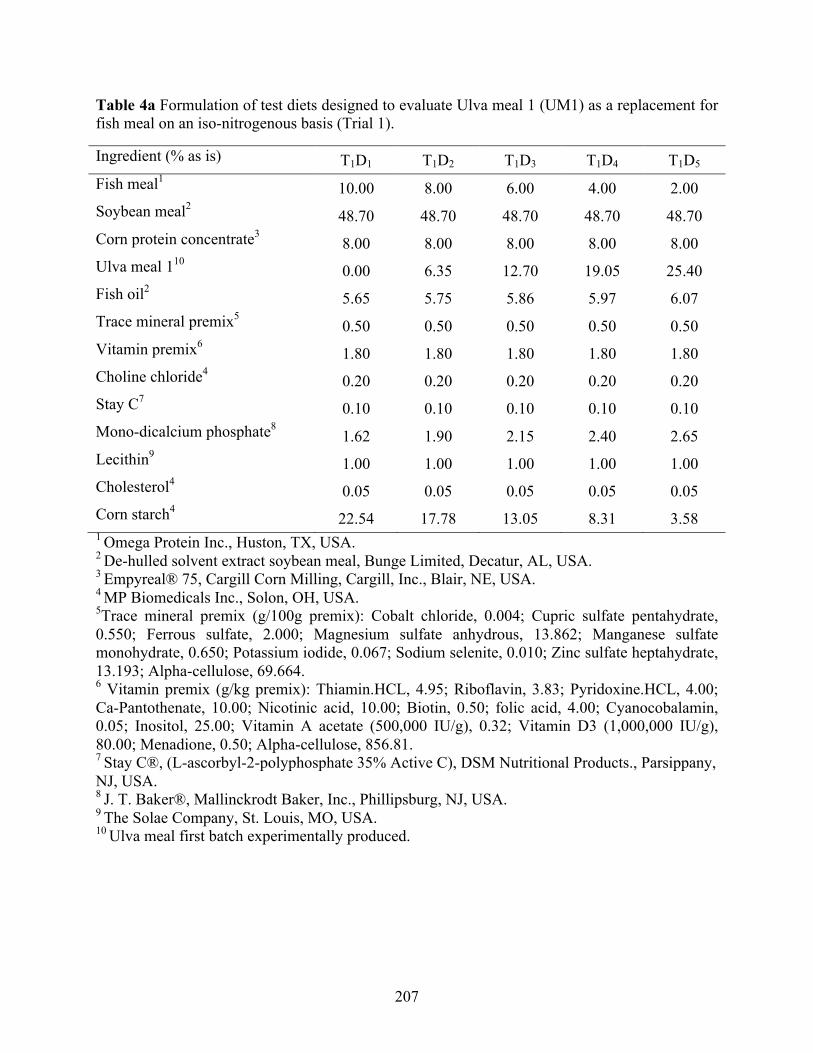
207
Table 4a Formulation of test diets designed to evaluate Ulva meal 1 (UM1) as a replacement for fish meal on an iso-nitrogenous basis (Trial 1).
Ingredient (% as is) T1D1 T1D2 T1D3 T1D4 T1D5 Fish meal1 10.00 8.00 6.00 4.00 2.00 Soybean meal2 48.70 48.70 48.70 48.70 48.70 Corn protein concentrate3 8.00 8.00 8.00 8.00 8.00 Ulva meal 110
0.00 6.35 12.70 19.05 25.40 Fish oil2 5.65 5.75 5.86 5.97 6.07 Trace mineral premix5 0.50 0.50 0.50 0.50 0.50 Vitamin premix6 1.80 1.80 1.80 1.80 1.80 Choline chloride4 0.20 0.20 0.20 0.20 0.20 Stay C7 0.10 0.10 0.10 0.10 0.10 Mono-dicalcium phosphate8 1.62 1.90 2.15 2.40 2.65 Lecithin9 1.00 1.00 1.00 1.00 1.00 Cholesterol4 0.05 0.05 0.05 0.05 0.05 Corn starch4 22.54 17.78 13.05 8.31 3.58 1 Omega Protein Inc., Huston, TX, USA. 2 De-hulled solvent extract soybean meal, Bunge Limited, Decatur, AL, USA. 3 Empyreal® 75, Cargill Corn Milling, Cargill, Inc., Blair, NE, USA. 4 MP Biomedicals Inc., Solon, OH, USA. 5Trace mineral premix (g/100g premix): Cobalt chloride, 0.004; Cupric sulfate pentahydrate, 0.550; Ferrous sulfate, 2.000; Magnesium sulfate anhydrous, 13.862; Manganese sulfate monohydrate, 0.650; Potassium iodide, 0.067; Sodium selenite, 0.010; Zinc sulfate heptahydrate, 13.193; Alpha-cellulose, 69.664. 6 Vitamin premix (g/kg premix): Thiamin.HCL, 4.95; Riboflavin, 3.83; Pyridoxine.HCL, 4.00; Ca-Pantothenate, 10.00; Nicotinic acid, 10.00; Biotin, 0.50; folic acid, 4.00; Cyanocobalamin, 0.05; Inositol, 25.00; Vitamin A acetate (500,000 IU/g), 0.32; Vitamin D3 (1,000,000 IU/g), 80.00; Menadione, 0.50; Alpha-cellulose, 856.81. 7 Stay C®, (L-ascorbyl-2-polyphosphate 35% Active C), DSM Nutritional Products., Parsippany, NJ, USA. 8 J. T. Baker®, Mallinckrodt Baker, Inc., Phillipsburg, NJ, USA. 9 The Solae Company, St. Louis, MO, USA. 10 Ulva meal first batch experimentally produced.
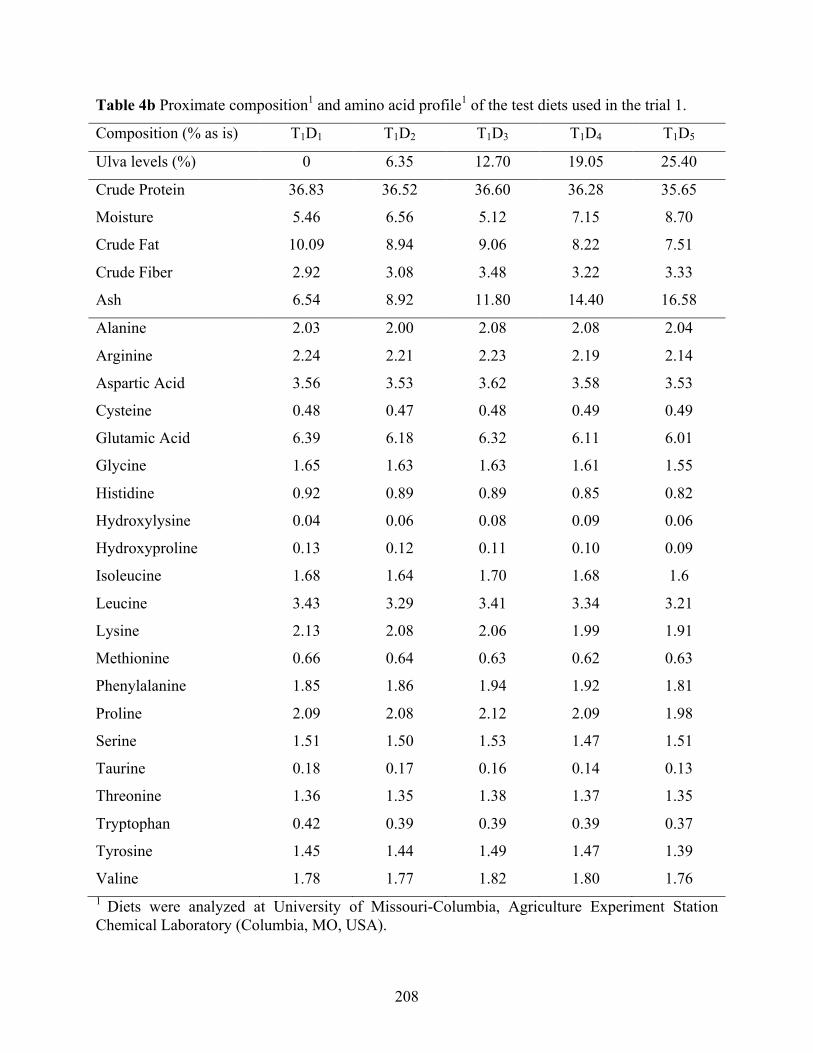
208
Table 4b Proximate composition1 and amino acid profile1 of the test diets used in the trial 1.
Composition (% as is) T1D1 T1D2 T1D3 T1D4 T1D5
Ulva levels (%) 0 6.35 12.70 19.05 25.40
Crude Protein 36.83 36.52 36.60 36.28 35.65
Moisture 5.46 6.56 5.12 7.15 8.70
Crude Fat 10.09 8.94 9.06 8.22 7.51
Crude Fiber 2.92 3.08 3.48 3.22 3.33
Ash 6.54 8.92 11.80 14.40 16.58
Alanine 2.03 2.00 2.08 2.08 2.04
Arginine 2.24 2.21 2.23 2.19 2.14
Aspartic Acid 3.56 3.53 3.62 3.58 3.53
Cysteine 0.48 0.47 0.48 0.49 0.49
Glutamic Acid 6.39 6.18 6.32 6.11 6.01
Glycine 1.65 1.63 1.63 1.61 1.55
Histidine 0.92 0.89 0.89 0.85 0.82
Hydroxylysine 0.04 0.06 0.08 0.09 0.06
Hydroxyproline 0.13 0.12 0.11 0.10 0.09
Isoleucine 1.68 1.64 1.70 1.68 1.6
Leucine 3.43 3.29 3.41 3.34 3.21
Lysine 2.13 2.08 2.06 1.99 1.91
Methionine 0.66 0.64 0.63 0.62 0.63
Phenylalanine 1.85 1.86 1.94 1.92 1.81
Proline 2.09 2.08 2.12 2.09 1.98
Serine 1.51 1.50 1.53 1.47 1.51
Taurine 0.18 0.17 0.16 0.14 0.13
Threonine 1.36 1.35 1.38 1.37 1.35
Tryptophan 0.42 0.39 0.39 0.39 0.37
Tyrosine 1.45 1.44 1.49 1.47 1.39
Valine 1.78 1.77 1.82 1.80 1.76 1 Diets were analyzed at University of Missouri-Columbia, Agriculture Experiment Station Chemical Laboratory (Columbia, MO, USA).
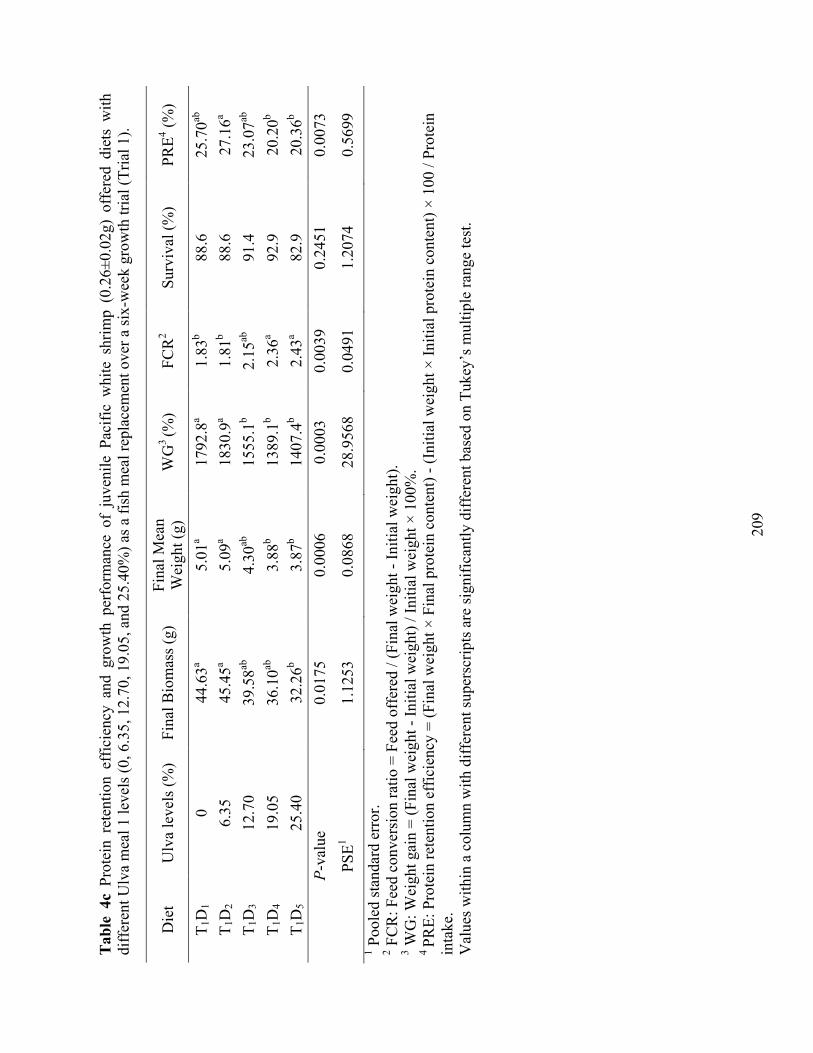
20
9
Tab
le 4
c Pr
otei
n re
tent
ion
effic
ienc
y an
d gr
owth
per
form
ance
of
juve
nile
Pac
ific
whi
te s
hrim
p (0
.26±
0.02
g) o
ffer
ed d
iets
with
di
ffer
ent U
lva
mea
l 1 le
vels
(0, 6
.35,
12.
70, 1
9.05
, and
25.
40%
) as
a fis
h m
eal r
epla
cem
ent o
ver a
six
-wee
k gr
owth
tria
l (Tr
ial 1
).
Die
t U
lva
leve
ls (%
) Fi
nal B
iom
ass
(g)
Fina
l Mea
n W
eigh
t (g)
W
G3 (%
) FC
R2
Surv
ival
(%)
PRE4 (%
)
T 1D
1 0
44.6
3a 5.
01a
1792
.8a
1.83
b 88
.6
25.7
0ab
T 1D
2 6.
35
45.4
5a 5.
09a
1830
.9a
1.81
b 88
.6
27.1
6a
T 1D
3 12
.70
39.5
8ab
4.30
ab
1555
.1b
2.15
ab
91.4
23
.07ab
T 1D
4 19
.05
36.1
0ab
3.88
b 13
89.1
b 2.
36a
92.9
20
.20b
T 1D
5 25
.40
32.2
6b 3.
87b
1407
.4b
2.43
a 82
.9
20.3
6b
P-va
lue
0.01
75
0.00
06
0.00
03
0.00
39
0.24
51
0.00
73
PSE1
1.12
53
0.08
68
28.9
568
0.04
91
1.20
74
0.56
99
1 Poo
led
stan
dard
err
or.
2 FC
R: F
eed
conv
ersi
on ra
tio =
Fee
d of
fere
d / (
Fina
l wei
ght -
Initi
al w
eigh
t).
3 WG
: Wei
ght g
ain
= (F
inal
wei
ght -
Initi
al w
eigh
t) / I
nitia
l wei
ght ×
100
%.
4 PR
E: P
rote
in re
tent
ion
effic
ienc
y =
(Fin
al w
eigh
t × F
inal
pro
tein
con
tent
) - (I
nitia
l wei
ght ×
Initi
al p
rote
in c
onte
nt) ×
100
/ Pr
otei
n in
take
. V
alue
s w
ithin
a c
olum
n w
ith d
iffer
ent s
uper
scrip
ts a
re s
igni
fican
tly d
iffer
ent b
ased
on
Tuke
y’s
mul
tiple
rang
e te
st.
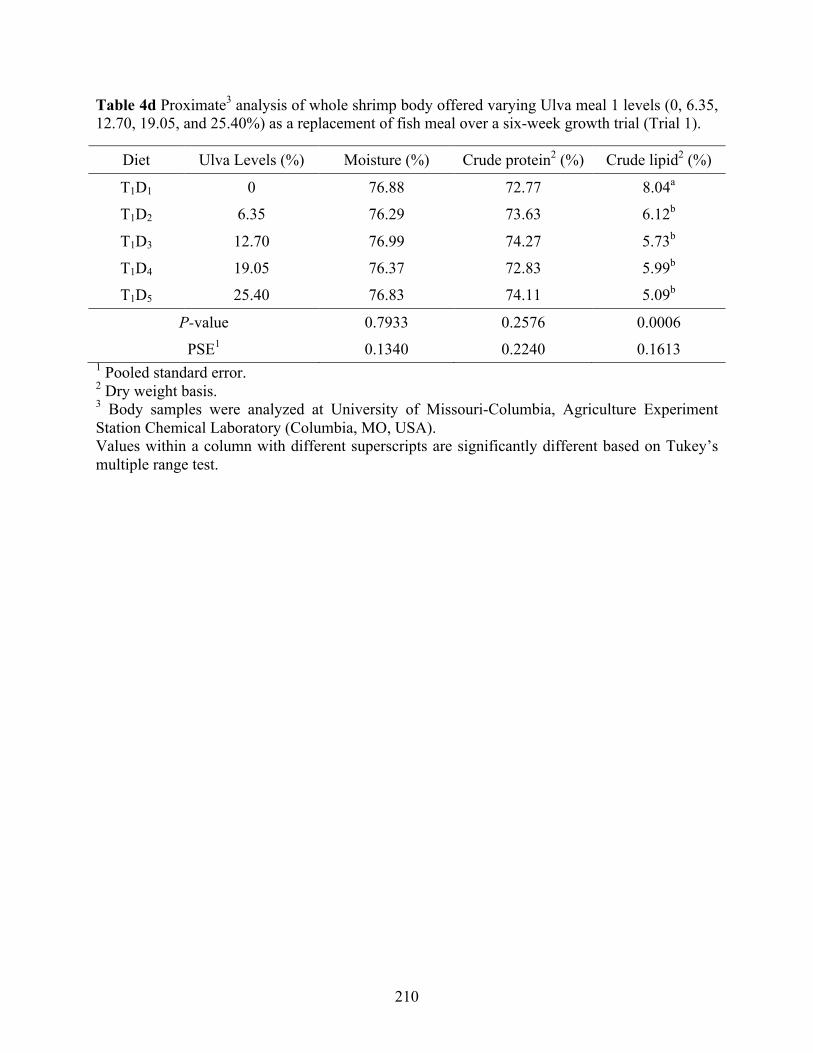
210
Table 4d Proximate3 analysis of whole shrimp body offered varying Ulva meal 1 levels (0, 6.35, 12.70, 19.05, and 25.40%) as a replacement of fish meal over a six-week growth trial (Trial 1).
Diet Ulva Levels (%) Moisture (%) Crude protein2 (%) Crude lipid2 (%)
T1D1 0 76.88 72.77 8.04a
T1D2 6.35 76.29 73.63 6.12b
T1D3 12.70 76.99 74.27 5.73b
T1D4 19.05 76.37 72.83 5.99b
T1D5 25.40 76.83 74.11 5.09b
P-value 0.7933 0.2576 0.0006
PSE1 0.1340 0.2240 0.1613 1 Pooled standard error. 2 Dry weight basis. 3 Body samples were analyzed at University of Missouri-Columbia, Agriculture Experiment Station Chemical Laboratory (Columbia, MO, USA). Values within a column with different superscripts are significantly different based on Tukey’s multiple range test.
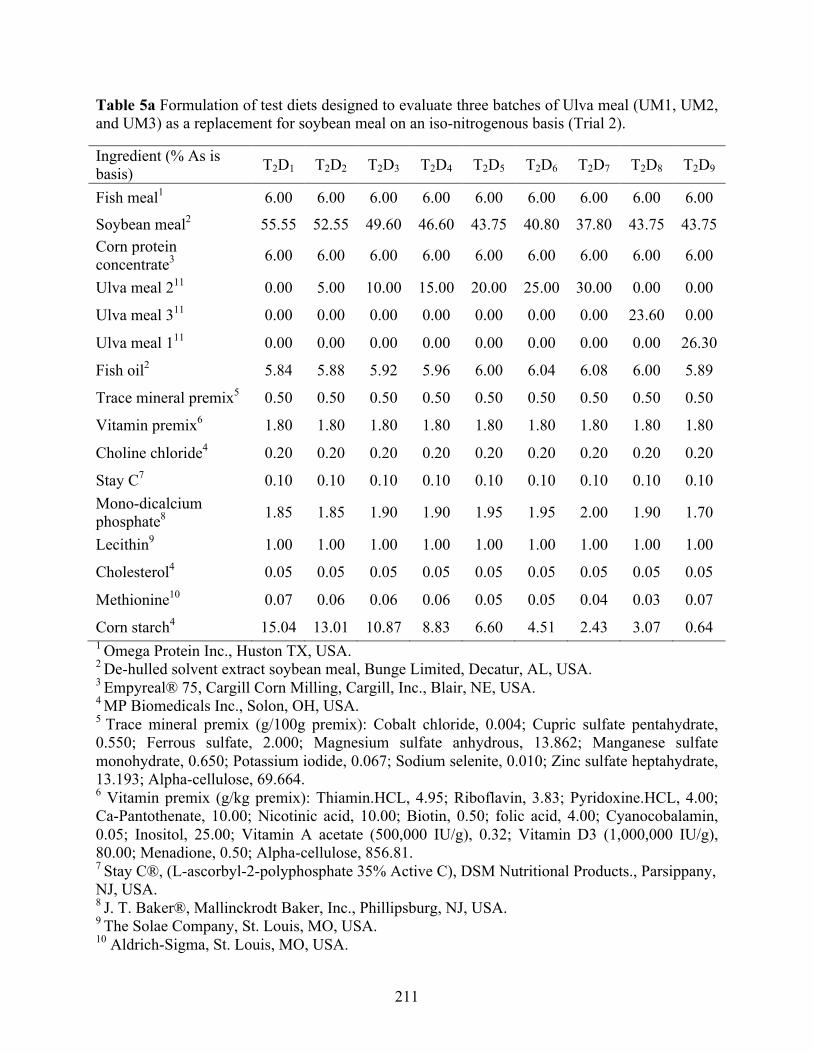
211
Table 5a Formulation of test diets designed to evaluate three batches of Ulva meal (UM1, UM2, and UM3) as a replacement for soybean meal on an iso-nitrogenous basis (Trial 2).
Ingredient (% As is basis) T2D1 T2D2 T2D3 T2D4 T2D5 T2D6 T2D7 T2D8 T2D9
Fish meal1 6.00 6.00 6.00 6.00 6.00 6.00 6.00 6.00 6.00
Soybean meal2 55.55 52.55 49.60 46.60 43.75 40.80 37.80 43.75 43.75 Corn protein concentrate3 6.00 6.00 6.00 6.00 6.00 6.00 6.00 6.00 6.00
Ulva meal 211 0.00 5.00 10.00 15.00 20.00 25.00 30.00 0.00 0.00
Ulva meal 311 0.00 0.00 0.00 0.00 0.00 0.00 0.00 23.60 0.00
Ulva meal 111 0.00 0.00 0.00 0.00 0.00 0.00 0.00 0.00 26.30
Fish oil2 5.84 5.88 5.92 5.96 6.00 6.04 6.08 6.00 5.89
Trace mineral premix5 0.50 0.50 0.50 0.50 0.50 0.50 0.50 0.50 0.50
Vitamin premix6 1.80 1.80 1.80 1.80 1.80 1.80 1.80 1.80 1.80
Choline chloride4 0.20 0.20 0.20 0.20 0.20 0.20 0.20 0.20 0.20
Stay C7 0.10 0.10 0.10 0.10 0.10 0.10 0.10 0.10 0.10 Mono-dicalcium phosphate8 1.85 1.85 1.90 1.90 1.95 1.95 2.00 1.90 1.70
Lecithin9 1.00 1.00 1.00 1.00 1.00 1.00 1.00 1.00 1.00
Cholesterol4 0.05 0.05 0.05 0.05 0.05 0.05 0.05 0.05 0.05
Methionine10 0.07 0.06 0.06 0.06 0.05 0.05 0.04 0.03 0.07
Corn starch4 15.04 13.01 10.87 8.83 6.60 4.51 2.43 3.07 0.64 1 Omega Protein Inc., Huston TX, USA. 2 De-hulled solvent extract soybean meal, Bunge Limited, Decatur, AL, USA. 3 Empyreal® 75, Cargill Corn Milling, Cargill, Inc., Blair, NE, USA. 4 MP Biomedicals Inc., Solon, OH, USA. 5 Trace mineral premix (g/100g premix): Cobalt chloride, 0.004; Cupric sulfate pentahydrate, 0.550; Ferrous sulfate, 2.000; Magnesium sulfate anhydrous, 13.862; Manganese sulfate monohydrate, 0.650; Potassium iodide, 0.067; Sodium selenite, 0.010; Zinc sulfate heptahydrate, 13.193; Alpha-cellulose, 69.664. 6 Vitamin premix (g/kg premix): Thiamin.HCL, 4.95; Riboflavin, 3.83; Pyridoxine.HCL, 4.00; Ca-Pantothenate, 10.00; Nicotinic acid, 10.00; Biotin, 0.50; folic acid, 4.00; Cyanocobalamin, 0.05; Inositol, 25.00; Vitamin A acetate (500,000 IU/g), 0.32; Vitamin D3 (1,000,000 IU/g), 80.00; Menadione, 0.50; Alpha-cellulose, 856.81. 7 Stay C®, (L-ascorbyl-2-polyphosphate 35% Active C), DSM Nutritional Products., Parsippany, NJ, USA. 8 J. T. Baker®, Mallinckrodt Baker, Inc., Phillipsburg, NJ, USA. 9 The Solae Company, St. Louis, MO, USA. 10 Aldrich-Sigma, St. Louis, MO, USA.

212
11 Three batches of Ulva meal experimentally produced.
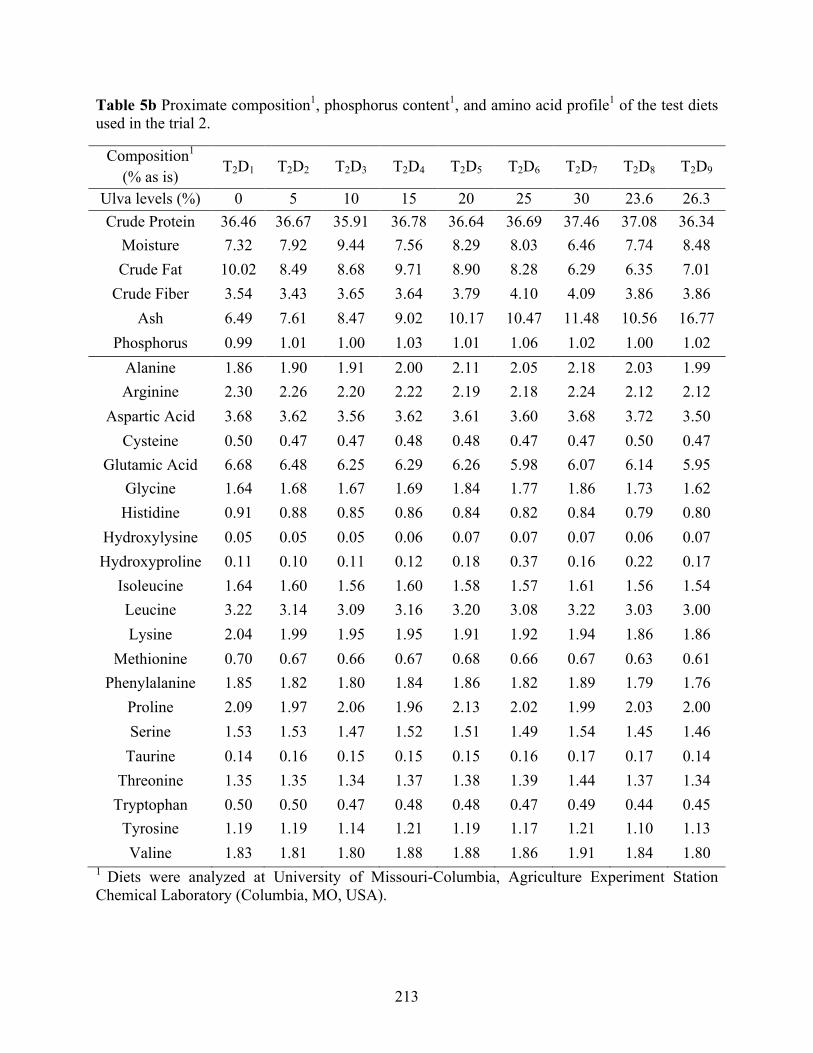
213
Table 5b Proximate composition1, phosphorus content1, and amino acid profile1 of the test diets used in the trial 2.
Composition1 (% as is)
T2D1 T2D2 T2D3 T2D4 T2D5 T2D6 T2D7 T2D8 T2D9
Ulva levels (%) 0 5 10 15 20 25 30 23.6 26.3 Crude Protein 36.46 36.67 35.91 36.78 36.64 36.69 37.46 37.08 36.34
Moisture 7.32 7.92 9.44 7.56 8.29 8.03 6.46 7.74 8.48 Crude Fat 10.02 8.49 8.68 9.71 8.90 8.28 6.29 6.35 7.01
Crude Fiber 3.54 3.43 3.65 3.64 3.79 4.10 4.09 3.86 3.86 Ash 6.49 7.61 8.47 9.02 10.17 10.47 11.48 10.56 16.77
Phosphorus 0.99 1.01 1.00 1.03 1.01 1.06 1.02 1.00 1.02 Alanine 1.86 1.90 1.91 2.00 2.11 2.05 2.18 2.03 1.99 Arginine 2.30 2.26 2.20 2.22 2.19 2.18 2.24 2.12 2.12
Aspartic Acid 3.68 3.62 3.56 3.62 3.61 3.60 3.68 3.72 3.50 Cysteine 0.50 0.47 0.47 0.48 0.48 0.47 0.47 0.50 0.47
Glutamic Acid 6.68 6.48 6.25 6.29 6.26 5.98 6.07 6.14 5.95 Glycine 1.64 1.68 1.67 1.69 1.84 1.77 1.86 1.73 1.62
Histidine 0.91 0.88 0.85 0.86 0.84 0.82 0.84 0.79 0.80 Hydroxylysine 0.05 0.05 0.05 0.06 0.07 0.07 0.07 0.06 0.07 Hydroxyproline 0.11 0.10 0.11 0.12 0.18 0.37 0.16 0.22 0.17
Isoleucine 1.64 1.60 1.56 1.60 1.58 1.57 1.61 1.56 1.54 Leucine 3.22 3.14 3.09 3.16 3.20 3.08 3.22 3.03 3.00 Lysine 2.04 1.99 1.95 1.95 1.91 1.92 1.94 1.86 1.86
Methionine 0.70 0.67 0.66 0.67 0.68 0.66 0.67 0.63 0.61 Phenylalanine 1.85 1.82 1.80 1.84 1.86 1.82 1.89 1.79 1.76
Proline 2.09 1.97 2.06 1.96 2.13 2.02 1.99 2.03 2.00 Serine 1.53 1.53 1.47 1.52 1.51 1.49 1.54 1.45 1.46
Taurine 0.14 0.16 0.15 0.15 0.15 0.16 0.17 0.17 0.14 Threonine 1.35 1.35 1.34 1.37 1.38 1.39 1.44 1.37 1.34
Tryptophan 0.50 0.50 0.47 0.48 0.48 0.47 0.49 0.44 0.45 Tyrosine 1.19 1.19 1.14 1.21 1.19 1.17 1.21 1.10 1.13 Valine 1.83 1.81 1.80 1.88 1.88 1.86 1.91 1.84 1.80
1 Diets were analyzed at University of Missouri-Columbia, Agriculture Experiment Station Chemical Laboratory (Columbia, MO, USA).
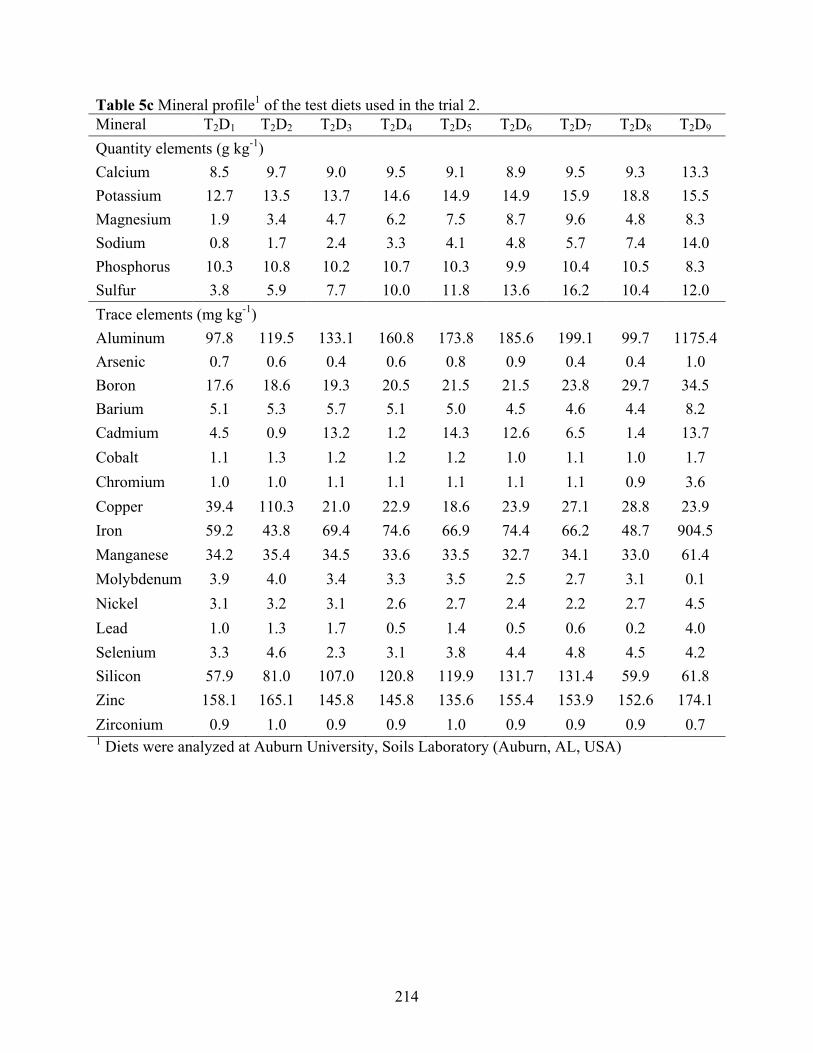
214
Table 5c Mineral profile1 of the test diets used in the trial 2. Mineral T2D1 T2D2 T2D3 T2D4 T2D5 T2D6 T2D7 T2D8 T2D9 Quantity elements (g kg-1) Calcium 8.5 9.7 9.0 9.5 9.1 8.9 9.5 9.3 13.3 Potassium 12.7 13.5 13.7 14.6 14.9 14.9 15.9 18.8 15.5 Magnesium 1.9 3.4 4.7 6.2 7.5 8.7 9.6 4.8 8.3 Sodium 0.8 1.7 2.4 3.3 4.1 4.8 5.7 7.4 14.0 Phosphorus 10.3 10.8 10.2 10.7 10.3 9.9 10.4 10.5 8.3 Sulfur 3.8 5.9 7.7 10.0 11.8 13.6 16.2 10.4 12.0 Trace elements (mg kg-1) Aluminum 97.8 119.5 133.1 160.8 173.8 185.6 199.1 99.7 1175.4 Arsenic 0.7 0.6 0.4 0.6 0.8 0.9 0.4 0.4 1.0 Boron 17.6 18.6 19.3 20.5 21.5 21.5 23.8 29.7 34.5 Barium 5.1 5.3 5.7 5.1 5.0 4.5 4.6 4.4 8.2 Cadmium 4.5 0.9 13.2 1.2 14.3 12.6 6.5 1.4 13.7 Cobalt 1.1 1.3 1.2 1.2 1.2 1.0 1.1 1.0 1.7 Chromium 1.0 1.0 1.1 1.1 1.1 1.1 1.1 0.9 3.6 Copper 39.4 110.3 21.0 22.9 18.6 23.9 27.1 28.8 23.9 Iron 59.2 43.8 69.4 74.6 66.9 74.4 66.2 48.7 904.5 Manganese 34.2 35.4 34.5 33.6 33.5 32.7 34.1 33.0 61.4 Molybdenum 3.9 4.0 3.4 3.3 3.5 2.5 2.7 3.1 0.1 Nickel 3.1 3.2 3.1 2.6 2.7 2.4 2.2 2.7 4.5 Lead 1.0 1.3 1.7 0.5 1.4 0.5 0.6 0.2 4.0 Selenium 3.3 4.6 2.3 3.1 3.8 4.4 4.8 4.5 4.2 Silicon 57.9 81.0 107.0 120.8 119.9 131.7 131.4 59.9 61.8 Zinc 158.1 165.1 145.8 145.8 135.6 155.4 153.9 152.6 174.1 Zirconium 0.9 1.0 0.9 0.9 1.0 0.9 0.9 0.9 0.7 1 Diets were analyzed at Auburn University, Soils Laboratory (Auburn, AL, USA)
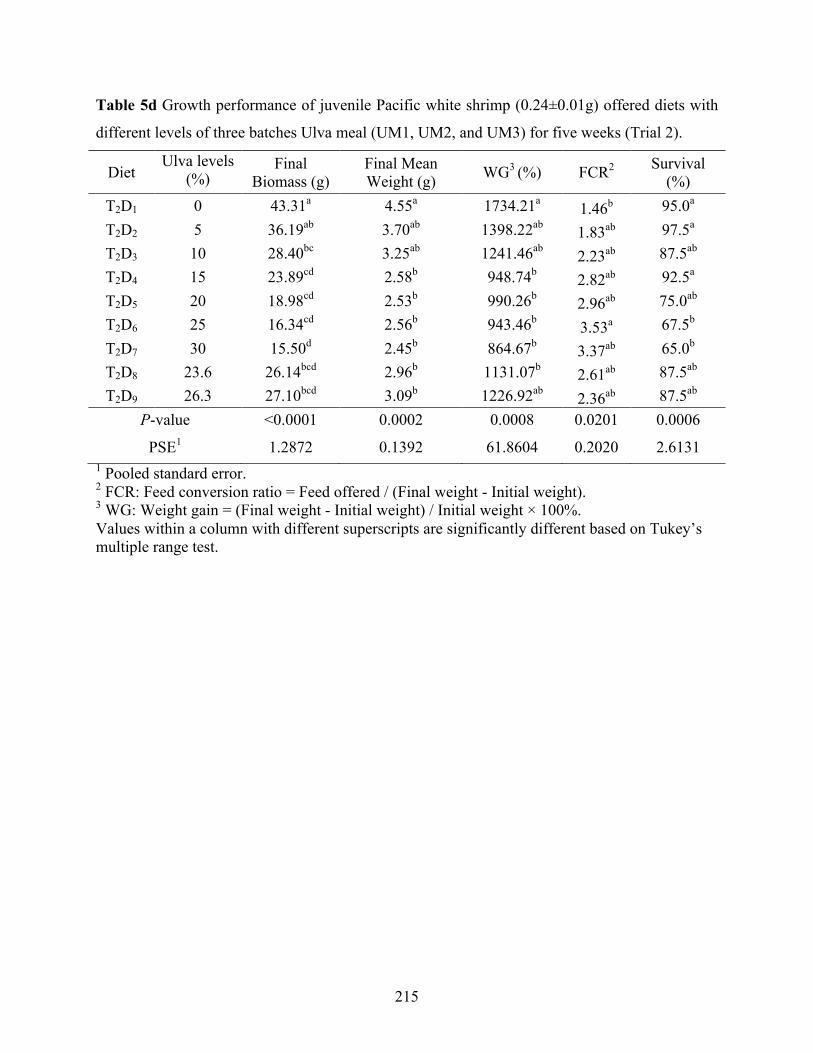
215
Table 5d Growth performance of juvenile Pacific white shrimp (0.24±0.01g) offered diets with
different levels of three batches Ulva meal (UM1, UM2, and UM3) for five weeks (Trial 2).
Diet Ulva levels
(%) Final
Biomass (g) Final Mean Weight (g) WG3 (%) FCR2 Survival
(%) T2D1 0 43.31a 4.55a 1734.21a 1.46b 95.0a
T2D2 5 36.19ab 3.70ab 1398.22ab 1.83ab 97.5a
T2D3 10 28.40bc 3.25ab 1241.46ab 2.23ab 87.5ab
T2D4 15 23.89cd 2.58b 948.74b 2.82ab 92.5a
T2D5 20 18.98cd 2.53b 990.26b 2.96ab 75.0ab
T2D6 25 16.34cd 2.56b 943.46b 3.53a 67.5b
T2D7 30 15.50d 2.45b 864.67b 3.37ab 65.0b
T2D8 23.6 26.14bcd 2.96b 1131.07b 2.61ab 87.5ab
T2D9 26.3 27.10bcd 3.09b 1226.92ab 2.36ab 87.5ab
P-value <0.0001 0.0002 0.0008 0.0201 0.0006
PSE1 1.2872 0.1392 61.8604 0.2020 2.6131 1 Pooled standard error. 2 FCR: Feed conversion ratio = Feed offered / (Final weight - Initial weight). 3 WG: Weight gain = (Final weight - Initial weight) / Initial weight × 100%. Values within a column with different superscripts are significantly different based on Tukey’s multiple range test.
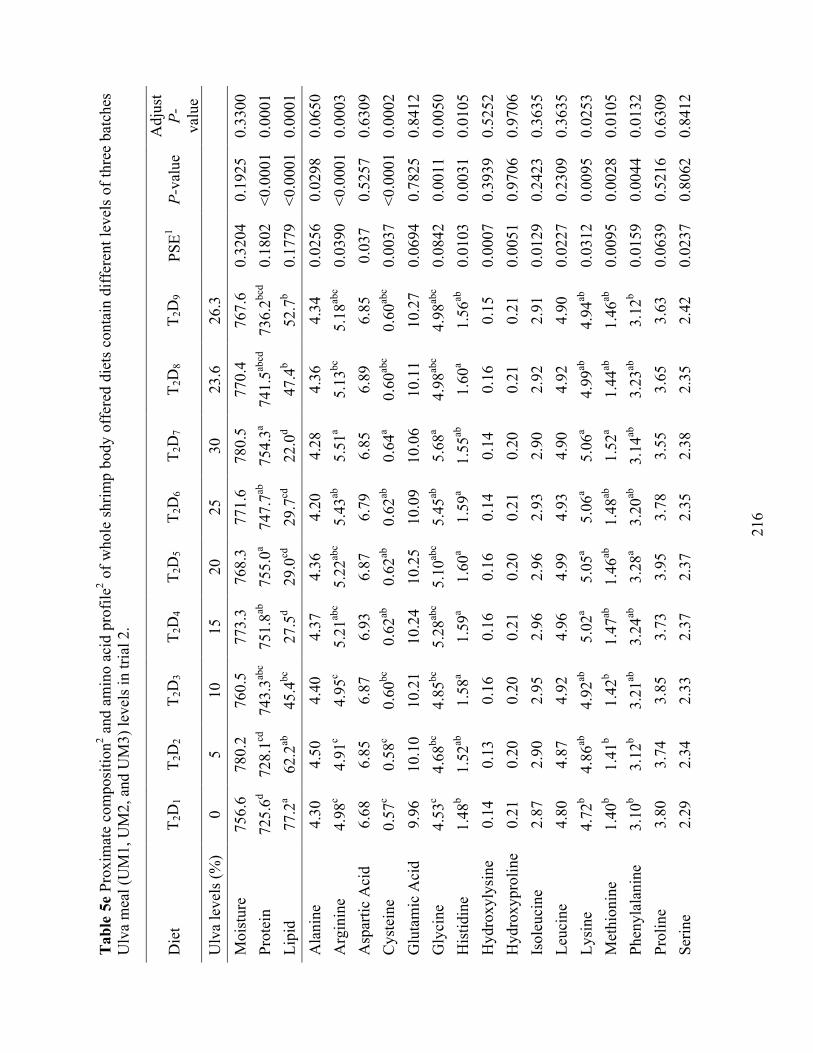
21
6
Tab
le 5
e Pr
oxim
ate
com
posi
tion2 a
nd a
min
o ac
id p
rofil
e2 of w
hole
shr
imp
body
off
ered
die
ts c
onta
in d
iffer
ent l
evel
s of
thre
e ba
tche
s U
lva
mea
l (U
M1,
UM
2, a
nd U
M3)
leve
ls in
tria
l 2.
Die
t T 2
D1
T 2D
2 T 2
D3
T 2D
4 T 2
D5
T 2D
6 T 2
D7
T 2D
8 T 2
D9
PSE1
P-va
lue
Adj
ust
P- valu
e U
lva
leve
ls (%
) 0
5 10
15
20
25
30
23
.6
26.3
Moi
stur
e 75
6.6
780.
2 76
0.5
773.
3 76
8.3
771.
6 78
0.5
770.
4 76
7.6
0.32
04
0.19
25
0.33
00
Prot
ein
725.
6d 72
8.1cd
74
3.3ab
c 75
1.8ab
75
5.0a
747.
7ab
754.
3a 74
1.5ab
cd
736.
2bcd
0.18
02
<0.0
001
0.00
01
Lipi
d 77
.2a
62.2
ab
45.4
bc
27.5
d 29
.0cd
29
.7cd
22
.0d
47.4
b 52
.7b
0.17
79
<0.0
001
0.00
01
Ala
nine
4.
30
4.50
4.
40
4.37
4.
36
4.20
4.
28
4.36
4.
34
0.02
56
0.02
98
0.06
50
Arg
inin
e 4.
98c
4.91
c 4.
95c
5.21
abc
5.22
abc
5.43
ab
5.51
a 5.
13bc
5.
18ab
c 0.
0390
<0
.000
1 0.
0003
A
spar
tic A
cid
6.68
6.
85
6.87
6.
93
6.87
6.
79
6.85
6.
89
6.85
0.
037
0.52
57
0.63
09
Cys
tein
e 0.
57c
0.58
c 0.
60bc
0.
62ab
0.
62ab
0.
62ab
0.
64a
0.60
abc
0.60
abc
0.00
37
<0.0
001
0.00
02
Glu
tam
ic A
cid
9.96
10
.10
10.2
1 10
.24
10.2
5 10
.09
10.0
6 10
.11
10.2
7 0.
0694
0.
7825
0.
8412
G
lyci
ne
4.53
c 4.
68bc
4.
85bc
5.
28ab
c 5.
10ab
c 5.
45ab
5.
68a
4.98
abc
4.98
abc
0.08
42
0.00
11
0.00
50
His
tidin
e 1.
48b
1.52
ab
1.58
a 1.
59a
1.60
a 1.
59a
1.55
ab
1.60
a 1.
56ab
0.
0103
0.
0031
0.
0105
H
ydro
xyly
sine
0.
14
0.13
0.
16
0.16
0.
16
0.14
0.
14
0.16
0.
15
0.00
07
0.39
39
0.52
52
Hyd
roxy
prol
ine
0.21
0.
20
0.20
0.
21
0.20
0.
21
0.20
0.
21
0.21
0.
0051
0.
9706
0.
9706
Is
oleu
cine
2.
87
2.90
2.
95
2.96
2.
96
2.93
2.
90
2.92
2.
91
0.01
29
0.24
23
0.36
35
Leuc
ine
4.80
4.
87
4.92
4.
96
4.99
4.
93
4.90
4.
92
4.90
0.
0227
0.
2309
0.
3635
Ly
sine
4.
72b
4.86
ab
4.92
ab
5.02
a 5.
05a
5.06
a 5.
06a
4.99
ab
4.94
ab
0.03
12
0.00
95
0.02
53
Met
hion
ine
1.40
b 1.
41b
1.42
b 1.
47ab
1.
46ab
1.
48ab
1.
52a
1.44
ab
1.46
ab
0.00
95
0.00
28
0.01
05
Phen
ylal
anin
e 3.
10b
3.12
b 3.
21ab
3.
24ab
3.
28a
3.20
ab
3.14
ab
3.23
ab
3.12
b 0.
0159
0.
0044
0.
0132
Pr
olin
e 3.
80
3.74
3.
85
3.73
3.
95
3.78
3.
55
3.65
3.
63
0.06
39
0.52
16
0.63
09
Serin
e 2.
29
2.34
2.
33
2.37
2.
37
2.35
2.
38
2.35
2.
42
0.02
37
0.80
62
0.84
12
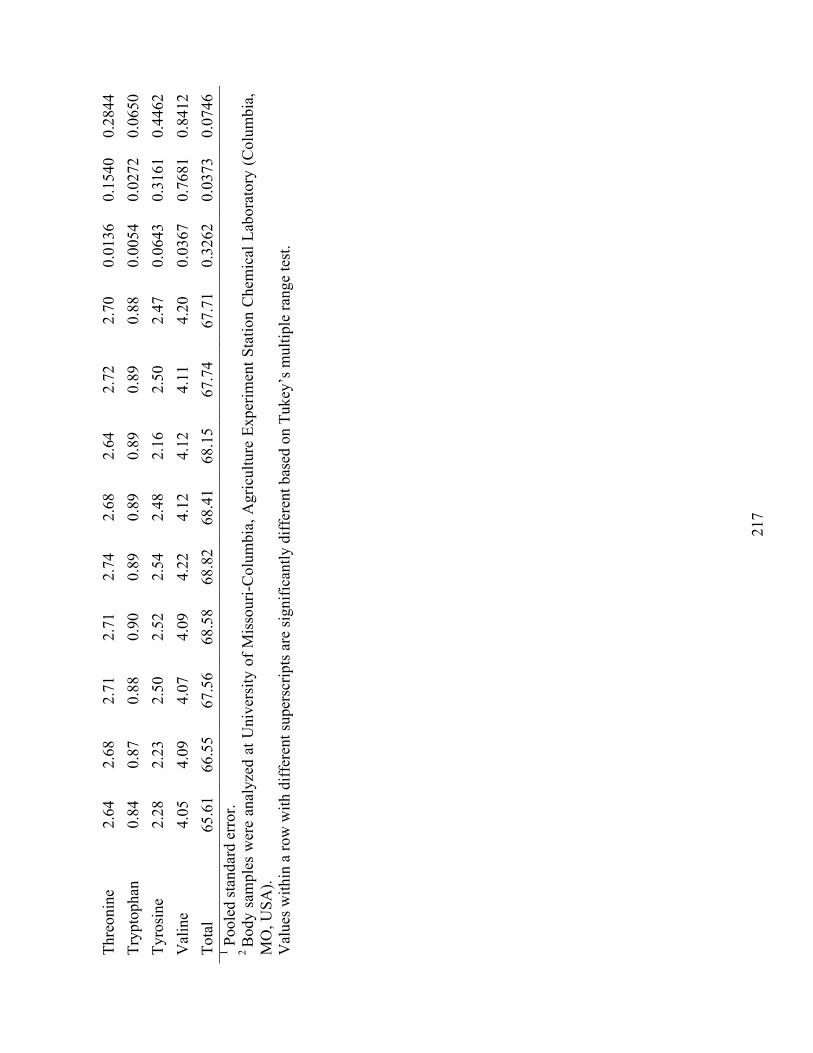
21
7
Thre
onin
e 2.
64
2.68
2.
71
2.71
2.
74
2.68
2.
64
2.72
2.
70
0.01
36
0.15
40
0.28
44
Tryp
toph
an
0.84
0.
87
0.88
0.
90
0.89
0.
89
0.89
0.
89
0.88
0.
0054
0.
0272
0.
0650
Ty
rosi
ne
2.28
2.
23
2.50
2.
52
2.54
2.
48
2.16
2.
50
2.47
0.
0643
0.
3161
0.
4462
V
alin
e 4.
05
4.09
4.
07
4.09
4.
22
4.12
4.
12
4.11
4.
20
0.03
67
0.76
81
0.84
12
Tota
l 65
.61
66.5
5 67
.56
68.5
8 68
.82
68.4
1 68
.15
67.7
4 67
.71
0.32
62
0.03
73
0.07
46
1 Poo
led
stan
dard
err
or.
2 B
ody
sam
ples
wer
e an
alyz
ed a
t Uni
vers
ity o
f Mis
sour
i-Col
umbi
a, A
gric
ultu
re E
xper
imen
t Sta
tion
Che
mic
al L
abor
ator
y (C
olum
bia,
M
O, U
SA).
Val
ues w
ithin
a ro
w w
ith d
iffer
ent s
uper
scrip
ts a
re si
gnifi
cant
ly d
iffer
ent b
ased
on
Tuke
y’s m
ultip
le ra
nge
test
.
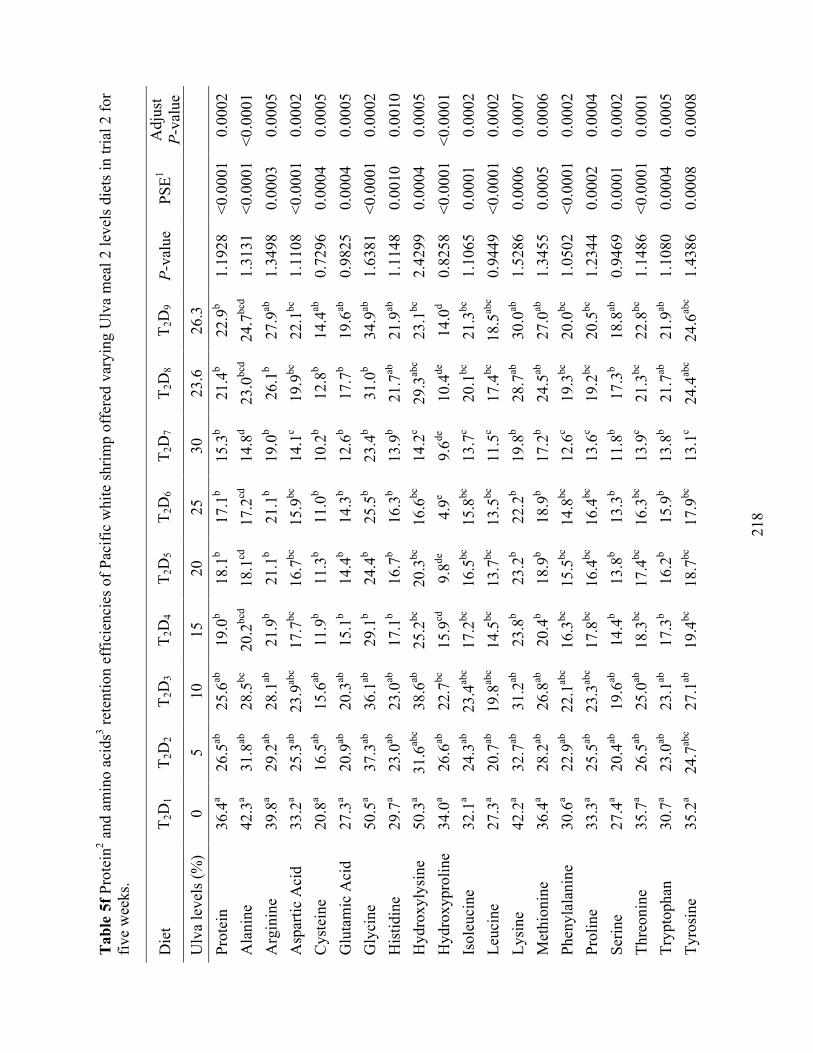
21
8
Tab
le 5
f Pro
tein
2 and
am
ino
acid
s3 rete
ntio
n ef
ficie
ncie
s of P
acifi
c w
hite
shrim
p of
fere
d va
ryin
g U
lva
mea
l 2 le
vels
die
ts in
tria
l 2 fo
r fiv
e w
eeks
.
Die
t T 2
D1
T 2D
2 T 2
D3
T 2D
4 T 2
D5
T 2D
6 T 2
D7
T 2D
8 T 2
D9
P-va
lue
PSE1
Adj
ust
P-va
lue
Ulv
a le
vels
(%)
0 5
10
15
20
25
30
23.6
26
.3
Prot
ein
36.4
a 26
.5ab
25
.6ab
19
.0b
18.1
b 17
.1b
15.3
b 21
.4b
22.9
b 1.
1928
<0
.000
1 0.
0002
A
lani
ne
42.3
a 31
.8ab
28
.5bc
20
.2bc
d 18
.1cd
17
.2cd
14
.8d
23.0
bcd
24.7
bcd
1.31
31
<0.0
001
<0.0
001
Arg
inin
e 39
.8a
29.2
ab
28.1
ab
21.9
b 21
.1b
21.1
b 19
.0b
26.1
b 27
.9ab
1.
3498
0.
0003
0.
0005
A
spar
tic A
cid
33.2
a 25
.3ab
23
.9ab
c 17
.7bc
16
.7bc
15
.9bc
14
.1c
19.9
bc
22.1
bc
1.11
08
<0.0
001
0.00
02
Cys
tein
e 20
.8a
16.5
ab
15.6
ab
11.9
b 11
.3b
11.0
b 10
.2b
12.8
b 14
.4ab
0.
7296
0.
0004
0.
0005
G
luta
mic
Aci
d 27
.3a
20.9
ab
20.3
ab
15.1
b 14
.4b
14.3
b 12
.6b
17.7
b 19
.6ab
0.
9825
0.
0004
0.
0005
G
lyci
ne
50.5
a 37
.3ab
36
.1ab
29
.1b
24.4
b 25
.5b
23.4
b 31
.0b
34.9
ab
1.63
81
<0.0
001
0.00
02
His
tidin
e 29
.7a
23.0
ab
23.0
ab
17.1
b 16
.7b
16.3
b 13
.9b
21.7
ab
21.9
ab
1.11
48
0.00
10
0.00
10
Hyd
roxy
lysi
ne
50.3
a 31
.6ab
c 38
.6ab
25
.2bc
20
.3bc
16
.6bc
14
.2c
29.3
abc
23.1
bc
2.42
99
0.00
04
0.00
05
Hyd
roxy
prol
ine
34.0
a 26
.6ab
22
.7bc
15
.9cd
9.
8de
4.9e
9.6de
10
.4de
14
.0d
0.82
58
<0.0
001
<0.0
001
Isol
euci
ne
32.1
a 24
.3ab
23
.4ab
c 17
.2bc
16
.5bc
15
.8bc
13
.7c
20.1
bc
21.3
bc
1.10
65
0.00
01
0.00
02
Leuc
ine
27.3
a 20
.7ab
19
.8ab
c 14
.5bc
13
.7bc
13
.5bc
11
.5c
17.4
bc
18.5
abc
0.94
49
<0.0
001
0.00
02
Lysi
ne
42.2
a 32
.7ab
31
.2ab
23
.8b
23.2
b 22
.2b
19.8
b 28
.7ab
30
.0ab
1.
5286
0.
0006
0.
0007
M
ethi
onin
e 36
.4a
28.2
ab
26.8
ab
20.4
b 18
.9b
18.9
b 17
.2b
24.5
ab
27.0
ab
1.34
55
0.00
05
0.00
06
Phen
ylal
anin
e 30
.6a
22.9
ab
22.1
abc
16.3
bc
15.5
bc
14.8
bc
12.6
c 19
.3bc
20
.0bc
1.
0502
<0
.000
1 0.
0002
Pr
olin
e 33
.3a
25.5
ab
23.3
abc
17.8
bc
16.4
bc
16.4
bc
13.6
c 19
.2bc
20
.5bc
1.
2344
0.
0002
0.
0004
Se
rine
27.4
a 20
.4ab
19
.6ab
14
.4b
13.8
b 13
.3b
11.8
b 17
.3b
18.8
ab
0.94
69
0.00
01
0.00
02
Thre
onin
e 35
.7a
26.5
ab
25.0
ab
18.3
bc
17.4
bc
16.3
bc
13.9
c 21
.3bc
22
.8bc
1.
1486
<0
.000
1 0.
0001
Tr
ypto
phan
30
.7a
23.0
ab
23.1
ab
17.3
b 16
.2b
15.9
b 13
.8b
21.7
ab
21.9
ab
1.10
80
0.00
04
0.00
05
Tyro
sine
35
.2a
24.7
abc
27.1
ab
19.4
bc
18.7
bc
17.9
bc
13.1
c 24
.4ab
c 24
.6ab
c 1.
4386
0.
0008
0.
0008
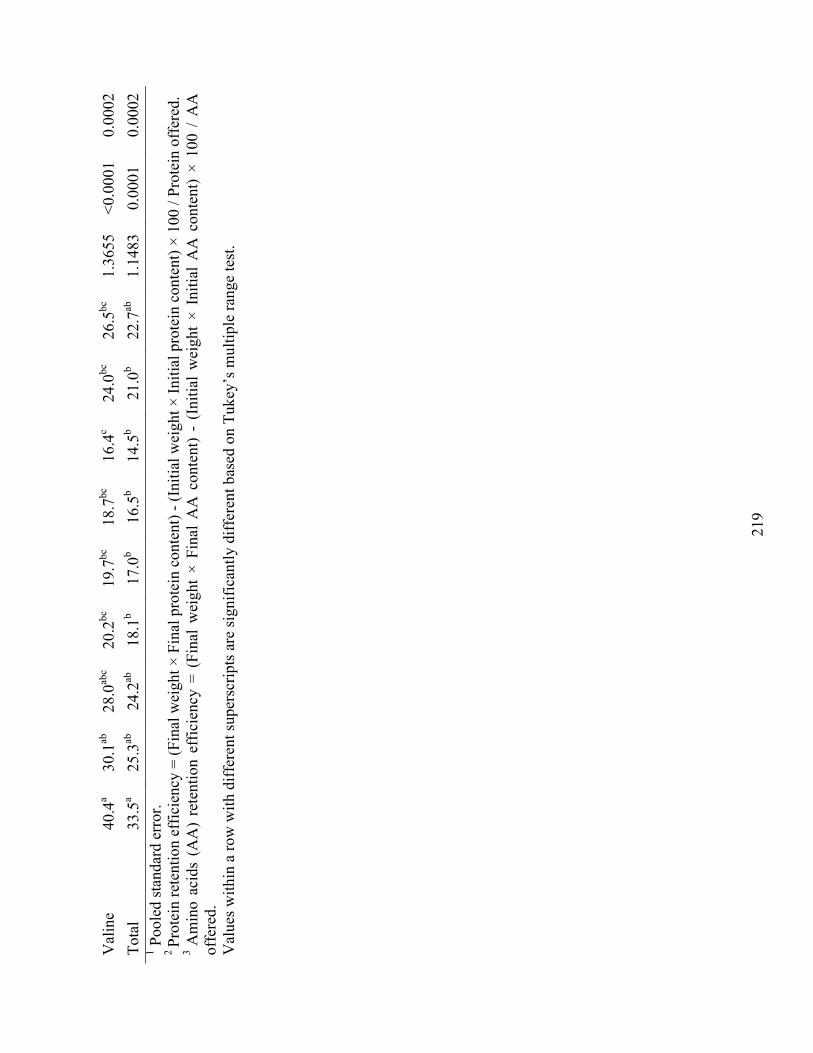
21
9
Val
ine
40.4
a 30
.1ab
28
.0ab
c 20
.2bc
19
.7bc
18
.7bc
16
.4c
24.0
bc
26.5
bc
1.36
55
<0.0
001
0.00
02
Tota
l 33
.5a
25.3
ab
24.2
ab
18.1
b 17
.0b
16.5
b 14
.5b
21.0
b 22
.7ab
1.
1483
0.
0001
0.
0002
1 P
oole
d st
anda
rd e
rror
. 2 Pr
otei
n re
tent
ion
effic
ienc
y =
(Fin
al w
eigh
t × F
inal
pro
tein
con
tent
) - (I
nitia
l wei
ght ×
Initi
al p
rote
in c
onte
nt) ×
100
/ Pr
otei
n of
fere
d.
3 A
min
o ac
ids
(AA
) re
tent
ion
effic
ienc
y =
(Fin
al w
eigh
t ×
Fina
l A
A c
onte
nt)
- (I
nitia
l w
eigh
t ×
Initi
al A
A c
onte
nt) ×
100
/ A
A
offe
red.
V
alue
s with
in a
row
with
diff
eren
t sup
ersc
ripts
are
sign
ifica
ntly
diff
eren
t bas
ed o
n Tu
key’
s mul
tiple
rang
e te
st.

220
Table 6a Formulation of test diets designed to evaluate Ulva meal 1, 2, and 3 as a replacement for soybean meal on a digestible protein basis (Trial 3).
Ingredient (% as is) T3D1 T3D2 T3D3 T3D4 Fish meal1 6.00 6.00 6.00 6.00 Soybean meal2 53.00 46.30 49.90 46.30 Corn protein concentrate3 8.00 8.00 8.00 8.00 Ulva meal 210
22.00 Ulva meal 110 25.00 Ulva meal 310 25.00 Fish oil2 5.92 5.98 5.85 5.91 Trace mineral premix5 0.50 0.50 0.50 0.50 Vitamin premix6 1.80 1.80 1.80 1.80 Choline chloride4 0.20 0.20 0.20 0.20 Stay C7 0.10 0.10 0.10 0.10 Mono-dicalcium phosphate8 2.50 2.50 2.50 2.50 Lecithin9 1.00 1.00 1.00 1.00 Cholesterol4 0.08 0.08 0.08 0.08 Methionine 0.05 0.04 0.04 0.04 Lyisine 0.00 0.07 0.00 0.11 Corn starch4 20.85 2.43 2.03 2.46 1 Omega Protein Inc., Huston TX, USA. 2 De-hulled solvent extract soybean meal, Bunge Limited, Decatur, AL, USA. 3 Empyreal® 75, Cargill Corn Milling, Cargill, Inc., Blair, NE, USA. 4 MP Biomedicals Inc., Solon, OH, USA. 5Trace mineral premix (g/100g premix): Cobalt chloride, 0.004; Cupric sulfate pentahydrate, 0.550; Ferrous sulfate, 2.000; Magnesium sulfate anhydrous, 13.862; Manganese sulfate monohydrate, 0.650; Potassium iodide, 0.067; Sodium selenite, 0.010; Zinc sulfate heptahydrate, 13.193; Alpha-cellulose, 69.664. 6 Vitamin premix (g/kg premix): Thiamin.HCL, 4.95; Riboflavin, 3.83; Pyridoxine.HCL, 4.00; Ca-Pantothenate, 10.00; Nicotinic acid, 10.00; Biotin, 0.50; folic acid, 4.00; Cyanocobalamin, 0.05; Inositol, 25.00; Vitamin A acetate (500,000 IU/g), 0.32; Vitamin D3 (1,000,000 IU/g), 80.00; Menadione, 0.50; Alpha-cellulose, 856.81. 7 Stay C®, (L-ascorbyl-2-polyphosphate 35% Active C), DSM Nutritional Products., Parsippany, NJ, USA. 8 J. T. Baker®, Mallinckrodt Baker, Inc., Phillipsburg, NJ, USA. 9 The Solae Company, St. Louis, MO, USA. 10 Three batches Ulva meal experimentally produced.

221
11 Aldrich-Sigma, St. Louis, MO, USA.
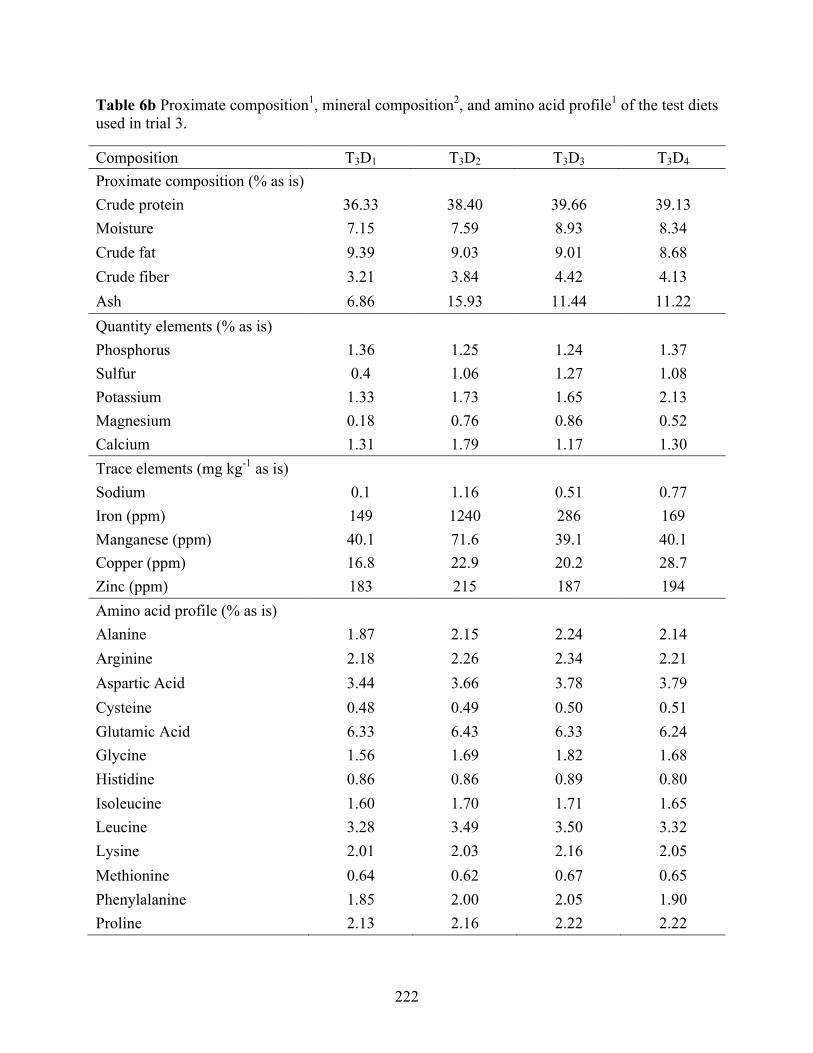
222
Table 6b Proximate composition1, mineral composition2, and amino acid profile1 of the test diets used in trial 3.
Composition T3D1 T3D2 T3D3 T3D4 Proximate composition (% as is) Crude protein 36.33 38.40 39.66 39.13 Moisture 7.15 7.59 8.93 8.34 Crude fat 9.39 9.03 9.01 8.68 Crude fiber 3.21 3.84 4.42 4.13 Ash 6.86 15.93 11.44 11.22 Quantity elements (% as is) Phosphorus 1.36 1.25 1.24 1.37 Sulfur 0.4 1.06 1.27 1.08 Potassium 1.33 1.73 1.65 2.13 Magnesium 0.18 0.76 0.86 0.52 Calcium 1.31 1.79 1.17 1.30 Trace elements (mg kg-1 as is) Sodium 0.1 1.16 0.51 0.77 Iron (ppm) 149 1240 286 169 Manganese (ppm) 40.1 71.6 39.1 40.1 Copper (ppm) 16.8 22.9 20.2 28.7 Zinc (ppm) 183 215 187 194 Amino acid profile (% as is) Alanine 1.87 2.15 2.24 2.14 Arginine 2.18 2.26 2.34 2.21 Aspartic Acid 3.44 3.66 3.78 3.79 Cysteine 0.48 0.49 0.50 0.51 Glutamic Acid 6.33 6.43 6.33 6.24 Glycine 1.56 1.69 1.82 1.68 Histidine 0.86 0.86 0.89 0.80 Isoleucine 1.60 1.70 1.71 1.65 Leucine 3.28 3.49 3.50 3.32 Lysine 2.01 2.03 2.16 2.05 Methionine 0.64 0.62 0.67 0.65 Phenylalanine 1.85 2.00 2.05 1.90 Proline 2.13 2.16 2.22 2.22
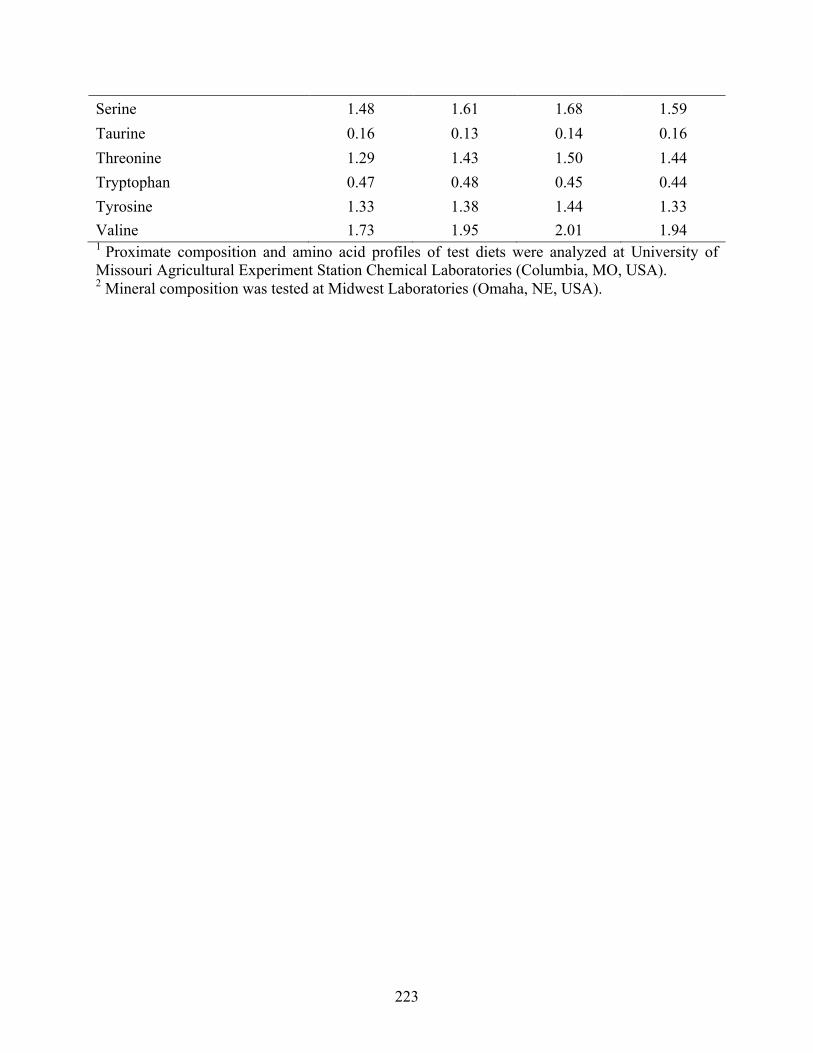
223
Serine 1.48 1.61 1.68 1.59 Taurine 0.16 0.13 0.14 0.16 Threonine 1.29 1.43 1.50 1.44 Tryptophan 0.47 0.48 0.45 0.44 Tyrosine 1.33 1.38 1.44 1.33 Valine 1.73 1.95 2.01 1.94 1 Proximate composition and amino acid profiles of test diets were analyzed at University of Missouri Agricultural Experiment Station Chemical Laboratories (Columbia, MO, USA). 2 Mineral composition was tested at Midwest Laboratories (Omaha, NE, USA).
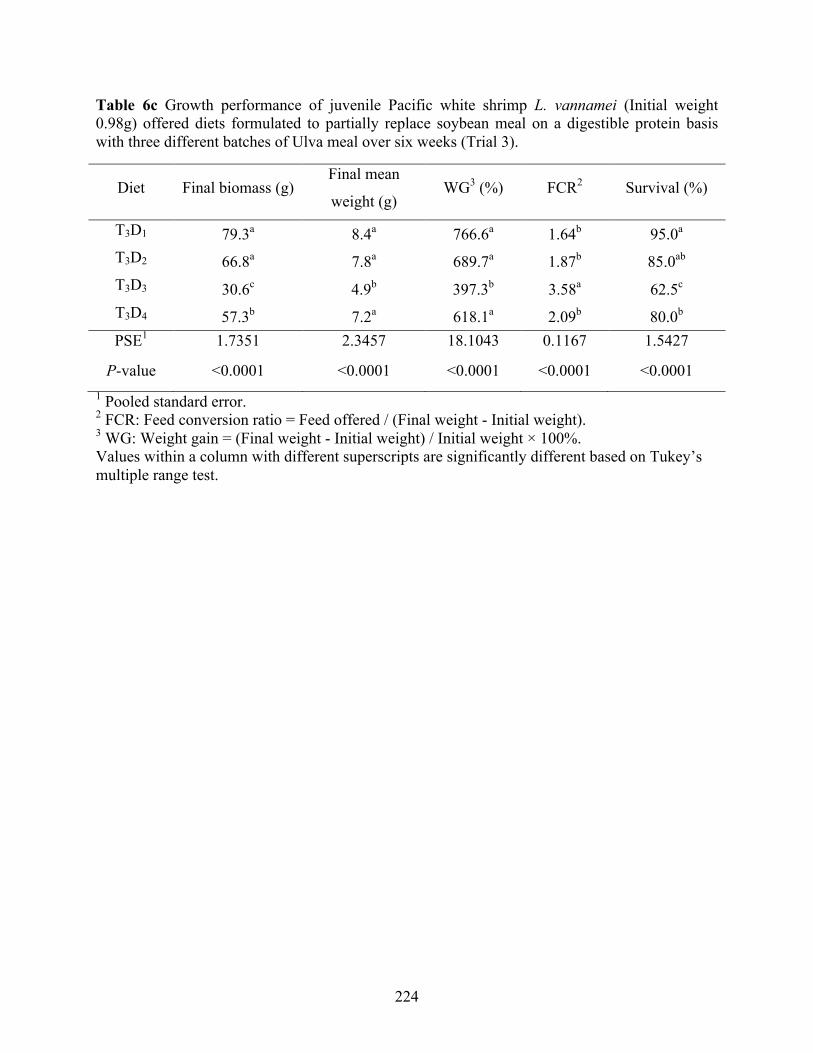
224
Table 6c Growth performance of juvenile Pacific white shrimp L. vannamei (Initial weight 0.98g) offered diets formulated to partially replace soybean meal on a digestible protein basis with three different batches of Ulva meal over six weeks (Trial 3).
Diet Final biomass (g) Final mean
weight (g) WG3 (%) FCR2 Survival (%)
T3D1 79.3a 8.4a 766.6a 1.64b 95.0a
T3D2 66.8a 7.8a 689.7a 1.87b 85.0ab
T3D3 30.6c 4.9b 397.3b 3.58a 62.5c
T3D4 57.3b 7.2a 618.1a 2.09b 80.0b
PSE1 1.7351 2.3457 18.1043 0.1167 1.5427
P-value <0.0001 <0.0001 <0.0001 <0.0001 <0.0001 1 Pooled standard error. 2 FCR: Feed conversion ratio = Feed offered / (Final weight - Initial weight). 3 WG: Weight gain = (Final weight - Initial weight) / Initial weight × 100%. Values within a column with different superscripts are significantly different based on Tukey’s multiple range test.
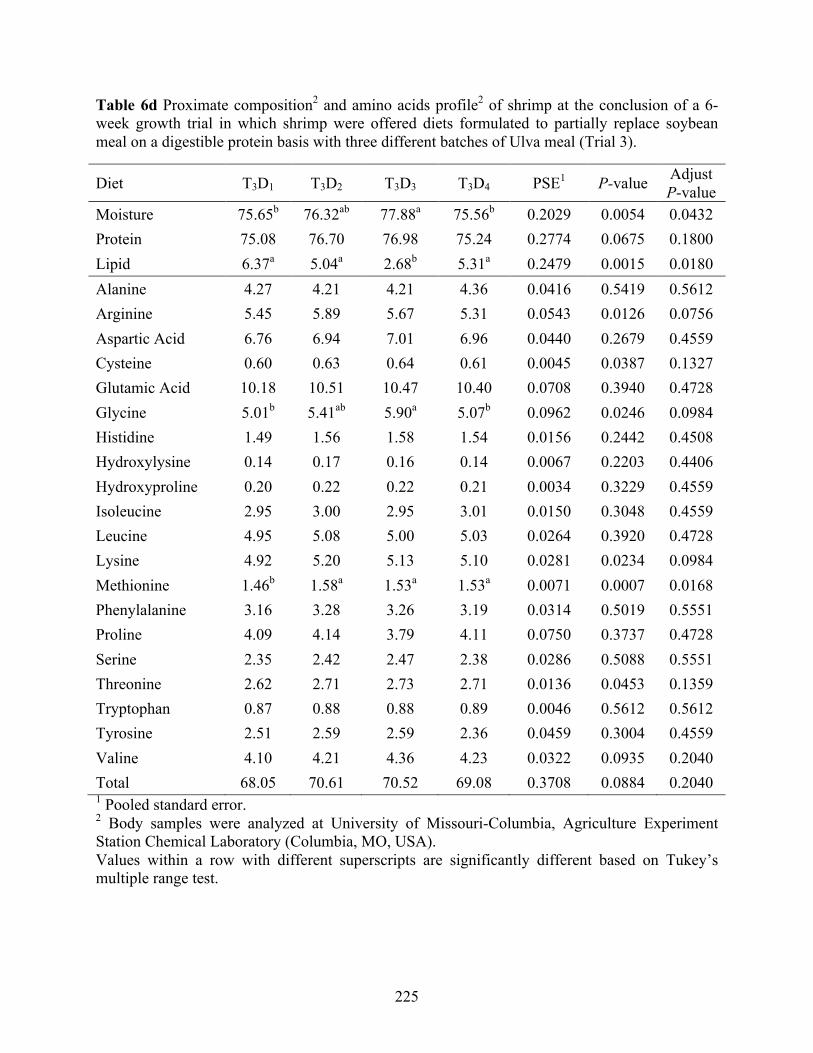
225
Table 6d Proximate composition2 and amino acids profile2 of shrimp at the conclusion of a 6-week growth trial in which shrimp were offered diets formulated to partially replace soybean meal on a digestible protein basis with three different batches of Ulva meal (Trial 3).
Diet T3D1 T3D2 T3D3 T3D4 PSE1 P-value Adjust P-value
Moisture 75.65b 76.32ab 77.88a 75.56b 0.2029 0.0054 0.0432 Protein 75.08 76.70 76.98 75.24 0.2774 0.0675 0.1800 Lipid 6.37a 5.04a 2.68b 5.31a 0.2479 0.0015 0.0180 Alanine 4.27 4.21 4.21 4.36 0.0416 0.5419 0.5612 Arginine 5.45 5.89 5.67 5.31 0.0543 0.0126 0.0756 Aspartic Acid 6.76 6.94 7.01 6.96 0.0440 0.2679 0.4559 Cysteine 0.60 0.63 0.64 0.61 0.0045 0.0387 0.1327 Glutamic Acid 10.18 10.51 10.47 10.40 0.0708 0.3940 0.4728 Glycine 5.01b 5.41ab 5.90a 5.07b 0.0962 0.0246 0.0984 Histidine 1.49 1.56 1.58 1.54 0.0156 0.2442 0.4508 Hydroxylysine 0.14 0.17 0.16 0.14 0.0067 0.2203 0.4406 Hydroxyproline 0.20 0.22 0.22 0.21 0.0034 0.3229 0.4559 Isoleucine 2.95 3.00 2.95 3.01 0.0150 0.3048 0.4559 Leucine 4.95 5.08 5.00 5.03 0.0264 0.3920 0.4728 Lysine 4.92 5.20 5.13 5.10 0.0281 0.0234 0.0984 Methionine 1.46b 1.58a 1.53a 1.53a 0.0071 0.0007 0.0168 Phenylalanine 3.16 3.28 3.26 3.19 0.0314 0.5019 0.5551 Proline 4.09 4.14 3.79 4.11 0.0750 0.3737 0.4728 Serine 2.35 2.42 2.47 2.38 0.0286 0.5088 0.5551 Threonine 2.62 2.71 2.73 2.71 0.0136 0.0453 0.1359 Tryptophan 0.87 0.88 0.88 0.89 0.0046 0.5612 0.5612 Tyrosine 2.51 2.59 2.59 2.36 0.0459 0.3004 0.4559 Valine 4.10 4.21 4.36 4.23 0.0322 0.0935 0.2040 Total 68.05 70.61 70.52 69.08 0.3708 0.0884 0.2040 1 Pooled standard error. 2 Body samples were analyzed at University of Missouri-Columbia, Agriculture Experiment Station Chemical Laboratory (Columbia, MO, USA). Values within a row with different superscripts are significantly different based on Tukey’s multiple range test.
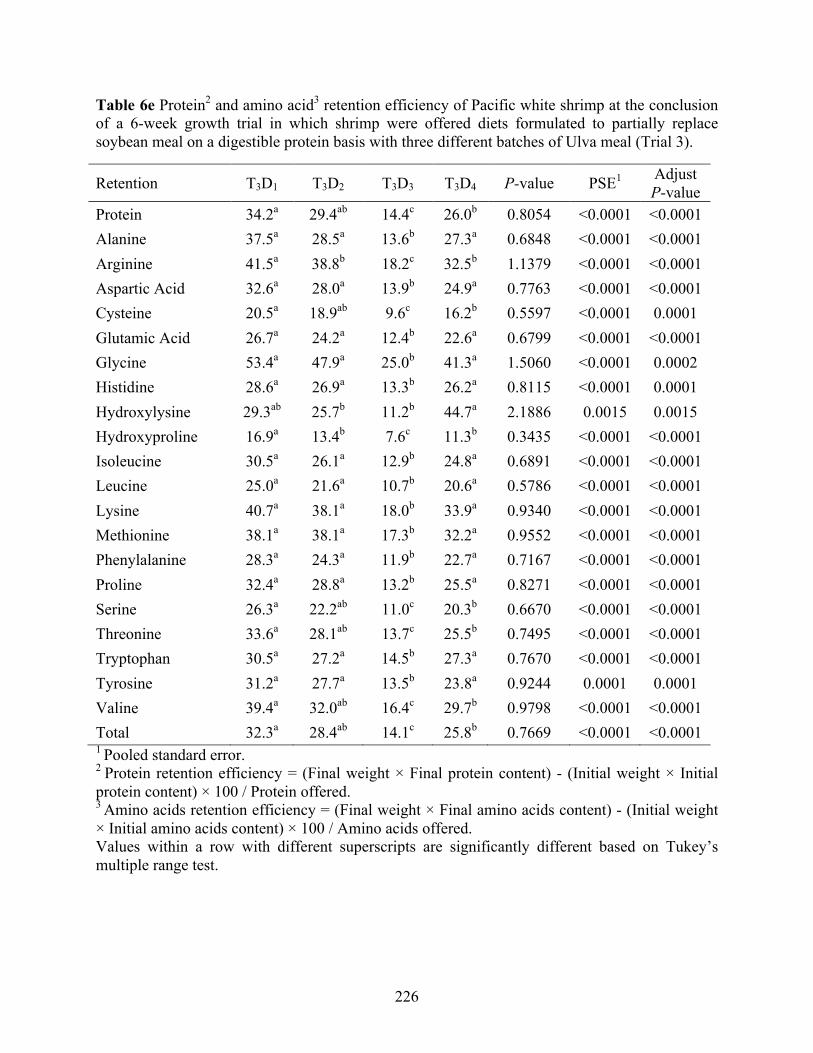
226
Table 6e Protein2 and amino acid3 retention efficiency of Pacific white shrimp at the conclusion of a 6-week growth trial in which shrimp were offered diets formulated to partially replace soybean meal on a digestible protein basis with three different batches of Ulva meal (Trial 3).
Retention T3D1 T3D2 T3D3 T3D4 P-value PSE1 Adjust P-value
Protein 34.2a 29.4ab 14.4c 26.0b 0.8054 <0.0001 <0.0001 Alanine 37.5a 28.5a 13.6b 27.3a 0.6848 <0.0001 <0.0001 Arginine 41.5a 38.8b 18.2c 32.5b 1.1379 <0.0001 <0.0001 Aspartic Acid 32.6a 28.0a 13.9b 24.9a 0.7763 <0.0001 <0.0001 Cysteine 20.5a 18.9ab 9.6c 16.2b 0.5597 <0.0001 0.0001 Glutamic Acid 26.7a 24.2a 12.4b 22.6a 0.6799 <0.0001 <0.0001 Glycine 53.4a 47.9a 25.0b 41.3a 1.5060 <0.0001 0.0002 Histidine 28.6a 26.9a 13.3b 26.2a 0.8115 <0.0001 0.0001 Hydroxylysine 29.3ab 25.7b 11.2b 44.7a 2.1886 0.0015 0.0015 Hydroxyproline 16.9a 13.4b 7.6c 11.3b 0.3435 <0.0001 <0.0001 Isoleucine 30.5a 26.1a 12.9b 24.8a 0.6891 <0.0001 <0.0001 Leucine 25.0a 21.6a 10.7b 20.6a 0.5786 <0.0001 <0.0001 Lysine 40.7a 38.1a 18.0b 33.9a 0.9340 <0.0001 <0.0001 Methionine 38.1a 38.1a 17.3b 32.2a 0.9552 <0.0001 <0.0001 Phenylalanine 28.3a 24.3a 11.9b 22.7a 0.7167 <0.0001 <0.0001 Proline 32.4a 28.8a 13.2b 25.5a 0.8271 <0.0001 <0.0001 Serine 26.3a 22.2ab 11.0c 20.3b 0.6670 <0.0001 <0.0001 Threonine 33.6a 28.1ab 13.7c 25.5b 0.7495 <0.0001 <0.0001 Tryptophan 30.5a 27.2a 14.5b 27.3a 0.7670 <0.0001 <0.0001 Tyrosine 31.2a 27.7a 13.5b 23.8a 0.9244 0.0001 0.0001 Valine 39.4a 32.0ab 16.4c 29.7b 0.9798 <0.0001 <0.0001 Total 32.3a 28.4ab 14.1c 25.8b 0.7669 <0.0001 <0.0001 1 Pooled standard error. 2 Protein retention efficiency = (Final weight × Final protein content) - (Initial weight × Initial protein content) × 100 / Protein offered. 3 Amino acids retention efficiency = (Final weight × Final amino acids content) - (Initial weight × Initial amino acids content) × 100 / Amino acids offered. Values within a row with different superscripts are significantly different based on Tukey’s multiple range test.
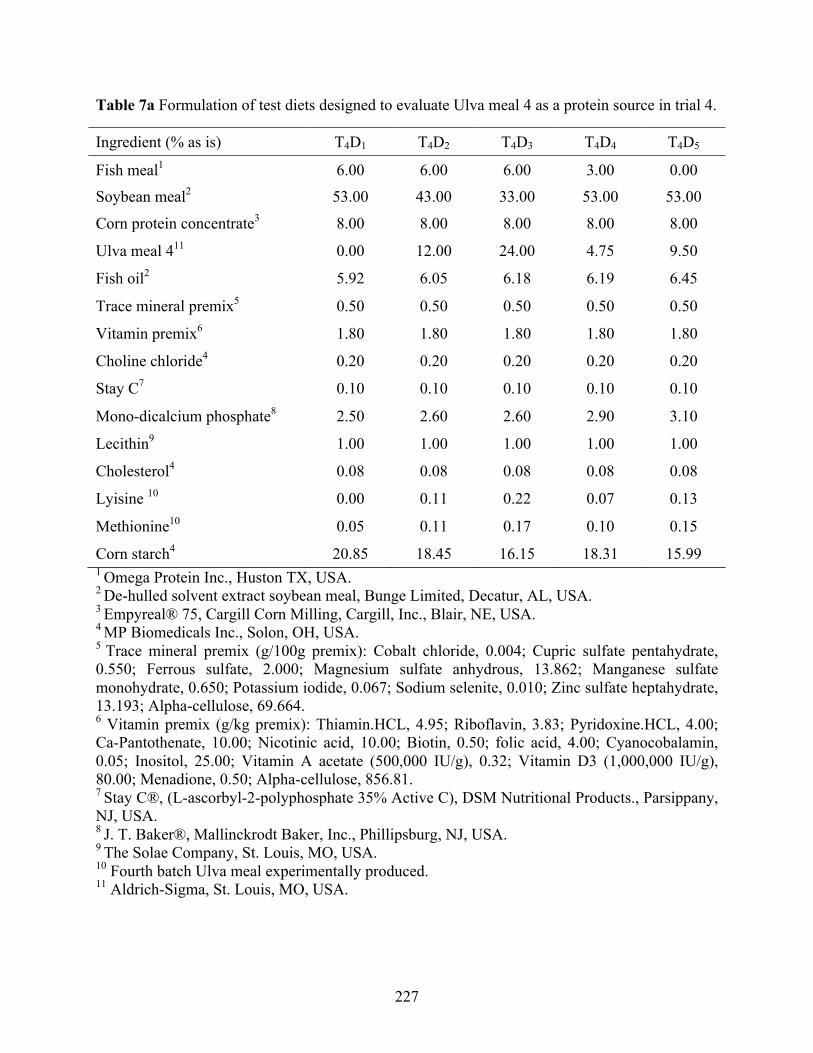
227
Table 7a Formulation of test diets designed to evaluate Ulva meal 4 as a protein source in trial 4.
Ingredient (% as is) T4D1 T4D2 T4D3 T4D4 T4D5
Fish meal1 6.00 6.00 6.00 3.00 0.00
Soybean meal2 53.00 43.00 33.00 53.00 53.00
Corn protein concentrate3 8.00 8.00 8.00 8.00 8.00
Ulva meal 411 0.00 12.00 24.00 4.75 9.50
Fish oil2 5.92 6.05 6.18 6.19 6.45
Trace mineral premix5 0.50 0.50 0.50 0.50 0.50
Vitamin premix6 1.80 1.80 1.80 1.80 1.80
Choline chloride4 0.20 0.20 0.20 0.20 0.20
Stay C7 0.10 0.10 0.10 0.10 0.10
Mono-dicalcium phosphate8 2.50 2.60 2.60 2.90 3.10
Lecithin9 1.00 1.00 1.00 1.00 1.00
Cholesterol4 0.08 0.08 0.08 0.08 0.08
Lyisine 10 0.00 0.11 0.22 0.07 0.13
Methionine10 0.05 0.11 0.17 0.10 0.15
Corn starch4 20.85 18.45 16.15 18.31 15.99 1 Omega Protein Inc., Huston TX, USA. 2 De-hulled solvent extract soybean meal, Bunge Limited, Decatur, AL, USA. 3 Empyreal® 75, Cargill Corn Milling, Cargill, Inc., Blair, NE, USA. 4 MP Biomedicals Inc., Solon, OH, USA. 5 Trace mineral premix (g/100g premix): Cobalt chloride, 0.004; Cupric sulfate pentahydrate, 0.550; Ferrous sulfate, 2.000; Magnesium sulfate anhydrous, 13.862; Manganese sulfate monohydrate, 0.650; Potassium iodide, 0.067; Sodium selenite, 0.010; Zinc sulfate heptahydrate, 13.193; Alpha-cellulose, 69.664. 6 Vitamin premix (g/kg premix): Thiamin.HCL, 4.95; Riboflavin, 3.83; Pyridoxine.HCL, 4.00; Ca-Pantothenate, 10.00; Nicotinic acid, 10.00; Biotin, 0.50; folic acid, 4.00; Cyanocobalamin, 0.05; Inositol, 25.00; Vitamin A acetate (500,000 IU/g), 0.32; Vitamin D3 (1,000,000 IU/g), 80.00; Menadione, 0.50; Alpha-cellulose, 856.81. 7 Stay C®, (L-ascorbyl-2-polyphosphate 35% Active C), DSM Nutritional Products., Parsippany, NJ, USA. 8 J. T. Baker®, Mallinckrodt Baker, Inc., Phillipsburg, NJ, USA. 9 The Solae Company, St. Louis, MO, USA. 10 Fourth batch Ulva meal experimentally produced. 11 Aldrich-Sigma, St. Louis, MO, USA.
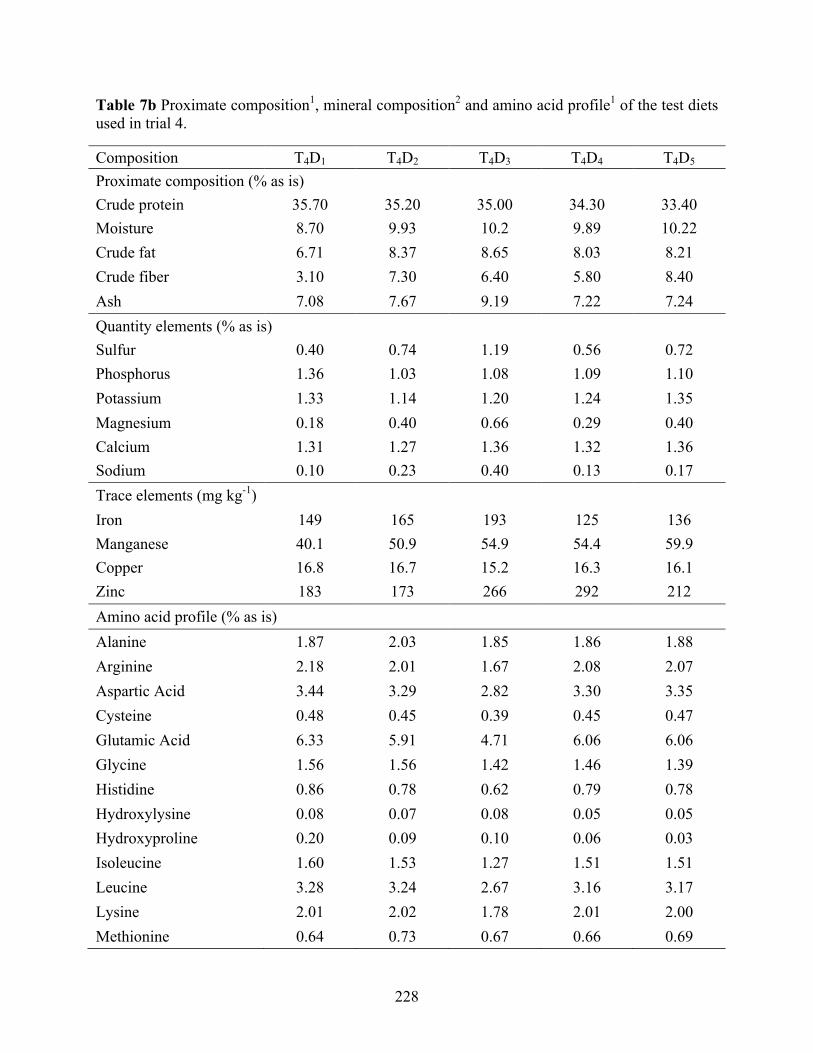
228
Table 7b Proximate composition1, mineral composition2 and amino acid profile1 of the test diets used in trial 4.
Composition T4D1 T4D2 T4D3 T4D4 T4D5 Proximate composition (% as is) Crude protein 35.70 35.20 35.00 34.30 33.40 Moisture 8.70 9.93 10.2 9.89 10.22 Crude fat 6.71 8.37 8.65 8.03 8.21 Crude fiber 3.10 7.30 6.40 5.80 8.40 Ash 7.08 7.67 9.19 7.22 7.24 Quantity elements (% as is) Sulfur 0.40 0.74 1.19 0.56 0.72 Phosphorus 1.36 1.03 1.08 1.09 1.10 Potassium 1.33 1.14 1.20 1.24 1.35 Magnesium 0.18 0.40 0.66 0.29 0.40 Calcium 1.31 1.27 1.36 1.32 1.36 Sodium 0.10 0.23 0.40 0.13 0.17 Trace elements (mg kg-1) Iron 149 165 193 125 136 Manganese 40.1 50.9 54.9 54.4 59.9 Copper 16.8 16.7 15.2 16.3 16.1 Zinc 183 173 266 292 212 Amino acid profile (% as is) Alanine 1.87 2.03 1.85 1.86 1.88 Arginine 2.18 2.01 1.67 2.08 2.07 Aspartic Acid 3.44 3.29 2.82 3.30 3.35 Cysteine 0.48 0.45 0.39 0.45 0.47 Glutamic Acid 6.33 5.91 4.71 6.06 6.06 Glycine 1.56 1.56 1.42 1.46 1.39 Histidine 0.86 0.78 0.62 0.79 0.78 Hydroxylysine 0.08 0.07 0.08 0.05 0.05 Hydroxyproline 0.20 0.09 0.10 0.06 0.03 Isoleucine 1.60 1.53 1.27 1.51 1.51 Leucine 3.28 3.24 2.67 3.16 3.17 Lysine 2.01 2.02 1.78 2.01 2.00 Methionine 0.64 0.73 0.67 0.66 0.69
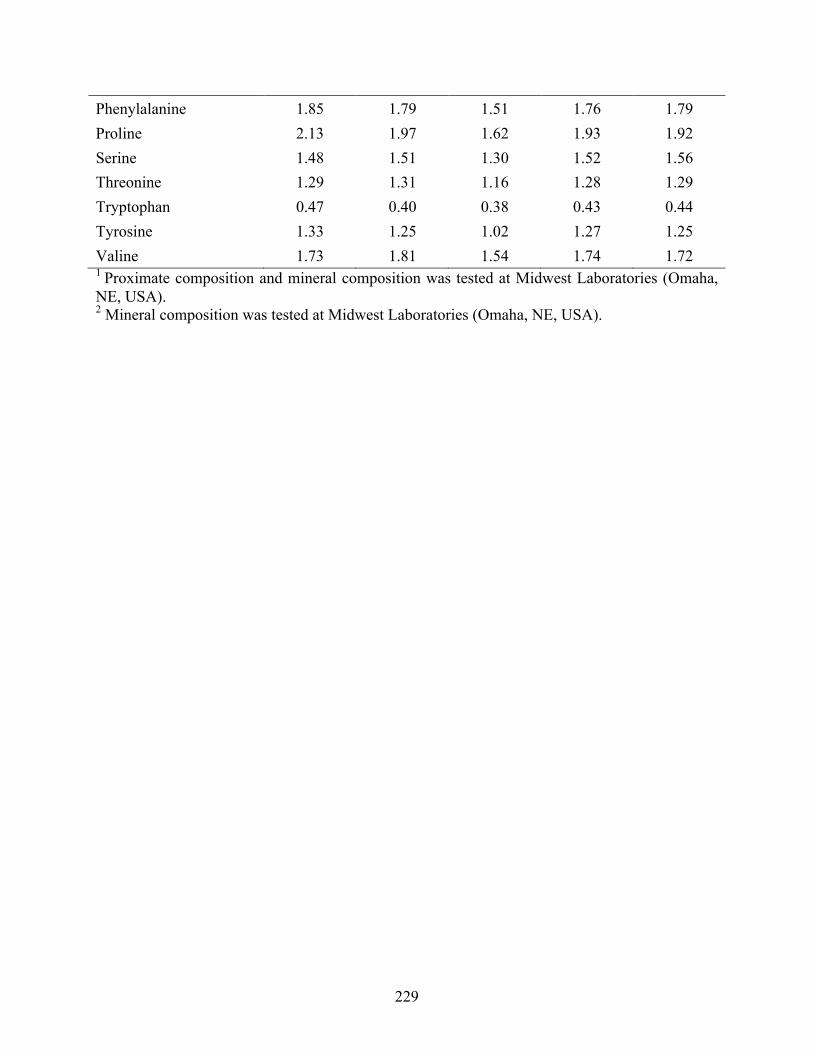
229
Phenylalanine 1.85 1.79 1.51 1.76 1.79 Proline 2.13 1.97 1.62 1.93 1.92 Serine 1.48 1.51 1.30 1.52 1.56 Threonine 1.29 1.31 1.16 1.28 1.29 Tryptophan 0.47 0.40 0.38 0.43 0.44 Tyrosine 1.33 1.25 1.02 1.27 1.25 Valine 1.73 1.81 1.54 1.74 1.72 1 Proximate composition and mineral composition was tested at Midwest Laboratories (Omaha, NE, USA). 2 Mineral composition was tested at Midwest Laboratories (Omaha, NE, USA).

23
0
Tab
le 7
c Pe
rfor
man
ce o
f ju
veni
le P
acifi
c w
hite
shr
imp
L. v
anna
mei
(In
itial
wei
ght 0
.15g
) of
fere
d di
ets
form
ulat
ed to
eva
luat
e U
lva
mea
l 4 a
s a
repl
acem
ent f
or s
oybe
an m
eal a
nd fi
sh m
eal o
n an
iso-
nitro
gen
basi
s in
juve
nile
shr
imp
over
six
wee
ks (T
rial 4
).
Die
t U
lva
Leve
ls (%
) Fi
nal b
iom
ass
(g)
Fina
l mea
n w
eigh
t (g)
W
G3 (%
) FC
R2
Surv
ival
(%)
PRE4 (%
)
T 4D
1 0
42.6
8a 4.
74a
3160
.39a
1.72
c 90
.0ab
30
.50a
T 4D
2 12
27
.85bc
3.
41bc
20
57.9
1bc
2.52
b 82
.5ab
20
.68bc
T 4D
3 24
20
.08d
2.72
c 17
18.6
7c 3.
26a
74.0
ab
15.9
1c
T 4D
4 4.
75
34.6
0b 3.
69b
2335
.98b
2.23
bc
94.0
a 25
.11ab
T 4D
5 9.
5 24
.84cd
3.
52bc
22
54.0
4bc
2.51
b 72
.0b
22.3
1b
PSE1
0.90
41
0.11
35
76.7
9 0.
0826
2.
4965
<0
.000
1
P-va
lue
<0.0
001
<0.0
001
<0.0
001
<0.0
001
0.01
07
0.78
82
1 Poo
led
stan
dard
err
or.
2 FC
R: F
eed
conv
ersi
on ra
tio =
Fee
d of
fere
d / (
Fina
l wei
ght -
Initi
al w
eigh
t).
3 WG
: Wei
ght g
ain
= (F
inal
wei
ght -
Initi
al w
eigh
t) / I
nitia
l wei
ght ×
100
%.
4 PR
E: P
rote
in re
tent
ion
effic
ienc
y =
(Fin
al w
eigh
t × F
inal
pro
tein
con
tent
) - (I
nitia
l wei
ght ×
Initi
al p
rote
in c
onte
nt) ×
100
/ Pr
otei
n of
fere
d.
Val
ues
with
in a
col
umn
with
diff
eren
t sup
ersc
ripts
are
sig
nific
antly
diff
eren
t bas
ed o
n Tu
key’
s m
ultip
le ra
nge
test
.
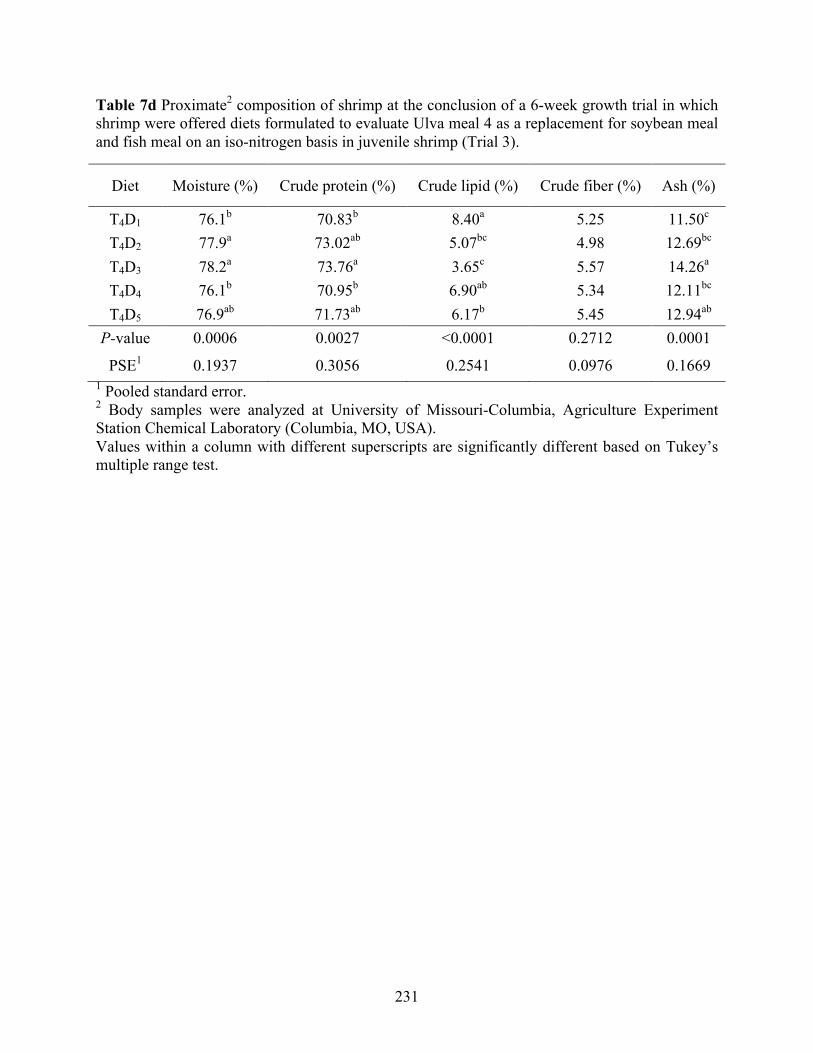
231
Table 7d Proximate2 composition of shrimp at the conclusion of a 6-week growth trial in which shrimp were offered diets formulated to evaluate Ulva meal 4 as a replacement for soybean meal and fish meal on an iso-nitrogen basis in juvenile shrimp (Trial 3).
Diet Moisture (%) Crude protein (%) Crude lipid (%) Crude fiber (%) Ash (%)
T4D1 76.1b 70.83b 8.40a 5.25 11.50c
T4D2 77.9a 73.02ab 5.07bc 4.98 12.69bc
T4D3 78.2a 73.76a 3.65c 5.57 14.26a
T4D4 76.1b 70.95b 6.90ab 5.34 12.11bc
T4D5 76.9ab 71.73ab 6.17b 5.45 12.94ab
P-value 0.0006 0.0027 <0.0001 0.2712 0.0001
PSE1 0.1937 0.3056 0.2541 0.0976 0.1669 1 Pooled standard error. 2 Body samples were analyzed at University of Missouri-Columbia, Agriculture Experiment Station Chemical Laboratory (Columbia, MO, USA). Values within a column with different superscripts are significantly different based on Tukey’s multiple range test.
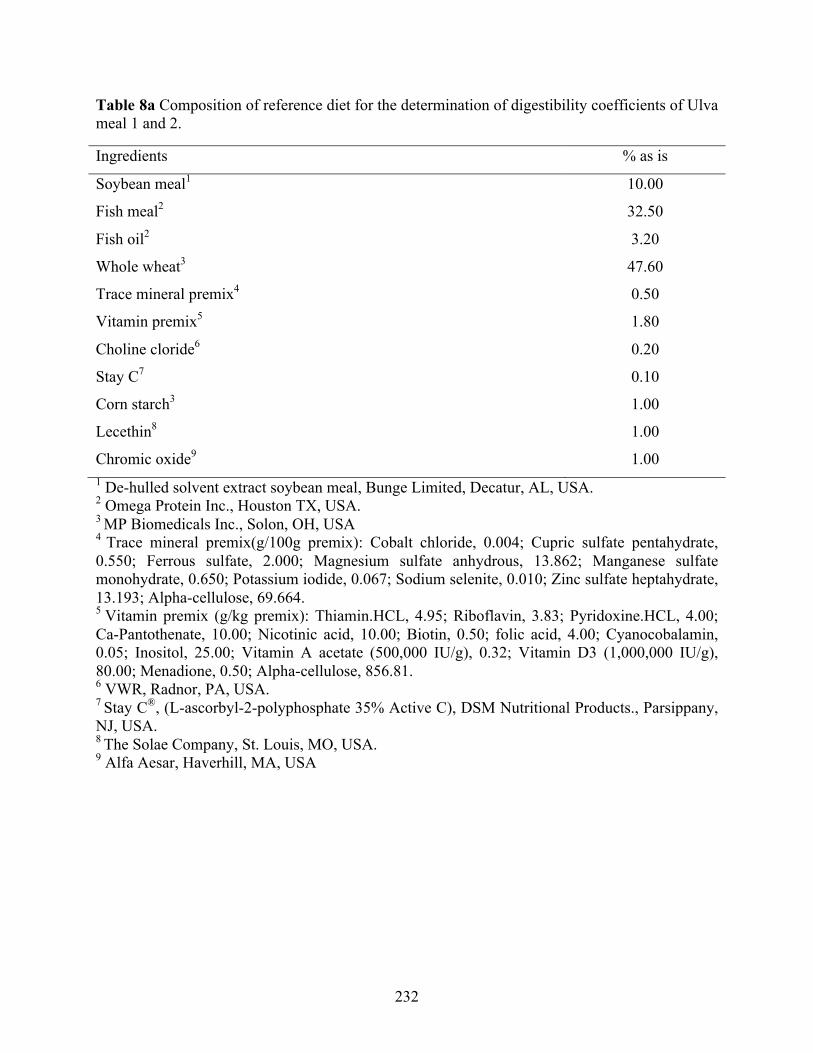
232
Table 8a Composition of reference diet for the determination of digestibility coefficients of Ulva meal 1 and 2.
Ingredients % as is
Soybean meal1 10.00
Fish meal2 32.50
Fish oil2 3.20
Whole wheat3 47.60
Trace mineral premix4 0.50
Vitamin premix5 1.80
Choline cloride6 0.20
Stay C7 0.10
Corn starch3 1.00
Lecethin8 1.00
Chromic oxide9 1.00 1 De-hulled solvent extract soybean meal, Bunge Limited, Decatur, AL, USA. 2 Omega Protein Inc., Houston TX, USA. 3 MP Biomedicals Inc., Solon, OH, USA 4 Trace mineral premix(g/100g premix): Cobalt chloride, 0.004; Cupric sulfate pentahydrate, 0.550; Ferrous sulfate, 2.000; Magnesium sulfate anhydrous, 13.862; Manganese sulfate monohydrate, 0.650; Potassium iodide, 0.067; Sodium selenite, 0.010; Zinc sulfate heptahydrate, 13.193; Alpha-cellulose, 69.664. 5 Vitamin premix (g/kg premix): Thiamin.HCL, 4.95; Riboflavin, 3.83; Pyridoxine.HCL, 4.00; Ca-Pantothenate, 10.00; Nicotinic acid, 10.00; Biotin, 0.50; folic acid, 4.00; Cyanocobalamin, 0.05; Inositol, 25.00; Vitamin A acetate (500,000 IU/g), 0.32; Vitamin D3 (1,000,000 IU/g), 80.00; Menadione, 0.50; Alpha-cellulose, 856.81. 6 VWR, Radnor, PA, USA. 7 Stay C®, (L-ascorbyl-2-polyphosphate 35% Active C), DSM Nutritional Products., Parsippany, NJ, USA. 8 The Solae Company, St. Louis, MO, USA. 9 Alfa Aesar, Haverhill, MA, USA
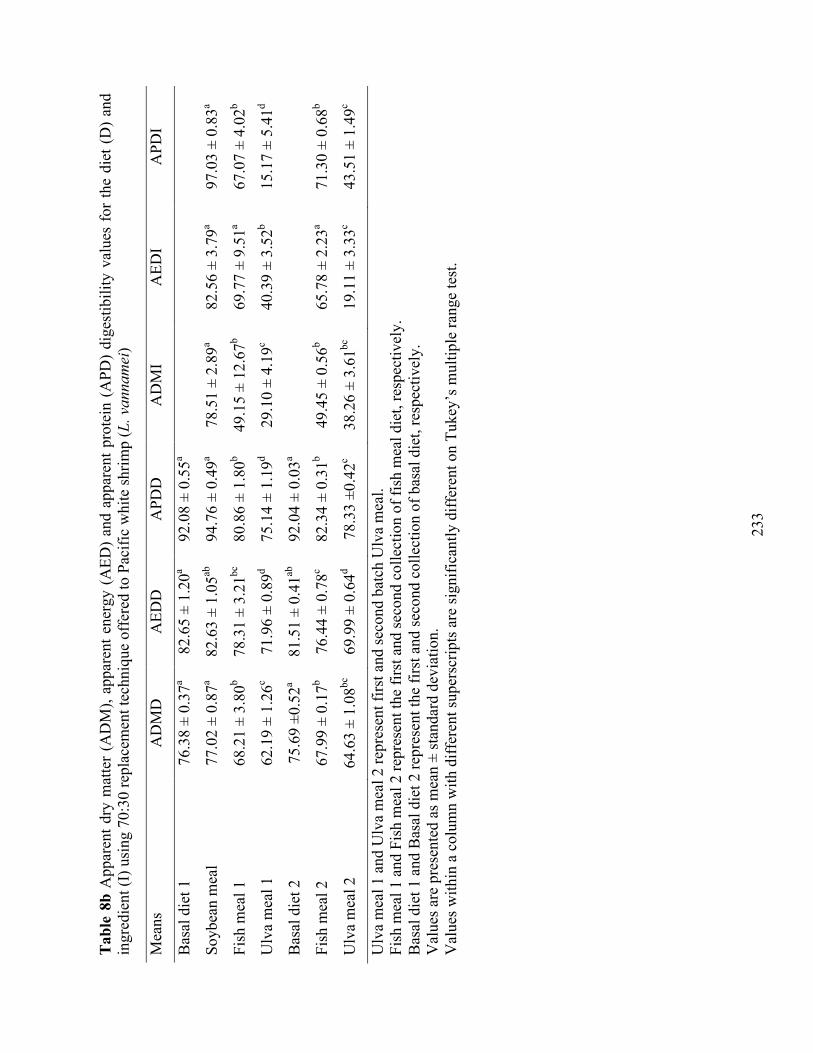
23
3
Tab
le 8
b A
ppar
ent d
ry m
atte
r (A
DM
), ap
pare
nt e
nerg
y (A
ED)
and
appa
rent
pro
tein
(A
PD)
dige
stib
ility
val
ues
for
the
diet
(D
) an
d in
gred
ient
(I) u
sing
70:
30 re
plac
emen
t tec
hniq
ue o
ffer
ed to
Pac
ific
whi
te s
hrim
p (L
. van
nam
ei)
Mea
ns
AD
MD
A
EDD
A
PDD
A
DM
I A
EDI
APD
I
Bas
al d
iet 1
76
.38
± 0.
37a
82.6
5 ±
1.20
a 92
.08
± 0.
55a
So
ybea
n m
eal
77.0
2 ±
0.87
a 82
.63
± 1.
05ab
94
.76
± 0.
49a
78.5
1 ±
2.89
a 82
.56
± 3.
79a
97.0
3 ±
0.83
a
Fish
mea
l 1
68.2
1 ±
3.80
b 78
.31
± 3.
21bc
80
.86
± 1.
80b
49.1
5 ±
12.6
7b 69
.77
± 9.
51a
67.0
7 ±
4.02
b
Ulv
a m
eal 1
62
.19
± 1.
26c
71.9
6 ±
0.89
d 75
.14
± 1.
19d
29.1
0 ±
4.19
c 40
.39
± 3.
52b
15.1
7 ±
5.41
d
Bas
al d
iet 2
75
.69
±0.5
2a 81
.51
± 0.
41ab
92
.04
± 0.
03a
Fish
mea
l 2
67.9
9 ±
0.17
b 76
.44
± 0.
78c
82.3
4 ±
0.31
b 49
.45
± 0.
56b
65.7
8 ±
2.23
a 71
.30
± 0.
68b
Ulv
a m
eal 2
64
.63
± 1.
08bc
69
.99
± 0.
64d
78.3
3 ±0
.42c
38.2
6 ±
3.61
bc
19.1
1 ±
3.33
c 43
.51
± 1.
49c
Ulv
a m
eal 1
and
Ulv
a m
eal 2
repr
esen
t firs
t and
sec
ond
batc
h U
lva
mea
l. Fi
sh m
eal 1
and
Fis
h m
eal 2
repr
esen
t the
firs
t and
sec
ond
colle
ctio
n of
fish
mea
l die
t, re
spec
tivel
y.
Bas
al d
iet 1
and
Bas
al d
iet 2
repr
esen
t the
firs
t and
sec
ond
colle
ctio
n of
bas
al d
iet,
resp
ectiv
ely.
V
alue
s ar
e pr
esen
ted
as m
ean
± st
anda
rd d
evia
tion.
V
alue
s w
ithin
a c
olum
n w
ith d
iffer
ent s
uper
scrip
ts a
re s
igni
fican
tly d
iffer
ent o
n Tu
key’
s m
ultip
le ra
nge
test
.
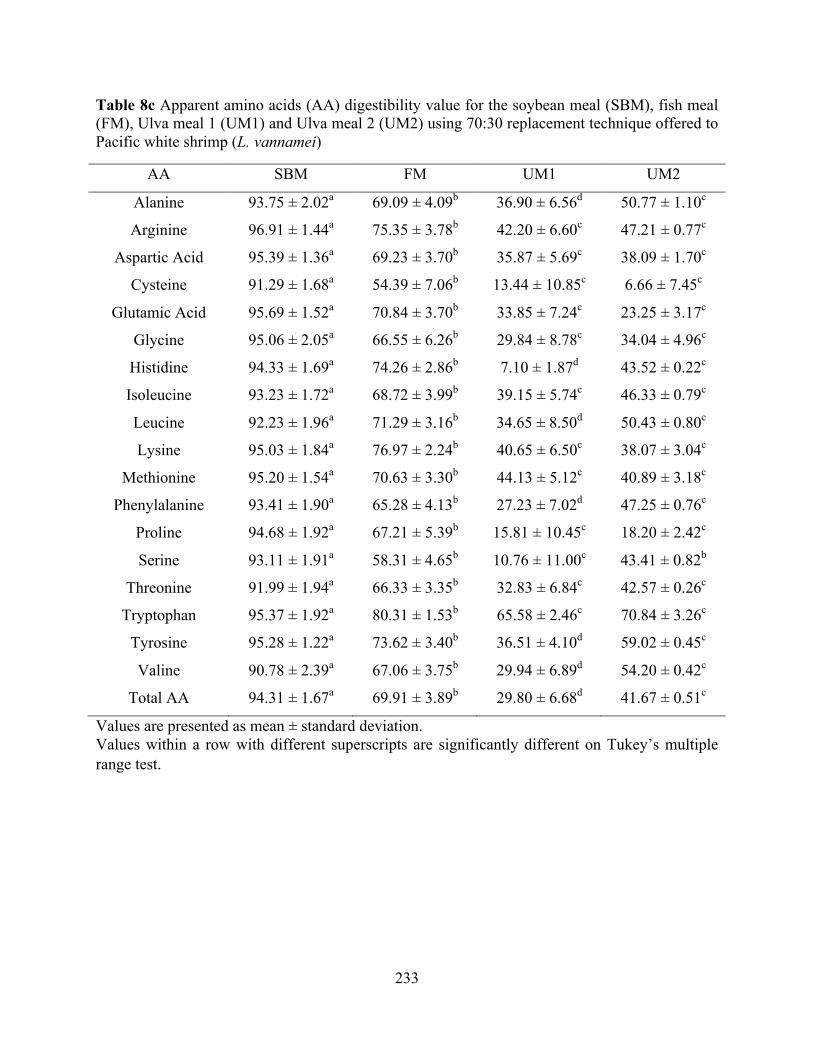
233
Table 8c Apparent amino acids (AA) digestibility value for the soybean meal (SBM), fish meal (FM), Ulva meal 1 (UM1) and Ulva meal 2 (UM2) using 70:30 replacement technique offered to Pacific white shrimp (L. vannamei)
AA SBM FM UM1 UM2
Alanine 93.75 ± 2.02a 69.09 ± 4.09b 36.90 ± 6.56d 50.77 ± 1.10c
Arginine 96.91 ± 1.44a 75.35 ± 3.78b 42.20 ± 6.60c 47.21 ± 0.77c
Aspartic Acid 95.39 ± 1.36a 69.23 ± 3.70b 35.87 ± 5.69c 38.09 ± 1.70c
Cysteine 91.29 ± 1.68a 54.39 ± 7.06b 13.44 ± 10.85c 6.66 ± 7.45c
Glutamic Acid 95.69 ± 1.52a 70.84 ± 3.70b 33.85 ± 7.24c 23.25 ± 3.17c
Glycine 95.06 ± 2.05a 66.55 ± 6.26b 29.84 ± 8.78c 34.04 ± 4.96c
Histidine 94.33 ± 1.69a 74.26 ± 2.86b 7.10 ± 1.87d 43.52 ± 0.22c
Isoleucine 93.23 ± 1.72a 68.72 ± 3.99b 39.15 ± 5.74c 46.33 ± 0.79c
Leucine 92.23 ± 1.96a 71.29 ± 3.16b 34.65 ± 8.50d 50.43 ± 0.80c
Lysine 95.03 ± 1.84a 76.97 ± 2.24b 40.65 ± 6.50c 38.07 ± 3.04c
Methionine 95.20 ± 1.54a 70.63 ± 3.30b 44.13 ± 5.12c 40.89 ± 3.18c
Phenylalanine 93.41 ± 1.90a 65.28 ± 4.13b 27.23 ± 7.02d 47.25 ± 0.76c
Proline 94.68 ± 1.92a 67.21 ± 5.39b 15.81 ± 10.45c 18.20 ± 2.42c
Serine 93.11 ± 1.91a 58.31 ± 4.65b 10.76 ± 11.00c 43.41 ± 0.82b
Threonine 91.99 ± 1.94a 66.33 ± 3.35b 32.83 ± 6.84c 42.57 ± 0.26c
Tryptophan 95.37 ± 1.92a 80.31 ± 1.53b 65.58 ± 2.46c 70.84 ± 3.26c
Tyrosine 95.28 ± 1.22a 73.62 ± 3.40b 36.51 ± 4.10d 59.02 ± 0.45c
Valine 90.78 ± 2.39a 67.06 ± 3.75b 29.94 ± 6.89d 54.20 ± 0.42c
Total AA 94.31 ± 1.67a 69.91 ± 3.89b 29.80 ± 6.68d 41.67 ± 0.51c
Values are presented as mean ± standard deviation. Values within a row with different superscripts are significantly different on Tukey’s multiple range test.
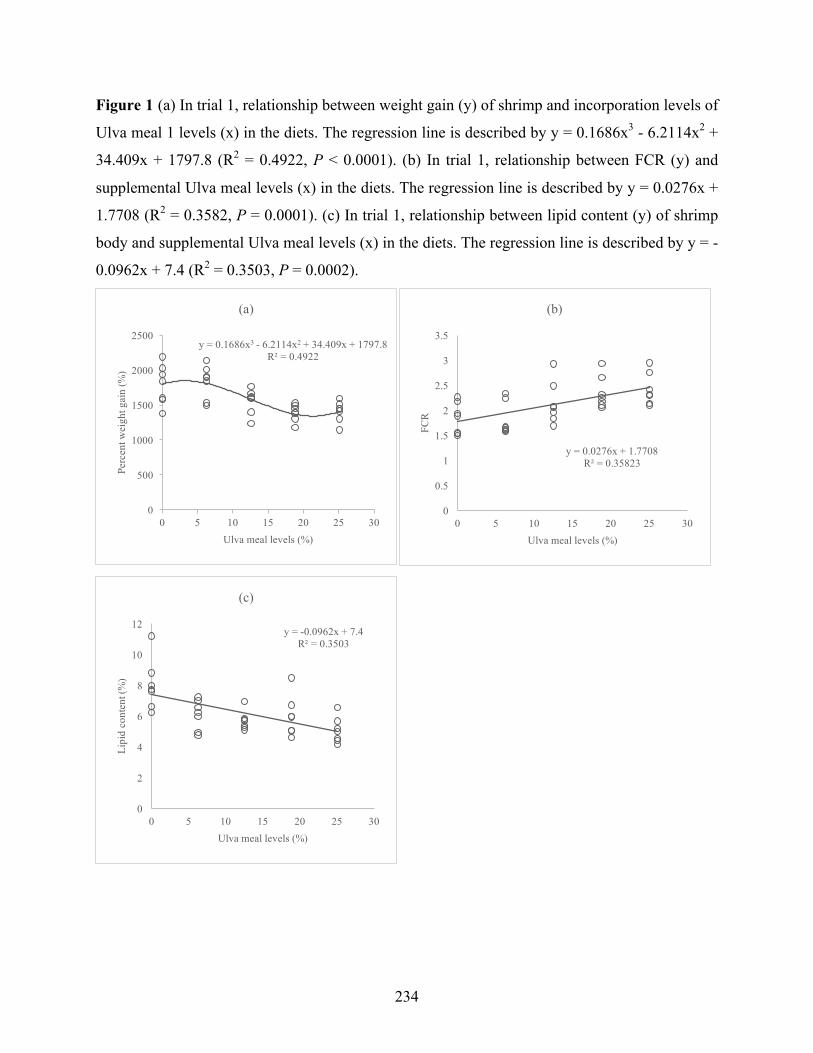
234
Figure 1 (a) In trial 1, relationship between weight gain (y) of shrimp and incorporation levels of
Ulva meal 1 levels (x) in the diets. The regression line is described by y = 0.1686x3 - 6.2114x2 +
34.409x + 1797.8 (R2 = 0.4922, P < 0.0001). (b) In trial 1, relationship between FCR (y) and
supplemental Ulva meal levels (x) in the diets. The regression line is described by y = 0.0276x +
1.7708 (R2 = 0.3582, P = 0.0001). (c) In trial 1, relationship between lipid content (y) of shrimp
body and supplemental Ulva meal levels (x) in the diets. The regression line is described by y = -
0.0962x + 7.4 (R2 = 0.3503, P = 0.0002).
y = 0.1686x3 - 6.2114x2 + 34.409x + 1797.8R² = 0.4922
0
500
1000
1500
2000
2500
0 5 10 15 20 25 30
Perc
entw
eigh
tgai
n(%
)
Ulva meal levels (%)
(a)
y = 0.0276x + 1.7708R² = 0.35823
0
0.5
1
1.5
2
2.5
3
3.5
0 5 10 15 20 25 30
FCR
Ulva meal levels (%)
(b)
y = -0.0962x + 7.4R² = 0.3503
0
2
4
6
8
10
12
0 5 10 15 20 25 30
Lipi
dco
nten
t(%
)
Ulva meal levels (%)
(c)
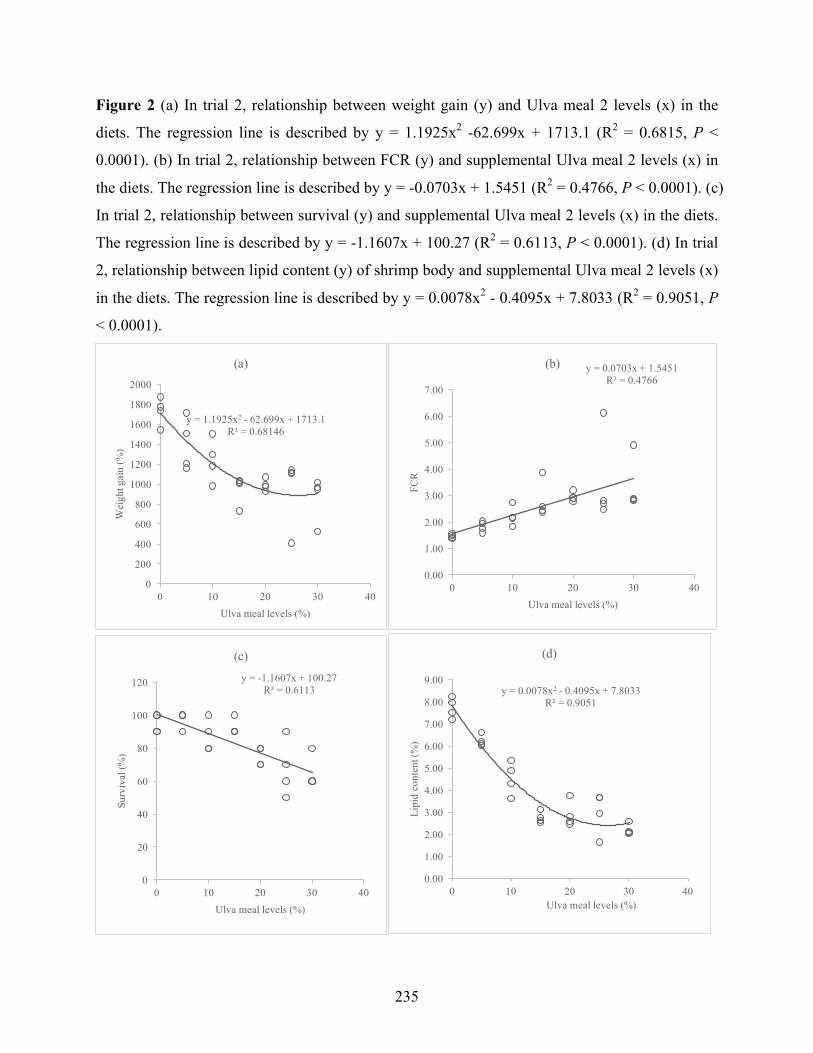
235
Figure 2 (a) In trial 2, relationship between weight gain (y) and Ulva meal 2 levels (x) in the
diets. The regression line is described by y = 1.1925x2 -62.699x + 1713.1 (R2 = 0.6815, P <
0.0001). (b) In trial 2, relationship between FCR (y) and supplemental Ulva meal 2 levels (x) in
the diets. The regression line is described by y = -0.0703x + 1.5451 (R2 = 0.4766, P < 0.0001). (c)
In trial 2, relationship between survival (y) and supplemental Ulva meal 2 levels (x) in the diets.
The regression line is described by y = -1.1607x + 100.27 (R2 = 0.6113, P < 0.0001). (d) In trial
2, relationship between lipid content (y) of shrimp body and supplemental Ulva meal 2 levels (x)
in the diets. The regression line is described by y = 0.0078x2 - 0.4095x + 7.8033 (R2 = 0.9051, P
< 0.0001).
y = 1.1925x2 - 62.699x + 1713.1R² = 0.68146
0
200
400
600
800
1000
1200
1400
1600
1800
2000
0 10 20 30 40
Wei
ghtg
ain
(%)
Ulva meal levels (%)
(a) y = 0.0703x + 1.5451R² = 0.4766
0.00
1.00
2.00
3.00
4.00
5.00
6.00
7.00
0 10 20 30 40
FCR
Ulva meal levels (%)
(b)
y = -1.1607x + 100.27R² = 0.6113
0
20
40
60
80
100
120
0 10 20 30 40
Surv
ival
(%)
Ulva meal levels (%)
(c)
y = 0.0078x2 - 0.4095x + 7.8033R² = 0.9051
0.00
1.00
2.00
3.00
4.00
5.00
6.00
7.00
8.00
9.00
0 10 20 30 40
Lipi
dco
nten
t(%
)
Ulva meal levels (%)
(d)
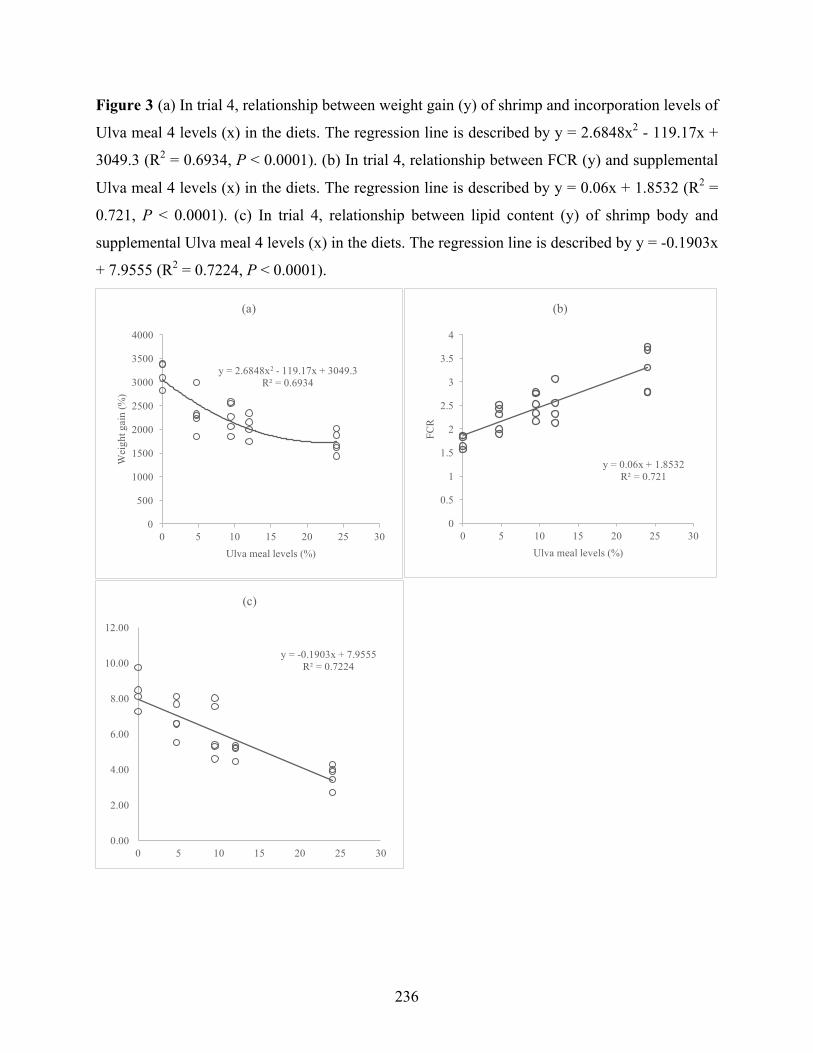
236
Figure 3 (a) In trial 4, relationship between weight gain (y) of shrimp and incorporation levels of
Ulva meal 4 levels (x) in the diets. The regression line is described by y = 2.6848x2 - 119.17x +
3049.3 (R2 = 0.6934, P < 0.0001). (b) In trial 4, relationship between FCR (y) and supplemental
Ulva meal 4 levels (x) in the diets. The regression line is described by y = 0.06x + 1.8532 (R2 =
0.721, P < 0.0001). (c) In trial 4, relationship between lipid content (y) of shrimp body and
supplemental Ulva meal 4 levels (x) in the diets. The regression line is described by y = -0.1903x
+ 7.9555 (R2 = 0.7224, P < 0.0001).
y = 2.6848x2 - 119.17x + 3049.3R² = 0.6934
0
500
1000
1500
2000
2500
3000
3500
4000
0 5 10 15 20 25 30
Wei
ghtg
ain
(%)
Ulva meal levels (%)
(a)
y = 0.06x + 1.8532R² = 0.721
0
0.5
1
1.5
2
2.5
3
3.5
4
0 5 10 15 20 25 30
FCR
Ulva meal levels (%)
(b)
y = -0.1903x + 7.9555R² = 0.7224
0.00
2.00
4.00
6.00
8.00
10.00
12.00
0 5 10 15 20 25 30
(c)
Recommended