8/2/2019 Albert h Haykal Trane
http://slidepdf.com/reader/full/albert-h-haykal-trane 1/20
2nd Middle East District Cooling SummitDoha ,Qatar
11/28/2010 Green District Cooling Plants 1
Green District Cooling Plants
Albert H. Haykal Trane Middle East

8/2/2019 Albert h Haykal Trane
http://slidepdf.com/reader/full/albert-h-haykal-trane 2/20
Carbon Emissions in GCC are among
the highest in the World
11/28/2010Green District Cooling Plants
2
http://en.wikipedia.org/wiki/List_of_countries_by_carbon_dioxide_emissions_per_capita
8/2/2019 Albert h Haykal Trane
http://slidepdf.com/reader/full/albert-h-haykal-trane 3/20
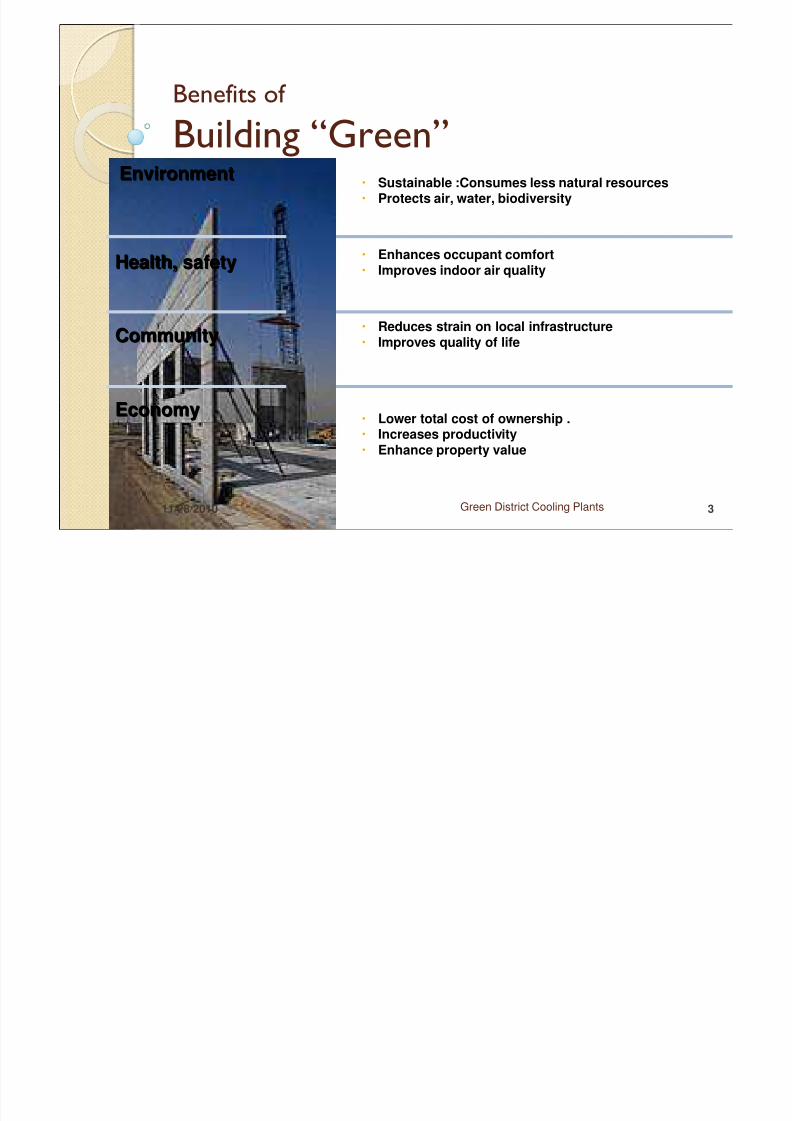
Benefits of
Building “Green”EnvironmentEnvironment
11/28/2010 Green District Cooling Plants 3
Sustainable :Consumes less natural resources Protects air, water, biodiversity
Enhances occupant comfort
Improves indoor air quality
Reduces strain on local infrastructure
Improves quality of life
Lower total cost of ownership . Increases productivity
Enhance property value
Health, safetyHealth, safety
CommunityCommunity
EconomyEconomy
8/2/2019 Albert h Haykal Trane
http://slidepdf.com/reader/full/albert-h-haykal-trane 4/20
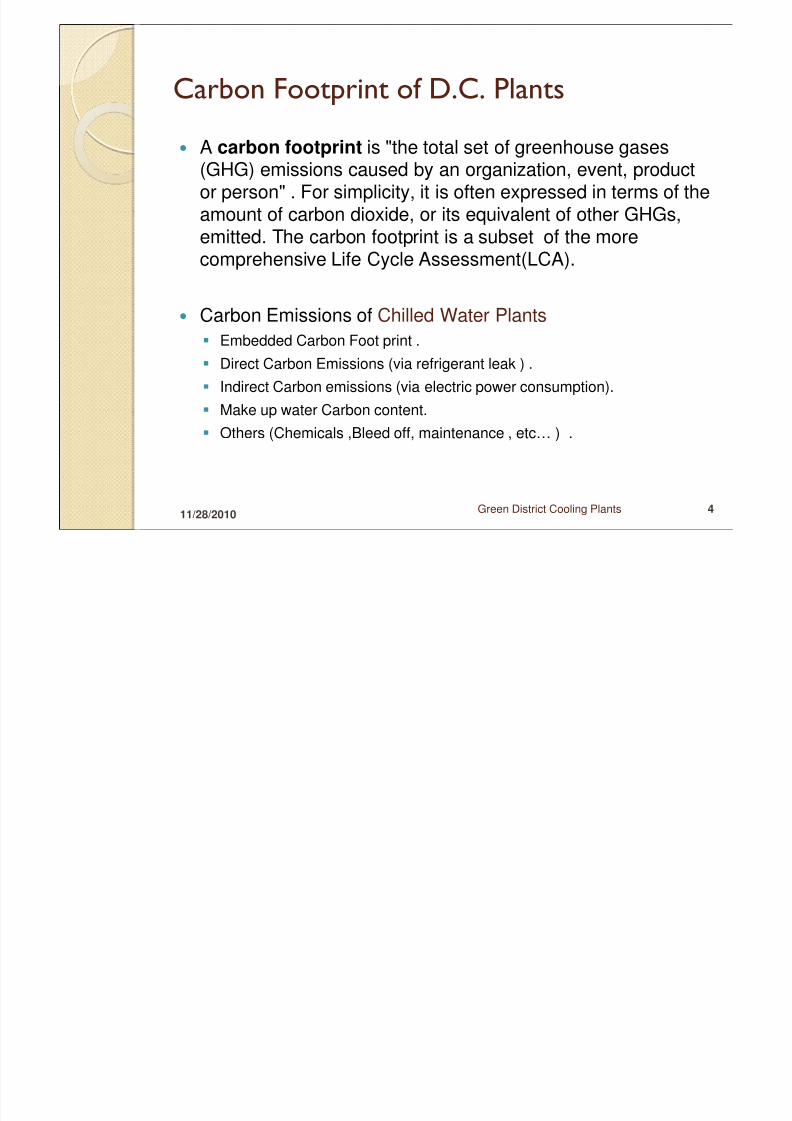
Carbon Footprint of D.C. Plants
A carbon footprint is "the total set of greenhouse gases(GHG) emissions caused by an organization, event, product
or person" . For simplicity, it is often expressed in terms of theamount of carbon dioxide, or its equivalent of other GHGs,emitted. The carbon footprint is a subset of the morecomprehensive Life Cycle Assessment(LCA).
Carbon Emissions of Chilled Water Plants
Embedded Carbon Foot print .
Direct Carbon Emissions (via refrigerant leak ) .
Indirect Carbon emissions (via electric power consumption). Make up water Carbon content.
Others (Chemicals ,Bleed off, maintenance , etc… ) .
11/28/2010Green District Cooling Plants 4

8/2/2019 Albert h Haykal Trane
http://slidepdf.com/reader/full/albert-h-haykal-trane 5/20
Life Cycle Assessment
The international standard for Life Cycle Assessment, ISO14040 (ISO, 2006),states that: “LCA is a technique for assessing the environmental aspects and
potential impacts associated with a product by: compiling an inventory of relevant inputs and outputs of a product system; evaluating the potential environmental impacts associated with those inputs and outputs; and interpreting the results of the inventory analysis and impact assessment phases in relation to the objectives of the study .”
LCA studies the environmental aspects and potential impacts throughout a
product’s life (i.e., from cradle to grave), from raw material acquisition throughproduction, use and disposal. The general impacts needing considerationinclude resource use, human health, and ecological consequences.
11/28/2010 Green District Cooling Plants 5
Storage andConsumption DisposalTransportStorage andRetailDistributionProductionTransportRawMaterials

8/2/2019 Albert h Haykal Trane
http://slidepdf.com/reader/full/albert-h-haykal-trane 6/20
Case Study: 30,000 Tons Typical Chiller Plant UAE
12 nos. Chillers. Average size 2500 tons.
Chillers in series-series counter-flow configuration.
No chilled water storage.
Open Type cooling tower (6 cells)
Fresh make up water supply.
Primary and Secondary chilled water andcondenser water pumps.
Green District Cooling Plants 611/28/2010

8/2/2019 Albert h Haykal Trane
http://slidepdf.com/reader/full/albert-h-haykal-trane 7/20
Chiller Plant Carbon Balance
11/28/2010 Green District Cooling Plants 7
Construction
Phase
Inputs
Equipment
Materials
Labor
Transport
Machineries
Power
Outputs
Chemicals
/Debris
Operation
Phase
Inputs
Water
Electrical
Power
Labor
Chemicals
Spare Parts
Outputs
Water Vapor
Cooling Tower
Bleed off
Chemicals
Ref. Emissions
Disposal
Phase
Inputs
MachineriesPower
Transport
Labor
Outputs
Debris
Refrigerant
Emissions
Chemicals

8/2/2019 Albert h Haykal Trane
http://slidepdf.com/reader/full/albert-h-haykal-trane 8/20
Chillers Carbon Balance
11/28/2010 Green District Cooling Plants 8
Construction
Phase –
Embedded
Inputs
Equipment/
parts
Raw Materials
Labor
Manufacturing
Power
Transport
Outputs
Chemicals
/Debris
Operation
Phase
Inputs
Water
Electrical
Power
Labor
Chemicals
Spare Parts
Outputs
Ref. Emissions
DisposalPhase
Inputs
Transport
Labor
Outputs
Debris
RefrigerantEmissions

8/2/2019 Albert h Haykal Trane
http://slidepdf.com/reader/full/albert-h-haykal-trane 9/20
Chiller Embedded Carbon
Construction Phase
11/28/2010 Green District Cooling Plants 9
Description Carbon (Tons CO2) % of total
Total Rawmaterials carbonfootprint 1557.49 75.83%
Manufacturing
Carbon 122.405.96%
Total TransportCarbon 374.04 18.21%
Total EmbeddedCarbon 2053.93 100.00%
8/2/2019 Albert h Haykal Trane
http://slidepdf.com/reader/full/albert-h-haykal-trane 10/20
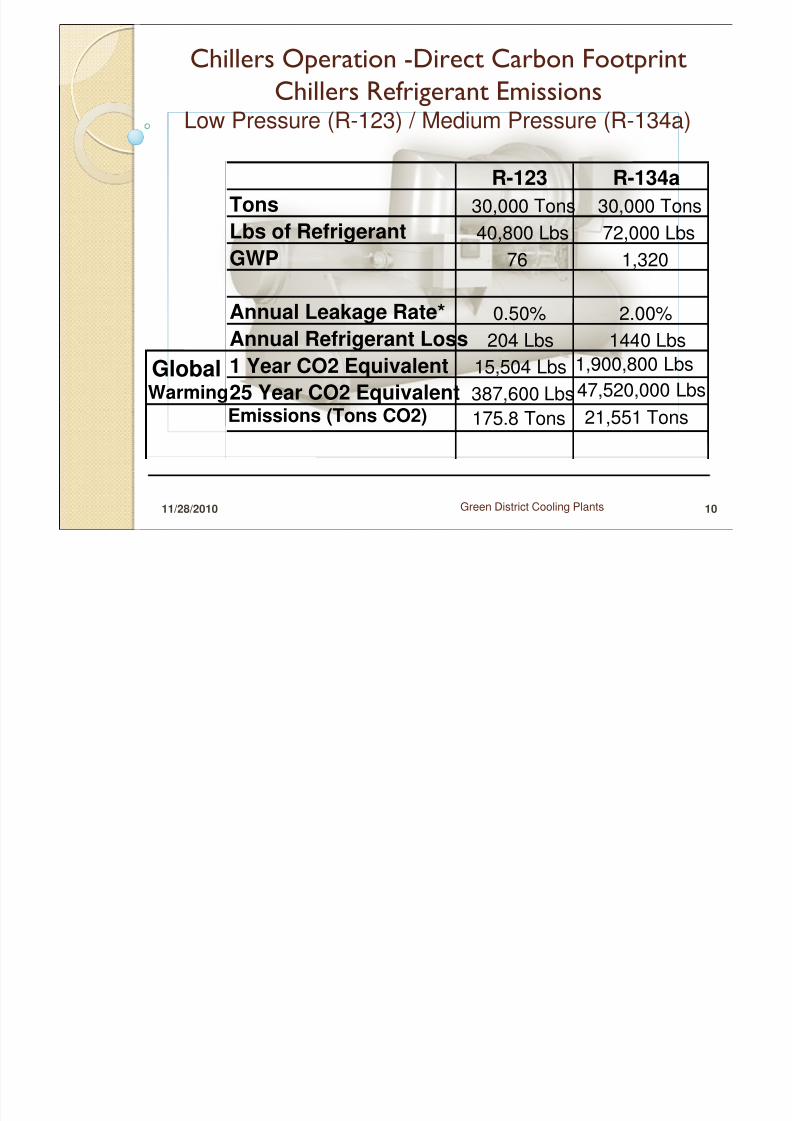
Chillers Operation -Direct Carbon Footprint
Chillers Refrigerant EmissionsLow Pressure (R-123) / Medium Pressure (R-134a)
11/28/2010 Green District Cooling Plants 10
R-123 R-134a
Tons 30,000 Tons 30,000 Tons
Lbs of Refrigerant 40,800 Lbs 72,000 Lbs
GWP 76 1,320
Annual Leakage Rate* 0.50% 2.00%
Annual Refrigerant Loss 204 Lbs 1440 Lbs
Global 1 Year CO2 Equivalent
25 Year CO2 Equivalent
15,504 Lbs 1,900,800 Lbs
Warming 387,600 Lbs47,520,000 LbsEmissions (Tons CO2) 175.8 Tons 21,551 Tons

8/2/2019 Albert h Haykal Trane
http://slidepdf.com/reader/full/albert-h-haykal-trane 11/20
Chillers Operation Indirect Carbon Emissions
Operation for 25 years
11/28/2010 Green District Cooling Plants 11
Operational Carbon for the chiller plant due to Electrical powerTotalCapacity
(Tons)
Chiller yearly totalelectric consumption
(kW-hr per year)
Total KW-hr for25 years
Base CO2emissions
(Kg CO2 / kw-hr )
CO2 Emissionsfor 25 years
(Tons )
Chillers 30,000 63,000,000 1,575,000,000 0.577 908,775
Plant Estimate 30,000 90,000,000 2,250,000,000 0.577 1,298,250
Operational Carbon for the chiller plant due to make up Water Supply
Total
Capacity(Tons)
Yearly make up water
volume
(liters)
Total make up
water for 25years(liters)
Equivalence
CO2 emissions
(kg co2/1000liters)
CO2
Emissions for25 years
(Tons CO2) )Plant/chillerEstimate 30,000 684,000,000 17,100,000,000 3.256 55,678
Total chiller
Carbon 30,000 964,453Total PlantCarbon 30,000 1,353,928
8/2/2019 Albert h Haykal Trane
http://slidepdf.com/reader/full/albert-h-haykal-trane 12/20
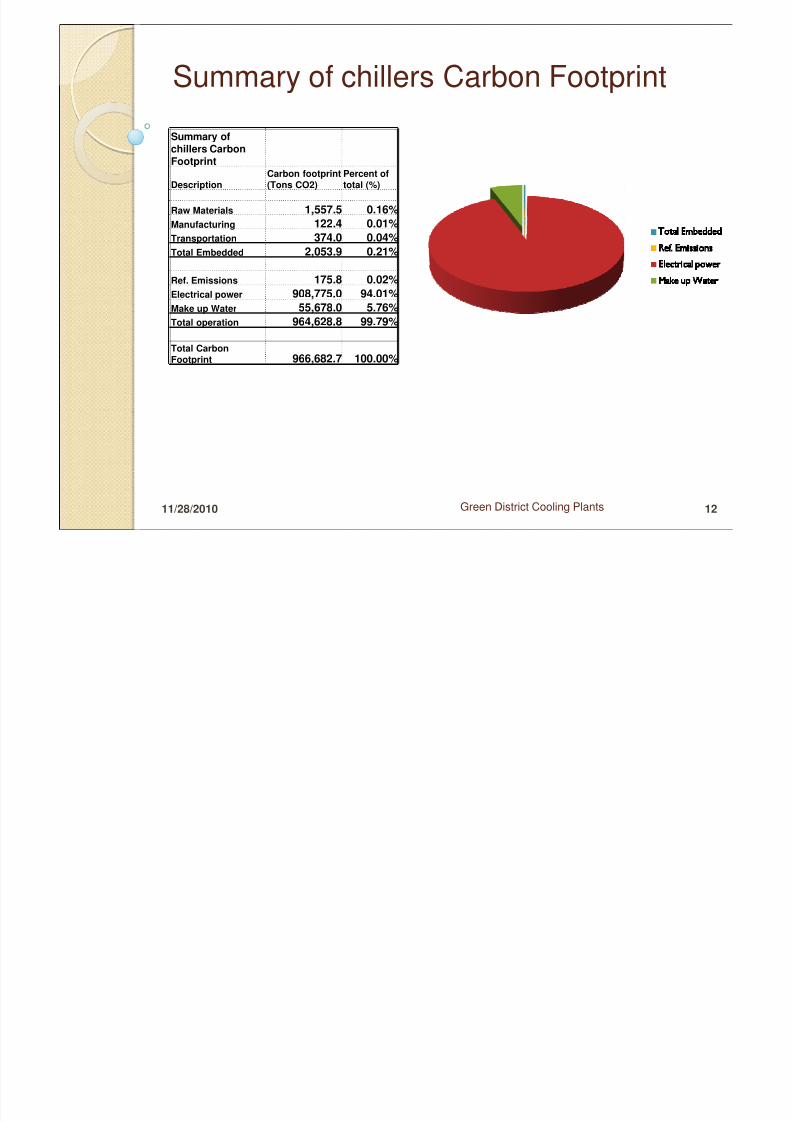
Summary of chillers Carbon Footprint
11/28/2010 Green District Cooling Plants 12
Summary ofchillers CarbonFootprint
DescriptionCarbon footprint(Tons CO2)
Percent oftotal (%)
Raw Materials 1,557.5 0.16%
Manufacturing 122.4 0.01%
Transportation 374.0 0.04%
Total Embedded 2,053.9 0.21%
Ref. Emissions 175.8 0.02%
Electrical power 908,775.0 94.01%Make up Water 55,678.0 5.76%
Total operation 964,628.8 99.79%
Total CarbonFootprint 966,682.7 100.00%

8/2/2019 Albert h Haykal Trane
http://slidepdf.com/reader/full/albert-h-haykal-trane 13/20
What Is Important Over the Life of a Chiller ?What Is Important Over the Life of a Chiller ?
11/28/2010 Green District Cooling PlantsGreen District Cooling Plants 13
Electric Energy (94.01%)
Make up water (5.76%)
Embedded Carbon(0.21%)
Refrigerant Emissions (0.02%)

8/2/2019 Albert h Haykal Trane
http://slidepdf.com/reader/full/albert-h-haykal-trane 14/20
Summary of chillers Carbon FootprintSummary of chillers Carbon Footprint
(Only Emissions adjusted for Medium pressure R134a Chillers)(Only Emissions adjusted for Medium pressure R134a Chillers)
11/28/2010 Green District Cooling PlantsGreen District Cooling Plants 14
Summary of chillersCarbon Footprint
Description Carbon footprint (Tons CO2) KG CO2 per Ref. Tons Percent of total (%)
Total Embedded 2,053.9 68.5 0.21%
Ref. Emissions 21,551.0 718.4 2.18%
Electrical power 908,775.0 30,292.5 91.98%
Make up Water 55,678.0 1,855.9 5.64%
Total operation 986,004.0 32,866.8 99.79%
Total Carbon Footprint 988,057.9 32,935.3 100.00%

8/2/2019 Albert h Haykal Trane
http://slidepdf.com/reader/full/albert-h-haykal-trane 15/20
What Is Important Over the Life of a Chiller ?What Is Important Over the Life of a Chiller ?
11/28/2010 Green District Cooling PlantsGreen District Cooling Plants 15
Electric Energy (91.98%)
Make up water (5.64%)
Embedded Carbon (0.21%)
Refrigerant Emissions (2.18%)

8/2/2019 Albert h Haykal Trane
http://slidepdf.com/reader/full/albert-h-haykal-trane 16/20
Estimated Plant Carbon Footprintlow pressure chillers
11/28/2010 Green District Cooling Plants 16
To be offset byplanting 50.87Million Tree !!
Summary of Plant CarbonFootprint
Description Carbon footprint (Tons CO2) Percent of total (%)
Est.Total Embedded 30,000.0 2.17%
Ref. Emissions(Low Pressure) 175.8 0.01%
Electrical power 1,298,450.0 93.80%
Make up Water 55,678.0 4.02%
Total operation 1,354,303.8 97.83%
Total Carbon Footprint 1,384,303.8 100.00%

8/2/2019 Albert h Haykal Trane
http://slidepdf.com/reader/full/albert-h-haykal-trane 17/20
What Is Important Over the Life of a Chiller Plant ?What Is Important Over the Life of a Chiller Plant ?
11/28/2010 Green District Cooling PlantsGreen District Cooling Plants 17
Electric Energy (93.8%)
Make up water (4.02%)
Embedded Carbon(2.17%)
Refrigerant Emissions (0.01%)

8/2/2019 Albert h Haykal Trane
http://slidepdf.com/reader/full/albert-h-haykal-trane 18/20
Conclusion:
Power consumption is by far the biggest contributor to Carbon footprint.
To reduce the carbon footprint Increase chiller/system efficiency. Recycled raw material will have minor effect on total Carbon Footprint.
TSE or Sea Water will have minimal impact on carbon footprint.
Additional / larger heat exchange area will deliver attractive payback.
Refrigerant emissions: Negligible for Low pressure chillers while more
important than embedded carbon for Medium pressure chillers .
11/28/2010 Green District Cooling Plants 18
8/2/2019 Albert h Haykal Trane
http://slidepdf.com/reader/full/albert-h-haykal-trane 19/20
Albert Haykal Albert Haykal District Cooling Leader Trane Middle East
Trane
P.O. Box 31000 Dubai ,U.A.E Tel 04-3460080 Fax 04-3460081Mobile :050-6162474 [email protected]
11/28/2010 Green District Cooling PlantsGreen District Cooling Plants 19

8/2/2019 Albert h Haykal Trane
http://slidepdf.com/reader/full/albert-h-haykal-trane 20/20
SummarySummary
Focus on reduction of power consumption
Embedded plant carbon is relatively negligible .
Water in GCC has a carbon footprint but for theplant , it is relatively small .
Direct Carbon Emissions are negligible for lowpressure (R123)chillers but might be moreimportant for Medium pressure chillers
◦
.
11/28/2010 Green District Cooling Plants 20
Recommended