September 2015 Corporate Presentation
2
Cautionary NotesNo stock exchange, securities commission or other regulatory authority has approved or disapproved the information contained herein. Certain statements in this presentation are “forward-looking statements”, including within the meaning of the United States Securities Exchange Act of 1934, as amended. All statements other than statements of historical fact included in this presentation, including without limitation statements regarding forecast gold production, gold grades, recoveries, waste-to-ore ratios, total cash costs, potential mineralization and reserves, exploration results, and future plans and objectives of Alamos, are forward-looking statements based on forecasts of future operational or financial results, estimates of amounts not yet determinable and assumptions of management that involve various risks and uncertainties. Any statements that express or involve discussions with respect to predictions, expectations, beliefs, plans, projections, objectives, assumptions or future events or performance (often, but not always, using words or phrases such as “expects” or “does not expect”, “is expected”, “anticipates” or “does not anticipate”, “plans”, “estimates” or “intends”, or stating that certain actions, events or results “may”, “could”, “would”, “might” or “will” be taken, occur or be achieved) are not statements of historical fact and may be “forward-looking statements.” Alamos cautions that forward-looking information involves known and unknown risks, uncertainties and other factors that may cause Alamos' actual results, performance or achievements to be materially different from those expressed or implied by such information, including, but not limited to, gold and silver price volatility; fluctuations in foreign exchange rates and interest rates; the impact of any hedging activities; discrepancies between actual and estimated production, between actual and estimated reserves and resources or between actual and estimated metallurgical recoveries; costs of production; capital expenditure requirements; the costs and timing of construction and development of new deposits; and the success of exploration and permitting activities. In addition, the factors described or referred to in the section entitled “Risk Factors” in both Alamos Gold Inc.’s Annual Information Form for the year ended December 31, 2014 and the Annual Information Form for the year ended December 31, 2014 of AuRico Gold Inc., (each a predecessor to Alamos Gold Inc.), along with each of these entities’ subsequent public filings available on the SEDAR website at www.sedar.com, should be reviewed in conjunction with the information found in this presentation. Although Alamos has attempted to identify important factors that could cause actual results, performance or achievements to differ materially from those contained in forward-looking information, there can be other factors that cause results, performance or achievements not to be as anticipated, estimated or intended. There can be no assurance that such information will prove to be accurate or that management’s expectations or estimates of future developments, circumstances or results will materialize. Accordingly, readers should not place undue reliance on forward-looking information.
Note to U.S. InvestorsAlamos prepares its disclosure in accordance with the requirements of securities laws in effect in Canada, which differ from the requirements of U.S. securities laws. Terms relating to mineral resources in this presentation are defined in accordance with National Instrument 43-101 – Standards of Disclosure for Mineral Projects under the guidelines set out in the Canadian Institute of Mining, Metallurgy, and Petroleum Standards on Mineral Resources and Mineral Reserves. The United States Securities and Exchange Commission (the “SEC”) permits mining companies, in their filings with the SEC, to disclose only those mineral deposits that a company can economically and legally extract or produce. Alamos may use certain terms, such as “measured mineral resources”, “indicated mineral resources”, “inferred mineral resources” and “probable mineral reserves” that the SEC does not recognize (these terms may be used in this presentation and are included in the public filings of Alamos, which have been filed with the SEC and the securities commissions or similar authorities in Canada).
Cautionary non-GAAP Measures and Additional GAAP MeasuresNote that for purposes of this section, GAAP refers to IFRS. The Company believes that investors use certain non-GAAP and additional GAAP measures as indicators to assess gold mining companies. They are intended to provide additional information and should not be considered in isolation or as a substitute for measures of performance prepared with GAAP.Additional GAAP measures that are presented on the face of the Company’s consolidated statements of comprehensive income include “Mine operating costs”, “Earnings from mine operations” and “Earnings from operations”. These measures are intended to provide an indication of the Company’s mine and operating performance. “Cash flow from operating activities before changes in non-cash working capital” is a non-GAAP performance measure that could provide an indication of the Company’s ability to generate cash flows from operations, and is calculated by adding back the change in non-cash working capital to “Cash provided by (used in) operating activities” as presented on the Company’s consolidated statements of cash flows. “Free cash flow” is a non-GAAP performance measure that is calculated as cash flows from operations net of cash flows invested in mineral property, plant and equipment and exploration and evaluation assets as presented on the Company’s consolidated statements of cash flows and that would provide an indication of the Company’s ability to generate cash flows from its mineral projects. Return on Equity is defined as Earnings from Continuing Operations divided by the average Total Equity for the current and previous year. “Mining cost per tonne of ore” and “Cost per tonne of ore” are non-GAAP performance measures that could provide an indication of the mining and processing efficiency and effectiveness of the mine. These measures are calculated by dividing the relevant mining and processing costs and total costs by the tonnes of ore processed in the period. “Cost per tonne of ore” is usually affected by operating efficiencies and waste-to-ore ratios in the period. “Cash operating costs per ounce”, “total cash costs per ounce” and “all-in sustaining costs per ounce” as used in this analysis are non-GAAP terms typically used by gold mining companies to assess the level of gross margin available to the Company by subtracting these costs from the unit price realized during the period. These non-GAAP terms are also used to assess the ability of a mining company to generate cash flow from operations. There may be some variation in the method of computation of these metrics as determined by the Company compared with other mining companies. In this context, “cash operating costs per ounce” reflects the cash operating costs allocated from in-process and dore inventory associated with ounces of gold sold in the period. “Cash operating costs per ounce” may vary from one period to another due to operating efficiencies, waste-to-ore ratios, grade of ore processed and gold recovery rates in the period. “Total cash costs per ounce” includes “cash operating costs per ounce” plus applicable royalties. Cash operating costs per ounce and total cash costs per ounce are exclusive of exploration costs. “All-in sustaining costs per ounce” include total cash costs, exploration, corporate and administrative, share based compensation and sustaining capital costs. Non-GAAP and additional GAAP measures do not have a standardized meaning prescribed under IFRS and therefore may not be comparable to similar measures presented by other companies. For a reconciliation of non-GAAP and GAAP measures, please refer to Alamos’ Managements’ Discussion and Analysis as presented on SEDAR and the Company’s website.
Technical InformationExcept as otherwise noted herein, Chris Bostwick, FAusIMM, Alamos Gold’s Vice President, Technical Services, has reviewed and approved the scientific and technical information contained in this presentation. Chris Bostwick is a Qualified Person within the meaning of Canadian Securities Administrator’s National Instrument 43-101. For more information, please refer to the Alamos Gold Inc. and AuRico Gold Inc. 2014 Annual Information Forms and the technical reports referenced therein and in this presentation, available on SEDAR (www.sedar.com).
All figures in US$ unless otherwise indicated.
Cautionary Notes
3
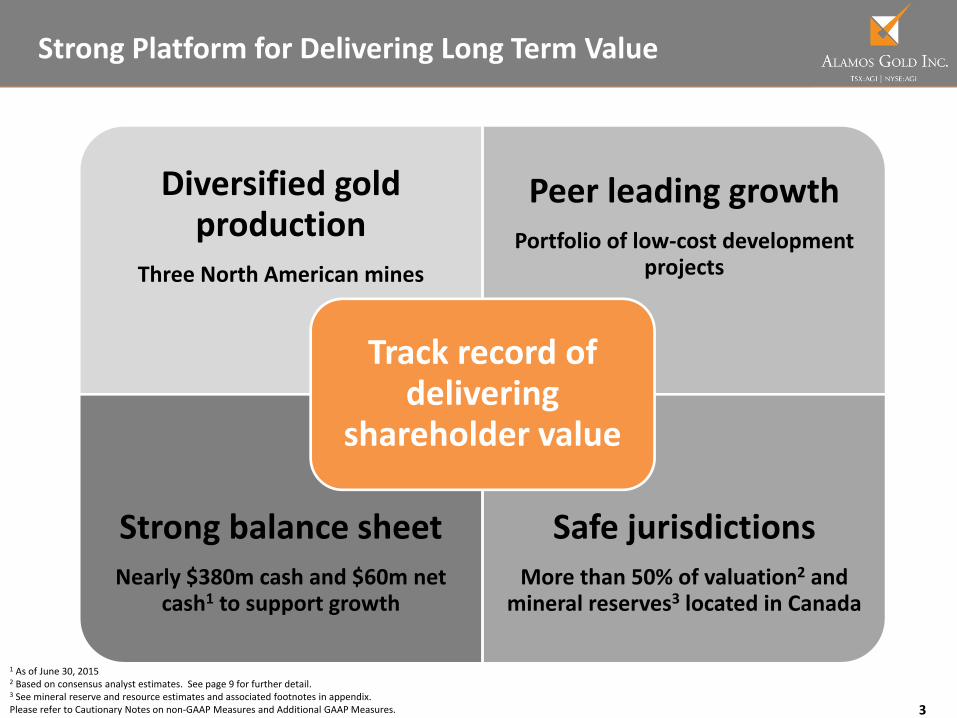
1 As of June 30, 2015 2 Based on consensus analyst estimates. See page 9 for further detail.3 See mineral reserve and resource estimates and associated footnotes in appendix. Please refer to Cautionary Notes on non‐GAAP Measures and Additional GAAP Measures.
Strong Platform for Delivering Long Term Value
Diversified gold production
Three North American mines
Peer leading growthPortfolio of low‐cost development
projects
Strong balance sheetNearly $380m cash and $60m net
cash1 to support growth
Safe jurisdictionsMore than 50% of valuation2 and
mineral reserves3 located in Canada
Track record of delivering
shareholder value
4
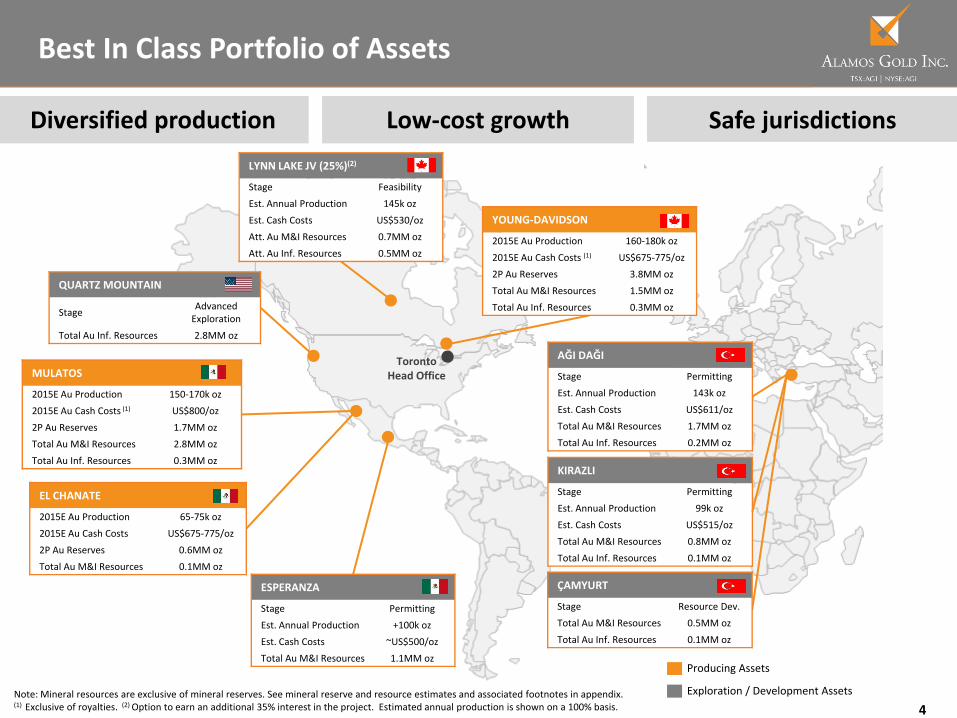
Best In Class Portfolio of Assets
Note: Mineral resources are exclusive of mineral reserves. See mineral reserve and resource estimates and associated footnotes in appendix. (1) Exclusive of royalties. (2) Option to earn an additional 35% interest in the project. Estimated annual production is shown on a 100% basis.
MULATOS
2015E Au Production 150‐170k oz
2015E Au Cash Costs (1) US$800/oz
2P Au Reserves 1.7MM oz
Total Au M&I Resources 2.8MM oz
Total Au Inf. Resources 0.3MM oz
EL CHANATE
2015E Au Production 65‐75k oz
2015E Au Cash Costs US$675‐775/oz
2P Au Reserves 0.6MM oz
Total Au M&I Resources 0.1MM oz
QUARTZ MOUNTAIN
Stage AdvancedExploration
Total Au Inf. Resources 2.8MM oz
YOUNG‐DAVIDSON
2015E Au Production 160‐180k oz
2015E Au Cash Costs (1) US$675‐775/oz
2P Au Reserves 3.8MM oz
Total Au M&I Resources 1.5MM oz
Total Au Inf. Resources 0.3MM oz
AĞI DAĞI
Stage Permitting
Est. Annual Production 143k oz
Est. Cash Costs US$611/oz
Total Au M&I Resources 1.7MM oz
Total Au Inf. Resources 0.2MM oz
Producing Assets
Exploration / Development Assets
TorontoHead Office
ESPERANZA
Stage Permitting
Est. Annual Production +100k oz
Est. Cash Costs ~US$500/oz
Total Au M&I Resources 1.1MM oz
KIRAZLI
Stage Permitting
Est. Annual Production 99k oz
Est. Cash Costs US$515/oz
Total Au M&I Resources 0.8MM oz
Total Au Inf. Resources 0.1MM oz
ÇAMYURT
Stage Resource Dev.
Total Au M&I Resources 0.5MM oz
Total Au Inf. Resources 0.1MM oz
LYNN LAKE JV (25%)(2)
Stage Feasibility
Est. Annual Production 145k oz
Est. Cash Costs US$530/oz
Att. Au M&I Resources 0.7MM oz
Att. Au Inf. Resources 0.5MM oz
Diversified production Low‐cost growth Safe jurisdictions
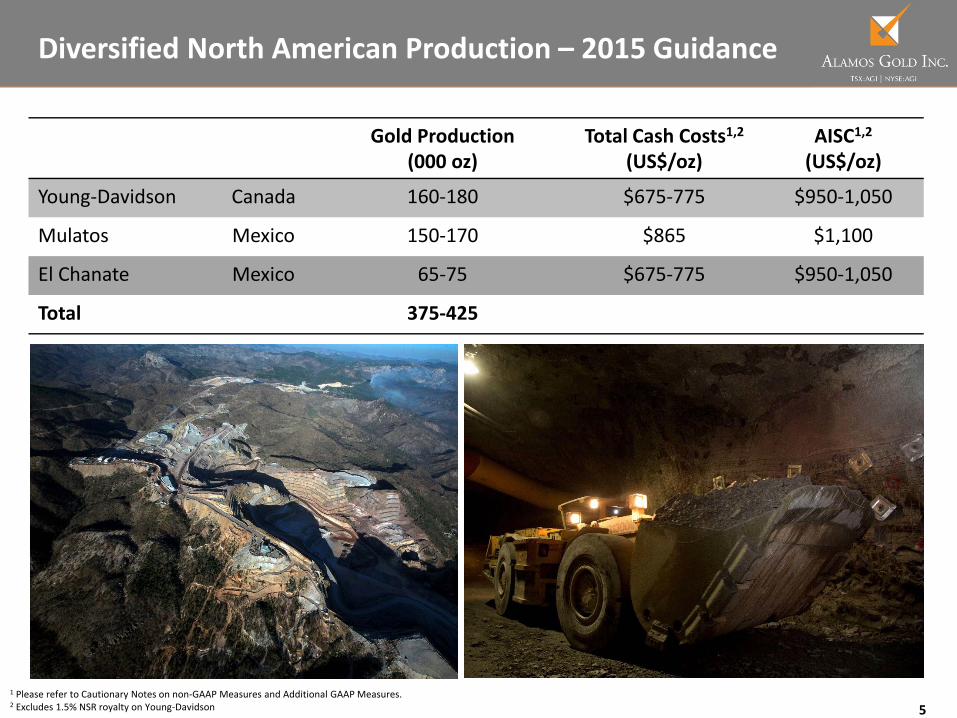
51 Please refer to Cautionary Notes on non‐GAAP Measures and Additional GAAP Measures.2 Excludes 1.5% NSR royalty on Young‐Davidson
Diversified North American Production – 2015 Guidance
Gold Production(000 oz)
Total Cash Costs1,2(US$/oz)
AISC1,2(US$/oz)
Young‐Davidson Canada 160‐180 $675‐775 $950‐1,050
Mulatos Mexico 150‐170 $865 $1,100
El Chanate Mexico 65‐75 $675‐775 $950‐1,050
Total 375‐425
Leading development pipelineGrowth at
existing operations
Existing production
6Please refer to Cautionary Notes on non‐GAAP Measures and Additional GAAP Measures.
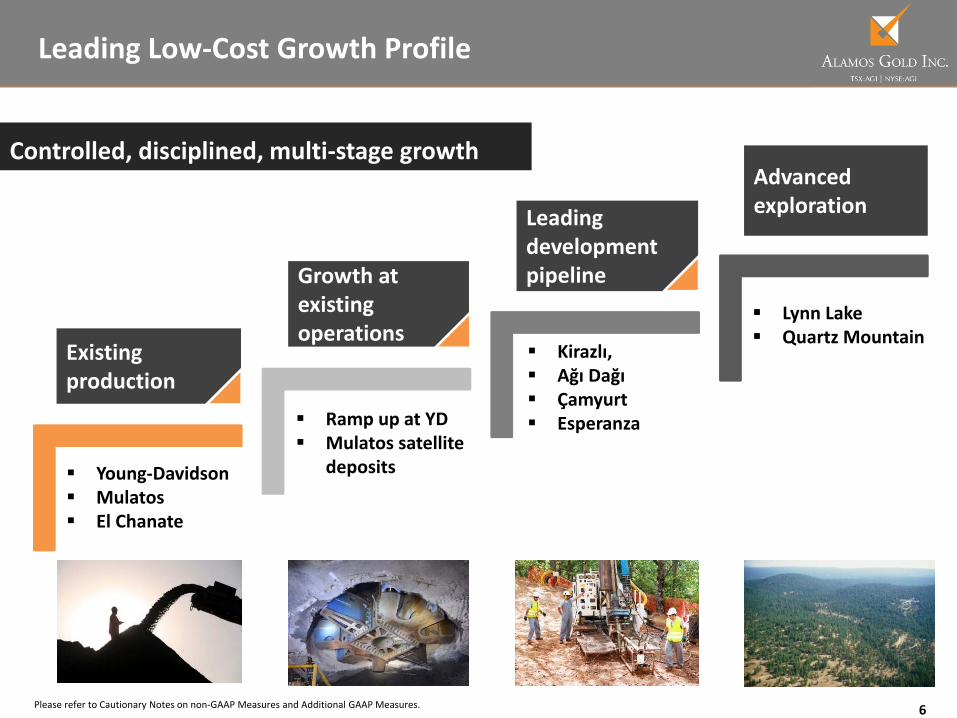
Leading Low‐Cost Growth Profile
Controlled, disciplined, multi‐stage growth
Young‐Davidson Mulatos El Chanate
Ramp up at YD Mulatos satellite
deposits
Kirazlı, Ağı Dağı Çamyurt Esperanza
Lynn Lake Quartz Mountain
Advanced exploration
7
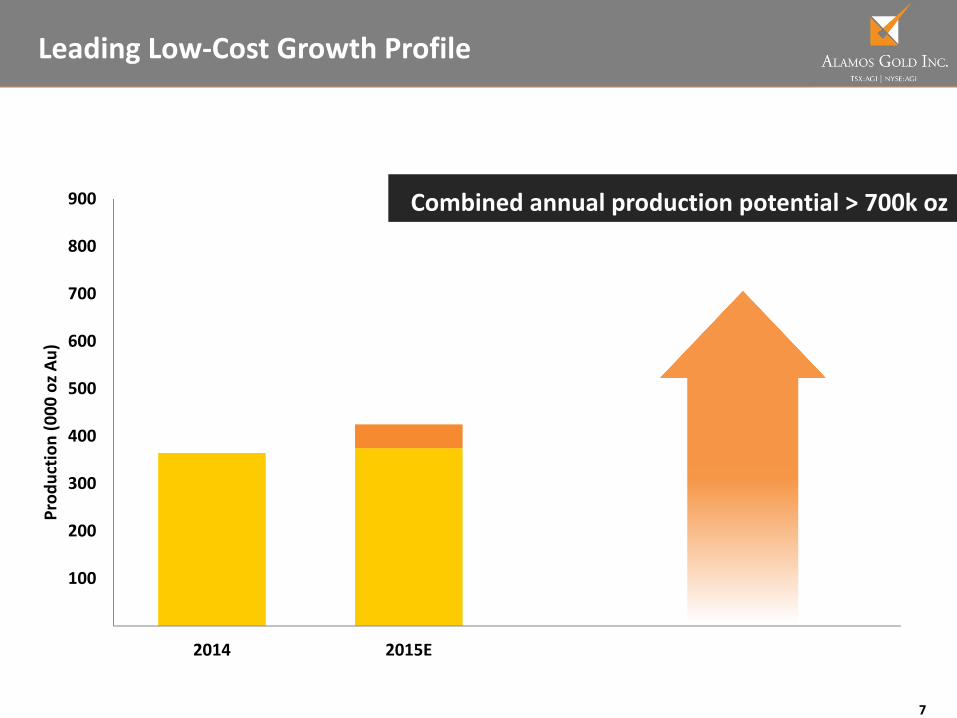
Leading Low‐Cost Growth Profile
Combined annual production potential > 700k oz
0
100
200
300
400
500
600
700
800
900
2014 2015E
Prod
uctio
n (000
oz A
u)
8
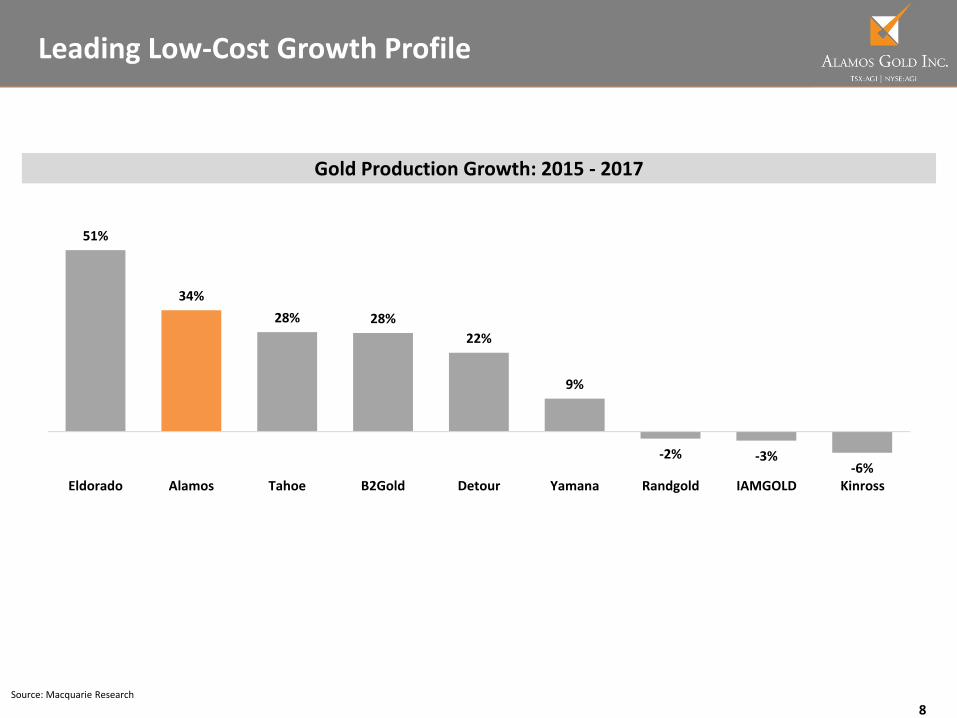
Leading Low‐Cost Growth Profile
Gold Production Growth: 2015 ‐ 2017
51%
34%28% 28%
22%
9%
‐2% ‐3%‐6%
Eldorado Alamos Tahoe B2Gold Detour Yamana Randgold IAMGOLD Kinross
Source: Macquarie Research
9
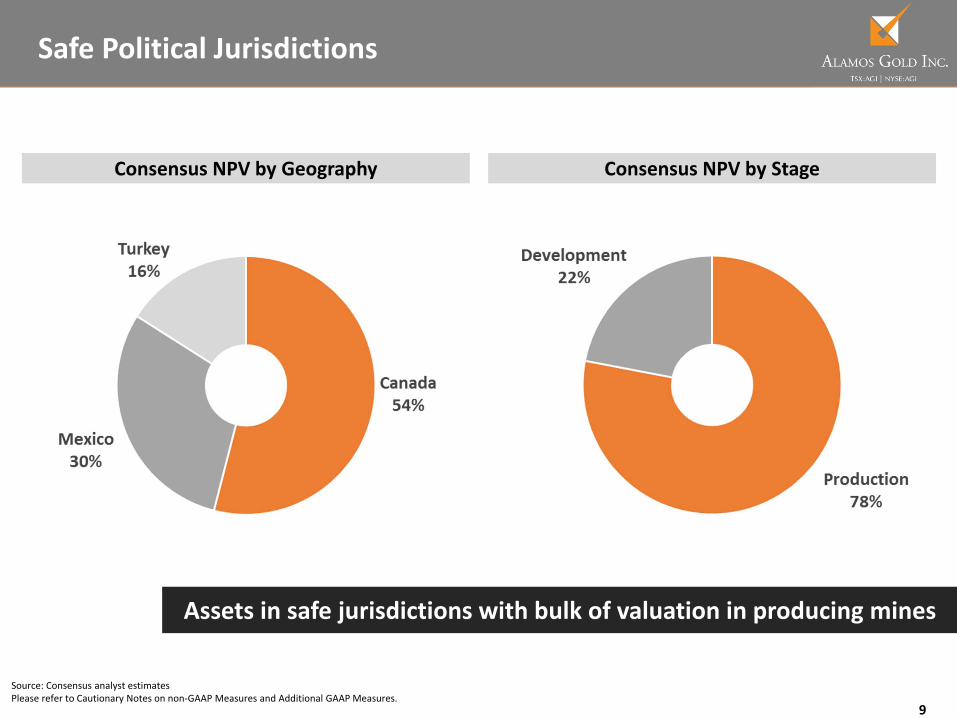
Source: Consensus analyst estimatesPlease refer to Cautionary Notes on non‐GAAP Measures and Additional GAAP Measures.
Safe Political Jurisdictions
Assets in safe jurisdictions with bulk of valuation in producing mines
Consensus NPV by Geography Consensus NPV by Stage
10Source: Consensus analyst estimates and Fraser Institute Annual Survey of Mining Companies: 2014Please refer to Cautionary Notes on non‐GAAP Measures and Additional GAAP Measures.
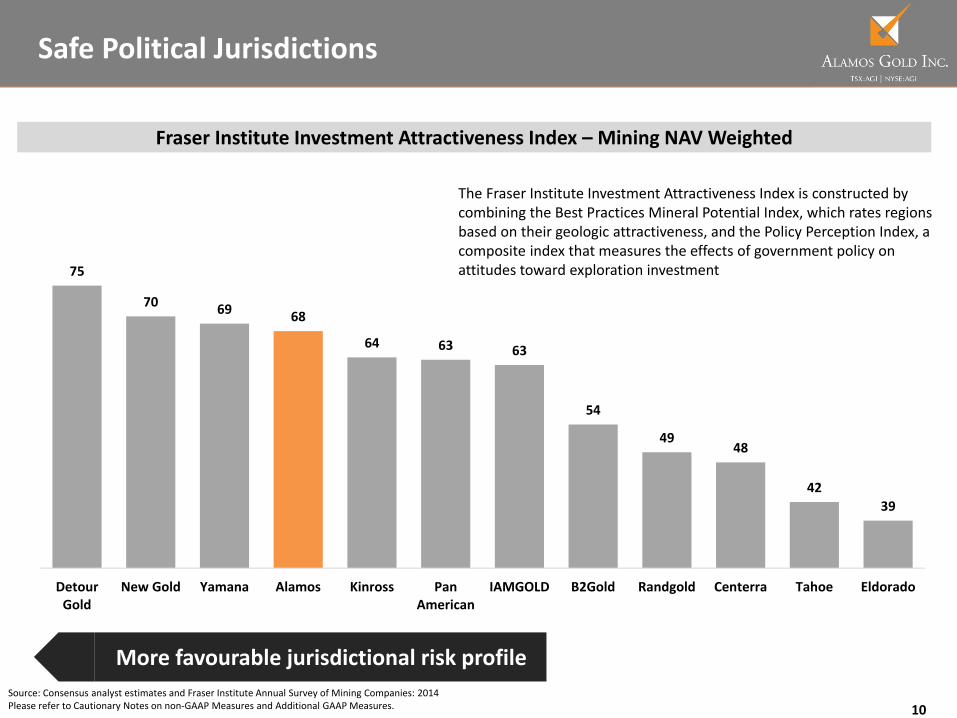
Safe Political Jurisdictions
Fraser Institute Investment Attractiveness Index – Mining NAV Weighted
The Fraser Institute Investment Attractiveness Index is constructed by combining the Best Practices Mineral Potential Index, which rates regions based on their geologic attractiveness, and the Policy Perception Index, a composite index that measures the effects of government policy on attitudes toward exploration investment
More favourable jurisdictional risk profile
75
70 69 68
64 63 63
54
4948
4239
DetourGold
New Gold Yamana Alamos Kinross PanAmerican
IAMGOLD B2Gold Randgold Centerra Tahoe Eldorado
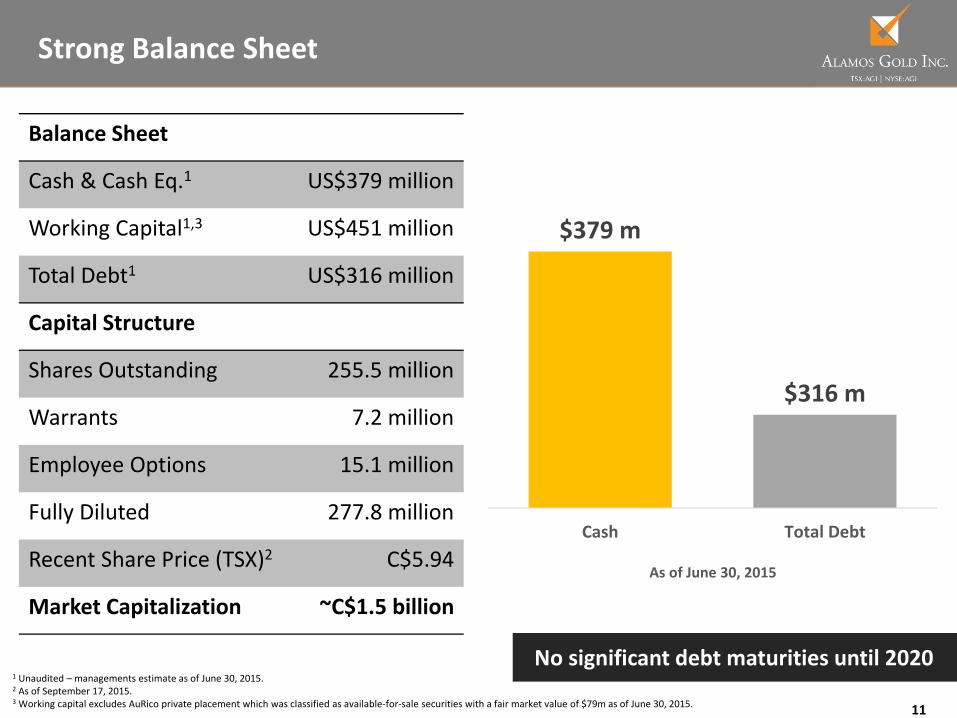
1 Unaudited – managements estimate as of June 30, 2015.2 As of September 17, 2015.3 Working capital excludes AuRico private placement which was classified as available‐for‐sale securities with a fair market value of $79m as of June 30, 2015. 11
Strong Balance Sheet
No significant debt maturities until 2020
$379 m
$316 m
Cash Total Debt
As of June 30, 2015
Balance Sheet
Cash & Cash Eq.1 US$379 million
Working Capital1,3 US$451 million
Total Debt1 US$316 million
Capital Structure
Shares Outstanding 255.5 million
Warrants 7.2 million
Employee Options 15.1 million
Fully Diluted 277.8 million
Recent Share Price (TSX)2 C$5.94
Market Capitalization ~C$1.5 billion
12Source: Factset and company disclosure. Based on unaudited financial statements for the period ending June 30, 2015.Please refer to Cautionary Notes on non‐GAAP Measures and Additional GAAP Measures.
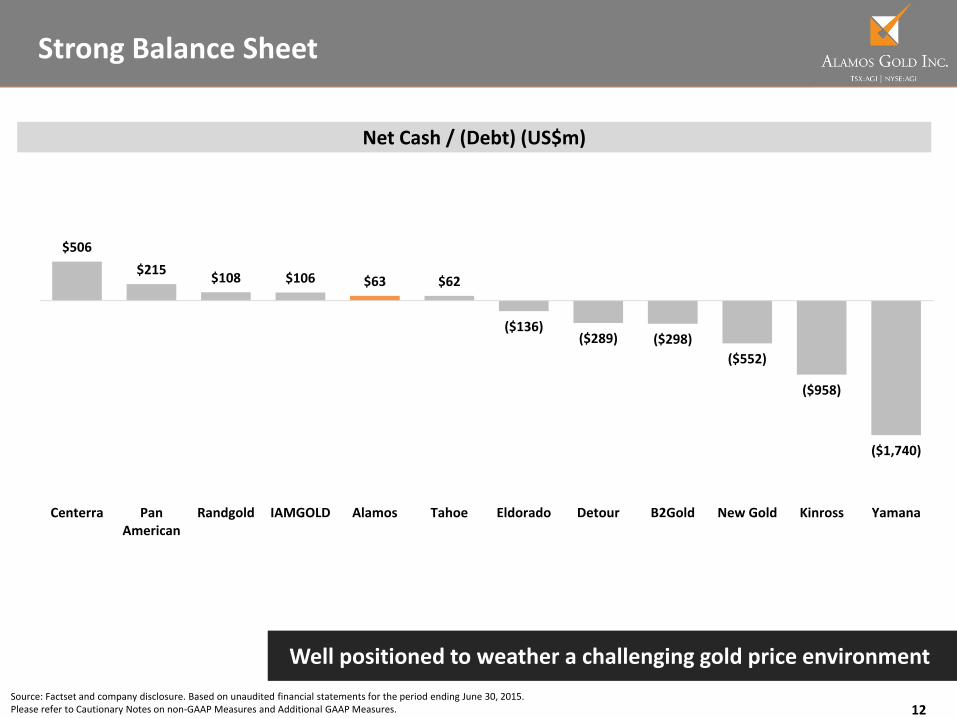
Strong Balance Sheet
Well positioned to weather a challenging gold price environment
Net Cash / (Debt) (US$m)
$506 $215 $108 $106 $63 $62
($136)($289) ($298)
($552)
($958)
($1,740)
Centerra PanAmerican
Randgold IAMGOLD Alamos Tahoe Eldorado Detour B2Gold New Gold Kinross Yamana

13
1 Please refer to Cautionary Notes on non‐GAAP Measures and Additional GAAP Measures.2 2015 total cash cost and AISC guidance excludes 1.5% NSR royalty on Young‐Davidson.3 See mineral reserve and resource estimates and associated footnotes in appendix.4 Excludes Net Realizable Value (“NRV”) inventory adjustments. See associated MD&A for a full reconciliation.
Young‐Davidson – Flagship, Long‐Life Production
3,000
4,140
6,000
Target 8,000
2013 2014 2015E 2016E
Ore
Ton
nes
per D
ay
Production Ramp‐Up (Year End Exit Rates)
YE target of 2,000tpd
YE target of 4,000tpd
170U/G miners
207U/G miners
240U/G miners
Location: Ontario, CanadaOwnership: 100% interestStage: ProducingOperation: Underground• One of Canada’s largest underground gold mines
• 15 year mine life based on year end 2014 reserves
• Large resource base and exploration potential to support mine life extension
2014 2015E Q1/15A Q2/15A
Gold Production (k oz) 157 160‐180 38.1 39.4
Total Cash Costs1,2,4 (US$/oz) $825 $675‐775 $745 $697
AISC1,2,4 (US$/oz) $1,075 $950‐1,050 $987 $1,008
Gold Reserves & Resources3 Tonnes (000) Grade (g/t) oz Au (000)
P&P Underground Reserves 42,773 2.74 3,763
M&I Underground Resources 13,946 3.19 1,430
Inferred Underground Resources 3,608 2.76 320
141 Please refer to Cautionary Notes on non‐GAAP Measures and Additional GAAP Measures.2 Excludes Net Realizable Value (“NRV”) inventory adjustments. See associated MD&A for a full reconciliation.
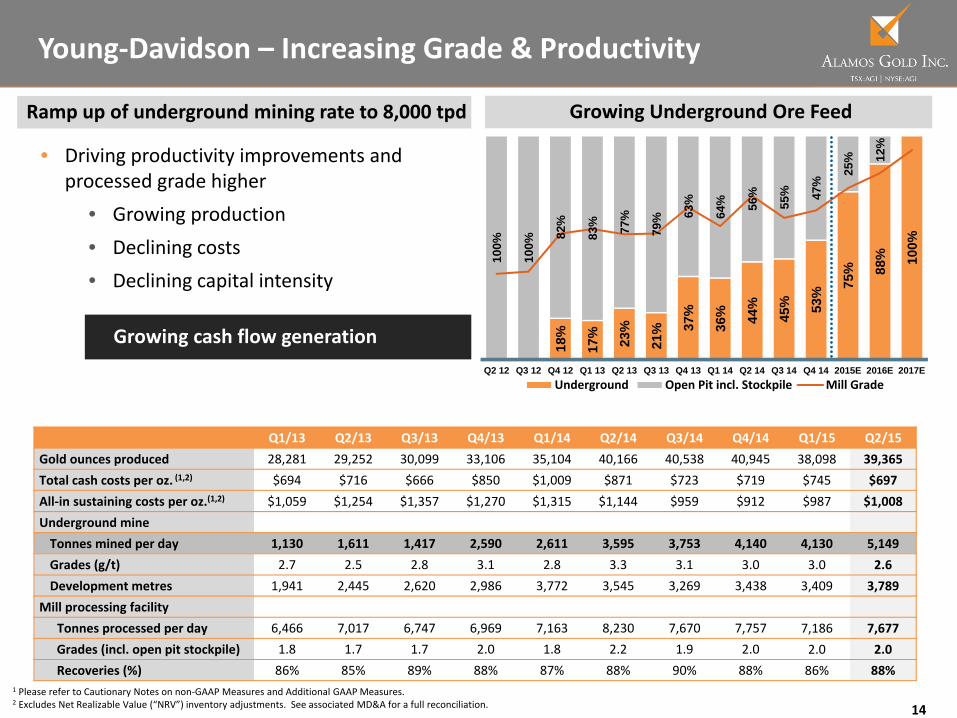
Young‐Davidson – Increasing Grade & Productivity
Q1/13 Q2/13 Q3/13 Q4/13 Q1/14 Q2/14 Q3/14 Q4/14 Q1/15 Q2/15Gold ounces produced 28,281 29,252 30,099 33,106 35,104 40,166 40,538 40,945 38,098 39,365Total cash costs per oz. (1,2) $694 $716 $666 $850 $1,009 $871 $723 $719 $745 $697All‐in sustaining costs per oz.(1,2) $1,059 $1,254 $1,357 $1,270 $1,315 $1,144 $959 $912 $987 $1,008Underground mineTonnes mined per day 1,130 1,611 1,417 2,590 2,611 3,595 3,753 4,140 4,130 5,149Grades (g/t) 2.7 2.5 2.8 3.1 2.8 3.3 3.1 3.0 3.0 2.6Development metres 1,941 2,445 2,620 2,986 3,772 3,545 3,269 3,438 3,409 3,789
Mill processing facility Tonnes processed per day 6,466 7,017 6,747 6,969 7,163 8,230 7,670 7,757 7,186 7,677Grades (incl. open pit stockpile) 1.8 1.7 1.7 2.0 1.8 2.2 1.9 2.0 2.0 2.0Recoveries (%) 86% 85% 89% 88% 87% 88% 90% 88% 86% 88%
18%
17% 23%
21% 37
%
36% 44
%
45% 53
%
75% 88
% 100%
100%
100%
82%
83% 77%
79% 63
%
64% 56
%
55% 47
%
25% 12
%
Q2 12 Q3 12 Q4 12 Q1 13 Q2 13 Q3 13 Q4 13 Q1 14 Q2 14 Q3 14 Q4 14 2015E 2016E 2017EUnderground Open Pit incl. Stockpile Mill Grade
Growing Underground Ore Feed
• Driving productivity improvements and processed grade higher
• Growing production• Declining costs • Declining capital intensity
Ramp up of underground mining rate to 8,000 tpd
Growing cash flow generation
$1,000
$1,100
$1,200
$1,300
$1,400
$1,500
$1,600
$1,700
Sep‐13
Dec‐13
Mar‐14
Jun‐14
Sep‐14
Dec‐14
Mar‐15
Jun‐15
Sep‐15
Gold Price
Gold (US$/oz) Gold (C$/oz)
15Source: FactsetPlease refer to Cautionary Notes on non‐GAAP Measures and Additional GAAP Measures.
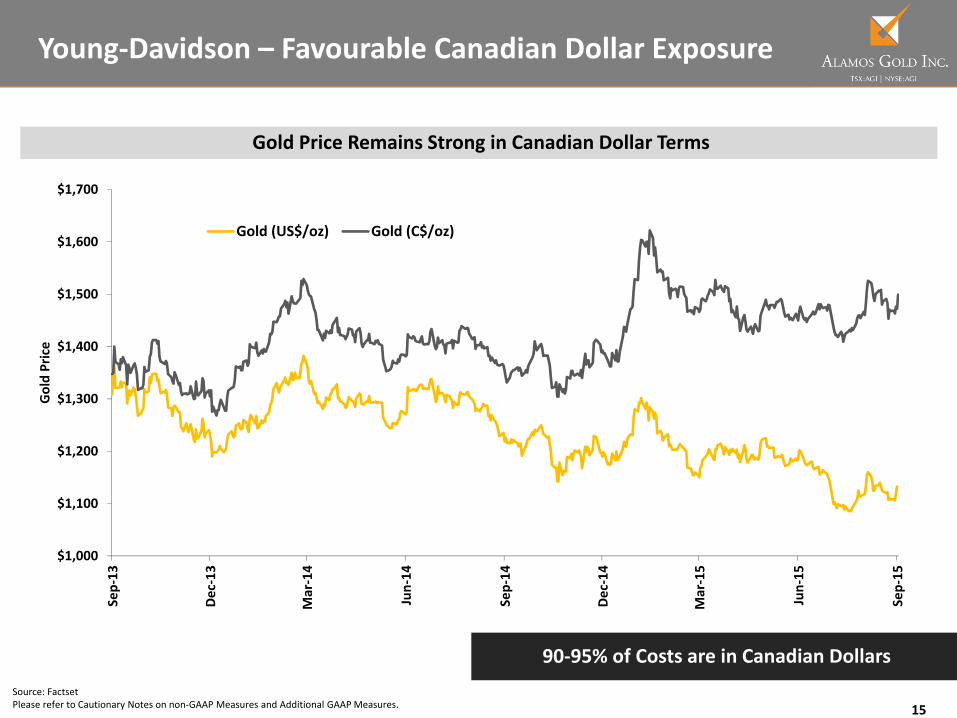
Young‐Davidson – Favourable Canadian Dollar Exposure
Gold Price Remains Strong in Canadian Dollar Terms
90‐95% of Costs are in Canadian Dollars
16
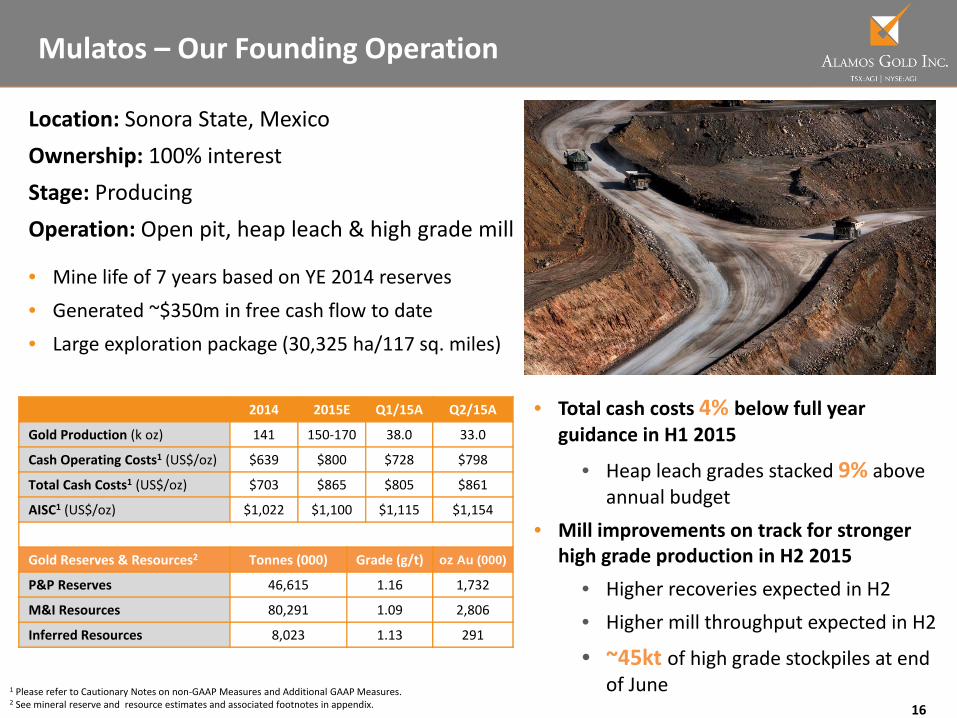
Mulatos – Our Founding Operation
Location: Sonora State, MexicoOwnership: 100% interestStage: ProducingOperation: Open pit, heap leach & high grade mill
• Mine life of 7 years based on YE 2014 reserves
• Generated ~$350m in free cash flow to date
• Large exploration package (30,325 ha/117 sq. miles)
2014 2015E Q1/15A Q2/15A
Gold Production (k oz) 141 150‐170 38.0 33.0
Cash Operating Costs1 (US$/oz) $639 $800 $728 $798
Total Cash Costs1 (US$/oz) $703 $865 $805 $861
AISC1 (US$/oz) $1,022 $1,100 $1,115 $1,154
Gold Reserves & Resources2 Tonnes (000) Grade (g/t) oz Au (000)
P&P Reserves 46,615 1.16 1,732
M&I Resources 80,291 1.09 2,806
Inferred Resources 8,023 1.13 291
• Total cash costs 4% below full year guidance in H1 2015
• Heap leach grades stacked 9% above annual budget
• Mill improvements on track for stronger high grade production in H2 2015
• Higher recoveries expected in H2• Higher mill throughput expected in H2
• ~45kt of high grade stockpiles at end of June 1 Please refer to Cautionary Notes on non‐GAAP Measures and Additional GAAP Measures.
2 See mineral reserve and resource estimates and associated footnotes in appendix.
17
1 Please refer to Cautionary Notes on non‐GAAP Measures and Additional GAAP Measures.2 See mineral reserve and resource estimates and associated footnotes in appendix.3 See press release dated September 21, 2015 “Alamos Announces Discovery of New Zones of Mineralization at Cerro Pelon and La Yaqui”.
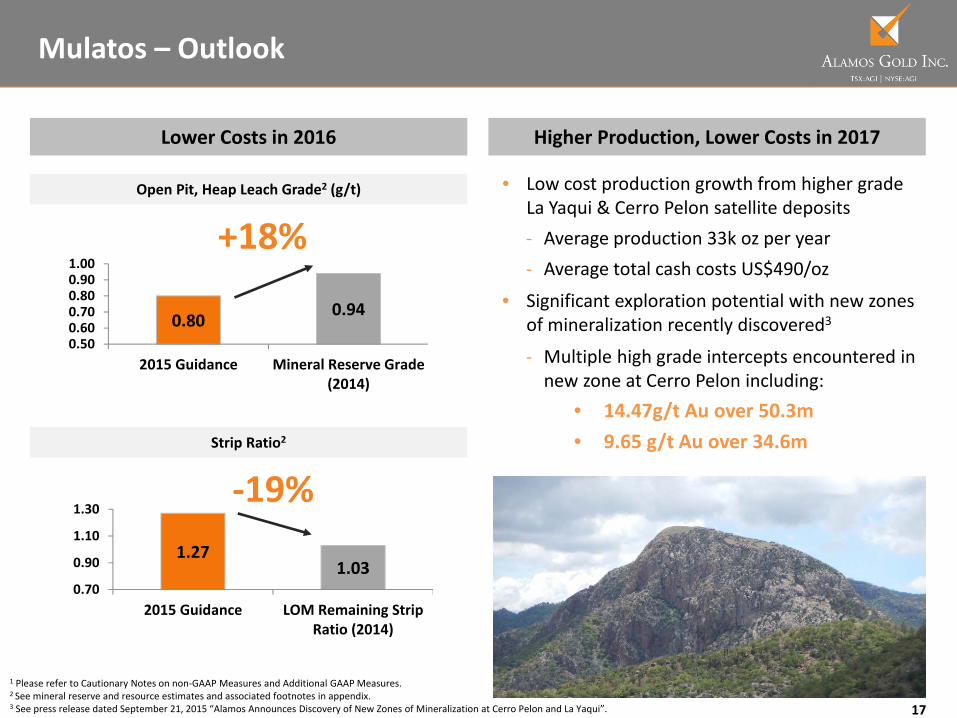
Mulatos – Outlook
1.271.03
0.70
0.90
1.10
1.30
2015 Guidance LOM Remaining StripRatio (2014)
‐19%
0.80 0.94
0.500.600.700.800.901.00
2015 Guidance Mineral Reserve Grade(2014)
+18%
Lower Costs in 2016 Higher Production, Lower Costs in 2017
• Low cost production growth from higher grade La Yaqui & Cerro Pelon satellite deposits‐ Average production 33k oz per year‐ Average total cash costs US$490/oz
• Significant exploration potential with new zones of mineralization recently discovered3
‐ Multiple high grade intercepts encountered in new zone at Cerro Pelon including:
• 14.47g/t Au over 50.3m• 9.65 g/t Au over 34.6m
Open Pit, Heap Leach Grade2 (g/t)
Strip Ratio2
18
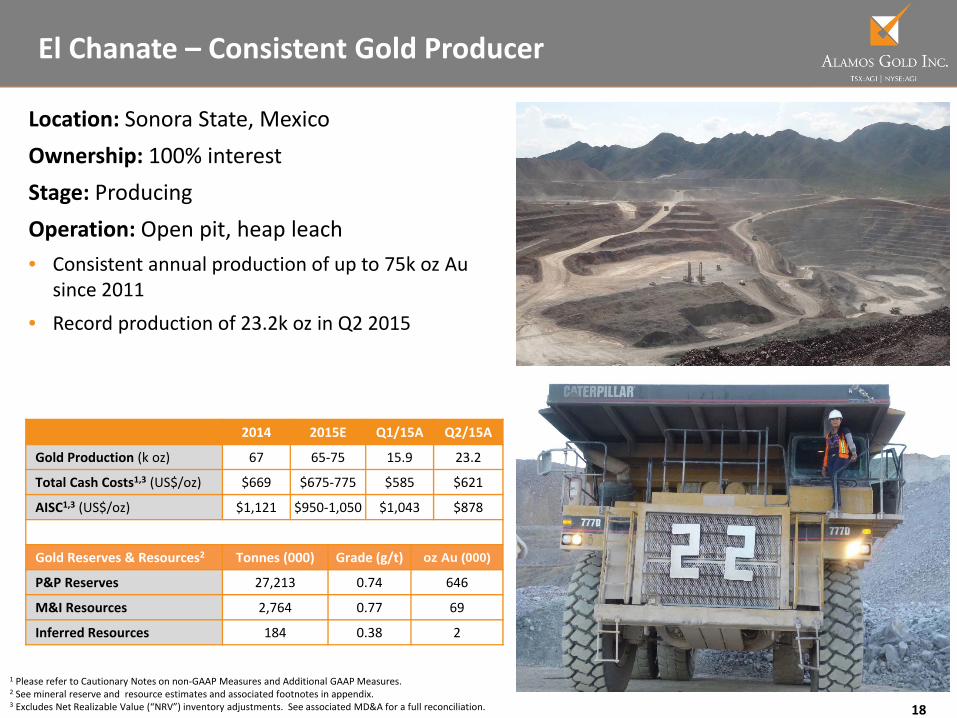
El Chanate – Consistent Gold Producer
2014 2015E Q1/15A Q2/15A
Gold Production (k oz) 67 65‐75 15.9 23.2
Total Cash Costs1,3 (US$/oz) $669 $675‐775 $585 $621
AISC1,3 (US$/oz) $1,121 $950‐1,050 $1,043 $878
Gold Reserves & Resources2 Tonnes (000) Grade (g/t) oz Au (000)
P&P Reserves 27,213 0.74 646
M&I Resources 2,764 0.77 69
Inferred Resources 184 0.38 2
Location: Sonora State, MexicoOwnership: 100% interestStage: ProducingOperation: Open pit, heap leach• Consistent annual production of up to 75k oz Au
since 2011
• Record production of 23.2k oz in Q2 2015
1 Please refer to Cautionary Notes on non‐GAAP Measures and Additional GAAP Measures.2 See mineral reserve and resource estimates and associated footnotes in appendix.3 Excludes Net Realizable Value (“NRV”) inventory adjustments. See associated MD&A for a full reconciliation.
19
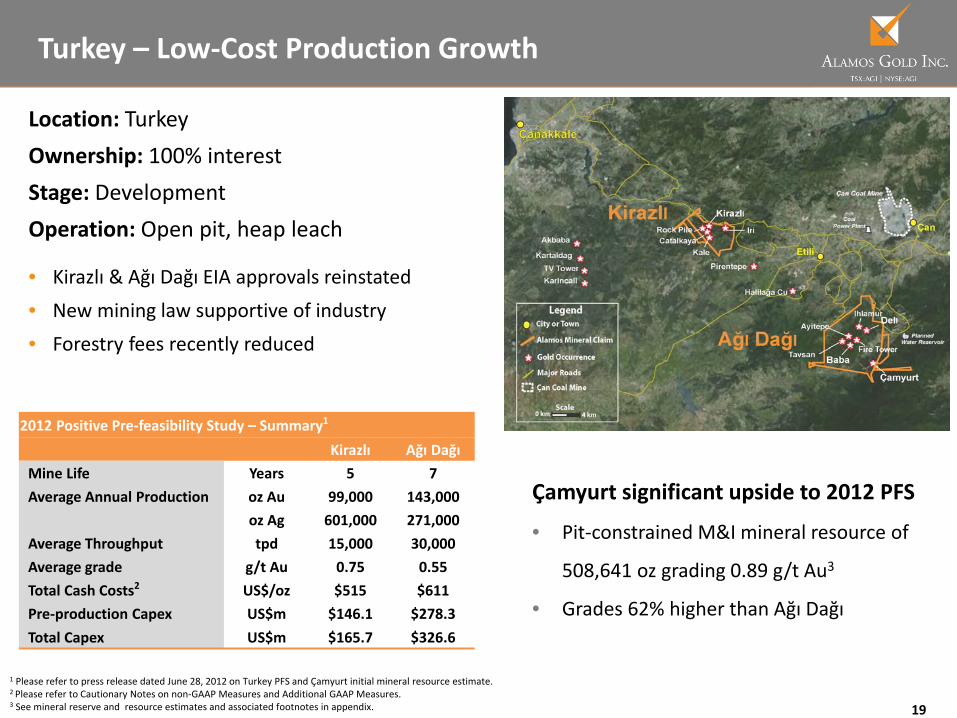
Turkey – Low‐Cost Production Growth
1 Please refer to press release dated June 28, 2012 on Turkey PFS and Çamyurt initial mineral resource estimate. 2 Please refer to Cautionary Notes on non‐GAAP Measures and Additional GAAP Measures.3 See mineral reserve and resource estimates and associated footnotes in appendix.
Çamyurt significant upside to 2012 PFS
• Pit‐constrained M&I mineral resource of
508,641 oz grading 0.89 g/t Au3
• Grades 62% higher than Ağı Dağı
2012 Positive Pre‐feasibility Study – Summary1
Kirazlı Ağı DağıMine Life Years 5 7Average Annual Production oz Au 99,000 143,000
oz Ag 601,000 271,000Average Throughput tpd 15,000 30,000Average grade g/t Au 0.75 0.55Total Cash Costs2 US$/oz $515 $611 Pre‐production Capex US$m $146.1 $278.3 Total Capex US$m $165.7 $326.6
Location: TurkeyOwnership: 100% interestStage: DevelopmentOperation: Open pit, heap leach
• Kirazlı & Ağı Dağı EIA approvals reinstated
• New mining law supportive of industry
• Forestry fees recently reduced
20
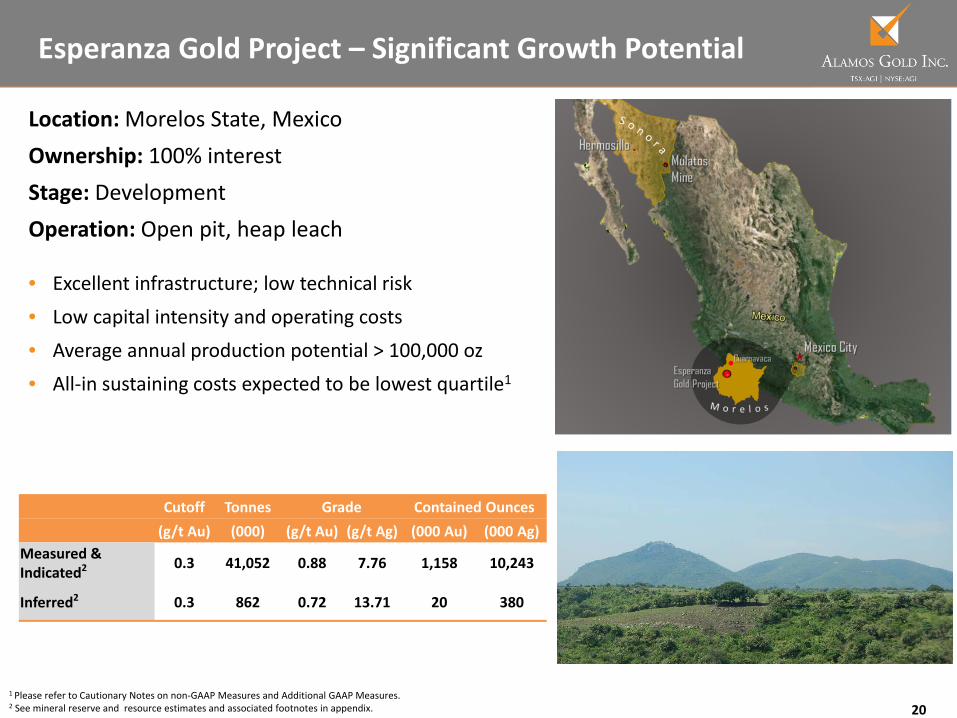
Esperanza Gold Project – Significant Growth Potential
Cutoff Tonnes Grade Contained Ounces(g/t Au) (000) (g/t Au) (g/t Ag) (000 Au) (000 Ag)
Measured & Indicated2 0.3 41,052 0.88 7.76 1,158 10,243
Inferred2 0.3 862 0.72 13.71 20 380
1 Please refer to Cautionary Notes on non‐GAAP Measures and Additional GAAP Measures.2 See mineral reserve and resource estimates and associated footnotes in appendix.
Location: Morelos State, MexicoOwnership: 100% interestStage: DevelopmentOperation: Open pit, heap leach
• Excellent infrastructure; low technical risk
• Low capital intensity and operating costs
• Average annual production potential > 100,000 oz
• All‐in sustaining costs expected to be lowest quartile1
21
1 For more information regarding the Lynn Lake District, please refer to the press release issued by Carlisle Goldfields dated February 27, 2014 titled Carlisle Announces Optimized PEA of the Farley and MacLellan deposits at Lynn Lake returns Post‐Tax IRR of 26.3% at US$1,100 gold price.2 Please refer to Cautionary Notes on non‐GAAP Measures and Additional GAAP Measures.
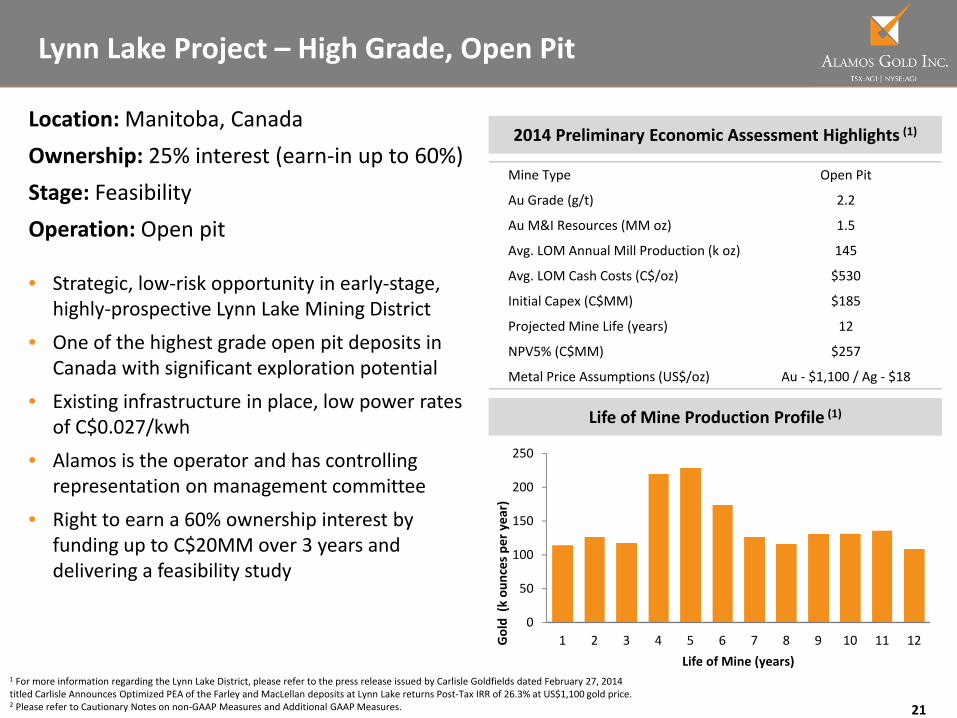
Lynn Lake Project – High Grade, Open Pit
Location: Manitoba, CanadaOwnership: 25% interest (earn‐in up to 60%)Stage: FeasibilityOperation: Open pit
• Strategic, low‐risk opportunity in early‐stage, highly‐prospective Lynn Lake Mining District
• One of the highest grade open pit deposits in Canada with significant exploration potential
• Existing infrastructure in place, low power rates of C$0.027/kwh
• Alamos is the operator and has controlling representation on management committee
• Right to earn a 60% ownership interest by funding up to C$20MM over 3 years and delivering a feasibility study
2014 Preliminary Economic Assessment Highlights (1)
Mine Type Open Pit
Au Grade (g/t) 2.2
Au M&I Resources (MM oz) 1.5
Avg. LOM Annual Mill Production (k oz) 145
Avg. LOM Cash Costs (C$/oz) $530
Initial Capex (C$MM) $185
Projected Mine Life (years) 12
NPV5% (C$MM) $257
Metal Price Assumptions (US$/oz) Au ‐ $1,100 / Ag ‐ $18
Life of Mine Production Profile (1)
0
50
100
150
200
250
1 2 3 4 5 6 7 8 9 10 11 12Gold (k
oun
ces p
er year)
Life of Mine (years)
22
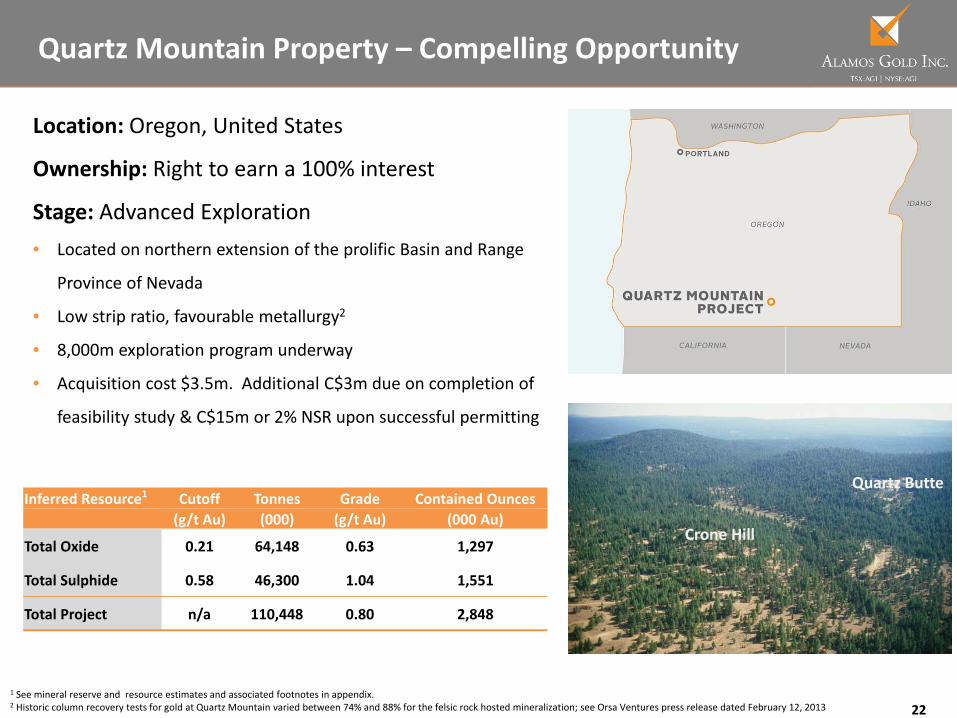
Quartz Mountain Property – Compelling Opportunity
Quartz Butte
Crone Hill
1 See mineral reserve and resource estimates and associated footnotes in appendix.2 Historic column recovery tests for gold at Quartz Mountain varied between 74% and 88% for the felsic rock hosted mineralization; see Orsa Ventures press release dated February 12, 2013
Location: Oregon, United States
Ownership: Right to earn a 100% interest
Stage: Advanced Exploration• Located on northern extension of the prolific Basin and Range
Province of Nevada
• Low strip ratio, favourable metallurgy2
• 8,000m exploration program underway
• Acquisition cost $3.5m. Additional C$3m due on completion of
feasibility study & C$15m or 2% NSR upon successful permitting
Inferred Resource1 Cutoff Tonnes Grade Contained Ounces(g/t Au) (000) (g/t Au) (000 Au)
Total Oxide 0.21 64,148 0.63 1,297
Total Sulphide 0.58 46,300 1.04 1,551
Total Project n/a 110,448 0.80 2,848
23
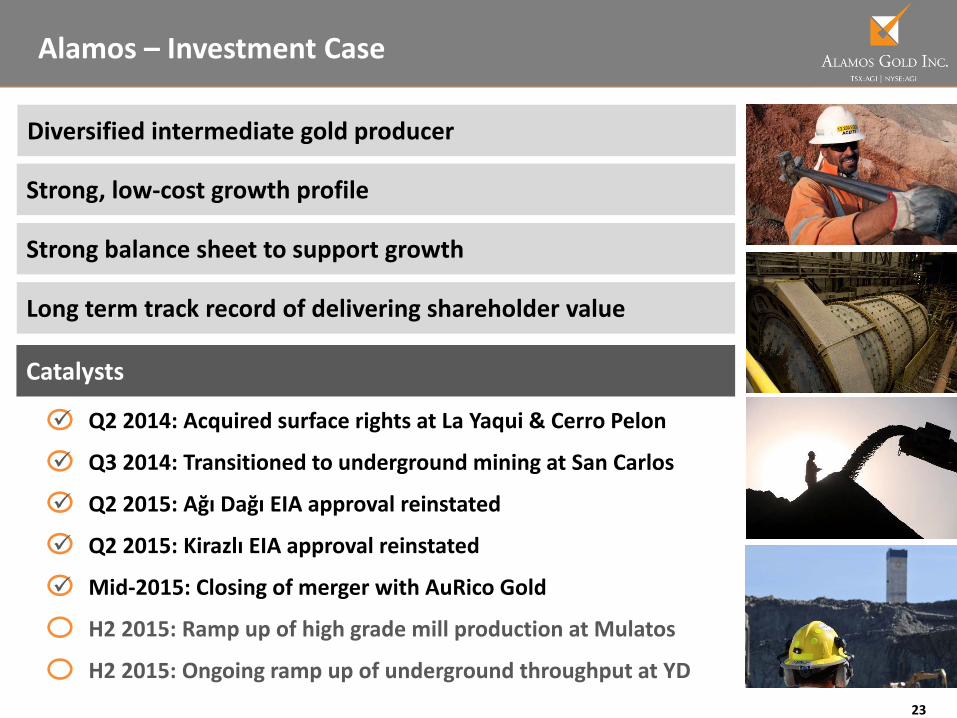
Alamos – Investment Case
Q2 2014: Acquired surface rights at La Yaqui & Cerro Pelon
Q3 2014: Transitioned to underground mining at San Carlos
Q2 2015: Ağı Dağı EIA approval reinstated
Q2 2015: Kirazlı EIA approval reinstated
Mid‐2015: Closing of merger with AuRico Gold
• H2 2015: Ramp up of high grade mill production at Mulatos
• H2 2015: Ongoing ramp up of underground throughput at YD
Diversified intermediate gold producer
Strong, low‐cost growth profile
Strong balance sheet to support growth
Long term track record of delivering shareholder value
Catalysts
Appendices

25
Board of Directors and Executive and Management Team
Alan R. Edwards Chairman
John A. McCluskey Director
Paul J. Murphy Director
Mark J. Daniel Director
Patrick D. Downey Director
David Fleck Director
David Gower Director
Scott G. Perry Director
Ronald E. Smith Director
Kenneth Stowe Director
John A. McCluskey President and Chief Executive Officer
Jamie Porter Chief Financial Officer
Peter MacPhail Vice President and Chief Operating Officer
Charles Tarnocai Vice President, Corporate Development
Christine Barwell Vice President, Human Resources
Chris Bostwick Vice President, Technical Services
Luis Chavez Senior Vice President, Mexico
Andrew Cormier Vice President, Development and Construction
Greg Fisher Vice President, Finance
Aoife McGrath Vice President, Exploration
Scott Parsons Vice President, Investor Relations
Board of Directors Executive and Management Team
26
Sustainability
• Completed first Annual Sustainability Report pursuant to GRI framework• Our Objectives
• As we pursue further growth, we will continue to measure our success as an organization by our performance in achievement of our sustainability objectives:
• protecting the health and well‐being of our employees • creating shared value with our host communities and countries• ensuring that our operations are net‐positive for the environment
• Over the years, Alamos has been recognized for its achievements in these areas:
• Clean Industry Certification from PROFEPA• Alamos was certified as an Industria Limpia (clean industry) in recognition of the excellence of
environmental management at Mulatos.
• CSR Award from Mexican Center for Philanthropy (CEMEFI)• Signifies exceptional record of CSR performance; 2013 marks the 5th consecutive year for Alamos
• Certification under International Cyanide Management Code• Voluntary initiative for gold mining industry and producers and transporters of cyanide; Alamos
certified since March 2013
• ISO 9001:2008 Certification • International standard for quality management mining systems; 3rd year in a row for Alamos
27
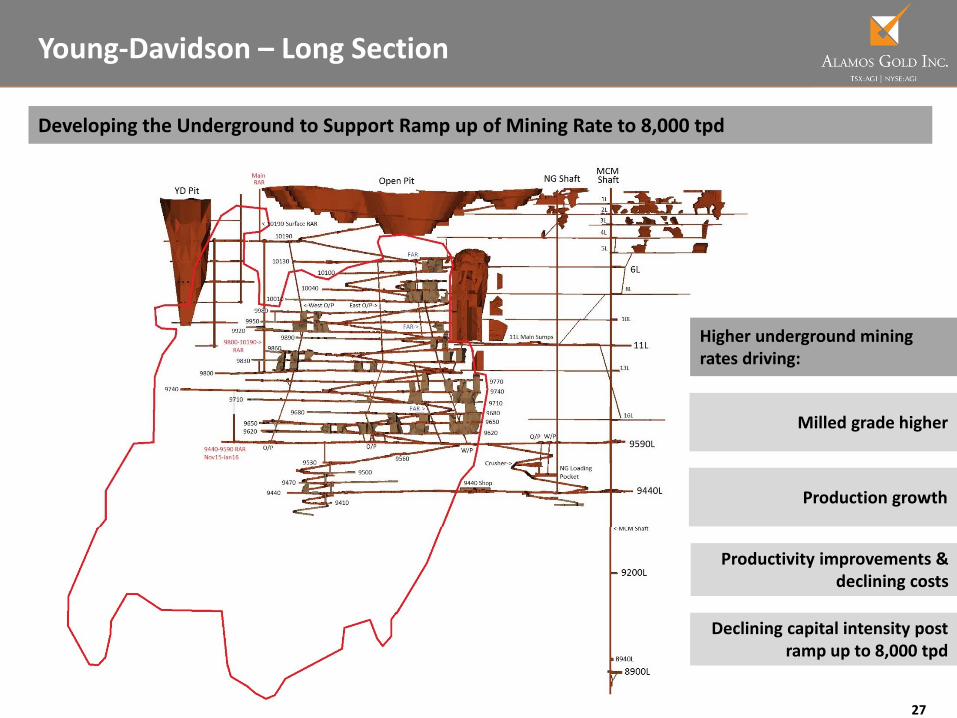
Young‐Davidson – Long Section
Productivity improvements & declining costs
Developing the Underground to Support Ramp up of Mining Rate to 8,000 tpd
Milled grade higher
Declining capital intensity post ramp up to 8,000 tpd
Higher underground mining rates driving:
Production growth
28
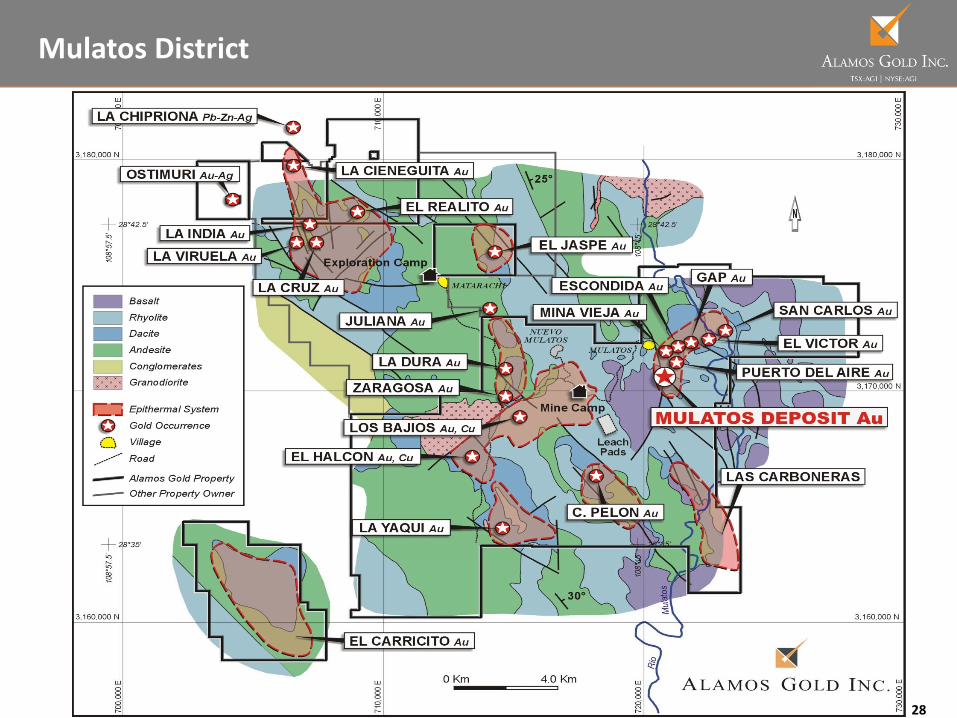
Mulatos District
29
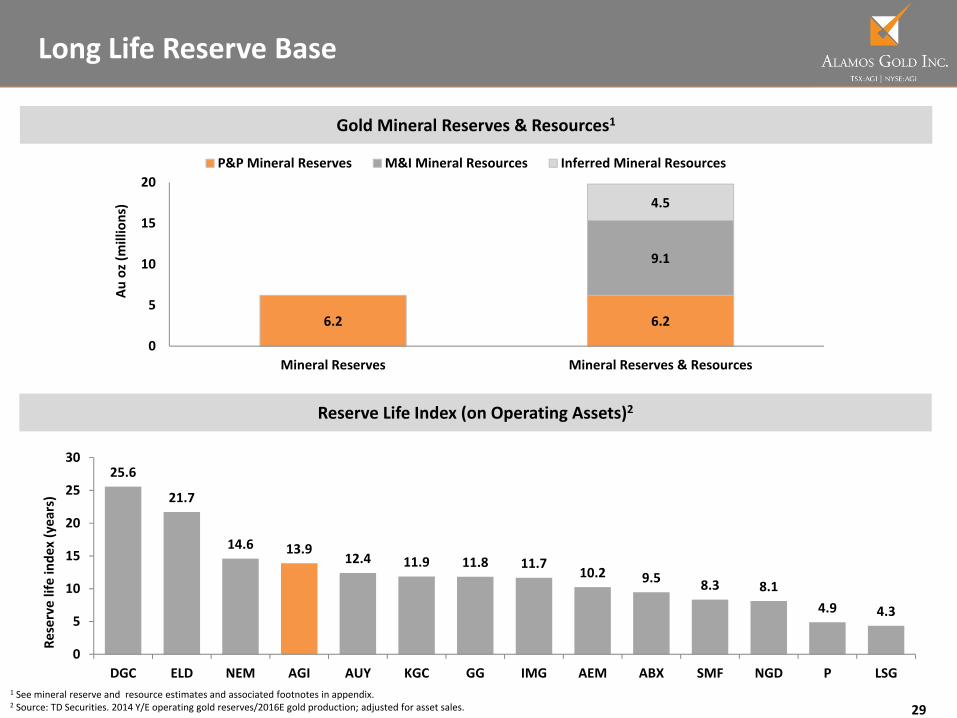
Long Life Reserve Base
Reserve Life Index (on Operating Assets)2
Gold Mineral Reserves & Resources1
25.6
21.7
14.6 13.912.4 11.9 11.8 11.7
10.2 9.5 8.3 8.14.9 4.3
0
5
10
15
20
25
30
DGC ELD NEM AGI AUY KGC GG IMG AEM ABX SMF NGD P LSG
Reserve life inde
x (years)
1 See mineral reserve and resource estimates and associated footnotes in appendix.2 Source: TD Securities. 2014 Y/E operating gold reserves/2016E gold production; adjusted for asset sales.
6.2 6.2
9.1
4.5
0
5
10
15
20
Mineral Reserves Mineral Reserves & Resources
Au oz (m
illions)
P&P Mineral Reserves M&I Mineral Resources Inferred Mineral Resources
30
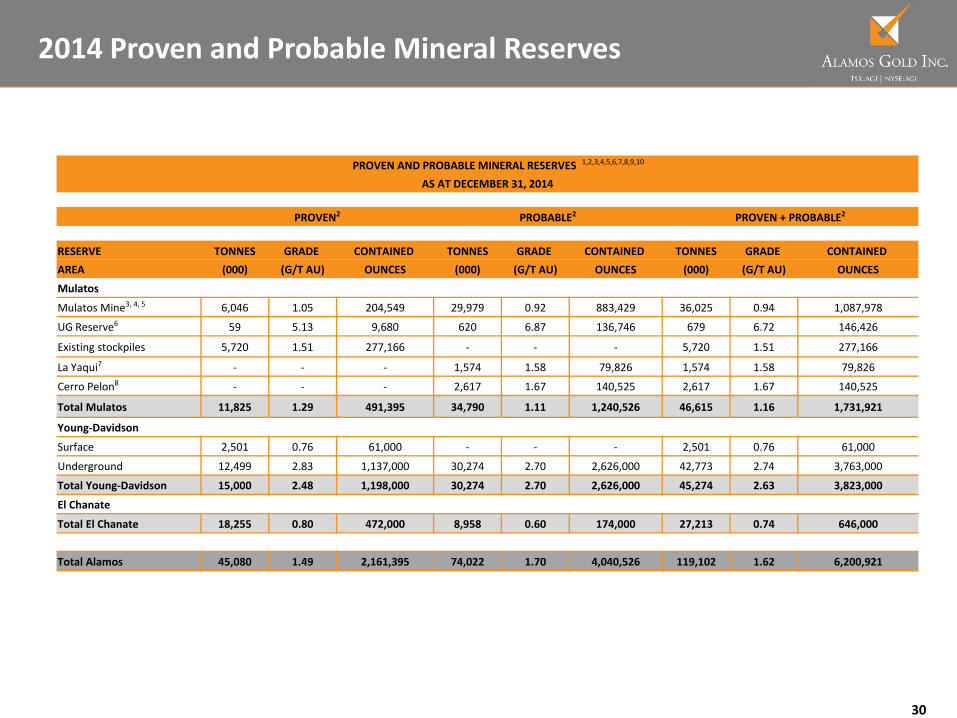
2014 Proven and Probable Mineral Reserves
PROVEN AND PROBABLE MINERAL RESERVES 1,2,3,4,5,6,7,8,9,10
AS AT DECEMBER 31, 2014
PROVEN2 PROBABLE2 PROVEN + PROBABLE2
RESERVE TONNES GRADE CONTAINED TONNES GRADE CONTAINED TONNES GRADE CONTAINEDAREA (000) (G/T AU) OUNCES (000) (G/T AU) OUNCES (000) (G/T AU) OUNCES
Mulatos
Mulatos Mine3, 4, 5 6,046 1.05 204,549 29,979 0.92 883,429 36,025 0.94 1,087,978
UG Reserve6 59 5.13 9,680 620 6.87 136,746 679 6.72 146,426
Existing stockpiles 5,720 1.51 277,166 ‐ ‐ ‐ 5,720 1.51 277,166
La Yaqui7 ‐ ‐ ‐ 1,574 1.58 79,826 1,574 1.58 79,826
Cerro Pelon8 ‐ ‐ ‐ 2,617 1.67 140,525 2,617 1.67 140,525
Total Mulatos 11,825 1.29 491,395 34,790 1.11 1,240,526 46,615 1.16 1,731,921
Young‐Davidson
Surface 2,501 0.76 61,000 ‐ ‐ ‐ 2,501 0.76 61,000
Underground 12,499 2.83 1,137,000 30,274 2.70 2,626,000 42,773 2.74 3,763,000
Total Young‐Davidson 15,000 2.48 1,198,000 30,274 2.70 2,626,000 45,274 2.63 3,823,000
El Chanate
Total El Chanate 18,255 0.80 472,000 8,958 0.60 174,000 27,213 0.74 646,000
Total Alamos 45,080 1.49 2,161,395 74,022 1.70 4,040,526 119,102 1.62 6,200,921
31
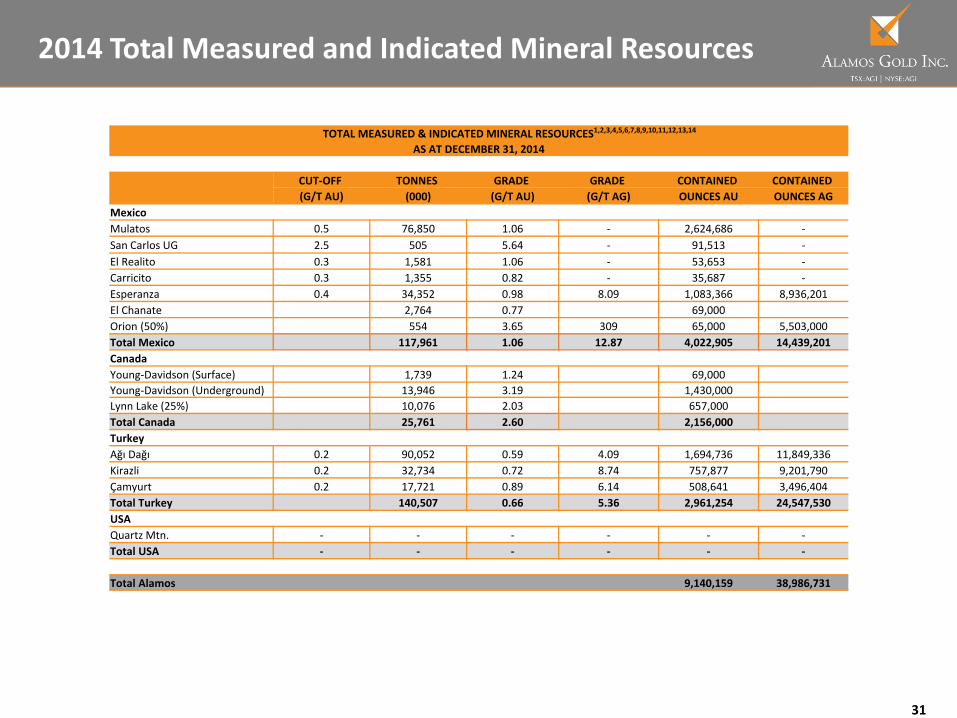
2014 Total Measured and Indicated Mineral Resources
TOTAL MEASURED & INDICATED MINERAL RESOURCES1,2,3,4,5,6,7,8,9,10,11,12,13,14
AS AT DECEMBER 31, 2014
CUT‐OFF TONNES GRADE GRADE CONTAINED CONTAINED(G/T AU) (000) (G/T AU) (G/T AG) OUNCES AU OUNCES AG
MexicoMulatos 0.5 76,850 1.06 ‐ 2,624,686 ‐San Carlos UG 2.5 505 5.64 ‐ 91,513 ‐El Realito 0.3 1,581 1.06 ‐ 53,653 ‐Carricito 0.3 1,355 0.82 ‐ 35,687 ‐Esperanza 0.4 34,352 0.98 8.09 1,083,366 8,936,201El Chanate 2,764 0.77 69,000Orion (50%) 554 3.65 309 65,000 5,503,000Total Mexico 117,961 1.06 12.87 4,022,905 14,439,201CanadaYoung‐Davidson (Surface) 1,739 1.24 69,000Young‐Davidson (Underground) 13,946 3.19 1,430,000Lynn Lake (25%) 10,076 2.03 657,000Total Canada 25,761 2.60 2,156,000TurkeyAğı Dağı 0.2 90,052 0.59 4.09 1,694,736 11,849,336Kirazli 0.2 32,734 0.72 8.74 757,877 9,201,790Çamyurt 0.2 17,721 0.89 6.14 508,641 3,496,404Total Turkey 140,507 0.66 5.36 2,961,254 24,547,530USAQuartz Mtn. ‐ ‐ ‐ ‐ ‐ ‐Total USA ‐ ‐ ‐ ‐ ‐ ‐
Total Alamos 9,140,159 38,986,731
32
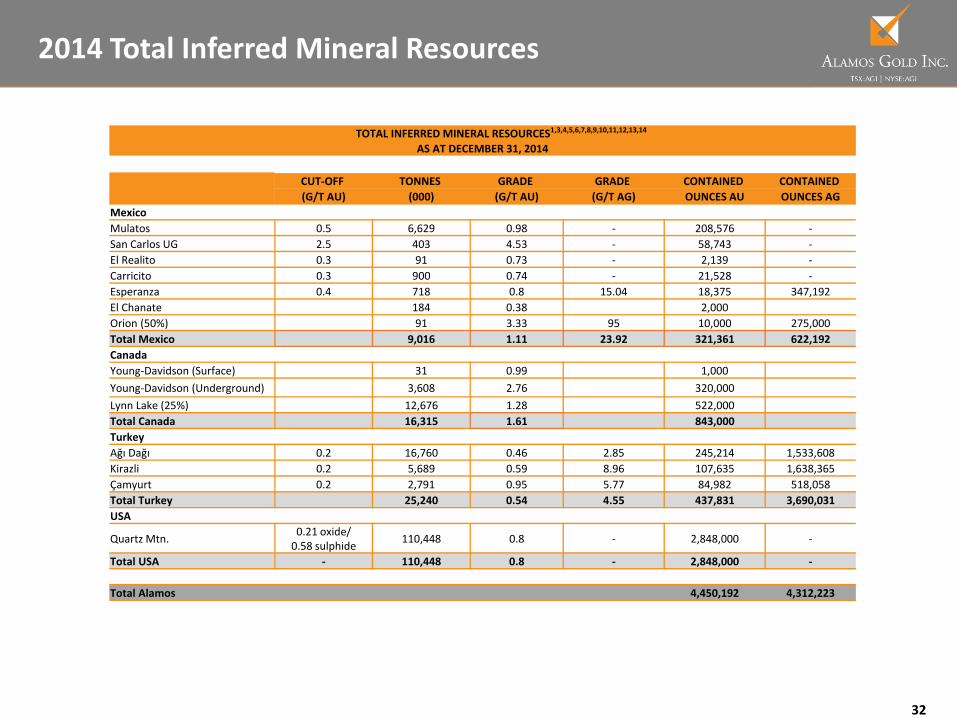
2014 Total Inferred Mineral Resources
TOTAL INFERRED MINERAL RESOURCES1,3,4,5,6,7,8,9,10,11,12,13,14
AS AT DECEMBER 31, 2014
CUT‐OFF TONNES GRADE GRADE CONTAINED CONTAINED(G/T AU) (000) (G/T AU) (G/T AG) OUNCES AU OUNCES AG
MexicoMulatos 0.5 6,629 0.98 ‐ 208,576 ‐San Carlos UG 2.5 403 4.53 ‐ 58,743 ‐El Realito 0.3 91 0.73 ‐ 2,139 ‐Carricito 0.3 900 0.74 ‐ 21,528 ‐Esperanza 0.4 718 0.8 15.04 18,375 347,192El Chanate 184 0.38 2,000Orion (50%) 91 3.33 95 10,000 275,000Total Mexico 9,016 1.11 23.92 321,361 622,192CanadaYoung‐Davidson (Surface) 31 0.99 1,000Young‐Davidson (Underground) 3,608 2.76 320,000Lynn Lake (25%) 12,676 1.28 522,000Total Canada 16,315 1.61 843,000TurkeyAğı Dağı 0.2 16,760 0.46 2.85 245,214 1,533,608Kirazli 0.2 5,689 0.59 8.96 107,635 1,638,365Çamyurt 0.2 2,791 0.95 5.77 84,982 518,058Total Turkey 25,240 0.54 4.55 437,831 3,690,031USA
Quartz Mtn. 0.21 oxide/ 0.58 sulphide 110,448 0.8 ‐ 2,848,000 ‐
Total USA ‐ 110,448 0.8 ‐ 2,848,000 ‐
Total Alamos 4,450,192 4,312,223
33
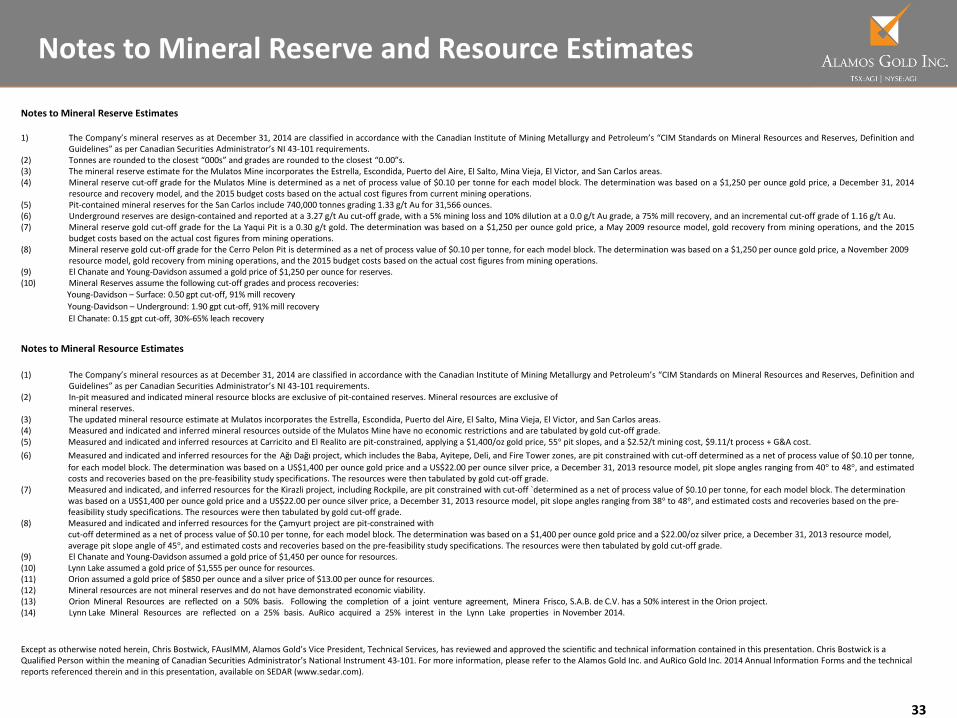
Notes to Mineral Reserve and Resource Estimates
Notes to Mineral Reserve Estimates
1) The Company’s mineral reserves as at December 31, 2014 are classified in accordance with the Canadian Institute of Mining Metallurgy and Petroleum’s “CIM Standards on Mineral Resources and Reserves, Definition andGuidelines” as per Canadian Securities Administrator’s NI 43‐101 requirements.
(2) Tonnes are rounded to the closest “000s” and grades are rounded to the closest “0.00”s.(3) The mineral reserve estimate for the Mulatos Mine incorporates the Estrella, Escondida, Puerto del Aire, El Salto, Mina Vieja, El Victor, and San Carlos areas.(4) Mineral reserve cut‐off grade for the Mulatos Mine is determined as a net of process value of $0.10 per tonne for each model block. The determination was based on a $1,250 per ounce gold price, a December 31, 2014
resource and recovery model, and the 2015 budget costs based on the actual cost figures from current mining operations.(5) Pit‐contained mineral reserves for the San Carlos include 740,000 tonnes grading 1.33 g/t Au for 31,566 ounces.(6) Underground reserves are design‐contained and reported at a 3.27 g/t Au cut‐off grade, with a 5% mining loss and 10% dilution at a 0.0 g/t Au grade, a 75% mill recovery, and an incremental cut‐off grade of 1.16 g/t Au.(7) Mineral reserve gold cut‐off grade for the La Yaqui Pit is a 0.30 g/t gold. The determination was based on a $1,250 per ounce gold price, a May 2009 resource model, gold recovery from mining operations, and the 2015
budget costs based on the actual cost figures from mining operations.(8) Mineral reserve gold cut‐off grade for the Cerro Pelon Pit is determined as a net of process value of $0.10 per tonne, for each model block. The determination was based on a $1,250 per ounce gold price, a November 2009
resource model, gold recovery from mining operations, and the 2015 budget costs based on the actual cost figures from mining operations.(9) El Chanate and Young‐Davidson assumed a gold price of $1,250 per ounce for reserves.(10) Mineral Reserves assume the following cut‐off grades and process recoveries:
Young‐Davidson – Surface: 0.50 gpt cut‐off, 91%mill recoveryYoung‐Davidson – Underground: 1.90 gpt cut‐off, 91%mill recoveryEl Chanate: 0.15 gpt cut‐off, 30%‐65% leach recovery
Notes to Mineral Resource Estimates
(1) The Company’s mineral resources as at December 31, 2014 are classified in accordance with the Canadian Institute of Mining Metallurgy and Petroleum’s “CIM Standards on Mineral Resources and Reserves, Definition andGuidelines” as per Canadian Securities Administrator’s NI 43‐101 requirements.
(2) In‐pit measured and indicated mineral resource blocks are exclusive of pit‐contained reserves. Mineral resources are exclusive ofmineral reserves.
(3) The updated mineral resource estimate at Mulatos incorporates the Estrella, Escondida, Puerto del Aire, El Salto, Mina Vieja, El Victor, and San Carlos areas.(4) Measured and indicated and inferred mineral resources outside of the Mulatos Mine have no economic restrictions and are tabulated by gold cut‐off grade.(5) Measured and indicated and inferred resources at Carricito and El Realito are pit‐constrained, applying a $1,400/oz gold price, 55° pit slopes, and a $2.52/t mining cost, $9.11/t process + G&A cost.(6) Measured and indicated and inferred resources for the Ağı Dağı project, which includes the Baba, Ayitepe, Deli, and Fire Tower zones, are pit constrained with cut‐off determined as a net of process value of $0.10 per tonne,
for each model block. The determination was based on a US$1,400 per ounce gold price and a US$22.00 per ounce silver price, a December 31, 2013 resource model, pit slope angles ranging from 40° to 48°, and estimatedcosts and recoveries based on the pre‐feasibility study specifications. The resources were then tabulated by gold cut‐off grade.
(7) Measured and indicated, and inferred resources for the Kirazli project, including Rockpile, are pit constrained with cut‐off `determined as a net of process value of $0.10 per tonne, for each model block. The determination was based on a US$1,400 per ounce gold price and a US$22.00 per ounce silver price, a December 31, 2013 resource model, pit slope angles ranging from 38° to 48°, and estimated costs and recoveries based on the pre‐feasibility study specifications. The resources were then tabulated by gold cut‐off grade.
(8) Measured and indicated and inferred resources for the Çamyurt project are pit‐constrained withcut‐off determined as a net of process value of $0.10 per tonne, for each model block. The determination was based on a $1,400 per ounce gold price and a $22.00/oz silver price, a December 31, 2013 resource model, average pit slope angle of 45°, and estimated costs and recoveries based on the pre‐feasibility study specifications. The resources were then tabulated by gold cut‐off grade.
(9) El Chanate and Young‐Davidson assumed a gold price of $1,450 per ounce for resources.(10) Lynn Lake assumed a gold price of $1,555 per ounce for resources.(11) Orion assumed a gold price of $850 per ounce and a silver price of $13.00 per ounce for resources.(12) Mineral resources are not mineral reserves and do not have demonstrated economic viability.(13) Orion Mineral Resources are reflected on a 50% basis. Following the completion of a joint venture agreement, Minera Frisco, S.A.B. de C.V. has a 50% interest in the Orion project.(14) Lynn Lake Mineral Resources are reflected on a 25% basis. AuRico acquired a 25% interest in the Lynn Lake properties in November 2014.
Except as otherwise noted herein, Chris Bostwick, FAusIMM, Alamos Gold’s Vice President, Technical Services, has reviewed and approved the scientific and technical information contained in this presentation. Chris Bostwick is a Qualified Person within the meaning of Canadian Securities Administrator’s National Instrument 43‐101. For more information, please refer to the Alamos Gold Inc. and AuRico Gold Inc. 2014 Annual Information Forms and the technical reports referenced therein and in this presentation, available on SEDAR (www.sedar.com).
Recommended