1 1 For updated information, please visit www.ibef.org
Airports MARCH
2013
2 2
Contents
Advantage India
Market overview and trends
Growth drivers
Success stories: Delhi, Mumbai
Opportunities
Useful information
For updated information, please visit www.ibef.org
Airports MARCH
2013
3 3
Airports
For updated information, please visit www.ibef.org ADVANTAGE INDIA
Advantage India
MARCH
2013
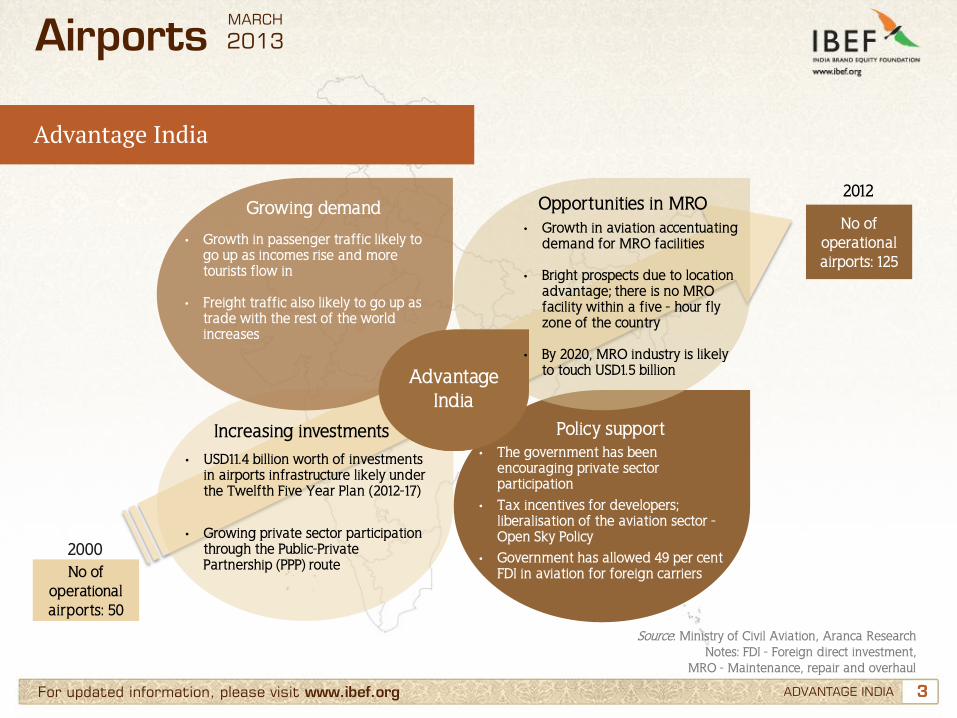
Advantage India
• Growth in passenger traffic likely to go up as incomes rise and more tourists flow in
• Freight traffic also likely to go up as
trade with the rest of the world increases
• Growth in aviation accentuating demand for MRO facilities
• Bright prospects due to location advantage; there is no MRO facility within a five - hour fly zone of the country
• By 2020, MRO industry is likely
to touch USD1.5 billion
• USD11.4 billion worth of investments in airports infrastructure likely under the Twelfth Five Year Plan (2012-17)
• Growing private sector participation through the Public-Private Partnership (PPP) route
• The government has been encouraging private sector participation
• Tax incentives for developers; liberalisation of the aviation sector - Open Sky Policy
• Government has allowed 49 per cent FDI in aviation for foreign carriers
No of operational airports: 125
2012
No of operational airports: 50
2000
Source: Ministry of Civil Aviation, Aranca Research Notes: FDI - Foreign direct investment,
MRO - Maintenance, repair and overhaul
Growing demand Opportunities in MRO
Increasing investments Policy support

4 4
Contents
Advantage India
Market overview and trends
Growth drivers
Success stories: Delhi, Mumbai
Opportunities
Useful information
For updated information, please visit www.ibef.org
Airports MARCH
2013
5 5 For updated information, please visit www.ibef.org MARKET OVERVIEW AND TRENDS
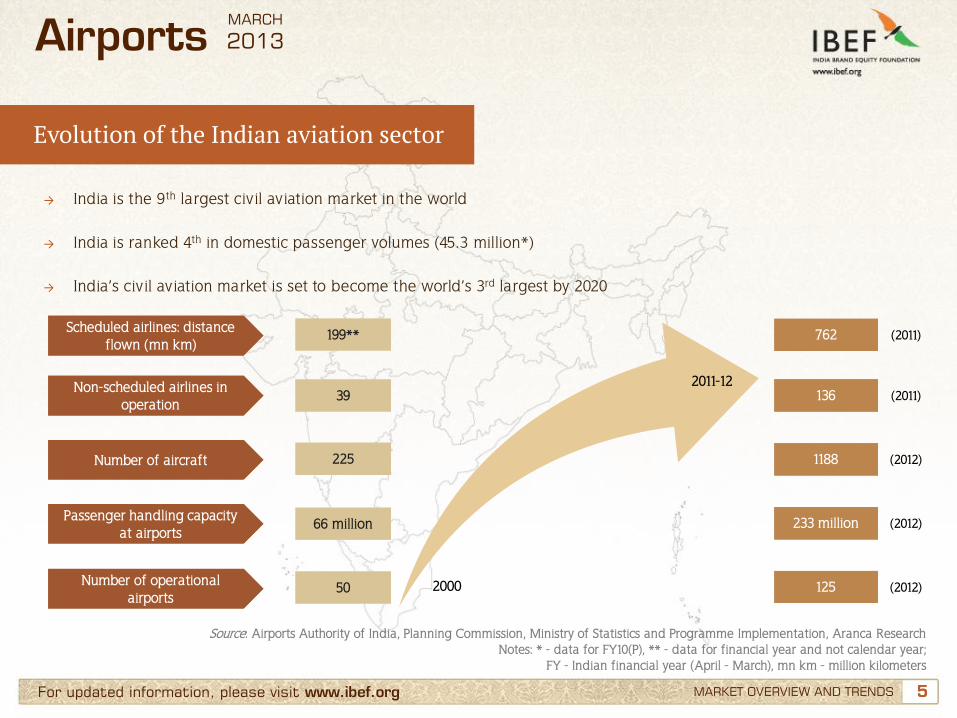
Evolution of the Indian aviation sector
Source: Airports Authority of India, Planning Commission, Ministry of Statistics and Programme Implementation, Aranca Research Notes: * - data for FY10(P), ** - data for financial year and not calendar year;
FY - Indian financial year (April - March), mn km - million kilometers
Airports
→ India is the 9th largest civil aviation market in the world → India is ranked 4th in domestic passenger volumes (45.3 million*) → India’s civil aviation market is set to become the world’s 3rd largest by 2020
Scheduled airlines: distance flown (mn km)
Non-scheduled airlines in operation
Number of aircraft
Passenger handling capacity at airports
Number of operational airports
50
66 million
225
39
199**
125
233 million
1188
136
762
2000
2011-12
(2011)
(2011)
(2012)
(2012)
(2012)
MARCH
2013
6 6 For updated information, please visit www.ibef.org
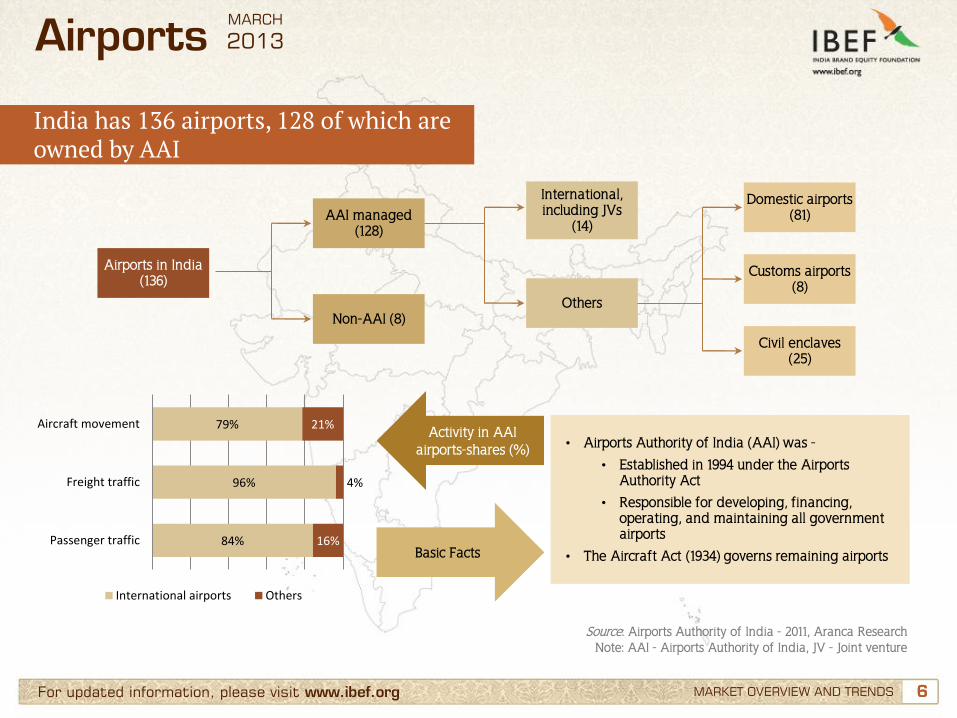
India has 136 airports, 128 of which are owned by AAI
Source: Airports Authority of India - 2011, Aranca Research Note: AAI - Airports Authority of India, JV - Joint venture
MARKET OVERVIEW AND TRENDS
Airports
Airports in India (136)
AAI managed (128)
Non-AAI (8)
International, including JVs
(14)
Others
Civil enclaves (25)
Customs airports (8)
Domestic airports (81)
• Airports Authority of India (AAI) was -
• Established in 1994 under the Airports Authority Act
• Responsible for developing, financing, operating, and maintaining all government airports
• The Aircraft Act (1934) governs remaining airports
Activity in AAI airports-shares (%)
Basic Facts 84%
96%
79%
16%
4%
21%
Passenger traffic
Freight traffic
Aircraft movement
International airports Others
MARCH
2013
7 7 For updated information, please visit www.ibef.org
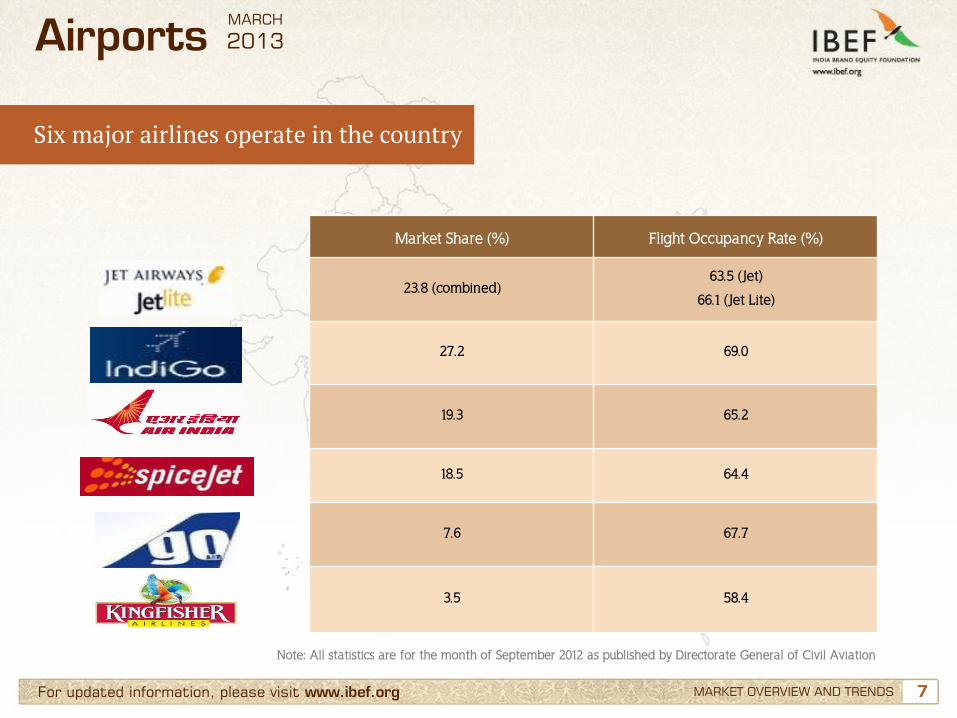
Six major airlines operate in the country
Note: All statistics are for the month of September 2012 as published by Directorate General of Civil Aviation
MARKET OVERVIEW AND TRENDS
Airports
Market Share (%) Flight Occupancy Rate (%)
23.8 (combined) 63.5 (Jet)
66.1 (Jet Lite)
27.2 69.0
19.3 65.2
18.5 64.4
7.6 67.7
3.5 58.4
MARCH
2013
8 8 For updated information, please visit www.ibef.org MARKET OVERVIEW AND TRENDS
Airports
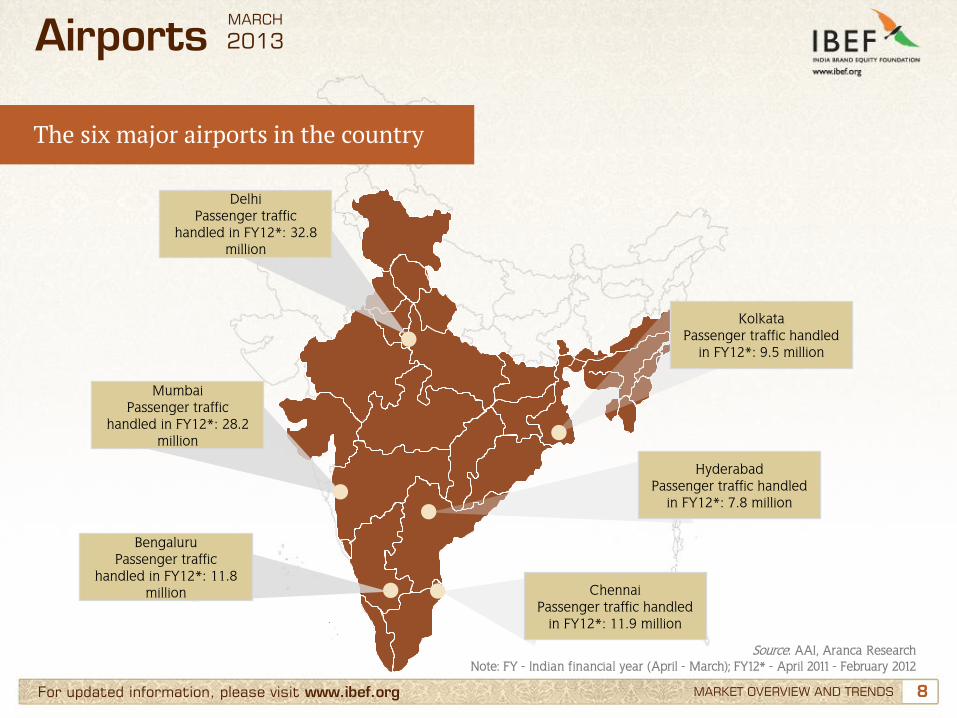
Source: AAI, Aranca Research Note: FY - Indian financial year (April - March); FY12* - April 2011 - February 2012
Mumbai Passenger traffic
handled in FY12*: 28.2 million
Kolkata Passenger traffic handled
in FY12*: 9.5 million
Chennai Passenger traffic handled
in FY12*: 11.9 million
Delhi
Passenger traffic handled in FY12*: 32.8
million
Bengaluru Passenger traffic
handled in FY12*: 11.8 million
Hyderabad Passenger traffic handled
in FY12*: 7.8 million
MARCH
2013
The six major airports in the country
9 9 For updated information, please visit www.ibef.org
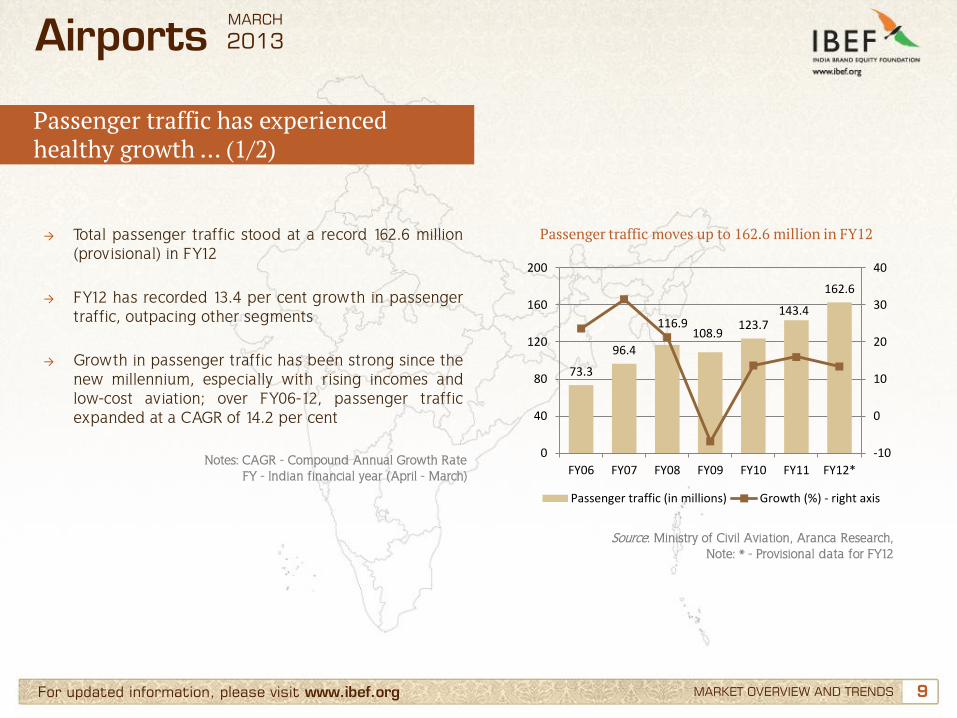
Passenger traffic has experienced healthy growth … (1/2)
MARKET OVERVIEW AND TRENDS
→ Total passenger traffic stood at a record 162.6 million (provisional) in FY12
→ FY12 has recorded 13.4 per cent growth in passenger traffic, outpacing other segments
→ Growth in passenger traffic has been strong since the new millennium, especially with rising incomes and low-cost aviation; over FY06-12, passenger traffic expanded at a CAGR of 14.2 per cent
Notes: CAGR - Compound Annual Growth Rate FY - Indian financial year (April - March)
Airports
Passenger traffic moves up to 162.6 million in FY12
Source: Ministry of Civil Aviation, Aranca Research, Note: * - Provisional data for FY12
73.3
96.4
116.9 108.9
123.7 143.4
162.6
-10
0
10
20
30
40
0
40
80
120
160
200
FY06 FY07 FY08 FY09 FY10 FY11 FY12*
Passenger traffic (in millions) Growth (%) - right axis
MARCH
2013
10 10 For updated information, please visit www.ibef.org
Passenger traffic has experienced healthy growth … (2/2)
MARKET OVERVIEW AND TRENDS
Growth in domestic passenger traffic has been robust
Source: Airports Authority of India, Ministry of Civil Aviation, Aranca Research
Notes: * - FY12 data is provisional YoY - Year on Year
Airports
Growth in passenger traffic set to remain strong in future
26 71
122
209
14 26
41
60
0
50
100
150
200
250
300
FY02 FY07 FY12 FY17EInternational Passenger Throughput International (million)
Domestic Passenger Throughput Domestic (million)
10th Plan Period
11th Plan Period
12th Plan Period
MARCH
2013
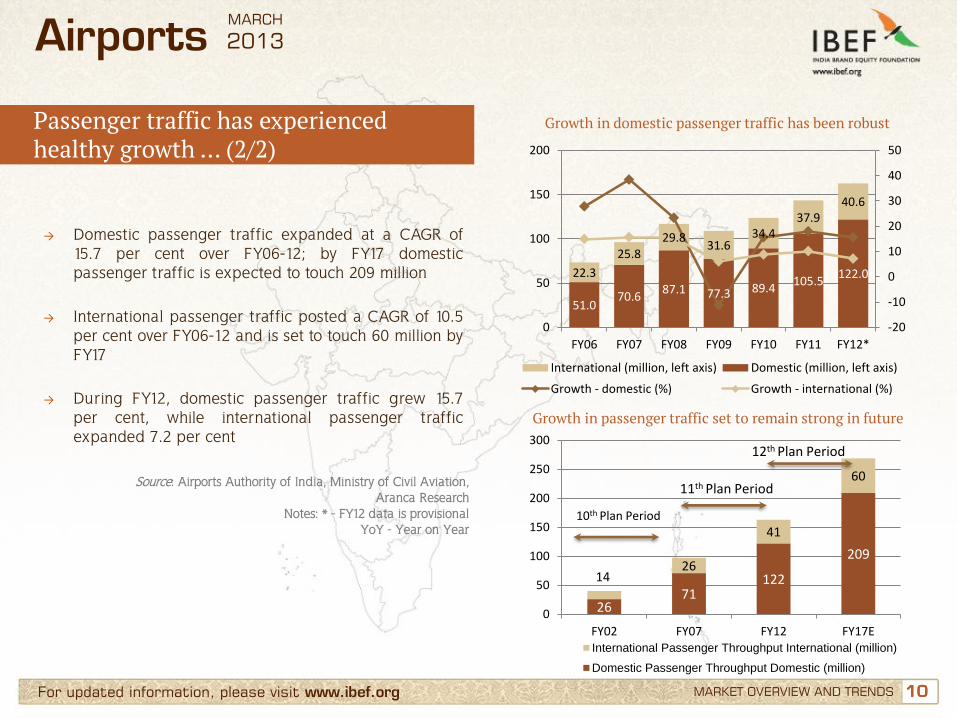
→ Domestic passenger traffic expanded at a CAGR of 15.7 per cent over FY06-12; by FY17 domestic passenger traffic is expected to touch 209 million
→ International passenger traffic posted a CAGR of 10.5 per cent over FY06-12 and is set to touch 60 million by FY17
→ During FY12, domestic passenger traffic grew 15.7 per cent, while international passenger traffic expanded 7.2 per cent
51.0 70.6
87.1 77.3 89.4 105.5
122.0 22.3
25.8 29.8
31.6 34.4
37.9 40.6
-20
-10
0
10
20
30
40
50
0
50
100
150
200
FY06 FY07 FY08 FY09 FY10 FY11 FY12*
International (million, left axis) Domestic (million, left axis)
Growth - domestic (%) Growth - international (%)
11 11 For updated information, please visit www.ibef.org
Freight traffic has also logged steady growth … (1/2)
MARKET OVERVIEW AND TRENDS
Airports
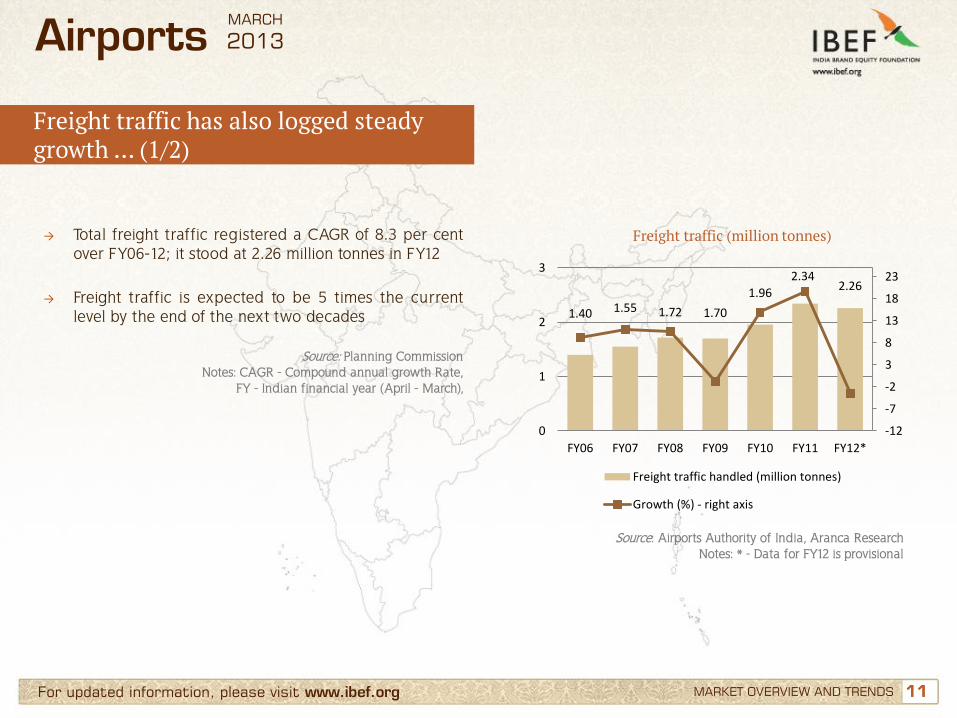
→ Total freight traffic registered a CAGR of 8.3 per cent over FY06-12; it stood at 2.26 million tonnes in FY12
→ Freight traffic is expected to be 5 times the current level by the end of the next two decades
Freight traffic (million tonnes)
Source: Airports Authority of India, Aranca Research Notes: * - Data for FY12 is provisional
Source: Planning Commission Notes: CAGR - Compound annual growth Rate,
FY - Indian financial year (April - March),
1.40 1.55 1.72 1.70
1.96
2.34 2.26
-12
-7
-2
3
8
13
18
23
0
1
2
3
FY06 FY07 FY08 FY09 FY10 FY11 FY12*
Freight traffic handled (million tonnes)
Growth (%) - right axis
MARCH
2013
12 12 For updated information, please visit www.ibef.org
Freight traffic has also logged steady growth … (2/2)
MARKET OVERVIEW AND TRENDS
Airports
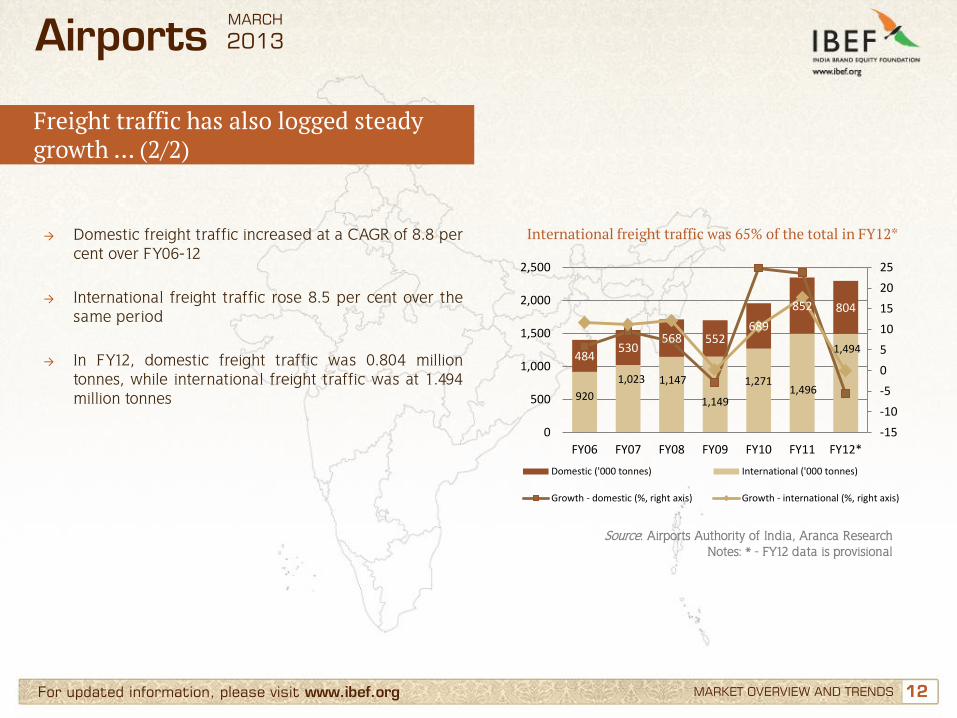
→ Domestic freight traffic increased at a CAGR of 8.8 per cent over FY06-12
→ International freight traffic rose 8.5 per cent over the same period
→ In FY12, domestic freight traffic was 0.804 million tonnes, while international freight traffic was at 1.494 million tonnes
International freight traffic was 65% of the total in FY12*
Source: Airports Authority of India, Aranca Research Notes: * - FY12 data is provisional
920
1,023 1,147
1,149
1,271 1,496
1,494 484
530 568 552
689
852 804
-15
-10
-5
0
5
10
15
20
25
0
500
1,000
1,500
2,000
2,500
FY06 FY07 FY08 FY09 FY10 FY11 FY12*
Domestic ('000 tonnes) International ('000 tonnes)
Growth - domestic (%, right axis) Growth - international (%, right axis)
MARCH
2013
13 13 For updated information, please visit www.ibef.org
Growth in aviation has also led to higher aircraft movement … (1/2)
MARKET OVERVIEW AND TRENDS
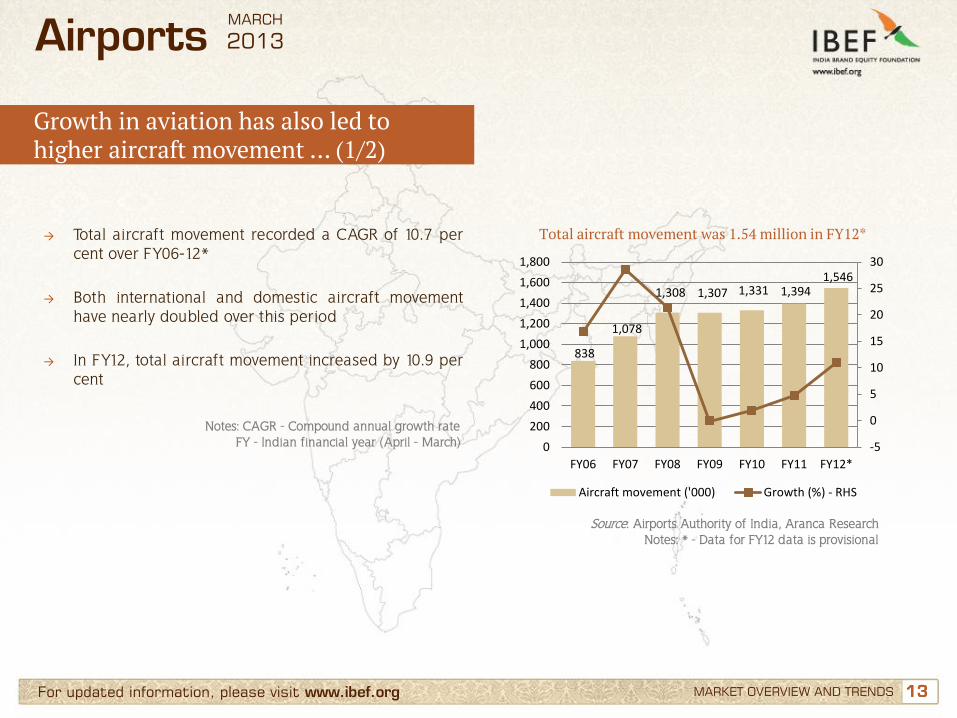
→ Total aircraft movement recorded a CAGR of 10.7 per cent over FY06-12*
→ Both international and domestic aircraft movement have nearly doubled over this period
→ In FY12, total aircraft movement increased by 10.9 per cent
Total aircraft movement was 1.54 million in FY12*
Notes: CAGR - Compound annual growth rate FY - Indian financial year (April - March)
Airports
Source: Airports Authority of India, Aranca Research Notes: * - Data for FY12 data is provisional
838
1,078
1,308 1,307 1,331 1,394 1,546
-5
0
5
10
15
20
25
30
0
200
400
600
800
1,000
1,200
1,400
1,600
1,800
FY06 FY07 FY08 FY09 FY10 FY11 FY12*
Aircraft movement ('000) Growth (%) - RHS
MARCH
2013
14 14 For updated information, please visit www.ibef.org
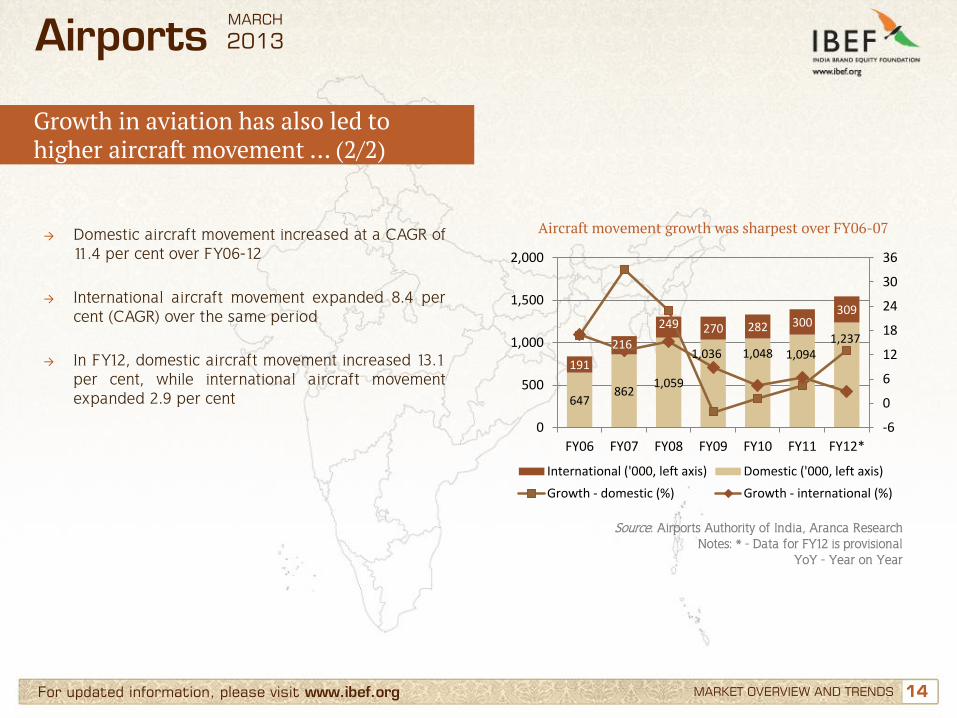
Growth in aviation has also led to higher aircraft movement … (2/2)
MARKET OVERVIEW AND TRENDS
→ Domestic aircraft movement increased at a CAGR of 11.4 per cent over FY06-12
→ International aircraft movement expanded 8.4 per cent (CAGR) over the same period
→ In FY12, domestic aircraft movement increased 13.1 per cent, while international aircraft movement expanded 2.9 per cent
Aircraft movement growth was sharpest over FY06-07
Airports
Source: Airports Authority of India, Aranca Research Notes: * - Data for FY12 is provisional
YoY - Year on Year
647 862
1,059
1,036 1,048 1,094 1,237
191
216
249 270 282 300 309
-6
0
6
12
18
24
30
36
0
500
1,000
1,500
2,000
FY06 FY07 FY08 FY09 FY10 FY11 FY12*
International ('000, left axis) Domestic ('000, left axis)
Growth - domestic (%) Growth - international (%)
MARCH
2013
15 15 For updated information, please visit www.ibef.org MARKET OVERVIEW AND TRENDS
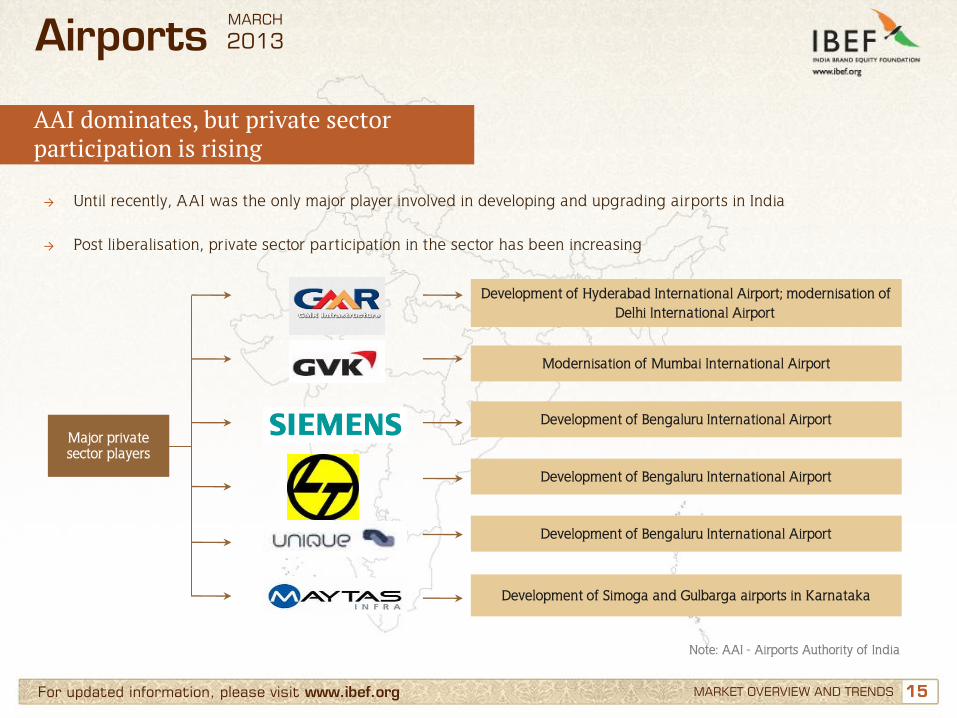
AAI dominates, but private sector participation is rising
Airports
→ Until recently, AAI was the only major player involved in developing and upgrading airports in India → Post liberalisation, private sector participation in the sector has been increasing
Major private sector players
Development of Hyderabad International Airport; modernisation of Delhi International Airport
Modernisation of Mumbai International Airport
Development of Bengaluru International Airport
Development of Bengaluru International Airport
Development of Bengaluru International Airport
Development of Simoga and Gulbarga airports in Karnataka
Note: AAI - Airports Authority of India
MARCH
2013
16 16 For updated information, please visit www.ibef.org MARKET OVERVIEW AND TRENDS
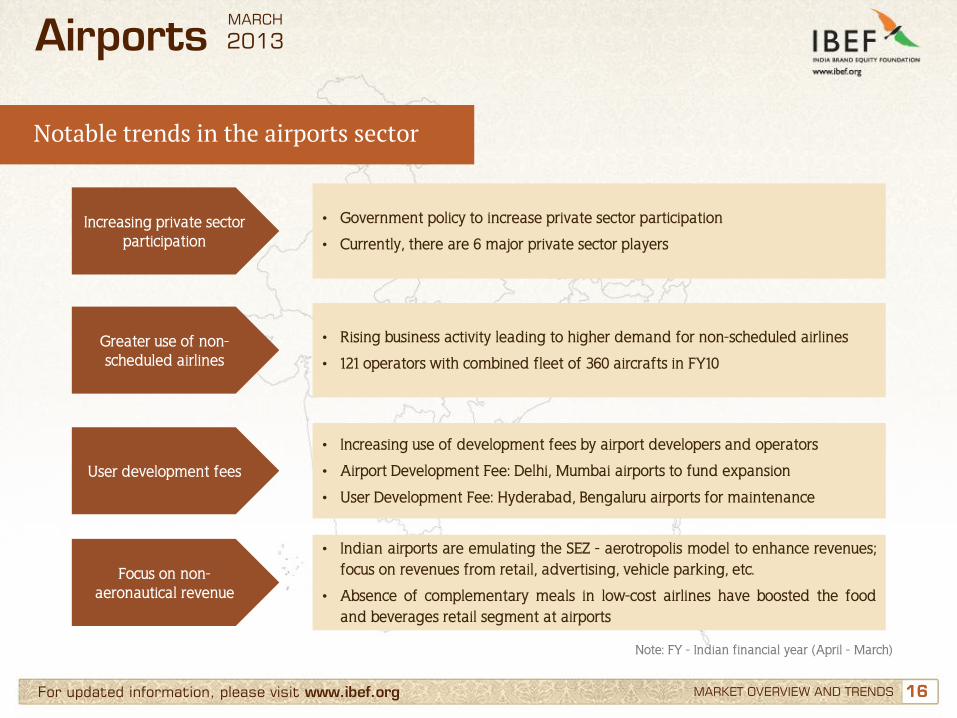
Notable trends in the airports sector
Airports
Note: FY - Indian financial year (April - March)
Increasing private sector participation
• Government policy to increase private sector participation
• Currently, there are 6 major private sector players
Greater use of non-scheduled airlines
• Rising business activity leading to higher demand for non-scheduled airlines
• 121 operators with combined fleet of 360 aircrafts in FY10
User development fees
• Increasing use of development fees by airport developers and operators
• Airport Development Fee: Delhi, Mumbai airports to fund expansion
• User Development Fee: Hyderabad, Bengaluru airports for maintenance
Focus on non-aeronautical revenue
• Indian airports are emulating the SEZ - aerotropolis model to enhance revenues; focus on revenues from retail, advertising, vehicle parking, etc.
• Absence of complementary meals in low-cost airlines have boosted the food and beverages retail segment at airports
MARCH
2013
17 17
Contents
Advantage India
Market overview and trends
Growth drivers
Success stories: Delhi, Mumbai
Opportunities
Useful information
For updated information, please visit www.ibef.org
Airports MARCH
2013
18 18 For updated information, please visit www.ibef.org GROWTH DRIVERS
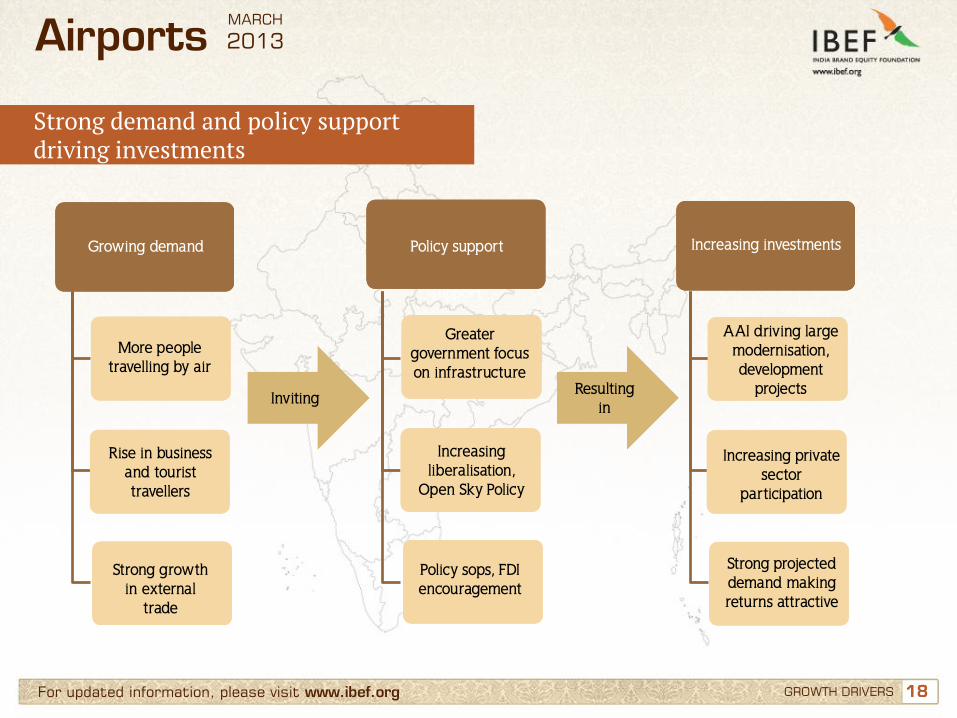
Strong demand and policy support driving investments
Airports
Strong
government
support
Growing demand
Inviting Resulting
in
Growing demand Increasing investments Policy support
More people travelling by air
Rise in business and tourist travellers
Strong growth in external
trade
Greater government focus on infrastructure
Increasing liberalisation,
Open Sky Policy
Policy sops, FDI encouragement
AAI driving large modernisation, development
projects
Increasing private sector
participation
Strong projected demand making returns attractive
MARCH
2013
19 19 For updated information, please visit www.ibef.org
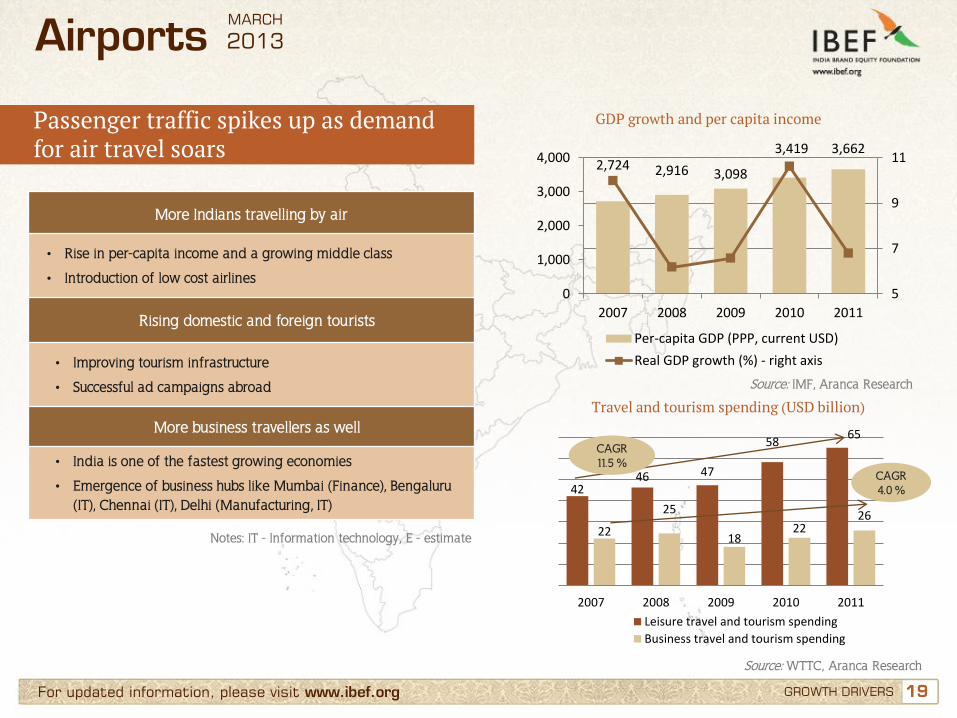
Passenger traffic spikes up as demand for air travel soars
GROWTH DRIVERS
Airports
More Indians travelling by air
• Rise in per-capita income and a growing middle class
• Introduction of low cost airlines
Rising domestic and foreign tourists
• Improving tourism infrastructure
• Successful ad campaigns abroad
More business travellers as well
• India is one of the fastest growing economies
• Emergence of business hubs like Mumbai (Finance), Bengaluru (IT), Chennai (IT), Delhi (Manufacturing, IT)
Travel and tourism spending (USD billion)
Source: IMF, Aranca Research
Source: WTTC, Aranca Research
Notes: IT - Information technology, E - estimate
GDP growth and per capita income
42 46 47
58 65
22
25
18 22
26
2007 2008 2009 2010 2011
Leisure travel and tourism spending
Business travel and tourism spending
CAGR 11.5 %
CAGR 4.0 %
2,724 2,916 3,098
3,419 3,662
5
7
9
11
0
1,000
2,000
3,000
4,000
2007 2008 2009 2010 2011
Per-capita GDP (PPP, current USD)
Real GDP growth (%) - right axis
MARCH
2013
20 20 For updated information, please visit www.ibef.org
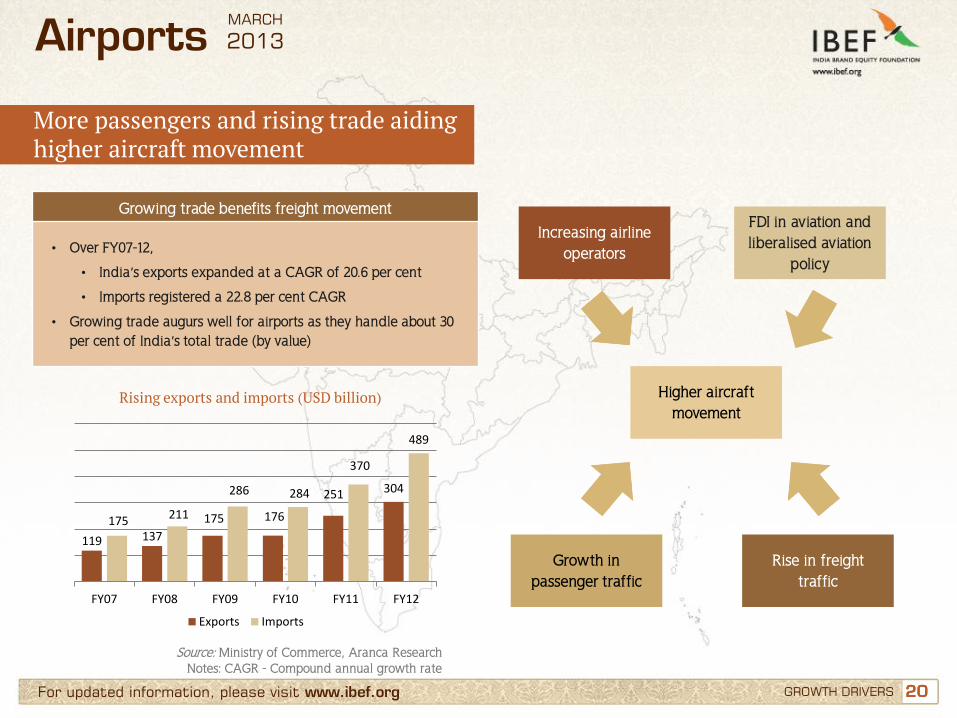
More passengers and rising trade aiding higher aircraft movement
GROWTH DRIVERS
Rising exports and imports (USD billion)
Source: Ministry of Commerce, Aranca Research Notes: CAGR - Compound annual growth rate
Airports
Growing trade benefits freight movement
• Over FY07-12,
• India’s exports expanded at a CAGR of 20.6 per cent
• Imports registered a 22.8 per cent CAGR
• Growing trade augurs well for airports as they handle about 30 per cent of India’s total trade (by value)
Higher aircraft movement
Increasing airline operators
Rise in freight traffic
Growth in passenger traffic
FDI in aviation and liberalised aviation
policy
119 137
175 176
251 304
175 211
286 284
370
489
FY07 FY08 FY09 FY10 FY11 FY12
Exports Imports
MARCH
2013
21 21 For updated information, please visit www.ibef.org GROWTH DRIVERS
Airports
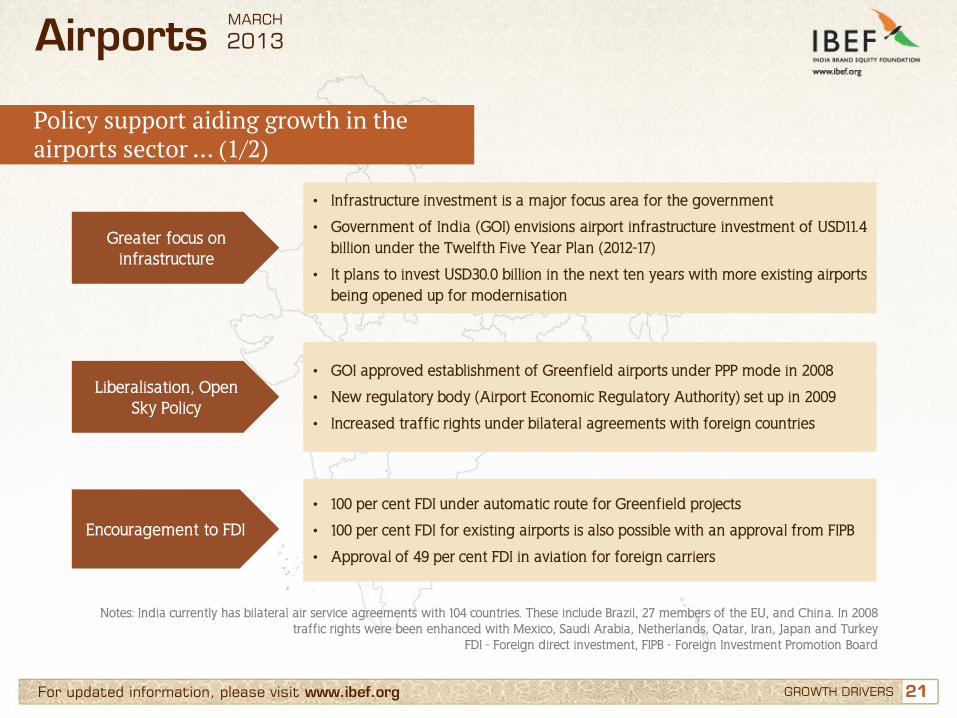
Notes: India currently has bilateral air service agreements with 104 countries. These include Brazil, 27 members of the EU, and China. In 2008 traffic rights were been enhanced with Mexico, Saudi Arabia, Netherlands, Qatar, Iran, Japan and Turkey
FDI - Foreign direct investment, FIPB - Foreign Investment Promotion Board
Greater focus on infrastructure
• Infrastructure investment is a major focus area for the government
• Government of India (GOI) envisions airport infrastructure investment of USD11.4 billion under the Twelfth Five Year Plan (2012-17)
• It plans to invest USD30.0 billion in the next ten years with more existing airports being opened up for modernisation
Liberalisation, Open Sky Policy
• GOI approved establishment of Greenfield airports under PPP mode in 2008
• New regulatory body (Airport Economic Regulatory Authority) set up in 2009
• Increased traffic rights under bilateral agreements with foreign countries
Encouragement to FDI
• 100 per cent FDI under automatic route for Greenfield projects
• 100 per cent FDI for existing airports is also possible with an approval from FIPB
• Approval of 49 per cent FDI in aviation for foreign carriers
MARCH
2013
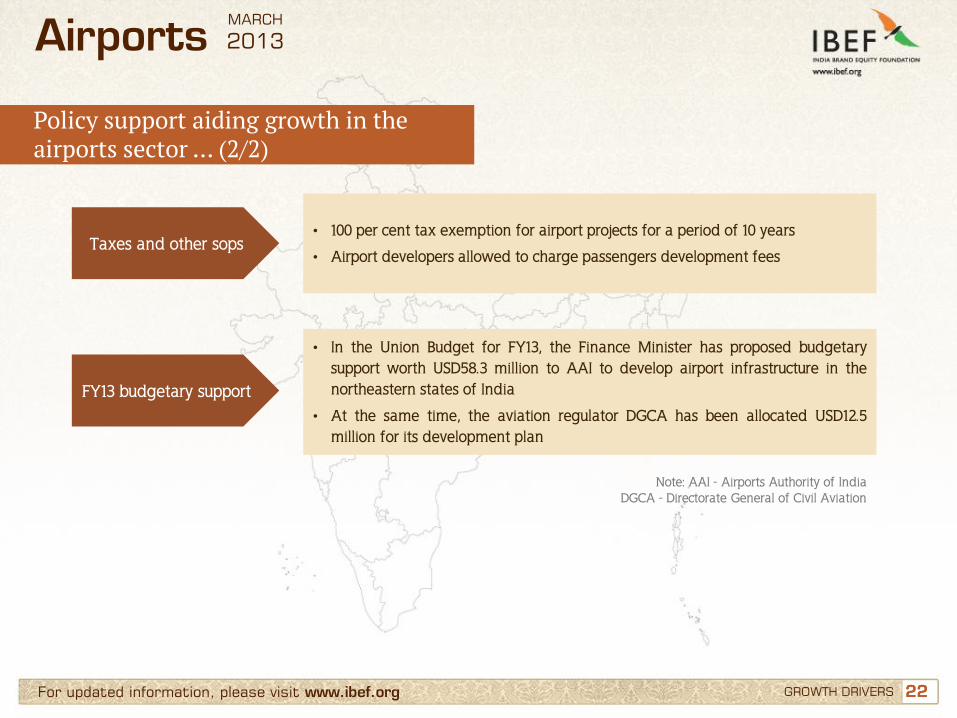
Policy support aiding growth in the airports sector … (1/2)
22 22 For updated information, please visit www.ibef.org GROWTH DRIVERS
Airports
FY13 budgetary support
• In the Union Budget for FY13, the Finance Minister has proposed budgetary support worth USD58.3 million to AAI to develop airport infrastructure in the northeastern states of India
• At the same time, the aviation regulator DGCA has been allocated USD12.5 million for its development plan
Note: AAI - Airports Authority of India
DGCA - Directorate General of Civil Aviation
Taxes and other sops • 100 per cent tax exemption for airport projects for a period of 10 years
• Airport developers allowed to charge passengers development fees
MARCH
2013
Policy support aiding growth in the airports sector … (2/2)
23 23 For updated information, please visit www.ibef.org GROWTH DRIVERS
Airports
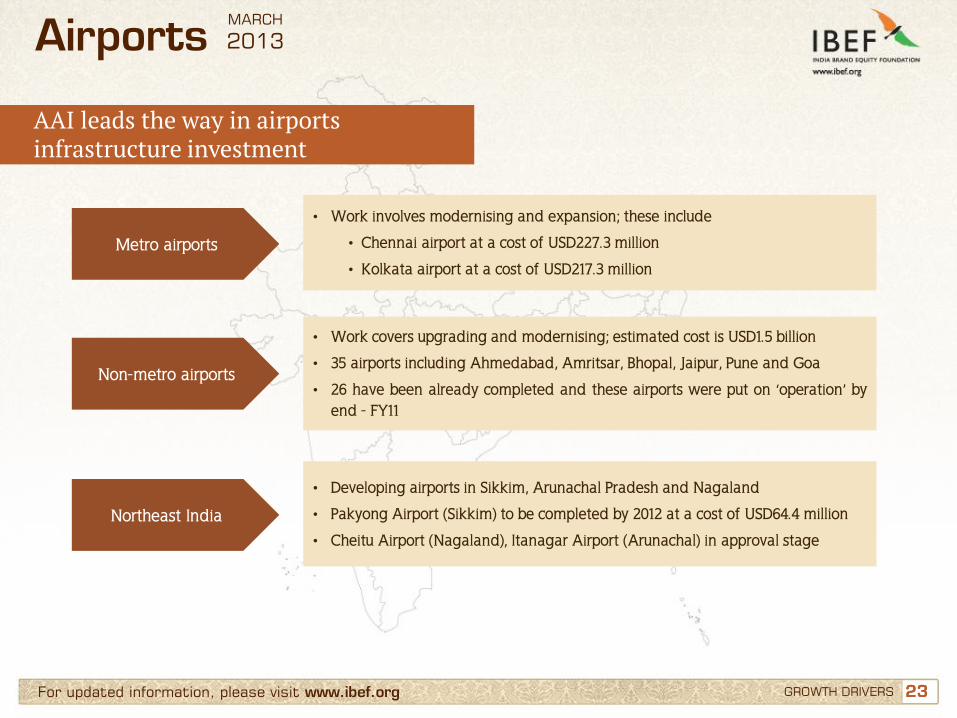
Metro airports
• Work involves modernising and expansion; these include
• Chennai airport at a cost of USD227.3 million
• Kolkata airport at a cost of USD217.3 million
Non-metro airports
• Work covers upgrading and modernising; estimated cost is USD1.5 billion
• 35 airports including Ahmedabad, Amritsar, Bhopal, Jaipur, Pune and Goa
• 26 have been already completed and these airports were put on ‘operation’ by end - FY11
Northeast India
• Developing airports in Sikkim, Arunachal Pradesh and Nagaland
• Pakyong Airport (Sikkim) to be completed by 2012 at a cost of USD64.4 million
• Cheitu Airport (Nagaland), Itanagar Airport (Arunachal) in approval stage
MARCH
2013
AAI leads the way in airports infrastructure investment
24 24 For updated information, please visit www.ibef.org GROWTH DRIVERS
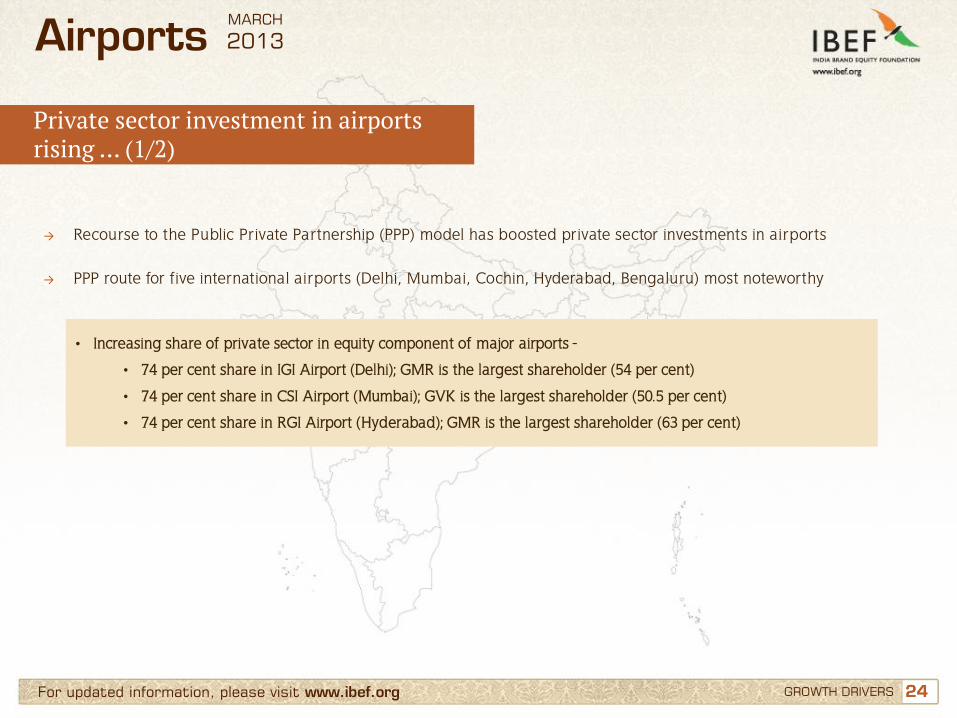
→ Recourse to the Public Private Partnership (PPP) model has boosted private sector investments in airports
→ PPP route for five international airports (Delhi, Mumbai, Cochin, Hyderabad, Bengaluru) most noteworthy
Airports
• Increasing share of private sector in equity component of major airports -
• 74 per cent share in IGI Airport (Delhi); GMR is the largest shareholder (54 per cent)
• 74 per cent share in CSI Airport (Mumbai); GVK is the largest shareholder (50.5 per cent)
• 74 per cent share in RGI Airport (Hyderabad); GMR is the largest shareholder (63 per cent)
MARCH
2013
Private sector investment in airports rising … (1/2)
25 25 For updated information, please visit www.ibef.org GROWTH DRIVERS
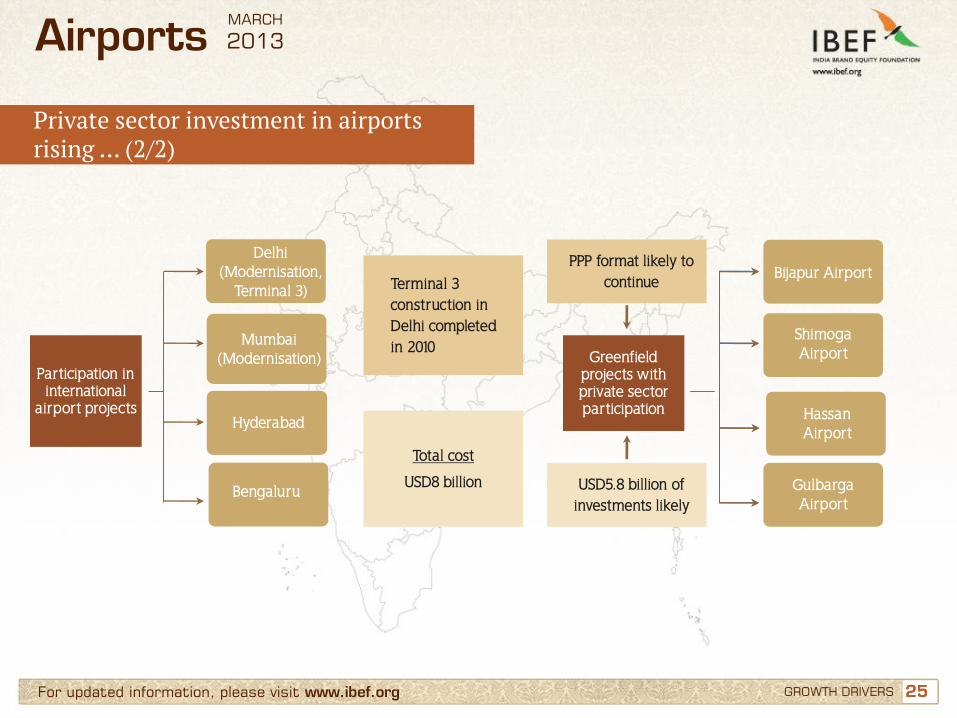
Airports
Participation in international
airport projects
Terminal 3 construction in Delhi completed in 2010
Total cost
USD8 billion
Greenfield projects with private sector participation
PPP format likely to continue
USD5.8 billion of investments likely
Delhi (Modernisation,
Terminal 3)
Mumbai (Modernisation)
Hyderabad
Bengaluru
Bijapur Airport
Shimoga Airport
Hassan Airport
Gulbarga Airport
MARCH
2013
Private sector investment in airports rising … (2/2)
26 26 For updated information, please visit www.ibef.org GROWTH DRIVERS
Airports
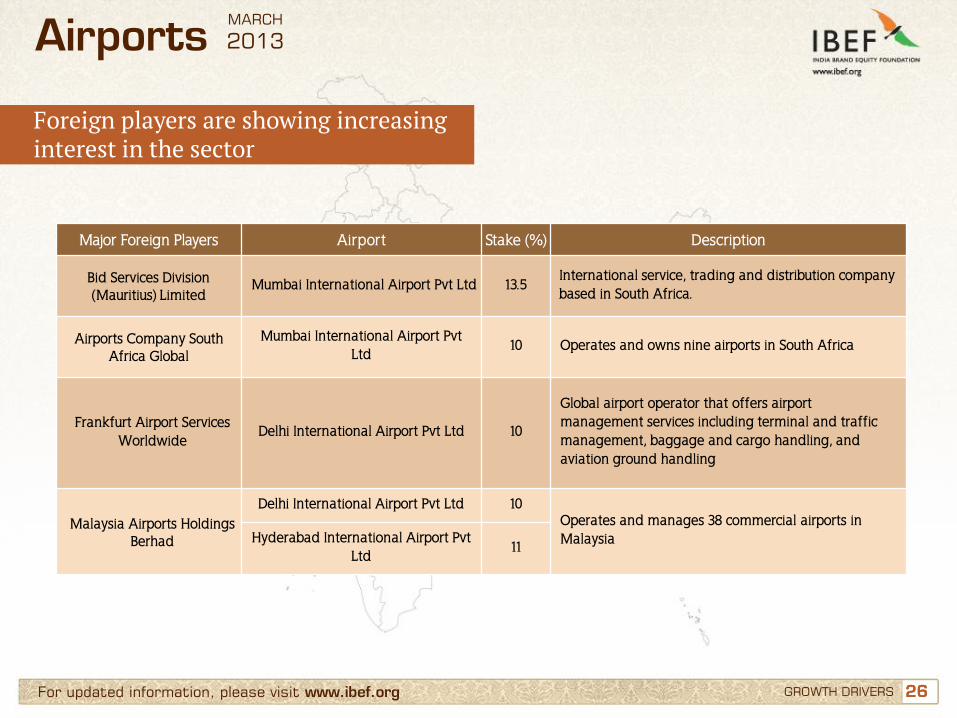
Major Foreign Players Airport Stake (%) Description
Bid Services Division (Mauritius) Limited
Mumbai International Airport Pvt Ltd 13.5 International service, trading and distribution company based in South Africa.
Airports Company South Africa Global
Mumbai International Airport Pvt Ltd
10 Operates and owns nine airports in South Africa
Frankfurt Airport Services Worldwide
Delhi International Airport Pvt Ltd 10
Global airport operator that offers airport management services including terminal and traffic management, baggage and cargo handling, and aviation ground handling
Malaysia Airports Holdings Berhad
Delhi International Airport Pvt Ltd 10 Operates and manages 38 commercial airports in Malaysia Hyderabad International Airport Pvt
Ltd 11
MARCH
2013
Foreign players are showing increasing interest in the sector
27 27
Contents
Advantage India
Market overview and trends
Growth drivers
Success stories: Delhi, Mumbai
Opportunities
Useful information
For updated information, please visit www.ibef.org
Airports MARCH
2013
28 28 For updated information, please visit www.ibef.org SUCCESS STORIES: DELHI, MUMBAI
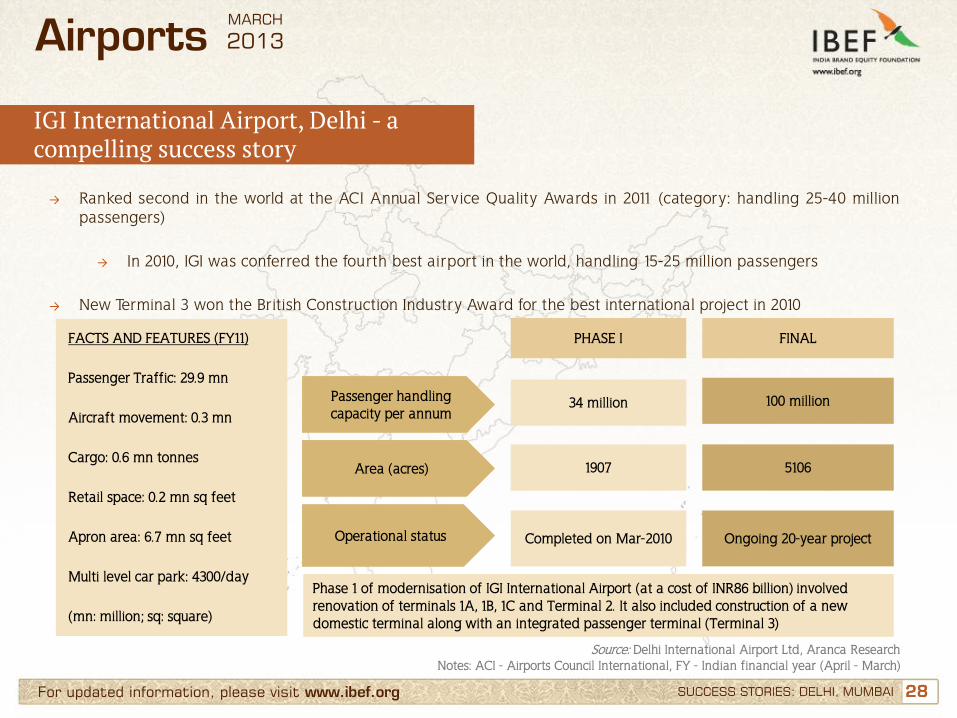
IGI International Airport, Delhi - a compelling success story
→ Ranked second in the world at the ACI Annual Service Quality Awards in 2011 (category: handling 25-40 million passengers)
→ In 2010, IGI was conferred the fourth best airport in the world, handling 15-25 million passengers → New Terminal 3 won the British Construction Industry Award for the best international project in 2010
Source: Delhi International Airport Ltd, Aranca Research Notes: ACI - Airports Council International, FY - Indian financial year (April - March)
Airports
PHASE I
Operational status Completed on Mar-2010 Ongoing 20-year project
Area (acres) 1907 5106
Passenger handling capacity per annum
34 million 100 million
FINAL FACTS AND FEATURES (FY11)
Passenger Traffic: 29.9 mn
Aircraft movement: 0.3 mn
Cargo: 0.6 mn tonnes
Retail space: 0.2 mn sq feet
Apron area: 6.7 mn sq feet
Multi level car park: 4300/day
(mn: million; sq: square)
Phase 1 of modernisation of IGI International Airport (at a cost of INR86 billion) involved renovation of terminals 1A, 1B, 1C and Terminal 2. It also included construction of a new domestic terminal along with an integrated passenger terminal (Terminal 3)
MARCH
2013
29 29 For updated information, please visit www.ibef.org
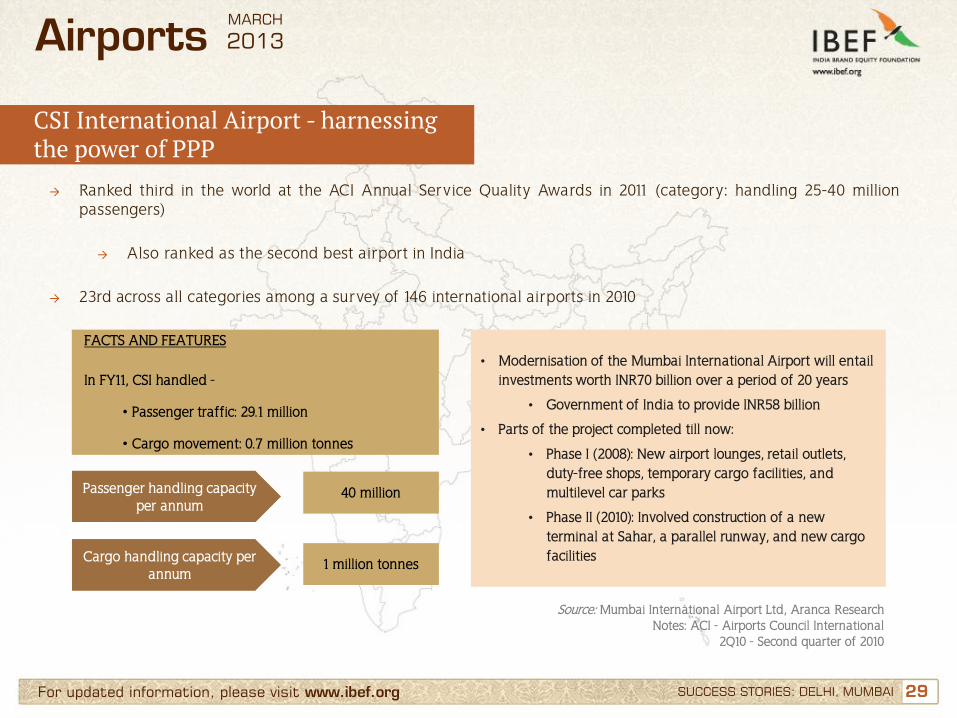
CSI International Airport - harnessing the power of PPP
Airports
→ Ranked third in the world at the ACI Annual Service Quality Awards in 2011 (category: handling 25-40 million passengers)
→ Also ranked as the second best airport in India
→ 23rd across all categories among a survey of 146 international airports in 2010
Passenger handling capacity per annum
Cargo handling capacity per annum
1 million tonnes
40 million
• Modernisation of the Mumbai International Airport will entail investments worth INR70 billion over a period of 20 years
• Government of India to provide INR58 billion
• Parts of the project completed till now:
• Phase I (2008): New airport lounges, retail outlets, duty-free shops, temporary cargo facilities, and multilevel car parks
• Phase II (2010): Involved construction of a new terminal at Sahar, a parallel runway, and new cargo facilities
Source: Mumbai International Airport Ltd, Aranca Research Notes: ACI - Airports Council International
2Q10 - Second quarter of 2010
SUCCESS STORIES: DELHI, MUMBAI
MARCH
2013
FACTS AND FEATURES
In FY11, CSI handled -
• Passenger traffic: 29.1 million
• Cargo movement: 0.7 million tonnes

30 30
Contents
Advantage India
Market overview and trends
Growth drivers
Success stories: Delhi, Mumbai
Opportunities
Useful information
For updated information, please visit www.ibef.org
Airports MARCH
2013
31 31 For updated information, please visit www.ibef.org OPPORTUNITIES
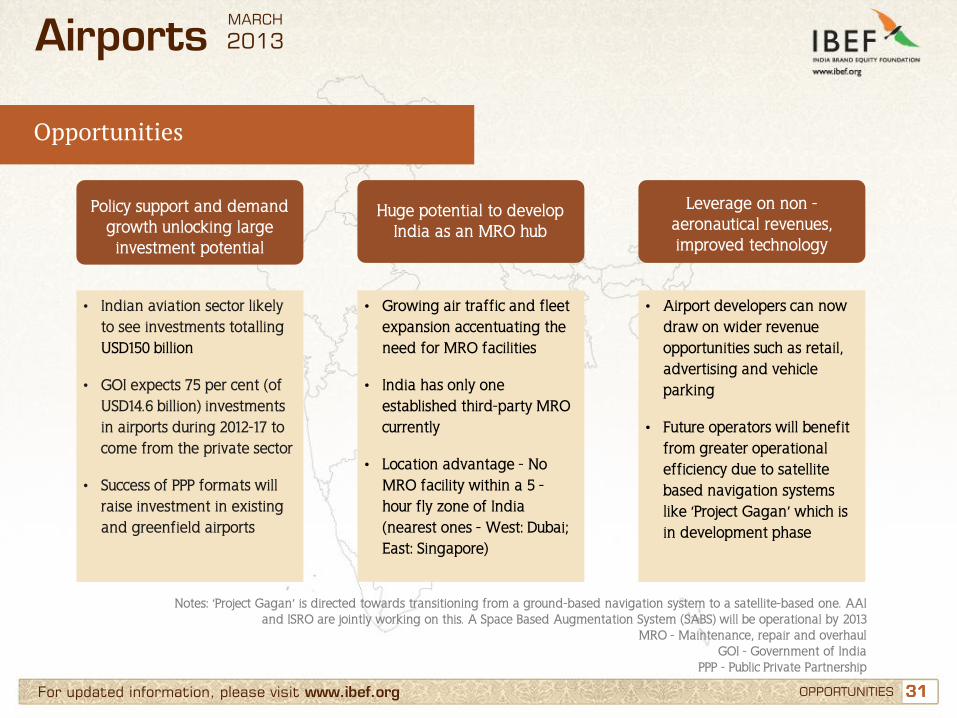
Opportunities
Airports
• Indian aviation sector likely to see investments totalling USD150 billion
• GOI expects 75 per cent (of USD14.6 billion) investments in airports during 2012-17 to come from the private sector
• Success of PPP formats will raise investment in existing and greenfield airports
• Growing air traffic and fleet expansion accentuating the need for MRO facilities
• India has only one established third-party MRO currently
• Location advantage - No MRO facility within a 5 - hour fly zone of India (nearest ones - West: Dubai; East: Singapore)
• Airport developers can now draw on wider revenue opportunities such as retail, advertising and vehicle parking
• Future operators will benefit from greater operational efficiency due to satellite based navigation systems like ‘Project Gagan’ which is in development phase
Policy support and demand growth unlocking large investment potential
Huge potential to develop India as an MRO hub
Leverage on non -aeronautical revenues, improved technology
Notes: ‘Project Gagan’ is directed towards transitioning from a ground-based navigation system to a satellite-based one. AAI and ISRO are jointly working on this. A Space Based Augmentation System (SABS) will be operational by 2013
MRO - Maintenance, repair and overhaul GOI - Government of India
PPP - Public Private Partnership
MARCH
2013
32 32
Contents
Advantage India
Market overview and trends
Growth drivers
Success stories: Delhi, Mumbai
Opportunities
Useful information
For updated information, please visit www.ibef.org
Airports MARCH
2013
33 33 For updated information, please visit www.ibef.org USEFUL INFORMATION
Industry Associations
Airports Authority of India (AAI) Rajiv Gandhi Bhawan, Safdarjung Airport, New Delhi - 110 003 Phone: 91-11-24632950 Directorate General of Civil Aviation (DGCA) Aurbindo Marg, Opp. Safdarjung Airport, New Delhi - 110 003 Phone: 91-11-24622495 Fax: 91-11-24629221 E-mail: [email protected], [email protected]
Airports MARCH
2013
34 34 For updated information, please visit www.ibef.org
Glossary
→ AAI: Airports Authority of India
→ ACI: Airport Council International
→ CAGR: Compound Annual Growth Rate
→ FDI: Foreign Direct Investment
→ FY: Indian Financial Year (April to March) → So FY10 implies April 2009 to March 2010
→ GOI: Government of India
→ INR: Indian Rupee
→ MRO: Maintenance, repair and overhaul
→ PPP: It could denote two things (mentioned in the presentation accordingly) -
→ Purchasing Power Parity (used in calculating per-capita GDP - slide 12, GROWTH DRIVERS) → Public Private Partnership (a type of joint venture between the public and private sectors)
→ USD: US Dollar
→ Conversion rate used: USD1 = INR 48
→ Wherever applicable, numbers have been rounded off to the nearest whole number
USEFUL INFORMATION
Airports MARCH
2013
35
India Brand Equity Foundation (IBEF) engaged Aranca to prepare this presentation and the same has been prepared by Aranca in consultation with IBEF. All rights reserved. All copyright in this presentation and related works is solely and exclusively owned by IBEF. The same may not be reproduced, wholly or in part in any material form (including photocopying or storing it in any medium by electronic means and whether or not transiently or incidentally to some other use of this presentation), modified or in any manner communicated to any third party except with the written approval of IBEF. This presentation is for information purposes only. While due care has been taken during the compilation of this
presentation to ensure that the information is accurate to the best of Aranca and IBEF’s knowledge and belief, the content is not to be construed in any manner whatsoever as a substitute for professional advice. Aranca and IBEF neither recommend nor endorse any specific products or services that may have been mentioned in this presentation and nor do they assume any liability or responsibility for the outcome of decisions taken as a result of any reliance placed on this presentation. Neither Aranca nor IBEF shall be liable for any direct or indirect damages that may arise due to any act or omission on the part of the user due to any reliance placed or guidance taken from any portion of this presentation.
For updated information, please visit www.ibef.org DISCLAIMER
Airports MARCH
2013
Disclaimer
Recommended