7/29/2019 AIRLINE MANAGEMENT SYSTEM
http://slidepdf.com/reader/full/airline-management-system 1/16
UNIVERSITY OF Hertfordshire
MASTER OF BUSINESS ADMINISTRATION
COURSE CODE: XXXXXX
TITLE OF ASSIGNMENT
Management Accounting: A case of Hertfordshire Airways PLC
Author's initials and surname
J. Law
Students Registration Number
XXXXXXXX
Month and year of submission JANUARY 2009
Page1
7/29/2019 AIRLINE MANAGEMENT SYSTEM
http://slidepdf.com/reader/full/airline-management-system 2/16
Table of Contents
1. Executive Summary.............................................................................32. Strategic Decision Independent of Forecasting Team..........................4
2.1 Strategic Decision 1: New Fuel Efficient Aircraft (Type A)...............42.1.1 Cost Considerations for Aircraft Type A....................................42.1.2 Revenue Considerations...........................................................52.1.3 Profit Consideration..................................................................52.1.4 Analysis.....................................................................................6
2.2 Strategic Decision 2: Improved Design of Current Model................62.2.1 Cost Considerations for Aircraft Model Improvement...............72.2.2 Revenue Considerations: Optimistic Scenario..........................72.2.3 Profit Consideration: Optimistic Scenario..................................82.2.4 Analysis.....................................................................................8
2.3 Strategic Decision 3: Previous Aircraft Model.................................9
2.3.1 Cost Considerations for Aircraft Model Improvement...............92.3.2 Revenue Considerations: Optimistic Scenario........................102.3.3 Profit Consideration: Optimistic Scenario................................102.3.4 Analysis...................................................................................11
3. Strategic Decision based on Predictions of Forecasting Team...........12...............................................................................................................12
3.1 Analysis.........................................................................................123.2 Final Recommendations................................................................13
4. Assumptions & Methodology: Traditional Cost System......................134.1 Critique: Traditional Based Cost System.......................................134.2 Alternative: Activity Based Costing Approaches...........................134.3 ABC: Overcoming Limitations & Improving Decision Making........14
4.3.1 Price Allocation.......................................................................144.3.2 Revenue Generation vs Resource Consumption.....................144.3.3 Different Views........................................................................14
5. Strategy Option: Short Haul Flights....................................................156. Bibliography & Reference...................................................................15
Page2
7/29/2019 AIRLINE MANAGEMENT SYSTEM
http://slidepdf.com/reader/full/airline-management-system 3/16
Assignment Overview
1. Executive Summary
Hertfordshire Airways is currently in the process of repositioning itself asmarket leader after long years of market domination, but with an ageingfleet and dip in profits, Hertfordshire Airways seeks recommendations onthe best strategy to implement amongst three options as it responds witha commitment to long haul routes which requires renewal of its fleet of aircrafts. In this report, utilizing the traditional cost methodology whichinvolves identifying and calculating the key cost drivers such as variablecost, fixed cost and projected profitability, I have outlined for topmanagement the viability of three different strategies and a finalrecommendation on the best option based on sample evidence as thecompany pursues its drive to renew its fleet for long haul flights.
For the first strategy which is the purchase of 35 new fuel-efficientaircrafts of type (A), which is a radically new aircraft model, with aprojection of no delivery delays and a realistic scenario, the companywould incur a total cost of £837,600,000, a total revenue of £1,940,400,000 and a projected profitability of £1,102,800,000.
For the second strategy which is embarking on the purchase of 15 newaircrafts of type (A) and 25 new aircrafts of type (B) which are bothimproved designs of the current model, the company would incur a total
cost of £362,400,000, a total revenue of £831,600,000 and a projectedprofitability of £469,200,000 for the 15 new aircrafts of type (A). Inaddition, the company would incur a total cost of £298,000,000, a totalrevenue of £588,000,000 and a projected profitability of £290,000,000 if itpurchases 25 new aircrafts of type (B).
With regards the final strategy, if the company embarks on purchasing 25aircrafts of type (B) and 25 new aircrafts of type (C), which are previousdesigns of the current model, it would incur a total cost of £298,000,000,a total revenue of £588,000,000 and a projected profitability of £290,000,000 for aircrafts type (B) and incur a total cost of £156,625,000,
a total revenue of £306,250,000 and a projected profitability of £149,625,000 for aircrafts type (C).
Based on the sample evidence, I would therefore recommend the thirdstrategy because based on delivery delays of 3 years for aircraft type (A)and 18 months for aircraft type (B), the company would run at a loss of -£18,000,000 fixed cost for the first 3 years if it decides to go ahead withthe first strategy and would only break even in year 3, while the companywould run at a loss of -£8,000,000 fixed cost for the first two years if itdecides to go ahead with the second strategy and would only break evenat the end of year 2. But with the third strategy, there are no deliverydelays and the company would be better positioned to overcome thedisruptions, risks, teething issues which are synonymous with the
Page3
7/29/2019 AIRLINE MANAGEMENT SYSTEM
http://slidepdf.com/reader/full/airline-management-system 4/16
introduction of major new models of aircraft. In addition, based on the factthat a ten year profitability projection is desired starting from 2007,profitability of £290,000,000 for aircraft type (B) and £149,625,000 foraircrafts type (C) is most viable considering the other options.
2. Strategic Decision Independent of Forecasting Team
2.1 Strategic Decision 1: New Fuel Efficient Aircraft (Type A)
Number of aircrafts = 35
Aircraft capacity for Type A = 550
Total Capacity = 550 * 35 = 19250
Average number of flights per routes for Type A = 90
Total Number of flights / routes for Type A = 90 * 4 = 360
Average ticket price of Type A = £280
Cost per flight for Type (A) - £280 * 19250 = 5,390,000
AFC of Type A = 6,000,000
AVC per passenger for Type A = £120 * 19250 = 2,310,000
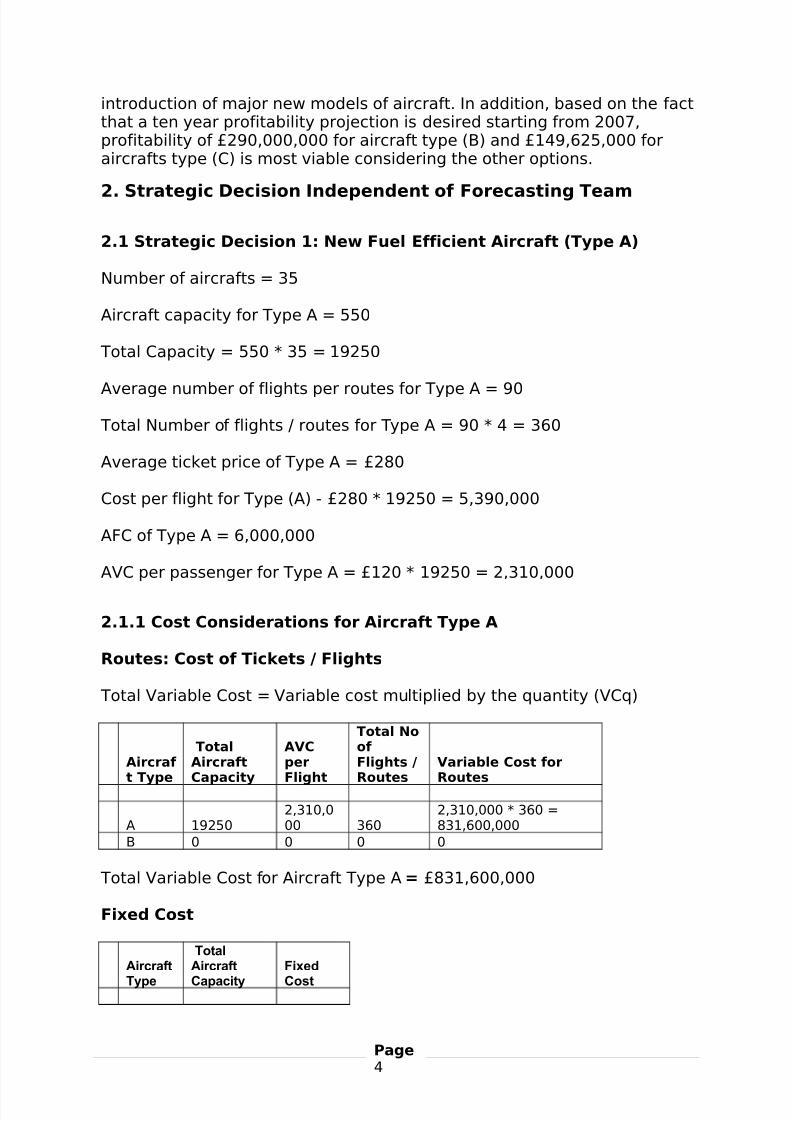
2.1.1 Cost Considerations for Aircraft Type A
Routes: Cost of Tickets / Flights
Total Variable Cost = Variable cost multiplied by the quantity (VCq)
Aircraf
t Type
TotalAircraft
Capacity
AVCper
Flight
Total Noof Flights /
Routes
Variable Cost for
Routes
A 192502,310,000 360
2,310,000 * 360 =831,600,000
B 0 0 0 0
Total Variable Cost for Aircraft Type A = £831,600,000
Fixed Cost
AircraftType
TotalAircraftCapacity
FixedCost
Page4
7/29/2019 AIRLINE MANAGEMENT SYSTEM
http://slidepdf.com/reader/full/airline-management-system 5/16
A 19250 6,000,000
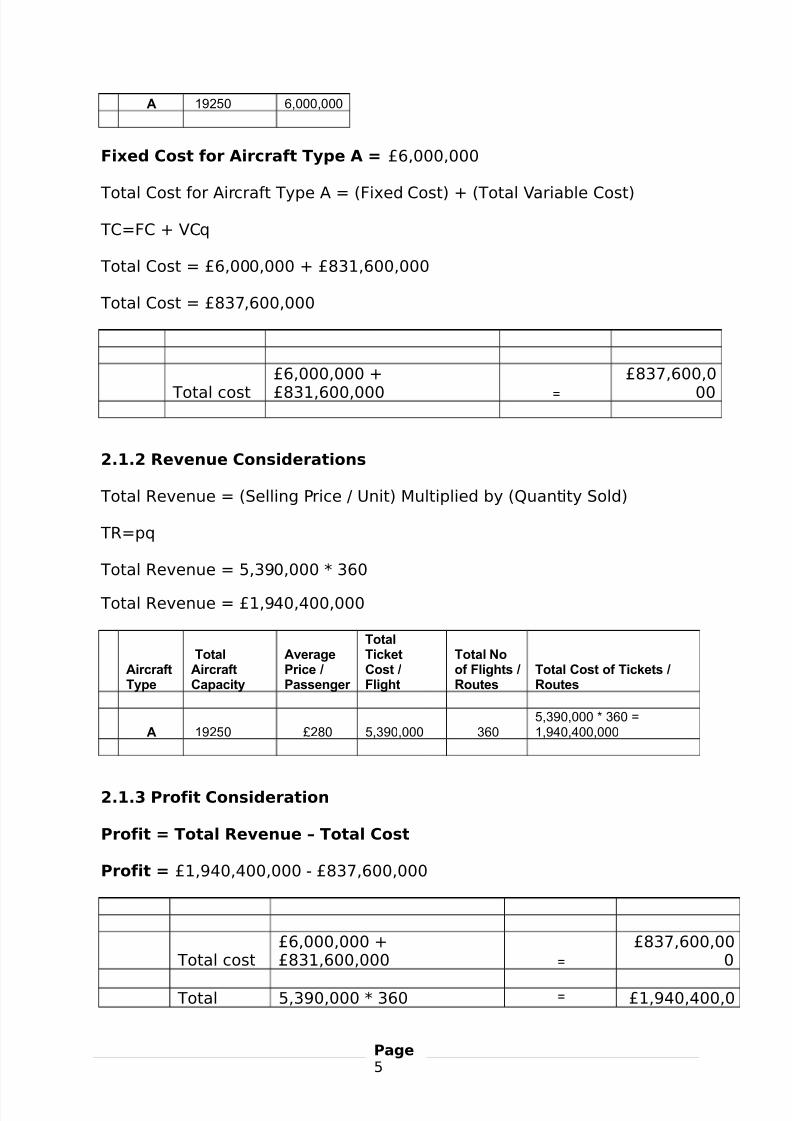
Fixed Cost for Aircraft Type A = £6,000,000
Total Cost for Aircraft Type A = (Fixed Cost) + (Total Variable Cost)
TC=FC + VCq
Total Cost = £6,000,000 + £831,600,000
Total Cost = £837,600,000
Total cost
£6,000,000 +
£831,600,000 =
£837,600,0
00
2.1.2 Revenue Considerations
Total Revenue = (Selling Price / Unit) Multiplied by (Quantity Sold)
TR=pq
Total Revenue = 5,390,000 * 360
Total Revenue = £1,940,400,000
AircraftType
TotalAircraftCapacity
AveragePrice /Passenger
TotalTicketCost /Flight
Total Noof Flights /Routes
Total Cost of Tickets /Routes
A 19250 £280 5,390,000 360
5,390,000 * 360 =
1,940,400,000
2.1.3 Profit Consideration
Profit = Total Revenue – Total Cost
Profit = £1,940,400,000 - £837,600,000
Total cost£6,000,000 +£831,600,000 =
£837,600,000
Total 5,390,000 * 360 = £1,940,400,0
Page5
7/29/2019 AIRLINE MANAGEMENT SYSTEM
http://slidepdf.com/reader/full/airline-management-system 6/16
revenue 00
Pre-taxprofit
£1,102,800,000
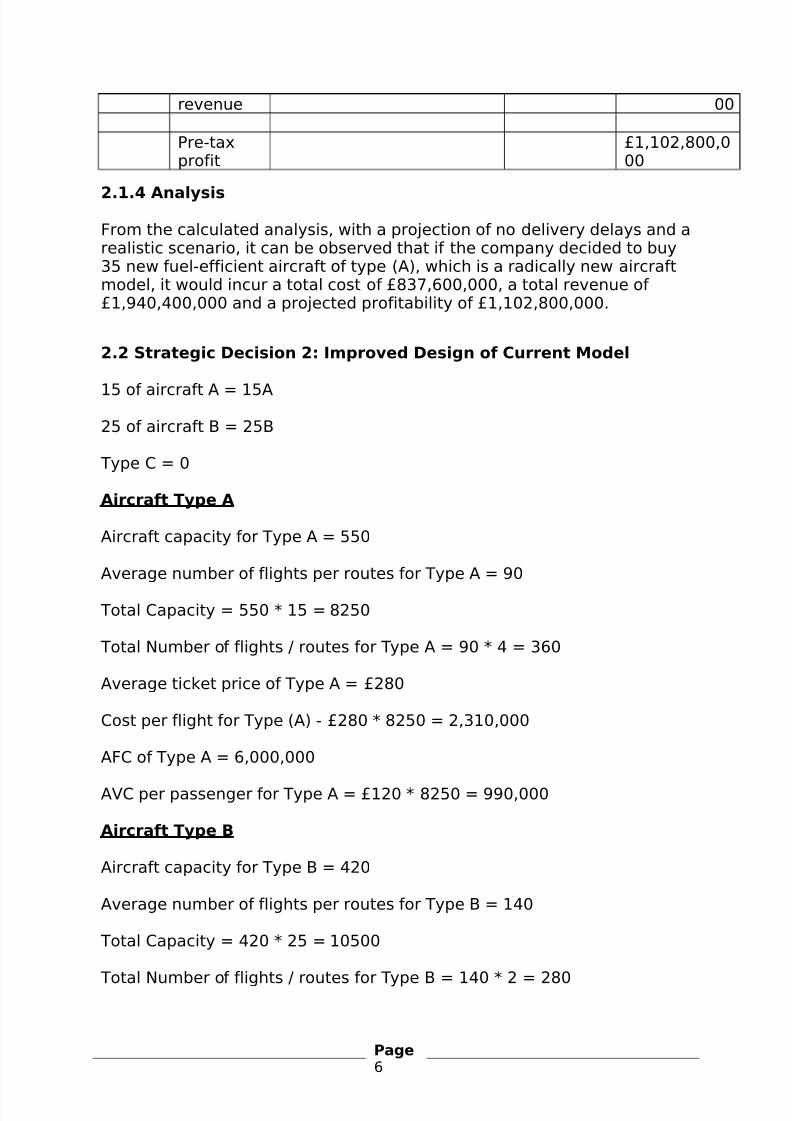
2.1.4 Analysis
From the calculated analysis, with a projection of no delivery delays and arealistic scenario, it can be observed that if the company decided to buy35 new fuel-efficient aircraft of type (A), which is a radically new aircraftmodel, it would incur a total cost of £837,600,000, a total revenue of £1,940,400,000 and a projected profitability of £1,102,800,000.
2.2 Strategic Decision 2: Improved Design of Current Model
15 of aircraft A = 15A
25 of aircraft B = 25B
Type C = 0
Aircraft Type A
Aircraft capacity for Type A = 550
Average number of flights per routes for Type A = 90
Total Capacity = 550 * 15 = 8250
Total Number of flights / routes for Type A = 90 * 4 = 360
Average ticket price of Type A = £280
Cost per flight for Type (A) - £280 * 8250 = 2,310,000
AFC of Type A = 6,000,000
AVC per passenger for Type A = £120 * 8250 = 990,000
Aircraft Type B
Aircraft capacity for Type B = 420
Average number of flights per routes for Type B = 140
Total Capacity = 420 * 25 = 10500
Total Number of flights / routes for Type B = 140 * 2 = 280
Page6
7/29/2019 AIRLINE MANAGEMENT SYSTEM
http://slidepdf.com/reader/full/airline-management-system 7/16
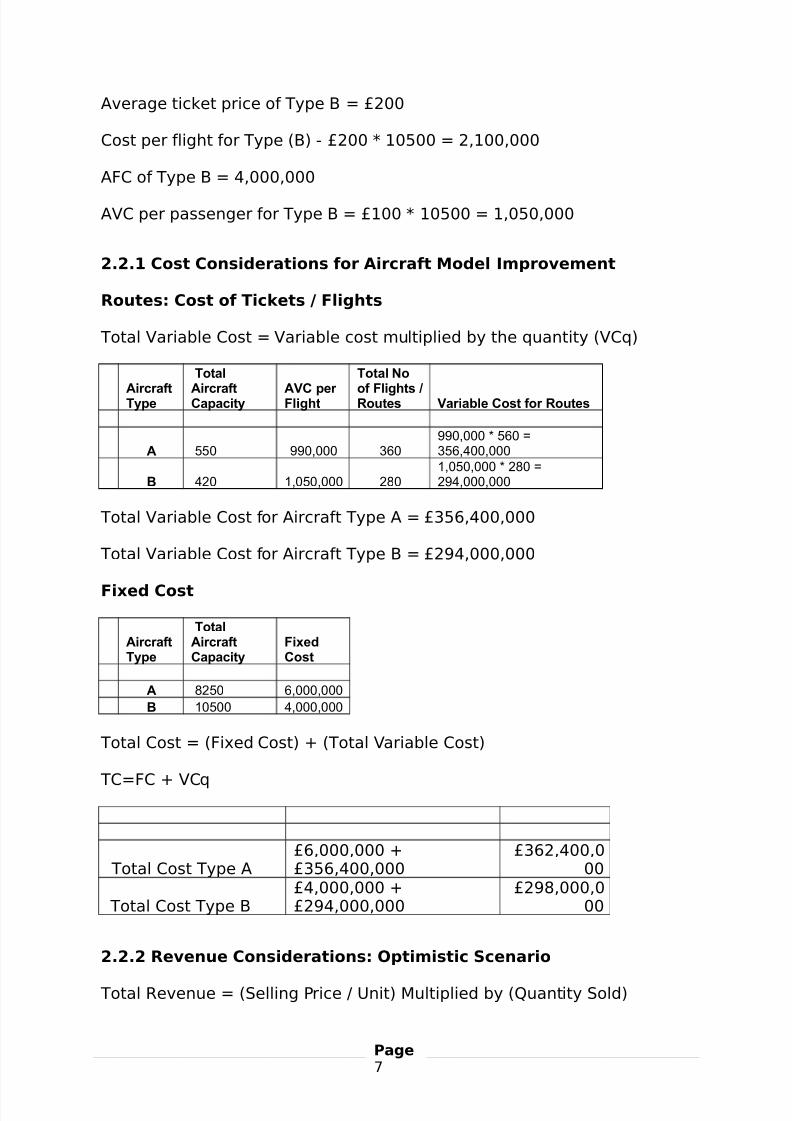
Average ticket price of Type B = £200
Cost per flight for Type (B) - £200 * 10500 = 2,100,000
AFC of Type B = 4,000,000
AVC per passenger for Type B = £100 * 10500 = 1,050,000
2.2.1 Cost Considerations for Aircraft Model Improvement
Routes: Cost of Tickets / Flights
Total Variable Cost = Variable cost multiplied by the quantity (VCq)
AircraftType
Total
AircraftCapacity
AVC per Flight
Total No
of Flights /Routes Variable Cost for Routes
A 550 990,000 360
990,000 * 560 =
356,400,000
B 420 1,050,000 280
1,050,000 * 280 =
294,000,000
Total Variable Cost for Aircraft Type A = £356,400,000
Total Variable Cost for Aircraft Type B = £294,000,000
Fixed Cost
AircraftType
TotalAircraftCapacity
FixedCost
A 8250 6,000,000
B 10500 4,000,000
Total Cost = (Fixed Cost) + (Total Variable Cost)
TC=FC + VCq
Total Cost Type A£6,000,000 +£356,400,000
£362,400,000
Total Cost Type B£4,000,000 +£294,000,000
£298,000,000
2.2.2 Revenue Considerations: Optimistic Scenario
Total Revenue = (Selling Price / Unit) Multiplied by (Quantity Sold)
Page7
7/29/2019 AIRLINE MANAGEMENT SYSTEM
http://slidepdf.com/reader/full/airline-management-system 8/16
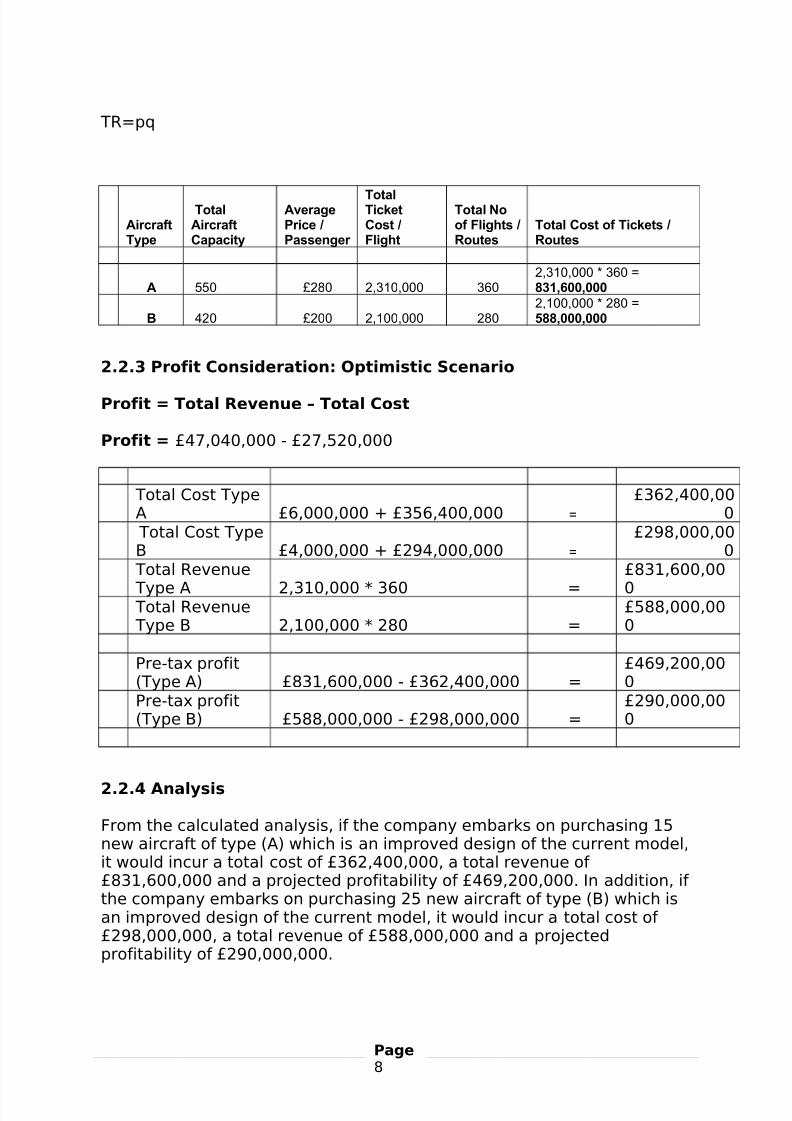
TR=pq
AircraftType
TotalAircraftCapacity
AveragePrice /Passenger
TotalTicketCost /Flight
Total Noof Flights /Routes
Total Cost of Tickets /Routes
A 550 £280 2,310,000 360
2,310,000 * 360 =
831,600,000
B 420 £200 2,100,000 280
2,100,000 * 280 =
588,000,000
2.2.3 Profit Consideration: Optimistic Scenario
Profit = Total Revenue – Total Cost
Profit = £47,040,000 - £27,520,000
Total Cost TypeA £6,000,000 + £356,400,000 =
£362,400,000
Total Cost TypeB £4,000,000 + £294,000,000 =
£298,000,000
Total Revenue
Type A 2,310,000 * 360 =
£831,600,00
0 Total Revenue Type B 2,100,000 * 280 =
£588,000,000
Pre-tax profit(Type A) £831,600,000 - £362,400,000 =
£469,200,000
Pre-tax profit(Type B) £588,000,000 - £298,000,000 =
£290,000,000
2.2.4 Analysis
From the calculated analysis, if the company embarks on purchasing 15new aircraft of type (A) which is an improved design of the current model,it would incur a total cost of £362,400,000, a total revenue of £831,600,000 and a projected profitability of £469,200,000. In addition, if the company embarks on purchasing 25 new aircraft of type (B) which isan improved design of the current model, it would incur a total cost of £298,000,000, a total revenue of £588,000,000 and a projectedprofitability of £290,000,000.
Page8
7/29/2019 AIRLINE MANAGEMENT SYSTEM
http://slidepdf.com/reader/full/airline-management-system 9/16
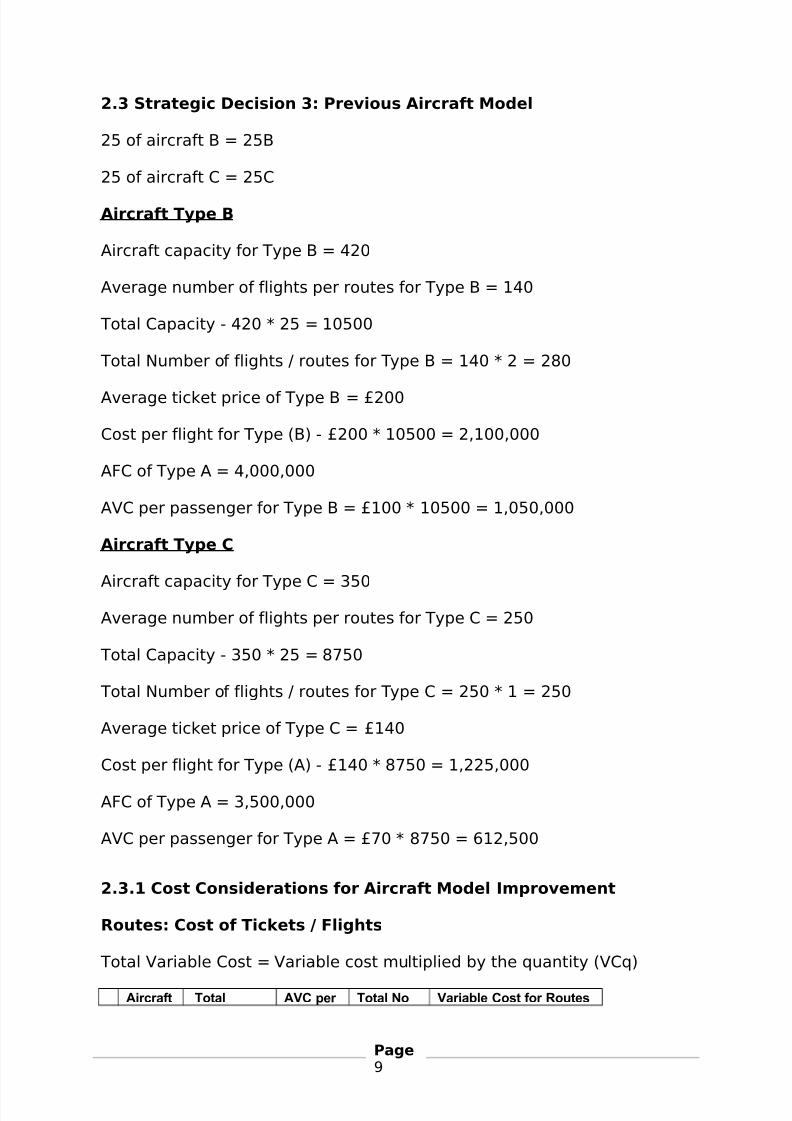
2.3 Strategic Decision 3: Previous Aircraft Model
25 of aircraft B = 25B
25 of aircraft C = 25C
Aircraft Type B
Aircraft capacity for Type B = 420
Average number of flights per routes for Type B = 140
Total Capacity - 420 * 25 = 10500
Total Number of flights / routes for Type B = 140 * 2 = 280
Average ticket price of Type B = £200
Cost per flight for Type (B) - £200 * 10500 = 2,100,000
AFC of Type A = 4,000,000
AVC per passenger for Type B = £100 * 10500 = 1,050,000
Aircraft Type C
Aircraft capacity for Type C = 350
Average number of flights per routes for Type C = 250
Total Capacity - 350 * 25 = 8750
Total Number of flights / routes for Type C = 250 * 1 = 250
Average ticket price of Type C = £140
Cost per flight for Type (A) - £140 * 8750 = 1,225,000
AFC of Type A = 3,500,000
AVC per passenger for Type A = £70 * 8750 = 612,500
2.3.1 Cost Considerations for Aircraft Model Improvement
Routes: Cost of Tickets / Flights
Total Variable Cost = Variable cost multiplied by the quantity (VCq)
Aircraft Total AVC per Total No Variable Cost for Routes
Page9
7/29/2019 AIRLINE MANAGEMENT SYSTEM
http://slidepdf.com/reader/full/airline-management-system 10/16
TypeAircraftCapacity Flight
of Flights /Routes
B 420 1,050,000 280
1,050,000 * 280 =
294,000,000
C 350 612,500 250
612,500 * 250 =
153,125,000
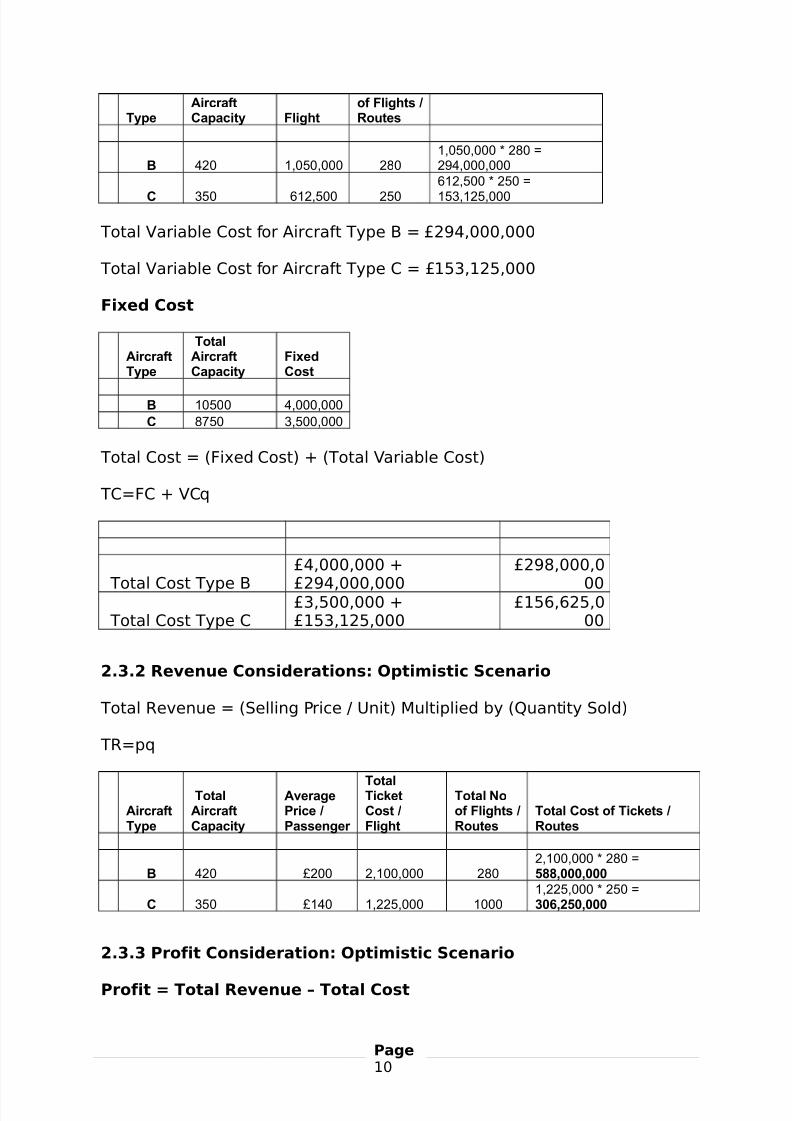
Total Variable Cost for Aircraft Type B = £294,000,000
Total Variable Cost for Aircraft Type C = £153,125,000
Fixed Cost
AircraftType
TotalAircraftCapacity
FixedCost
B 10500 4,000,000
C 8750 3,500,000
Total Cost = (Fixed Cost) + (Total Variable Cost)
TC=FC + VCq
Total Cost Type B
£4,000,000 +
£294,000,000
£298,000,0
00
Total Cost Type C£3,500,000 +£153,125,000
£156,625,000
2.3.2 Revenue Considerations: Optimistic Scenario
Total Revenue = (Selling Price / Unit) Multiplied by (Quantity Sold)
TR=pq
AircraftType
TotalAircraftCapacity
AveragePrice /Passenger
TotalTicketCost /Flight
Total Noof Flights /Routes
Total Cost of Tickets /Routes
B 420 £200 2,100,000 280
2,100,000 * 280 =
588,000,000
C 350 £140 1,225,000 1000
1,225,000 * 250 =
306,250,000
2.3.3 Profit Consideration: Optimistic Scenario
Profit = Total Revenue – Total Cost
Page10
7/29/2019 AIRLINE MANAGEMENT SYSTEM
http://slidepdf.com/reader/full/airline-management-system 11/16
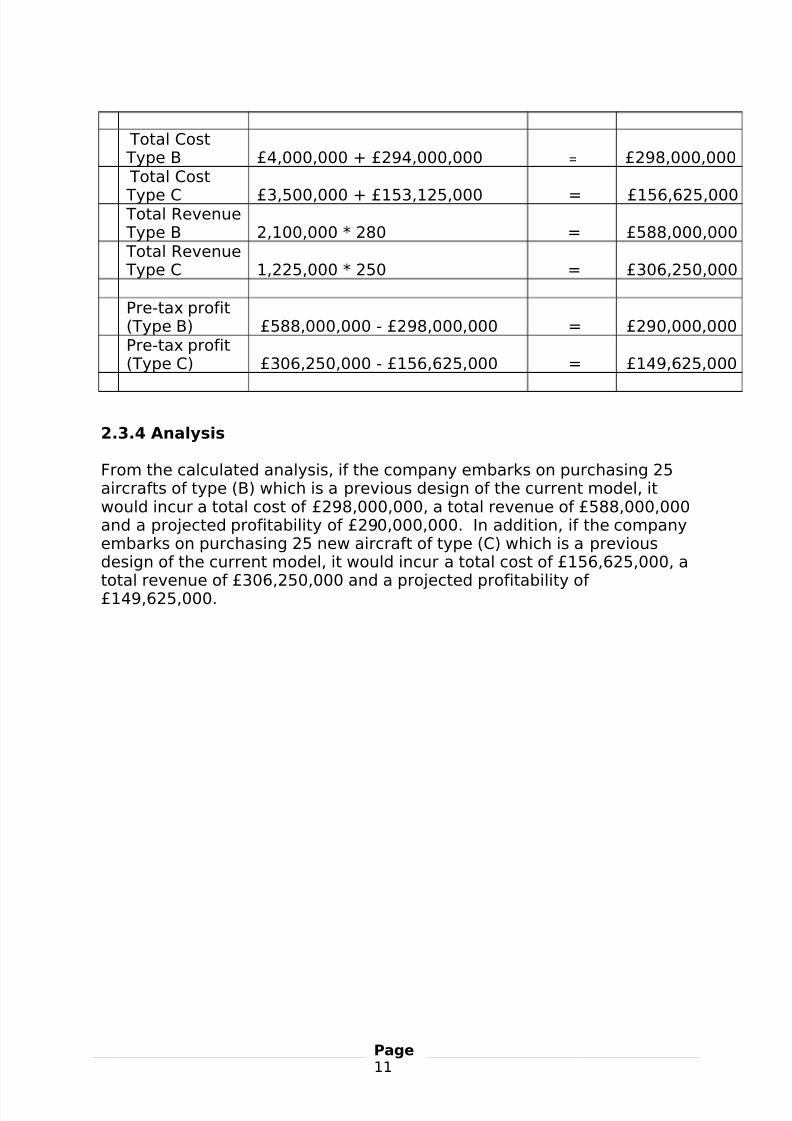
Total Cost Type B £4,000,000 + £294,000,000 = £298,000,000 Total Cost
Type C £3,500,000 + £153,125,000 = £156,625,000
Total Revenue Type B 2,100,000 * 280 = £588,000,000 Total Revenue Type C 1,225,000 * 250 = £306,250,000
Pre-tax profit(Type B) £588,000,000 - £298,000,000 = £290,000,000
Pre-tax profit(Type C) £306,250,000 - £156,625,000 = £149,625,000
2.3.4 Analysis
From the calculated analysis, if the company embarks on purchasing 25aircrafts of type (B) which is a previous design of the current model, itwould incur a total cost of £298,000,000, a total revenue of £588,000,000and a projected profitability of £290,000,000. In addition, if the companyembarks on purchasing 25 new aircraft of type (C) which is a previousdesign of the current model, it would incur a total cost of £156,625,000, a
total revenue of £306,250,000 and a projected profitability of £149,625,000.
Page11
7/29/2019 AIRLINE MANAGEMENT SYSTEM
http://slidepdf.com/reader/full/airline-management-system 12/16
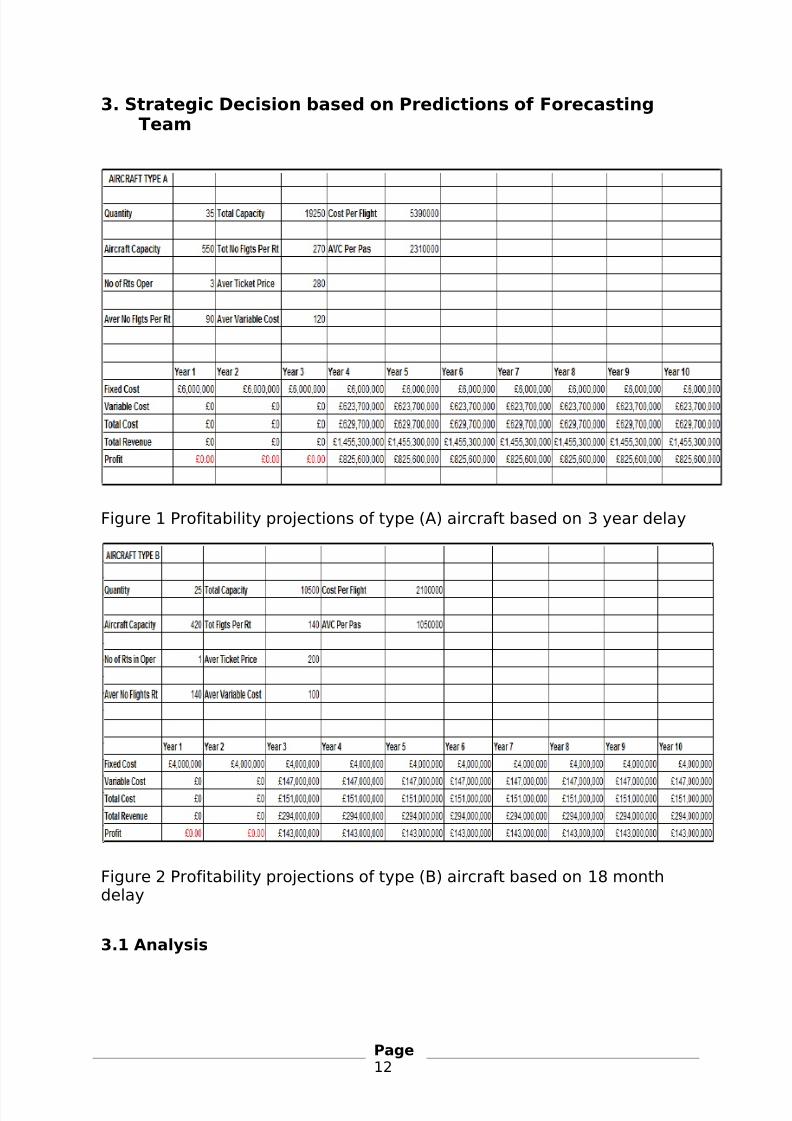
3. Strategic Decision based on Predictions of ForecastingTeam
Figure 1 Profitability projections of type (A) aircraft based on 3 year delay
Figure 2 Profitability projections of type (B) aircraft based on 18 monthdelay
3.1 Analysis
Page12
7/29/2019 AIRLINE MANAGEMENT SYSTEM
http://slidepdf.com/reader/full/airline-management-system 13/16
Based on delivery delays of 3 years for aircraft type (A) and 18 months foraircraft type (B) as shown in figure 1 and 2 above, the company would runat a loss of -£18,000,000 fixed cost for the first 3 years if it decides to go ahead withthe first strategy and would only break even in year 3, while the company
would run at a loss of -£8,000,000 fixed cost for the first two years if itdecides to go ahead with the second strategy and would only break evenat the end of year 2.
3.2 Final Recommendations
Based on the sample evidence, I would therefore recommend the thirdstrategy, as with the third strategy, there are no delivery delays and thecompany would be better positioned overcome the disruptions, risks,teething issues which are synonymous with the introduction major new
models of aircraft. In addition, based on the fact that a ten yearprofitability projection is desired starting from 2007, profitability of £290,000,000 for aircraft type (B) and £149,625,000 for aircrafts type (C)is most suitable.
4. Assumptions & Methodology: Traditional Cost System
4.1 Critique: Traditional Based Cost System
The traditional cost systems assign costs directly to the products orservices, so there is no information about the activities. The traditionalcosting system utilizes different cost structures, (e.g. fixed cost) todistribute the indirect costs to all products and services. This method of allocating indirect costs commonly results in erroneous cost data. Oftenproducts which have high volume (and high labour cost) are over costed,and likewise, the cost of lower volume products are often understated,and many of the indirect costs of these products are overlooked.Consequently, traditional cost systems can actually hide problems and failto identify improvement opportunities.
4.2 Alternative: Activity Based Costing Approaches
In contrast, ABC provides more accurate cost information by assigningcosts to the activities that generate the costs, and then assigning thecosts from the activities to the products or services, this is unlike thetraditional-based costing where all overhead costs including unused, oridle capacity costs are applied to the products. By moving away fromtraditional cost allocation methods and using improved ABC methods of
tracing and assignment, ABC provides managers with a clearer picture of cost of processes and the profitability of customers and products. Unlike
Page13
7/29/2019 AIRLINE MANAGEMENT SYSTEM
http://slidepdf.com/reader/full/airline-management-system 14/16
traditional cost systems, ABC assumes that activities cause cost, notproducts or services (i.e., products and services merely create demand foractivities). By knowing what activities cost, organizations can identifyactivities that have the greatest potential for cost reduction. This moreaccurate cost information allows organizations to make improvements
such as eliminating waste from overhead activities that are inefficient ornonessential.
4.3 ABC: Overcoming Limitations & Improving Decision Making
4.3.1 Price Allocation
Activity Based Costing is a management tool to assist decisions. It can beused as a basis to allocate fixed costs or indirect costs across products or
services with a view to justifying prices. This stems from the existence of costs in an organisation which are not directly related to Products. Thesemay be service departments (finance, personnel etc.) or fixed overheads(factory rent, office heating etc.). If unchecked, these costs can build upsizeable portions of the total revenue and unless management takes careto control them they can outweigh the Contribution from products sold,thereby causing a loss.
4.3.2 Revenue Generation vs Resource Consumption
ABC can be a guide to management action that can translate directly intohigher profits reveals the links between performing particular activitiesand the demands those activities make on the organization’s resources, itcan give managers a clear picture of how products, brands, customers,facilities, regions, or distribution channels both generate revenues andconsume resources. The profitability picture that emerges from the ABCanalysis helps managers focus their attention and energy on improvingactivities that will have the biggest impact on the bottom line.
4.3.3 Different Views
ABC analysis enables managers to have varied views into the businessmany different ways, either by product or group of similar products, byindividual customer or client group, or by distribution channel, thus givingthem a close-up view of whatever aspect of the business they areconsidering. ABC analysis also illuminates exactly what activities areassociated with that part of the business and how those activities arelinked to the generation of revenues and the consumption of resources.By highlighting those relationships, ABC helps managers understandprecisely where to take actions that will drive profits.
Page14
7/29/2019 AIRLINE MANAGEMENT SYSTEM
http://slidepdf.com/reader/full/airline-management-system 15/16
5. Strategy Option: Short Haul Flights
6. Bibliography & Reference
Anderson, S. 1995. A framework for assessing cost management systemchanges: The case of activity based costing implementation at GeneralMotors, 1986-1993. Journal of Management Accounting Research (7): 1-51.
Anthony, R. N. 2003. Management accounting: A personal history. Journalof Management Accounting Research (15): 249-253.
Balakishnan, R. and K. Sivaramakrishnan. 2002. A critical overview of theuse of full-cost data for planning and pricing. Journal of Management Accounting Research (14): 3-31.
Banker, R. D. and G. Potter. 1993. Economic implications of single costdriver systems. Journal of Management Accounting Research (5): 15-32.
Banker, R. D. and S. C. Hansen. 2002. The adequacy of full-cost-basedpricing heuristics. Journal of Management Accounting Research (14): 33-58.
Birnberg, J. G. 2003. Introductory note to "Management accounting: Apersonal history". Journal of Management Accounting Research (15): 247.
Covaleski, M. A, J. H. Evans III, J. L. Luft and M. D. Shields. 2003. Budgetingresearch: Three theoretical perspectives and criteria for selectiveintegration. Journal of Management Accounting Research (15): 3-49.
Dearman, D. T. and M. D. Shields. 2001. Cost knowledge and cost-based judgment performance. Journal of Management Accounting Research (13):1-18.
Dhavale, D. G. 2007. Product costing for decision making in certainvariable-proportion technologies. Journal of Management Accounting
Research (19): 51-70.
Foster, G. and D. W. Swenson. 1997 Measuring the success of activity-based cost management and its determinants. Journal of Management Accounting Research (9): 109-141.
Hilton, Ronal W. (1994) Managerial Accounting, Second Edition, McGraw-Hill, Inc., New York.
Horngren, C. T. 2004. Management accounting: Some comments. Journalof Management Accounting Research (16): 207-211.
Page15
7/29/2019 AIRLINE MANAGEMENT SYSTEM
http://slidepdf.com/reader/full/airline-management-system 16/16
Leitch, R. A., P. R. Philipoom and T. D. Fry. 2005. Opportunity costingdecision heuristics for product acceptance decisions. Journal of Management Accounting Research (17): 95-117.
Page
Recommended