AIRBUS Private Wealth Roadshow
London
September 18th, 2017
2 SAFE HARBOUR STATEMENT
This presentation includes forward-looking statements. Words such as “anticipates”, “believes”, “estimates”, “expects”, “intends”, “plans”,
“projects”, “may” and similar expressions are used to identify these forward-looking statements. Examples of forward-looking statements include
statements made about strategy, ramp-up and delivery schedules, introduction of new products and services and market expectations, as well as
statements regarding future performance and outlook.
By their nature, forward-looking statements involve risk and uncertainty because they relate to future events and circumstances and there are many
factors that could cause actual results and developments to differ materially from those expressed or implied by these forward-looking statements.
THESE FACTORS INCLUDE BUT ARE NOT LIMITED TO:
Changes in general economic, political or market conditions, including the cyclical nature of some of Airbus’ businesses;
Significant disruptions in air travel (including as a result of terrorist attacks);
Currency exchange rate fluctuations, in particular between the Euro and the U.S. dollar;
The successful execution of internal performance plans, including cost reduction and productivity efforts;
Product performance risks, as well as programme development and management risks;
Customer, supplier and subcontractor performance or contract negotiations, including financing issues;
Competition and consolidation in the aerospace and defence industry;
Significant collective bargaining labour disputes;
The outcome of political and legal processes including the availability of government financing for certain programmes and the size of defence and space
procurement budgets;
Research and development costs in connection with new products;
Legal, financial and governmental risks related to international transactions;
Legal and investigatory proceedings and other economic, political and technological risks and uncertainties.
As a result, Airbus’ actual results may differ materially from the plans, goals and expectations set forth in such forward-looking statements.
For a discussion of factors that could cause future results to differ from such forward-looking statements, see the Airbus “Registration Document”
dated 4 April 2017, including the Risk Factors section.
Any forward-looking statement contained in this presentation speaks as of the date of this presentation. Airbus undertakes no obligation to publicly
revise or update any forward-looking statements in light of new information, future events or otherwise.
DISCLAIMER
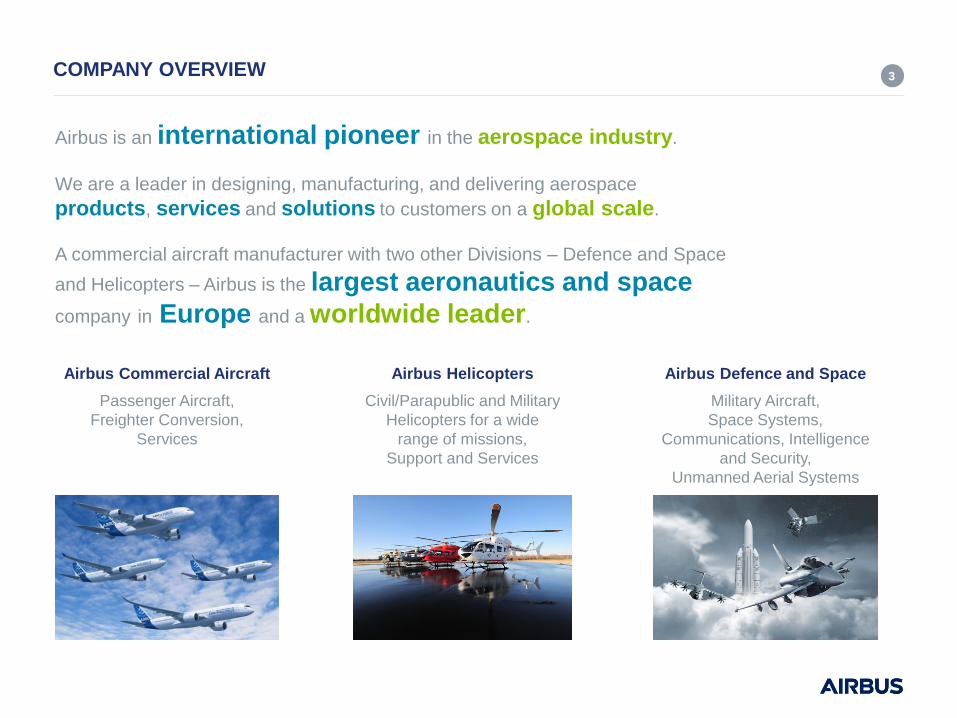
COMPANY OVERVIEW 3
Airbus is an international pioneer in the aerospace industry.
We are a leader in designing, manufacturing, and delivering aerospace
products, services and solutions to customers on a global scale.
A commercial aircraft manufacturer with two other Divisions – Defence and Space
and Helicopters – Airbus is the largest aeronautics and space
company in Europe and a worldwide leader.
Airbus Commercial Aircraft
Passenger Aircraft,
Freighter Conversion,
Services
Airbus Helicopters
Civil/Parapublic and Military
Helicopters for a wide
range of missions,
Support and Services
Airbus Defence and Space
Military Aircraft,
Space Systems,
Communications, Intelligence
and Security,
Unmanned Aerial Systems
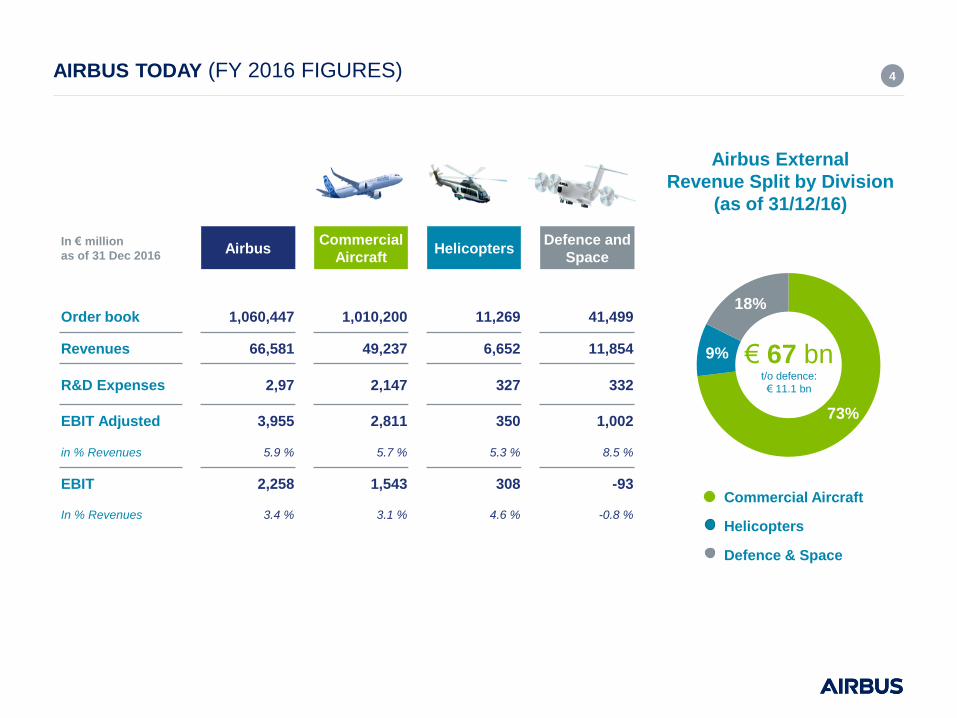
AIRBUS TODAY (FY 2016 FIGURES) 4
73%
9%
18%
€ 67 bn t/o defence:
€ 11.1 bn
Airbus External
Revenue Split by Division
(as of 31/12/16)
Commercial Aircraft
Helicopters
Defence & Space
In € million
as of 31 Dec 2016 Airbus
Commercial
Aircraft Helicopters Defence and
Space
Order book 1,060,447 1,010,200 11,269 41,499
Revenues 66,581 49,237 6,652 11,854
R&D Expenses 2,97 2,147 327 332
EBIT Adjusted 3,955 2,811 350 1,002
in % Revenues 5.9 % 5.7 % 5.3 % 8.5 %
EBIT 2,258 1,543 308 -93
In % Revenues 3.4 % 3.1 % 4.6 % -0.8 %
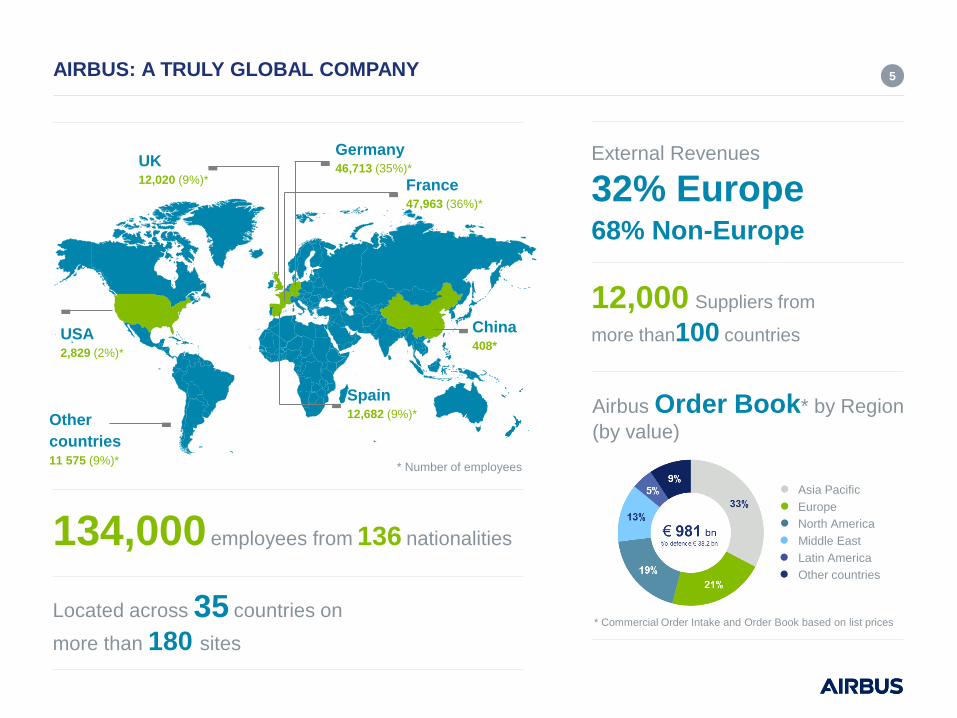
AIRBUS: A TRULY GLOBAL COMPANY 5
China 408*
Spain 12,682 (9%)*
USA 2,829 (2%)*
UK 12,020 (9%)*
Germany 46,713 (35%)*
France 47,963 (36%)*
134,000 employees from 136 nationalities
Located across 35 countries on
more than 180 sites
External Revenues
32% Europe 68% Non-Europe
* Number of employees
Other
countries 11 575 (9%)*
12,000 Suppliers from
more than100 countries
● Asia Pacific
● Europe
● North America
● Middle East
● Latin America
● Other countries
Airbus Order Book* by Region
(by value)
* Commercial Order Intake and Order Book based on list prices
OUR STRATEGY 6
Position as a leader
• Strengthen market
position and profitability,
while remaining a leader in
Commercial Aeronautics.
• Preserve leading position in
European Defence, Space and
Government markets.
Utilise strategic levers
• Exploit incremental
innovation potential within
product programmes, while
pioneering and fostering
disruptions in our industry.
• Exploit digitalisation to enhance
our products, services and
operations, as well as pursue new
business models.
• Adapt to a more global world and
move closer to international
markets.
• Focus services on and around
platforms.
• Strengthen value chain
position.
Deliver the results
accordingly
• Focus on profitability,
value creation, and
market position – no
need to chase growth at any
cost; actively manage
portfolio.
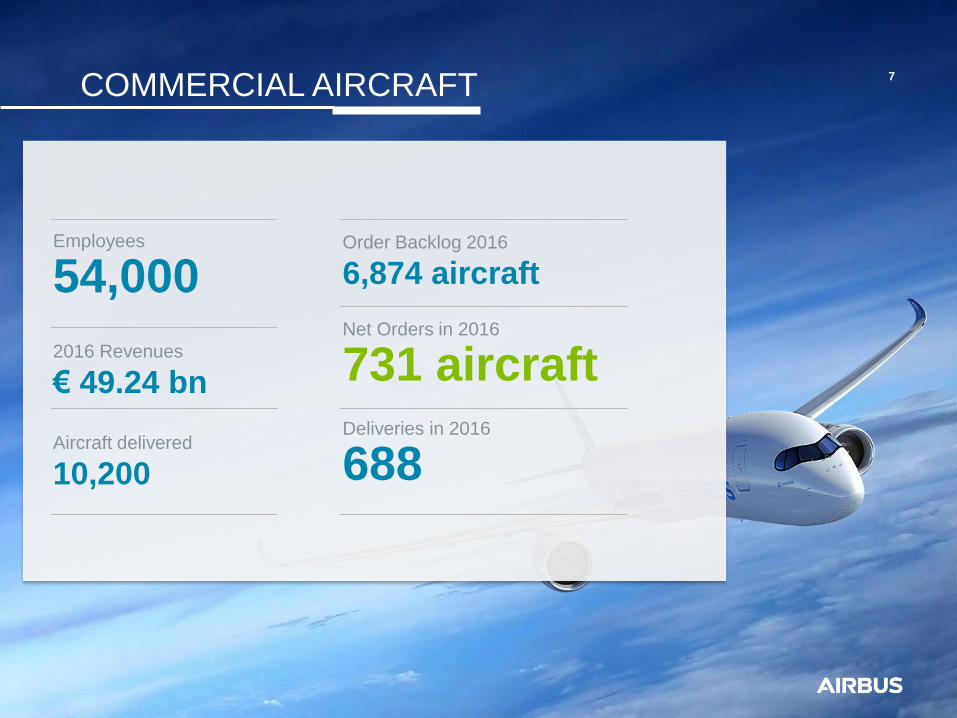
7
Employees
54,000 Order Backlog 2016
6,874 aircraft
2016 Revenues
€ 49.24 bn
Aircraft delivered
10,200
Net Orders in 2016
731 aircraft Deliveries in 2016
688
COMMERCIAL AIRCRAFT
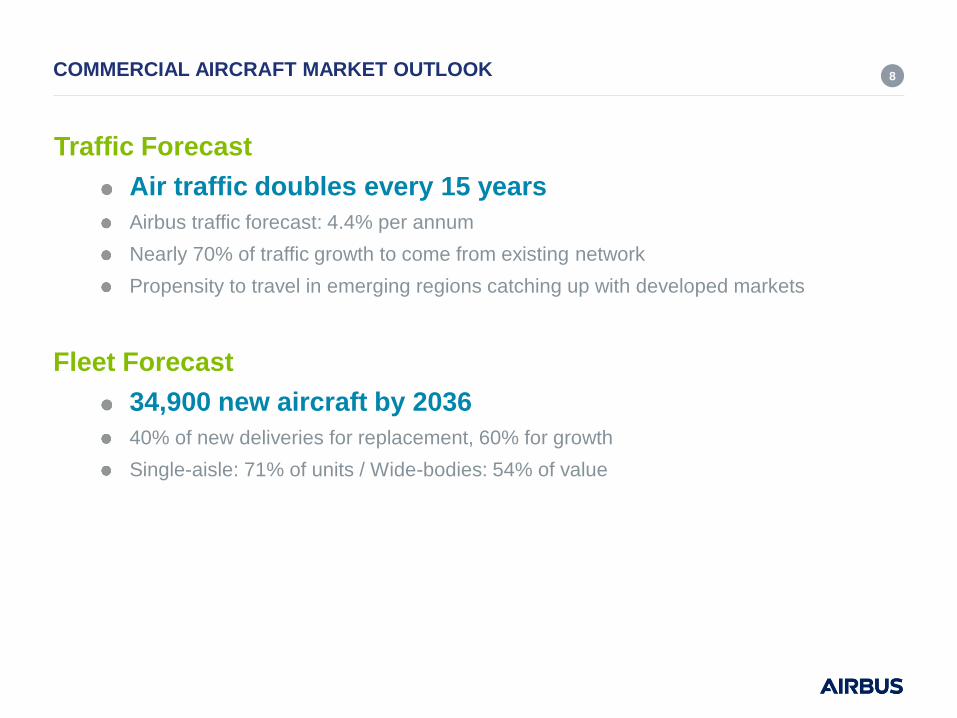
COMMERCIAL AIRCRAFT MARKET OUTLOOK
Traffic Forecast
Air traffic doubles every 15 years
Airbus traffic forecast: 4.4% per annum
Nearly 70% of traffic growth to come from existing network
Propensity to travel in emerging regions catching up with developed markets
Fleet Forecast
34,900 new aircraft by 2036
40% of new deliveries for replacement, 60% for growth
Single-aisle: 71% of units / Wide-bodies: 54% of value
8
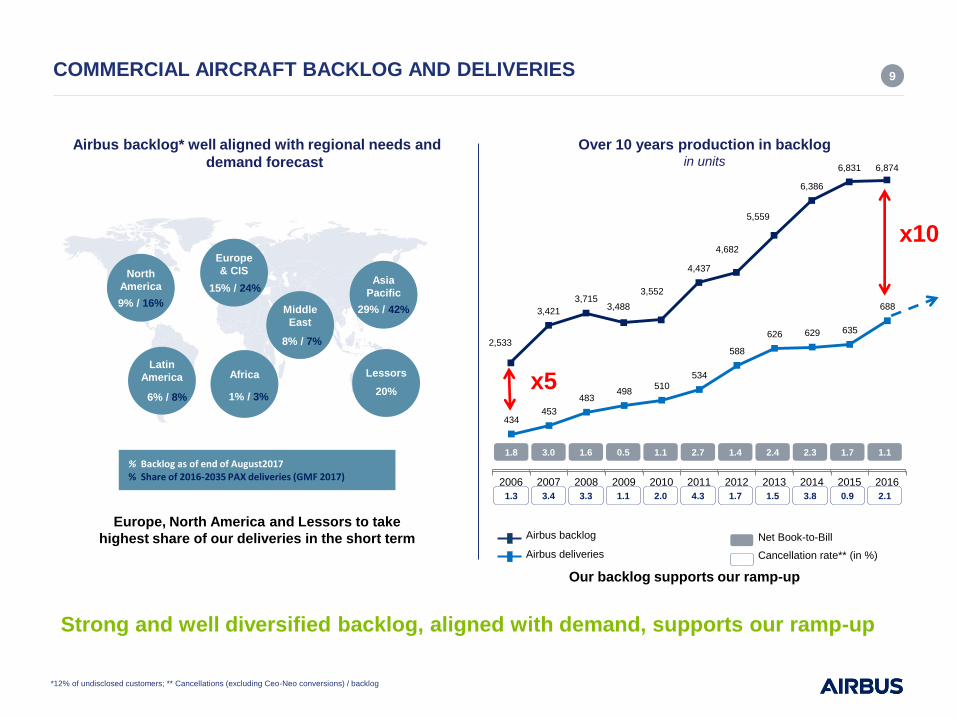
9 COMMERCIAL AIRCRAFT BACKLOG AND DELIVERIES
Strong and well diversified backlog, aligned with demand, supports our ramp-up
Airbus backlog* well aligned with regional needs and
demand forecast
Over 10 years production in backlog in units
% Backlog as of end of August2017 % Share of 2016-2035 PAX deliveries (GMF 2017)
Europe, North America and Lessors to take
highest share of our deliveries in the short term
Our backlog supports our ramp-up
434 453
483 498
510 534
588
626 629 635
688
2006 2007 2008 2009 2010 2011 2012 2013 2014 2015 2016
2,533
3,421
3,715 3,488
3,552
4,437
4,682
5,559
6,386
6,831 6,874
2006 2007 2008 2009 2010 2011 2012 2013 2014 2015 2016
Airbus deliveries
Airbus backlog Net Book-to-Bill
1.8 1.7 3.0 1.6 0.5 1.1 2.7 1.4 2.4 2.3
1.3 0.9 3.4 3.3 1.1 2.0 4.3 1.7 1.5 3.8
Cancellation rate** (in %)
1.1
2.1
*12% of undisclosed customers; ** Cancellations (excluding Ceo-Neo conversions) / backlog
x5
x10
North
America
9% / 16%
Latin
America
6% / 8%
Europe
& CIS
15% / 24%
Middle
East
8% / 7%
Africa
1% / 3%
Lessors
20%
Asia
Pacific
29% / 42%

10 THE MOST COMPREHENSIVE PRODUCT LINE FOR ANY MARKET
A320 Family: 13,251 orders including 5,168 neo
Up to 240 passengers, flying up to 10 hours
A330 Family: 1,688 orders Flying from 30 minutes to over 15 hours
A350XWB: 848 orders Long-range and ultra-long haul routes
A380: 317 orders Capacity to capture traffic growth
Figures as of 31 August 2017
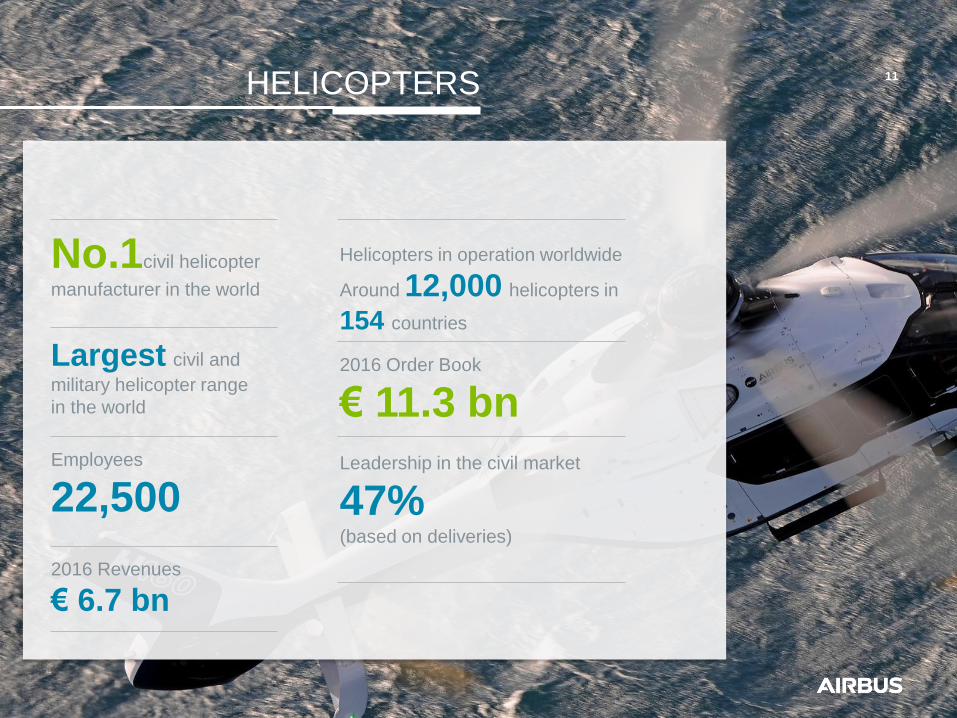
11
No.1civil helicopter
manufacturer in the world
Helicopters in operation worldwide
Around 12,000 helicopters in
154 countries
2016 Revenues
€ 6.7 bn
Employees
22,500
2016 Order Book
€ 11.3 bn Leadership in the civil market
47% (based on deliveries)
Largest civil and
military helicopter range
in the world
HELICOPTERS
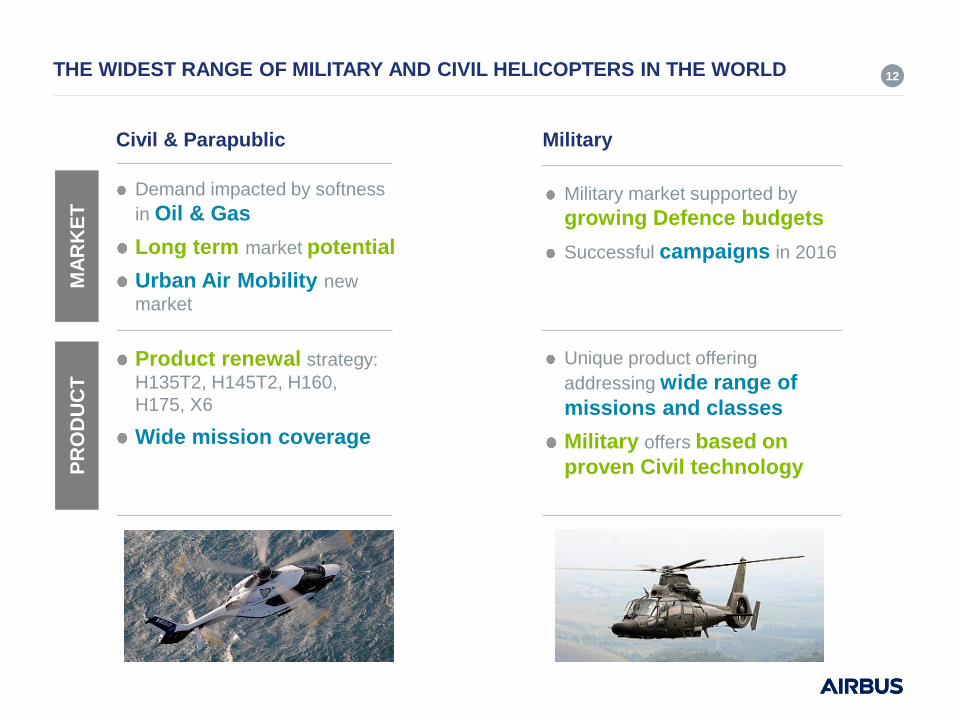
12 THE WIDEST RANGE OF MILITARY AND CIVIL HELICOPTERS IN THE WORLD
Civil & Parapublic
Demand impacted by softness
in Oil & Gas
Long term market potential
Urban Air Mobility new
market
Product renewal strategy:
H135T2, H145T2, H160,
H175, X6
Wide mission coverage
Military market supported by
growing Defence budgets
Successful campaigns in 2016
Unique product offering
addressing wide range of
missions and classes
Military offers based on
proven Civil technology
MA
RK
ET
P
RO
DU
CT
Military
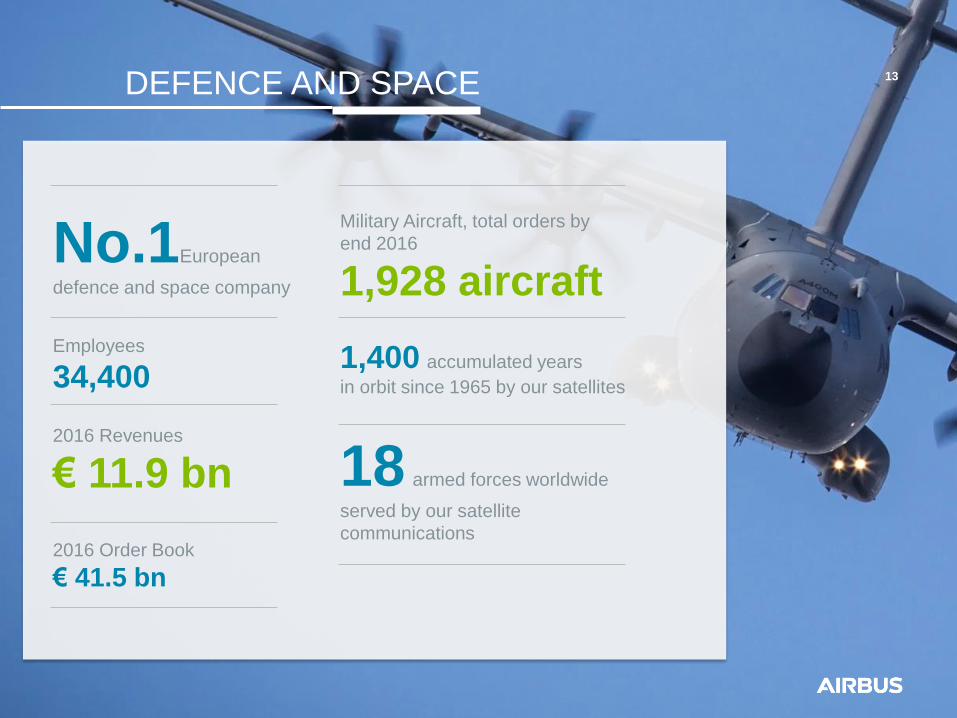
13
Employees
34,400
Military Aircraft, total orders by
end 2016
1,928 aircraft
No.1European
defence and space company
2016 Order Book
€ 41.5 bn
2016 Revenues
€ 11.9 bn
1,400 accumulated years
in orbit since 1965 by our satellites
18 armed forces worldwide
served by our satellite
communications
DEFENCE AND SPACE
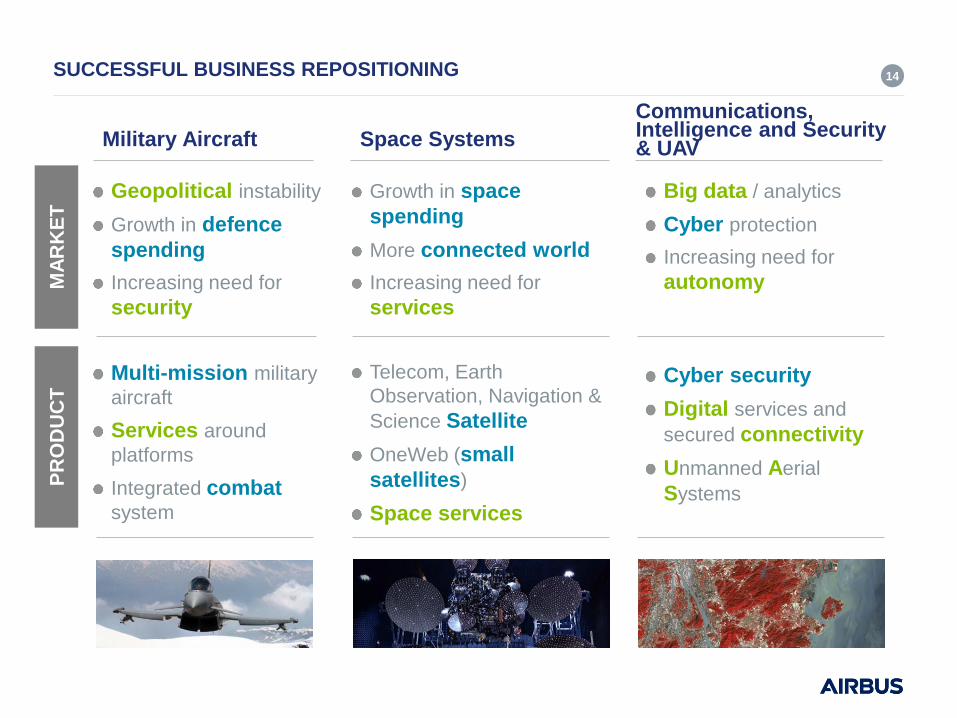
14 SUCCESSFUL BUSINESS REPOSITIONING M
AR
KE
T
PR
OD
UC
T
Military Aircraft Space Systems
Communications, Intelligence and Security & UAV
Big data / analytics
Cyber protection
Increasing need for
autonomy
Cyber security
Digital services and
secured connectivity
Unmanned Aerial
Systems
Geopolitical instability
Growth in defence
spending
Increasing need for
security
Multi-mission military
aircraft
Services around
platforms
Integrated combat system
Growth in space
spending
More connected world
Increasing need for
services
Telecom, Earth
Observation, Navigation &
Science Satellite
OneWeb (small
satellites)
Space services
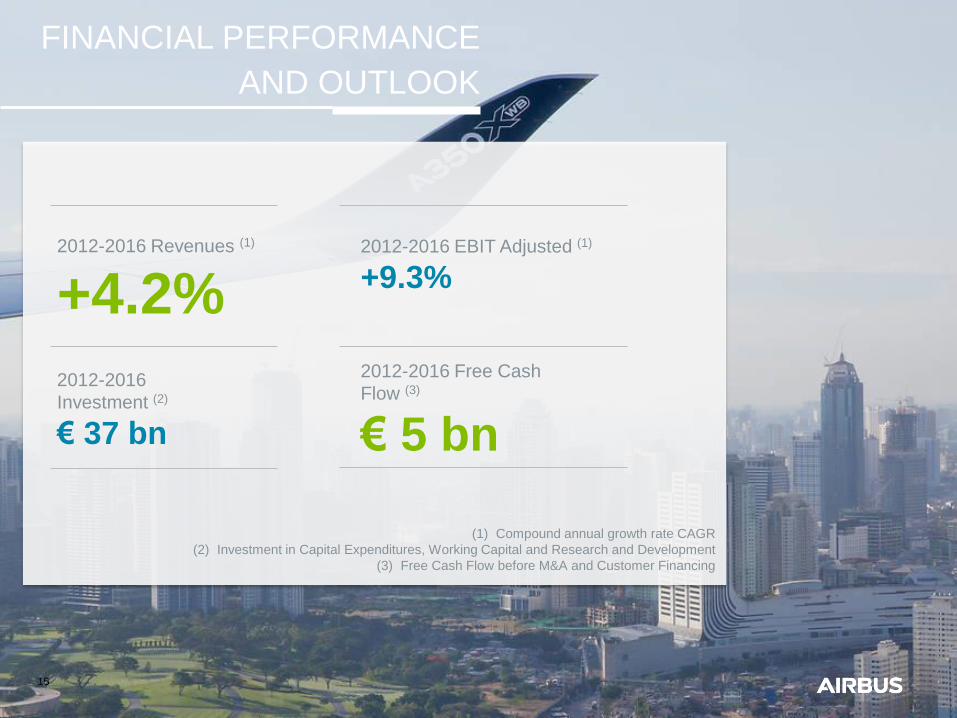
15
2012-2016
Investment (2)
€ 37 bn
2012-2016 Revenues (1)
+4.2% 2012-2016 EBIT Adjusted (1)
+9.3%
2012-2016 Free Cash
Flow (3)
€ 5 bn
(1) Compound annual growth rate CAGR
(2) Investment in Capital Expenditures, Working Capital and Research and Development
(3) Free Cash Flow before M&A and Customer Financing
FINANCIAL PERFORMANCE
AND OUTLOOK
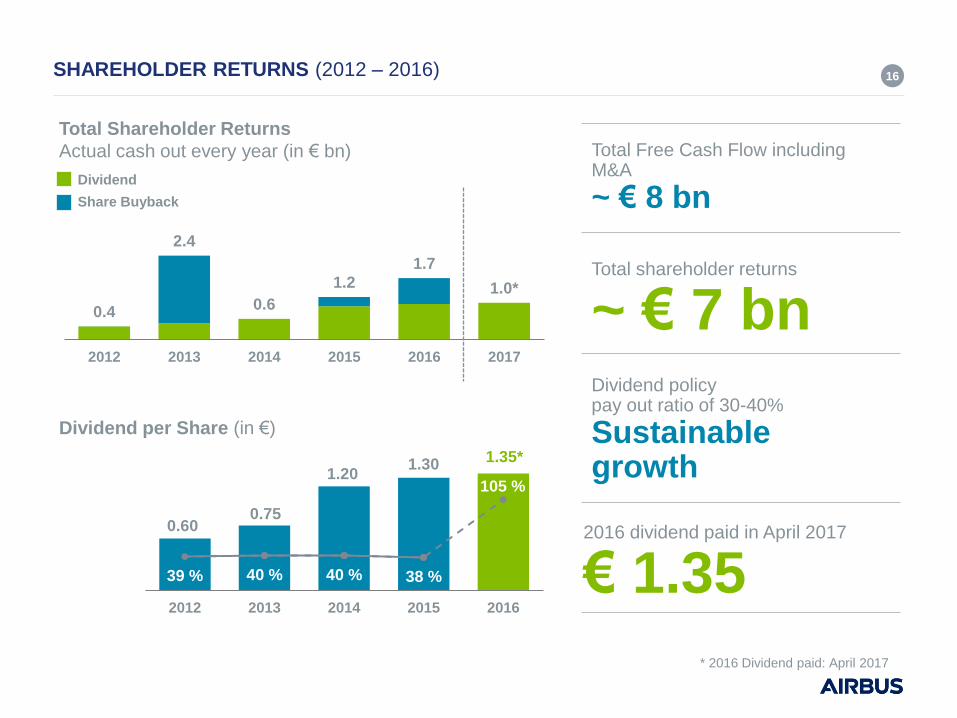
SHAREHOLDER RETURNS (2012 – 2016)
Dividend policy pay out ratio of 30-40%
Sustainable growth
2016 dividend paid in April 2017
€ 1.35
Dividend per Share (in €)
Total Shareholder Returns
Actual cash out every year (in € bn)
* 2016 Dividend paid: April 2017
Total shareholder returns
~ € 7 bn
Total Free Cash Flow including M&A
~ € 8 bn
0.4
2.4
0.6
1.2
1.7
1.0*
2012 2013 2014 2015 2016 2017
Dividend
Share Buyback
0.60 0.75
1.20 1.30 1.35*
39 % 40 % 40 % 38 %
105 %
2012 2013 2014 2015 2016
16
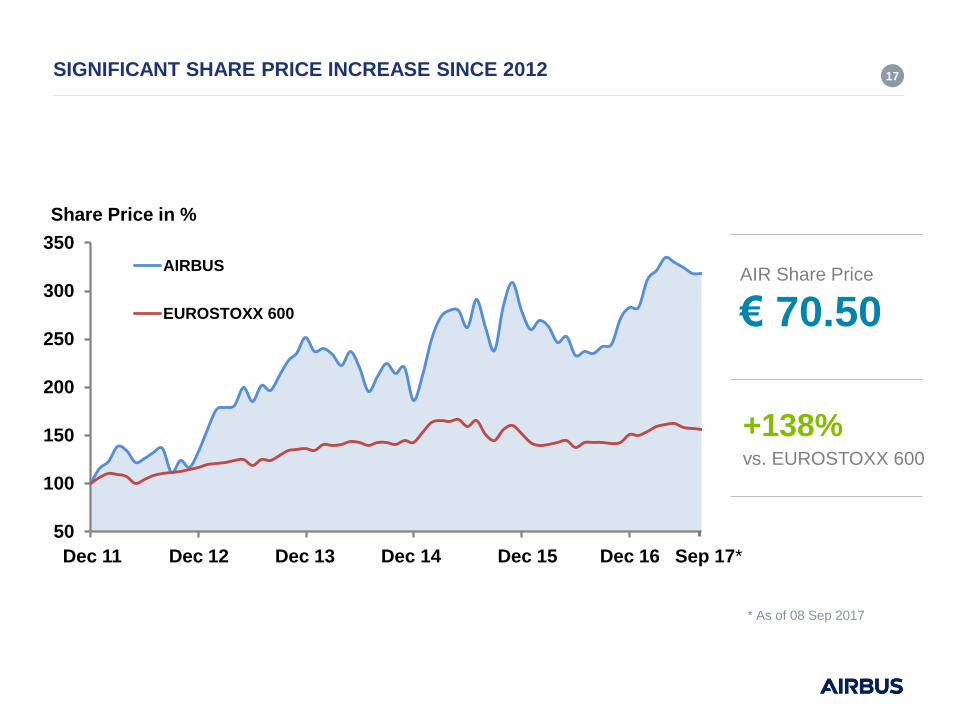
SIGNIFICANT SHARE PRICE INCREASE SINCE 2012
17
AIR Share Price
€ 70.50
+138%
vs. EUROSTOXX 600
50
100
150
200
250
300
350
Dec 2011 Dec 2012 Dec 2013 Dec 2014 Dec 2015 Dec 2016
AIRBUS
EUROSTOXX 600
Share Price in %
Dec 11 Dec 12 Dec 13 Dec 14 Dec 15 Dec 16 Sep 17*
* As of 08 Sep 2017
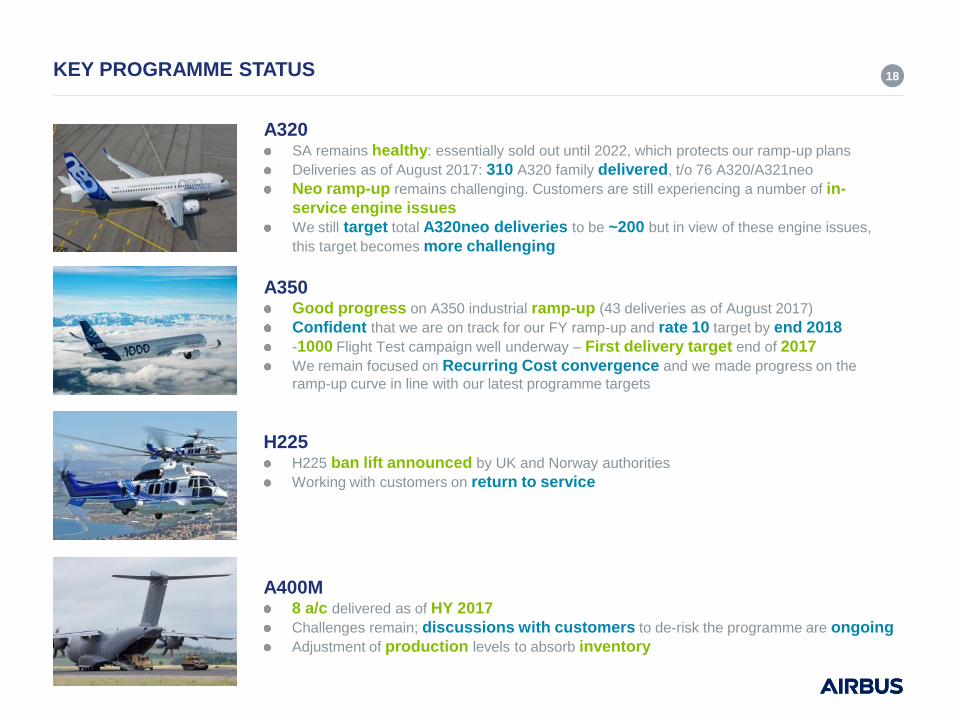
18 KEY PROGRAMME STATUS
A350 Good progress on A350 industrial ramp-up (43 deliveries as of August 2017)
Confident that we are on track for our FY ramp-up and rate 10 target by end 2018
-1000 Flight Test campaign well underway – First delivery target end of 2017
We remain focused on Recurring Cost convergence and we made progress on the
ramp-up curve in line with our latest programme targets
A320 SA remains healthy: essentially sold out until 2022, which protects our ramp-up plans
Deliveries as of August 2017: 310 A320 family delivered, t/o 76 A320/A321neo
Neo ramp-up remains challenging. Customers are still experiencing a number of in-
service engine issues
We still target total A320neo deliveries to be ~200 but in view of these engine issues,
this target becomes more challenging
H225 H225 ban lift announced by UK and Norway authorities
Working with customers on return to service
A400M 8 a/c delivered as of HY 2017
Challenges remain; discussions with customers to de-risk the programme are ongoing
Adjustment of production levels to absorb inventory
OPERATIONAL EXCELLENCE & INNOVATION
Drive performance across our operations, improve competitiveness
and create new business opportunities
Global Supply Chain Performance and Quality
Group-wide approach to supply chain management and quality
Transversal industrial footprint and harmonised quality improvement programmes
Digital Transformation
Improve efficiency and quality of manufacturing operations
Prepare end-to-end Digital operations from design to product support
Innovation Leverage new technologies to prepare the future
Exploring new business areas
19
20 2017 GUIDANCE
As the basis for its 2017 guidance, Airbus expects the world economy and air traffic to grow in
line with prevailing independent forecasts, which assume no major disruptions.
Airbus 2017 earnings and FCF guidance is based on a constant perimeter.
Airbus expects to deliver more than 700 commercial aircraft which depends on engine
manufacturers meeting commitments
Before M&A, Airbus expects mid-single-digit % growth in EBIT Adjusted and EPS Adjusted
compared to 2016
Free Cash Flow is expected to be similar to 2016 before M&A and Customer Financing
The perimeter change in Defence and Space is expected to reduce EBIT Adjusted and Free
Cash Flow before M&A and Customer Financing by around € 150 million and EPS Adjusted
by around 14 cents.
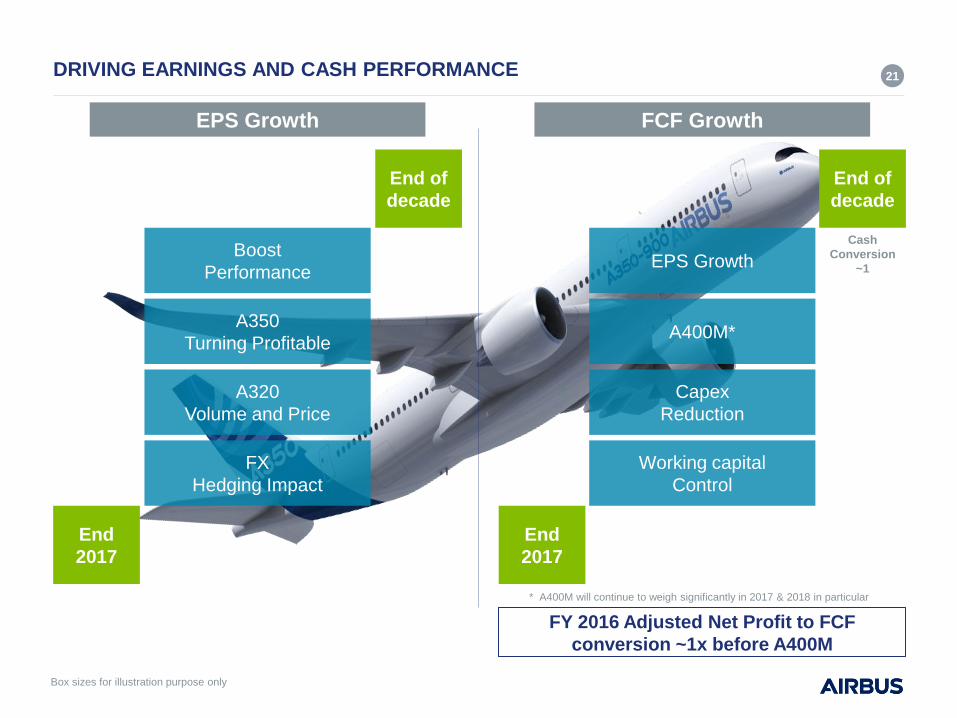
DRIVING EARNINGS AND CASH PERFORMANCE 21
Box sizes for illustration purpose only
Cash
Conversion
~1
FX
Hedging Impact
A320
Volume and Price
A350
Turning Profitable
Boost
Performance
End
2017
End of
decade
* A400M will continue to weigh significantly in 2017 & 2018 in particular
End of
decade
Working capital
Control
Capex
Reduction
A400M*
EPS Growth
End
2017
EPS Growth FCF Growth
FY 2016 Adjusted Net Profit to FCF
conversion ~1x before A400M
22
APPENDIX
H1 2017 Figures
Shareholding Structure
Hedge Policy
Liquidity Position H1 2017
Board of Directors
Executive Committee
Investor Relations & Financial Communication Contacts
23
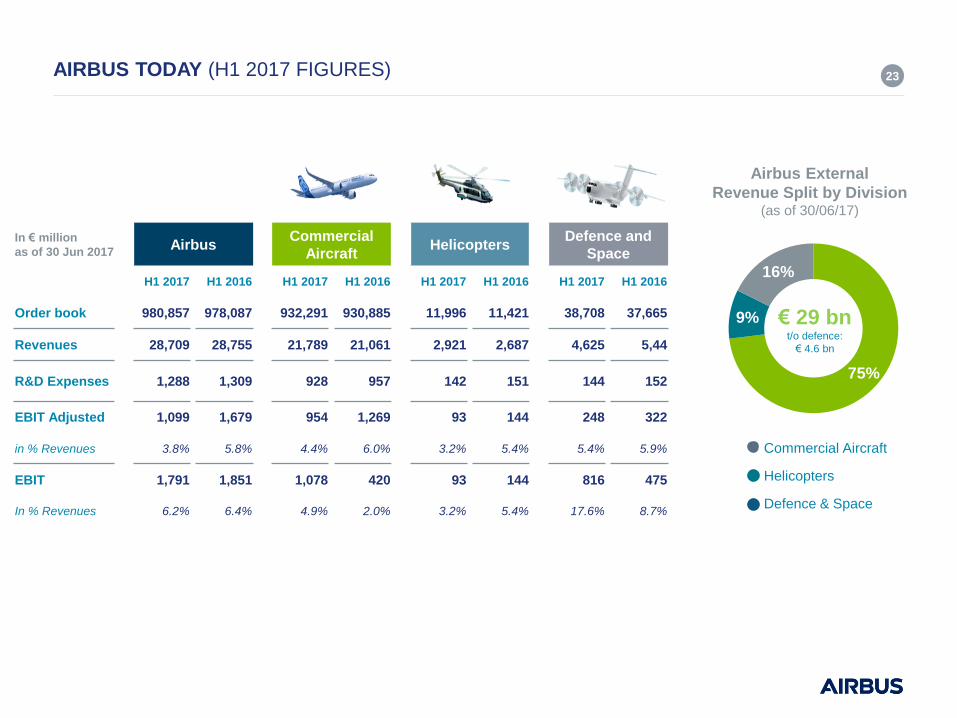
75%
9%
16%
€ 29 bn t/o defence:
€ 4.6 bn
Airbus External
Revenue Split by Division (as of 30/06/17)
Commercial Aircraft
Helicopters
Defence & Space
18 Sept. 2017 Airbus – Private Wealth Investors Presentation
In € million
as of 30 Jun 2017 Airbus
Commercial
Aircraft Helicopters Defence and
Space
H1 2017 H1 2016 H1 2017 H1 2016 H1 2017 H1 2016 H1 2017 H1 2016
Order book 980,857 978,087 932,291 930,885 11,996 11,421 38,708 37,665
Revenues 28,709 28,755 21,789 21,061 2,921 2,687 4,625 5,44
R&D Expenses 1,288 1,309 928 957 142 151 144 152
EBIT Adjusted 1,099 1,679 954 1,269 93 144 248 322
in % Revenues 3.8% 5.8% 4.4% 6.0% 3.2% 5.4% 5.4% 5.9%
EBIT 1,791 1,851 1,078 420 93 144 816 475
In % Revenues 6.2% 6.4% 4.9% 2.0% 3.2% 5.4% 17.6% 8.7%
AIRBUS TODAY (H1 2017 FIGURES) 23
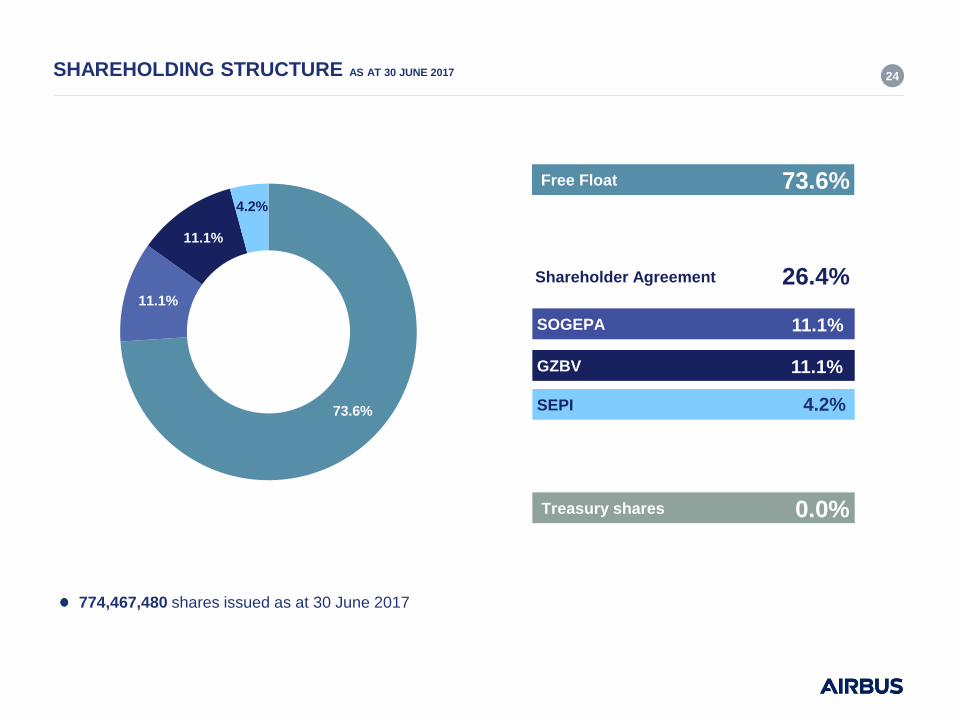
SOGEPA
GZBV
SEPI
24 SHAREHOLDING STRUCTURE AS AT 30 JUNE 2017
Shareholder Agreement
Free Float
Treasury shares
73.6%
26.4%
0.0%
73.6%
11.1%
11.1%
4.2%
774,467,480 shares issued as at 30 June 2017
11.1%
11.1%
4.2%
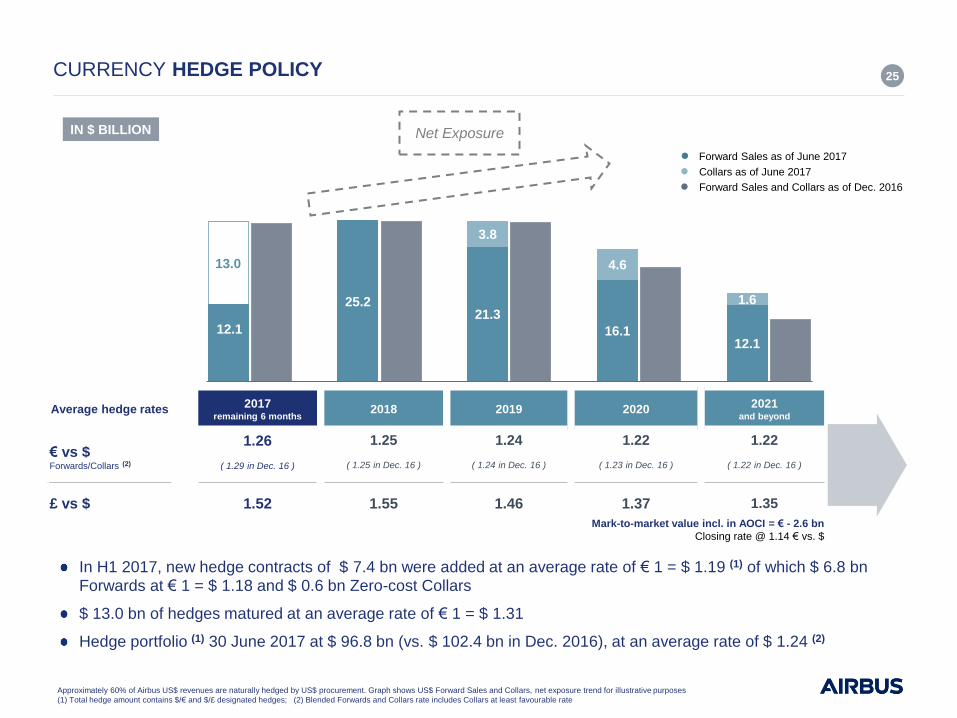
12.1
25.2 21.3
16.1 12.1
13.0
3.8
4.6
1.6
25 CURRENCY HEDGE POLICY
Net Exposure
In H1 2017, new hedge contracts of $ 7.4 bn were added at an average rate of € 1 = $ 1.19 (1) of which $ 6.8 bn Forwards at € 1 = $ 1.18 and $ 0.6 bn Zero-cost Collars
$ 13.0 bn of hedges matured at an average rate of € 1 = $ 1.31
Hedge portfolio (1) 30 June 2017 at $ 96.8 bn (vs. $ 102.4 bn in Dec. 2016), at an average rate of $ 1.24 (2)
Average hedge rates 2017 remaining 6 months
2018 2019 2020 2021 and beyond
€ vs $ Forwards/Collars (2)
1.26
( 1.29 in Dec. 16 )
1.25
( 1.25 in Dec. 16 )
1.24
( 1.24 in Dec. 16 )
1.22
( 1.23 in Dec. 16 )
1.22
( 1.22 in Dec. 16 )
£ vs $ 1.52 1.55 1.46 1.37 1.35
IN $ BILLION
Approximately 60% of Airbus US$ revenues are naturally hedged by US$ procurement. Graph shows US$ Forward Sales and Collars, net exposure trend for illustrative purposes
(1) Total hedge amount contains $/€ and $/£ designated hedges; (2) Blended Forwards and Collars rate includes Collars at least favourable rate
● Forward Sales as of June 2017
● Collars as of June 2017
● Forward Sales and Collars as of Dec. 2016
Mark-to-market value incl. in AOCI = € - 2.6 bn
Closing rate @ 1.14 € vs. $
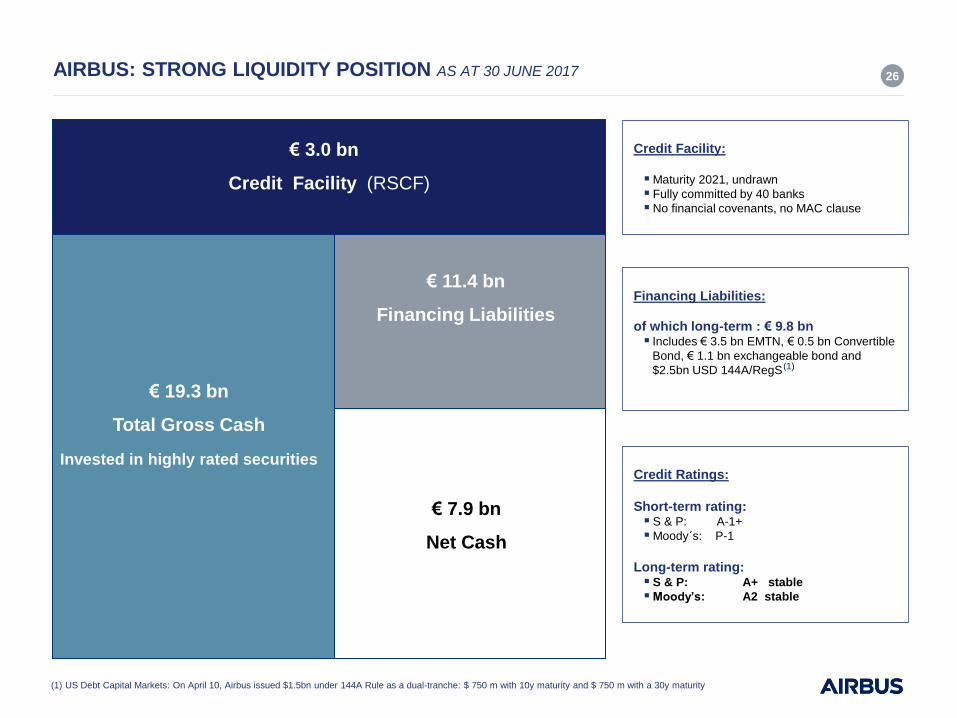
AIRBUS: STRONG LIQUIDITY POSITION AS AT 30 JUNE 2017 26
(1) US Debt Capital Markets: On April 10, Airbus issued $1.5bn under 144A Rule as a dual-tranche: $ 750 m with 10y maturity and $ 750 m with a 30y maturity
€ 19.3 bn
Total Gross Cash
€ 7.9 bn
Net Cash
Invested in highly rated securities
€ 11.4 bn
Financing Liabilities
€ 3.0 bn
Credit Facility (RSCF)
Credit Facility:
Maturity 2021, undrawn
Fully committed by 40 banks
No financial covenants, no MAC clause
Financing Liabilities:
of which long-term : € 9.8 bn Includes € 3.5 bn EMTN, € 0.5 bn Convertible
Bond, € 1.1 bn exchangeable bond and
$2.5bn USD 144A/RegS
Credit Ratings:
Short-term rating: S & P: A-1+
Moody´s: P-1
Long-term rating: S & P: A+ stable
Moody’s: A2 stable
(1)
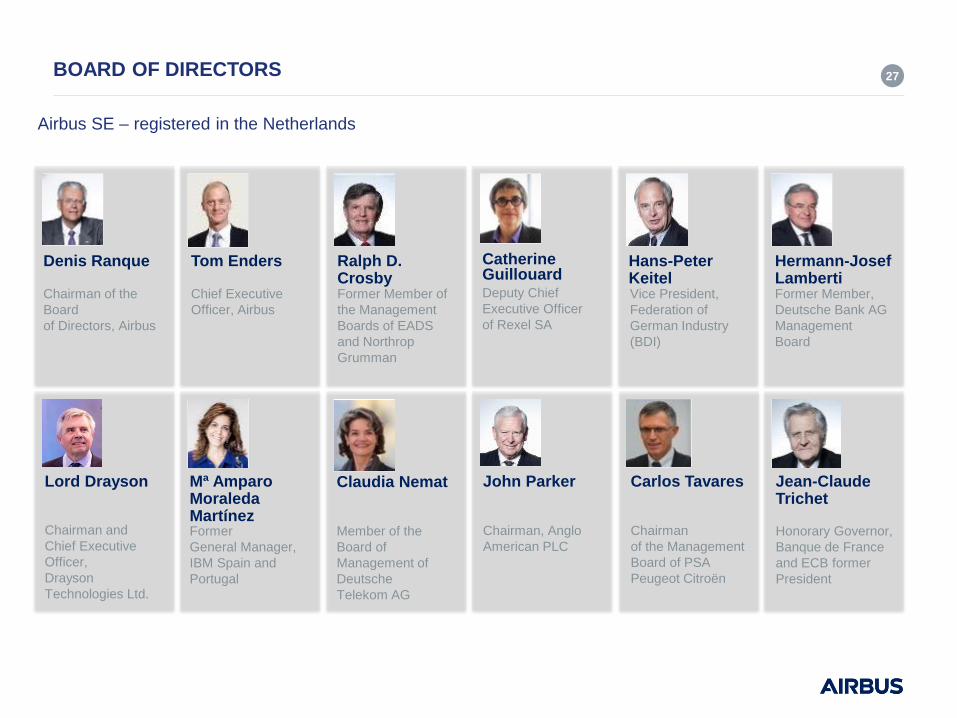
BOARD OF DIRECTORS 27
Former Member,
Deutsche Bank AG
Management
Board
Hermann-Josef Lamberti
Vice President,
Federation of
German Industry
(BDI)
Hans-Peter Keitel
Deputy Chief
Executive Officer
of Rexel SA
Catherine Guillouard
Former Member of
the Management
Boards of EADS
and Northrop
Grumman
Ralph D. Crosby
Chief Executive
Officer, Airbus
Tom Enders
Chairman of the
Board
of Directors, Airbus
Denis Ranque
Chairman and
Chief Executive
Officer,
Drayson
Technologies Ltd.
Lord Drayson
Member of the
Board of
Management of
Deutsche
Telekom AG
Claudia Nemat
Chairman, Anglo
American PLC
John Parker
Chairman
of the Management
Board of PSA
Peugeot Citroën
Carlos Tavares
Honorary Governor,
Banque de France
and ECB former
President
Jean-Claude Trichet
Former
General Manager,
IBM Spain and
Portugal
Mª Amparo Moraleda Martínez
Airbus SE – registered in the Netherlands
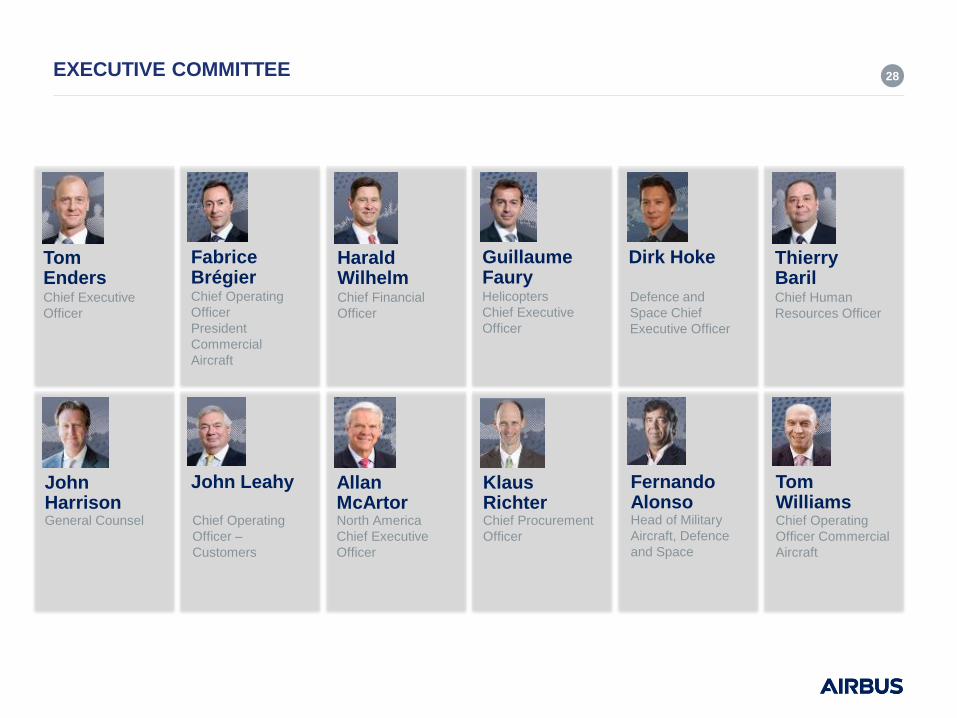
EXECUTIVE COMMITTEE 28
Chief Human
Resources Officer
Thierry Baril
Defence and
Space Chief
Executive Officer
Dirk Hoke
Helicopters
Chief Executive
Officer
Guillaume Faury
Chief Financial
Officer
Harald Wilhelm
Chief Operating
Officer
President
Commercial
Aircraft
Fabrice Brégier
Chief Executive
Officer
Tom Enders
General Counsel
John Harrison
Chief Operating
Officer –
Customers
John Leahy
North America
Chief Executive
Officer
Allan McArtor
Chief Procurement
Officer
Klaus Richter
Head of Military
Aircraft, Defence
and Space
Fernando Alonso
Chief Operating
Officer Commercial
Aircraft
Tom Williams
INVESTOR RELATIONS & FINANCIAL COMMUNICATION CONTACTS 29
Julie Kitcher
Head of Investor Relations
and Financial Communication
www.airbusgroup.com Airbus Investor Relations & Financial Communication
2 rond-point Emile Dewoitine
BP 90112
31703 Blagnac Cedex
Nicolas Chretien
Individual
Shareholders / Head
of Data analytics
Thorsten Fischer
Institutional Investors
and Analysts
Mohamed Denden
Institutional Investors
and Analysts
Alexandre Petovari
Institutional Investors
Asia-Pacific
Recommended