ENVIRONMENTAL QUALITY
MONITORING PROGRAMME (EQMP)
USER MANUAL
AIR POLLUTANT INDEX
MANAGEMENT SYSTEM (APIMS)
THE DEVELOPMENT AND IMPLEMENTATION OF ENVIRONMENTAL QUALITY MONITORING PROGRAMME
DOCUMENT VERSION.:
PSTW/EDC/EQMP/UMAPIMS/2019v01
FOR PUBLIC USE ONLY
Page 2 of 15
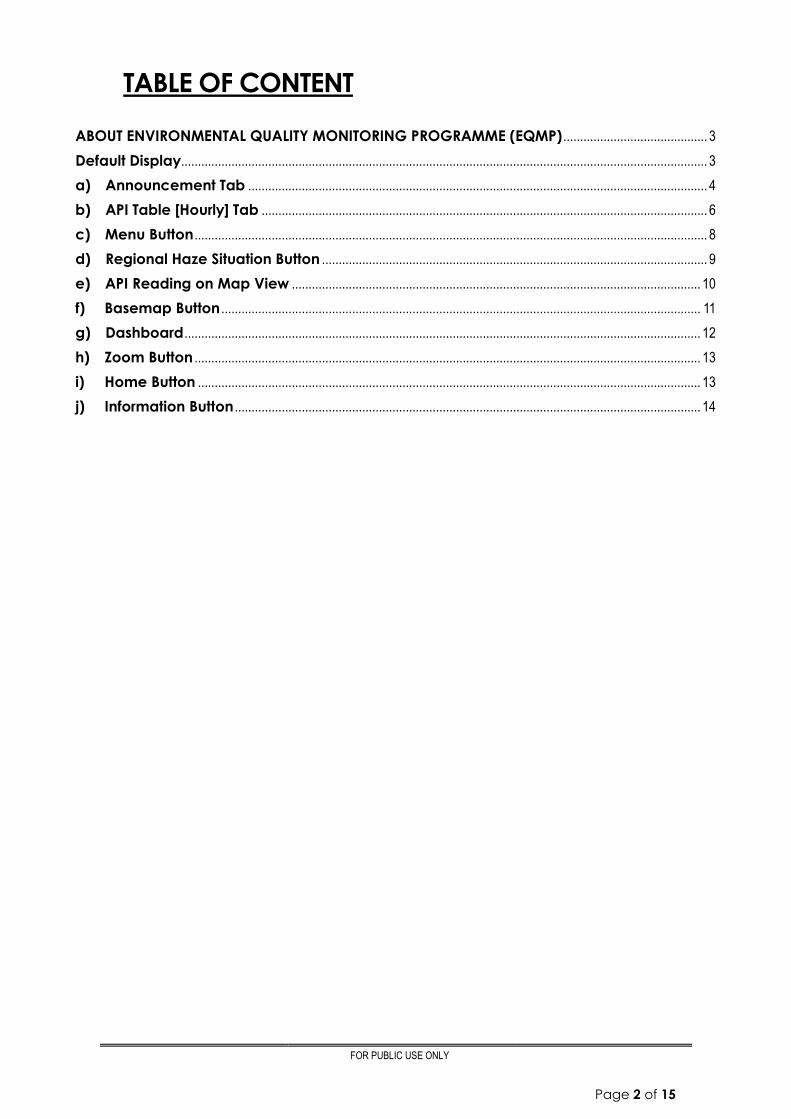
TABLE OF CONTENT
ABOUT ENVIRONMENTAL QUALITY MONITORING PROGRAMME (EQMP) ........................................... 3
Default Display............................................................................................................................................................. 3
a) Announcement Tab ......................................................................................................................................... 4
b) API Table [Hourly] Tab ..................................................................................................................................... 6
c) Menu Button ......................................................................................................................................................... 8
d) Regional Haze Situation Button ................................................................................................................... 9
e) API Reading on Map View .......................................................................................................................... 10
f) Basemap Button ............................................................................................................................................... 11
g) Dashboard .......................................................................................................................................................... 12
h) Zoom Button ....................................................................................................................................................... 13
i) Home Button ...................................................................................................................................................... 13
j) Information Button ........................................................................................................................................... 14

FOR PUBLIC USE ONLY
Page 3 of 15
ABOUT ENVIRONMENTAL QUALITY MONITORING PROGRAMME (EQMP)
The Department of Environment monitors country's environment quality through a network
of environment monitoring stations to detect any significant changes in the environment
quality which may be harmful to human health and the environment.
Default Display
Figure 1 Default Dislpay
i. Default display APIMS will shows the announcement of haze event and also the
information document for public usage.
ii. Close the announcement window to view the API reading on map.
FOR PUBLIC USE ONLY
Page 4 of 15
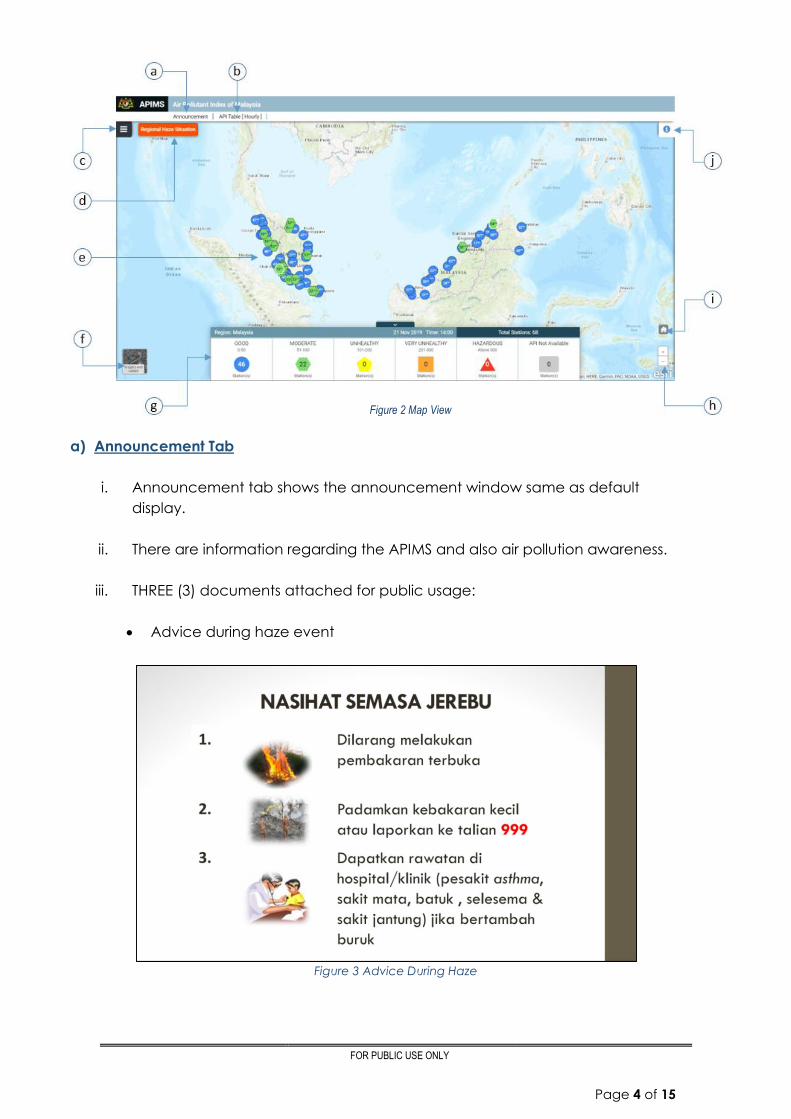
a) Announcement Tab
i. Announcement tab shows the announcement window same as default
display.
ii. There are information regarding the APIMS and also air pollution awareness.
iii. THREE (3) documents attached for public usage:
Advice during haze event
Figure 3 Advice During Haze
Figure 2 Map View

FOR PUBLIC USE ONLY
Page 5 of 15
Introduction of PM2.5
Figure 4 Introduction of PM2.5
Information of PM2.5
Figure 5 Information of PM2.5

FOR PUBLIC USE ONLY
Page 6 of 15
b) API Table [Hourly] Tab
Figure 6 API Table [Hourly]
i. API Table [Hourly] Tab shows the color-coded and symbol API reading to
indicate the API Category and pollutant contributor:
API Category
A specific color shape is assigned to each Air Pollutant Index (API)
category to make it easier for the people with color vision deficiency to
understand the status of air quality. The shapes are shown as below:
Figure 7 API Category
FOR PUBLIC USE ONLY
Page 7 of 15
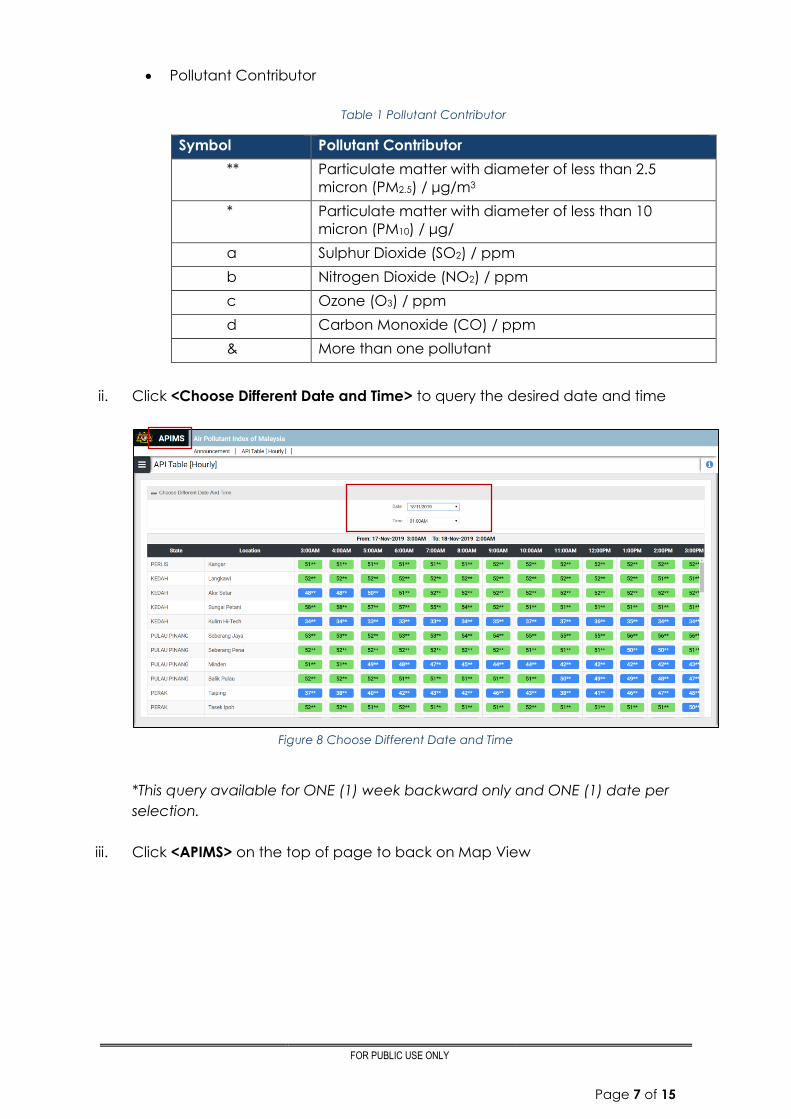
Pollutant Contributor
Table 1 Pollutant Contributor
Symbol Pollutant Contributor
** Particulate matter with diameter of less than 2.5
micron (PM2.5) / μg/m3
* Particulate matter with diameter of less than 10
micron (PM10) / μg/
a Sulphur Dioxide (SO2) / ppm
b Nitrogen Dioxide (NO2) / ppm
c Ozone (O3) / ppm
d Carbon Monoxide (CO) / ppm
& More than one pollutant
ii. Click <Choose Different Date and Time> to query the desired date and time
Figure 8 Choose Different Date and Time
*This query available for ONE (1) week backward only and ONE (1) date per
selection.
iii. Click <APIMS> on the top of page to back on Map View

FOR PUBLIC USE ONLY
Page 8 of 15
c) Menu Button
Figure 9 Menu Button
i. Click on the Menu button to view the menu selection
Latest API Reading
Geolocation Map – Function as home button back to Map View
API Table [Hourly] – refer (b)
Announcement – refer (a)
Advice During Haze – Some advice for public during haze
About API – All information about API including API Calculation and etc
General Information
The selection list below will link to their Main Website.
Remote Sensing Agency
Hotspot : (NOAA20)
Fire Danger Rating System
Meteorological Department
Ministry of Health
Extreme Weather

FOR PUBLIC USE ONLY
Page 9 of 15
Download MyIPU
MyIPU is an application that have same objectives with APIMS.
User is able to download MyIPU in App Store or Google Store by click the button in
the Menu window.
d) Regional Haze Situation Button
Figure 10 Regional Haze Situation
i. Click button to direct access to Regional Haze Situation in ASMC and default
region is set to Malaysia.
ii. Select the desired data that show on the map.
Figure 11 ASMC Regional Haze Situation

FOR PUBLIC USE ONLY
Page 10 of 15
e) API Reading on Map View
Figure 12 API Reading on Map
i. API Reading shown on map as color shape with contributor symbol and
located same location on the ground.
ii. There is the different of the API Reading icon:
White Border icon – For Mobile Continuous Air Quality Monitoring
(MCAQM) station
Black Border icon – For Continuous Air Quality Monitoring (CAQM)
Station
iii. Click on the API Reading icon to view the selected station and reading
details.
Figure 13 Station details
75**
75**

FOR PUBLIC USE ONLY
Page 11 of 15
iv. Click to zoom in the selected station.
Figure 14 Zoomed in Selected Station
f) Basemap Button
i. Click on the basemap button to change the basemap. Default basemap is
Topographic
Figure 15 Default Basemap - Topographic

FOR PUBLIC USE ONLY
Page 12 of 15
Figure 16 Imagery with Labels Basemap
g) Dashboard
i. Dashboard shows the counts of API Reading according their category.
ii. Otherwise, it contains of region, current datetime and current total stations.
iii. Click dropdown icon to hide the dashboard.
Figure 17 Dashboard

FOR PUBLIC USE ONLY
Page 13 of 15
h) Zoom Button
i. Click the icon (+) symbol to zoom in and (-) symbol to zoom out the map
Figure 18 Zoom button
i) Home Button
i. Click the Home button to view the default map view
Figure 19 Home Button

FOR PUBLIC USE ONLY
Page 14 of 15
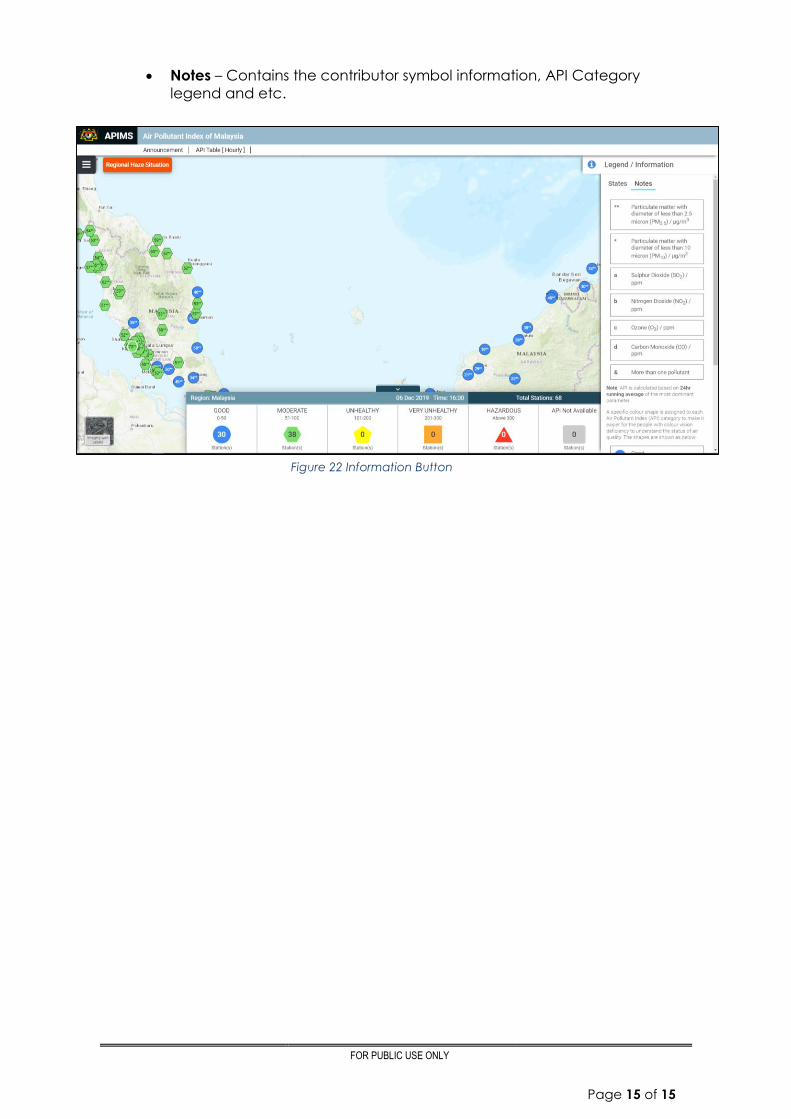
j) Information Button
i. Click the Information button to view the map legend and information
regarding the API Reading.
ii. Information including TWO (2) sub-tabs which are; States and Notes.
States – Selection of desired State (one state per selection) and map
will zoom in the selected state.
Figure 20 States Sub-tab
Figure 21 Selected States
FOR PUBLIC USE ONLY
Page 15 of 15
Notes – Contains the contributor symbol information, API Category
legend and etc.
Figure 22 Information Button
Recommended