Front cover photos courtesy of Shutterstock; ©Anton Balazh, ©thanapun, and the World Bank; ©Simone D. McCourtie, ©Eric Miller
The study highlighted that ICT manufacturing is highly fragmented internationally with value chains mainly concentrated in “Factory Asia”. Barriers for developing country firms to enter, establish or move up ICT value chains are access to (trade) finance, the business and regulatory environment and customs procedures and delays. In addition, more ICT-related constraints are the lack of ICT skills in the labor force, telecommunications infrastructure and the regulation of telecommunications market. Given the “digital divide” between developed and developing countries and the importance of ICT for a country’s economic and social development, aid for trade could play a prominent role in facilitating investments in ICT infrastructure, particularly for the “Least Connected Countries” and certain LDCs.
Contents
1. Introduction
2. ICT value chains: Manufacturing and services
3. ICT infrastructure and access
4. ICT as enabler of economic and social development
5. Barriers to overcome
6. Where do resources currently go?
7. Overcoming the barriers
8. Conclusions
Annex A. Country groupings by income and region
Annex B. Tables and figures
Annex C. The private sector questionnaire
AID FOR TRADE AND VALUE CHAINS IN INFORMATION AND COMMUNICATION TECHNOLOGY AID FOR TRADE AND VALUE CHAINS
IN INFORMATION AND COMMUNICATION TECHNOLOGY
Aid for Trade and Value Chains in Information and Communication
Technology

ACKNOWLEDGEMENTS – 3
AID FOR TRADE AND VALUE CHAINS IN INFORMATION AND COMMUNICATION TECHNOLOGIES © OECD/WTO 2013
Acknowledgments
This report was written by Rainer Lanz. The author would like to thank Michael
Roberts for guidance and comments on the report. He is further grateful to Florian Eberth,
Adelina Mendoza, Nancy Sundberg and Susan Teltscher for providing data and
comments, as well as to Marion Jansen, Evdokia Moïsé, Roy Santana, Lee Tuthill and
Trudy Witbreuk for discussions and comments and to Sandro Bazzanella, Martin Labbé
and Sainabou Taal for providing inputs to the case studies. Finally, he acknowledges Se
Eun Park and Conor Trodden for their valuable assistance.

TABLE OF CONTENTS – 5
AID FOR TRADE AND VALUE CHAINS IN INFORMATION AND COMMUNICATION TECHNOLOGIES © OECD/WTO 2013
TABLE OF CONTENTS
Acknowledgments .................................................................................................................................. 3
Acronyms ............................................................................................................................................... 9
Executive summary ............................................................................................................................. 13
1. Introduction ..................................................................................................................................... 17
2. ICT value chains: Manufacturing and services ............................................................................ 19
Definition of the ICT sector ............................................................................................................... 19 Top ICT firms .................................................................................................................................... 19 ICT manufacturing ............................................................................................................................. 22 ICT services ....................................................................................................................................... 30
3. ICT infrastructure and access ........................................................................................................ 41
Infrastructure access .......................................................................................................................... 41 Broadband – the next step in ICT development ................................................................................. 44
4. ICT as enabler of economic and social development .................................................................... 49
The mobile revolution and e-commerce ............................................................................................ 49 ICT and social development .............................................................................................................. 51
5. Barriers to overcome ....................................................................................................................... 53
Trade policy and trade problems ........................................................................................................ 53 National supply-side constraints ........................................................................................................ 55 Partner and donor country views ....................................................................................................... 58
6. Where do resources currently go? ................................................................................................. 59
Priorities in partners' strategies and in donors' activities ................................................................... 59 Aid-for-trade disbursements on ICT .................................................................................................. 60
7. Overcoming the barriers ................................................................................................................. 67
Support types to help suppliers integrate into ICT value chains ........................................................ 67 Participation in support initiatives ..................................................................................................... 69
8. Conclusions ...................................................................................................................................... 75
References ............................................................................................................................................ 77
Annex A Country groupings by income and region ........................................................................ 79
Annex B Tables and figures ............................................................................................................... 81
Annex C The private sector questionnaire ....................................................................................... 93

6 - TABLE OF CONTENTS
AID FOR TRADE AND VALUE CHAINS IN INFORMATION AND COMMUNICATION TECHNOLOGIES © OECD/WTO 2013
Tables
Table 1 OECD definition of the ICT sector - based on ISIC Rev. 4 .................................................. 19 Table 2 ICT companies among the top 100 non-financial transnational corporations
from developing and transition economies, 2010 ................................................................. 21 Table 3 Output, value added and employment in the ICT sector by country in 2008 ....................... 24 Table 4 Exports and imports of ICT goods by income grouping ....................................................... 25 Table 5 Average applied MFN tariffs on ICT and ITA products by income group
and region ............................................................................................................................. 28 Table 6 Overlap between trade covered by the ICT definition and the ITA in 2011......................... 29 Table 7 Top five exporters of computer services by income group ................................................... 34 Table 8 Exports and imports of telecommunication services by income group ................................ 35 Table 9 Level of competition for selected telecommunications markets ........................................... 36 Table 10 The 39 least connected countries in terms of the ICT Development Index
(IDI) 2011 ........................................................................................................................... 44 Table 11 Aid for trade official development assistance and other official flows
by category .......................................................................................................................... 61 Table 12 Capital expenditure in telecommunication services by income group and
by region ............................................................................................................................. 62 Table 13 Ratio of aid-for-trade disbursements to private investment for selected
countries in 2011 ................................................................................................................. 63 Table 14 Aid-for-trade flows official development assitance of ICT categories by
income and region ............................................................................................................... 63 Table 15 Top 10 partners in terms of ICT disbursements and ICT share in total
aid for trade ......................................................................................................................... 64 Table B.1 OECD definition of the ICT sector based on ISIC Rev. 3.1 ............................................. 81 Table B.2 Exports and imports of ICT goods by country (1) ............................................................ 82 Table B.2 Exports and imports of ICT goods by country (2) ............................................................ 83 Table B.3 Exports and imports of telecommunication services by country (1) ................................. 85 Table B.3 Exports and imports of telecommunication services by country (2) ................................. 86 Table B.4 Exports and imports of computer services by country (1) ................................................ 87 Table B.4 Exports and imports of computer services by country (2) ................................................ 88 Table B.5 Capital expenditure in telecommunication services (1) .................................................... 89 Table B.5 Capital expenditure in telecommunication services (2) .................................................... 90 Table C.1 Supply and lead companies by type of respondent ........................................................... 93 Table C.2 Supply and lead companies by region of head office ........................................................ 93 Table C.3 Supply and lead companies by company size ................................................................... 94
Figures
Figure 1 Revenue and number of the Top 250 ICT firms by sector in 2011 ..................................... 20 Figure 2 Length of value chains by industry in 2008 ........................................................................ 23 Figure 3 Foreign and domestic value added shares content of ICT exports ...................................... 26 Figure 4 Average applied MFN tariffs for ICT products and for non-agricultural
products by income group and region ................................................................................. 27 Figure 5 Average applied MFN tariffs by income group ................................................................... 27 Figure 6 Value added shares of ICT subsectors for selected economies, latest year ......................... 31 Figure 7 Possible development path along the software value chain................................................. 32

TABLE OF CONTENTS – 7
AID FOR TRADE AND VALUE CHAINS IN INFORMATION AND COMMUNICATION TECHNOLOGIES © OECD/WTO 2013
Figure 8 Global market for IT services offshoring by destination in 2011 ........................................ 32 Figure 9 Advances in telecommunication liberalization and reform since 1990 ............................... 35 Figure 10 Percentage of countries with no foreign ownership restrictions in
telecommunications .......................................................................................................... 40 Figure 11 Mobile phone subscriptions per 100 inhabitants by income group and region ................. 41 Figure 12 Individuals using the internet per 100 inhabitants by income group and
region ................................................................................................................................ 42 Figure 13 Fixed and mobile broadband subscriptions per 100 inhabitants by income
group ................................................................................................................................. 43 Figure 14 Fixed and mobile broadband subscriptions per 100 inhabitants by region
in 2011 .............................................................................................................................. 43 Figure 15 Construction costs of new undersea cables entering service by region,
2011-2013 ......................................................................................................................... 45 Figure 16. Number of mobile money services by region (year-end) ................................................. 50 Figure 17 Difficulties suppliers identify in entering, establishing or moving up ICT
value chains ....................................................................................................................... 53 Figure 18 Difficulties lead firms face in bringing new suppliers from developing
countries into their supply chains...................................................................................... 54 Figure 19 Trade problems that lead firms identify when dealing with developing
country suppliers ............................................................................................................... 54 Figure 20 Main national supply-side constraints, identified by suppliers that affect
their ability to enter, establish and move up ICT value chains ......................................... 55 Figure 21 Obstacles identified by lead companies in establishing a commercial
presence in developing countries ...................................................................................... 56 Figure 22 The main obstacles identified by donors and partners for a greater
participation of developing country firms in value chains ................................................ 58 Figure 23 Sectors identified in national development strategies as sources of growth...................... 59 Figure 24 Sectoral focus of private sector engagement in the implementation of
aid-for-trade projects .......................................................................................................... 60 Figure 25 Country averages of ICT disbursements and ICT shares in total aid for trade
by income groups and regions (2006-2011) ..................................................................... 64 Figure 26 The 39 least connected countries (LCCs) in terms of the ICT development
index (IDI) 2011 and their ICT share in total aid-for-trade disbursments ........................ 65 Figure 27 Types of support identified as ‘most effective’ by developing country
suppliers in helping them to enter, establish, or move up value chains ............................ 67 Figure 28 Types of support lead companies suggest would be ‘most effective’ to
bring new developing-country suppliers into their value chains ...................................... 68 Figure B.1 Difficulties suppliers face in entering, establishing, or moving up ICT
value chains ..................................................................................................................... 91 Figure B.2 Difficulties lead firms face in bringing new suppliers from developing
countries into their supply chains..................................................................................... 91 Figure C.1 Number of ICT suppliers trading goods and services products ....................................... 94
Boxes
Box 1 The WTO Information Technology Agreement (ITA) ........................................................... 28 Box 2 Trends in telecommunication reform ...................................................................................... 37 Box 3 Support for the establishment of harmonized policies for the ICT market in
ACP countries ......................................................................................................................... 38

8 - TABLE OF CONTENTS
AID FOR TRADE AND VALUE CHAINS IN INFORMATION AND COMMUNICATION TECHNOLOGIES © OECD/WTO 2013
Box 4 Undersea cables in Africa ....................................................................................................... 46 Box 5 Mobile money ......................................................................................................................... 50 Box 6 Caribbean Community regional aid-for-trade strategy 2013-2015 ......................................... 69 Box 7 NTF II – Improving the export competitiveness of the IT and ITES sector
in Bangladesh .......................................................................................................................... 70 Box 8 Activities of the International Trade Centre (ITC) to support the use of ICTs
in developing countries ........................................................................................................... 71 Box 9 Activities of the African Development Bank on ICT to support regional
integration ............................................................................................................................... 73

ACRONYMS – 9
AID FOR TRADE AND VALUE CHAINS IN INFORMATION AND COMMUNICATION TECHNOLOGIES © OECD/WTO 2013
Acronyms
ACP African Caribbean and Pacific group of states
AFD Agence Française de Développement
AfDB African Development Bank
B2B Business-to-Business
B2C Business-to-Consumer
B2G Business-to-Government
BASIS Bangladesh Association of Software & Information Services
CDN Content Delivery Network
CRS Creditor Reporting System
CSME Caribbean Single Market and Economy
CTS Consolidated Tariff Schedules
CTU Caribbean Telecommunications Union
DAC Development Assistance Committee
DCCI Dhaka Chamber of Commerce and Industry
EASSy Eastern Africa Submarine Cable System
EIB European Investment Bank
EMS Electronics Manufacturing Services
EU European Union
FDI Foreign Direct Investment
GATS General Agreement on Trade in Services
GDP Gross Domestic Product
GNI Gross National Income
GSMA Global Money Adoption Survey
GVC Global Value Chain
HIPCAR Harmonization of ICT Policies, Legislation and Regulatory Procedures
HIPSSA Harmonization of the ICT Policies in Sub-Saharan Africa

10 - ACRONYMS
AID FOR TRADE AND VALUE CHAINS IN INFORMATION AND COMMUNICATION TECHNOLOGIES © OECD/WTO 2013
HS Harmonized System
ICB4PAC Capacity Building and ICT Policy, Regulatory and Legislative Frameworks
Support for Pacific Island Countries
ICT Information and Communication Technologies
IDB Integrated Data Base
IDI ICT Development Index (composite index produced by ITU)
IFC International Finance Corporation
IP Intellectual Property
IP Internet Protocol
IT Information Technology
ITA Information and Technology Agreement
ITES Information Technology Enabled Services sector in Bangladesh
ITU International Telecommunications Union
IXP Internet Exchange Point
KfW KfW Bankengruppe
LCC Least Connected Country
LDCs Least Developed Countries
LMICs Low- And Middle-Income Countries
MDG Millennium Development Goal
MFN Most Favoured Nation
NTFII Netherlands Trust Fund II
NTMs Non-Tariff Measures
ODA Official Development Assistance
ODA Official Development Assistance
ODM Original Design Manufacturer
OECD Organisation of Economic Co-operation and Development
OOF Other Official Flows
PIDA Programme for Infrastructure Development in Africa
PPP Public-Private-Partnership
RCA Revealed Comparative Advantage
SDSL Structured Data Systems Ltd
TNC Transnational Corporation
UMICs Upper Middle Income Countries
ACRONYMS – 11
AID FOR TRADE AND VALUE CHAINS IN INFORMATION AND COMMUNICATION TECHNOLOGIES © OECD/WTO 2013
UNCTAD United Nations Conference on Trade and Development
UNESCO United Nations Educational, Scientific and Cultural Organization
UNIDO United Nations Industrial Development Organization
WEF World Economic Forum
WIOCC West Indian Ocean Cable Company
WTO World Trade Organization


EXECUTIVE SUMMARY – 13
AID FOR TRADE AND VALUE CHAINS IN INFORMATION AND COMMUNICATION TECHNOLOGIES © OECD/WTO 2013
Executive summary
Information and communication technologies (ICT) value chains cover a wide array
of activities carried out by both manufacturing and services firms. While the majority of
top ICT firms are still located in OECD countries, major transnational corporations have
emerged in developing countries. Asian countries are now home to some of the world's
largest electronic manufacturers, while multinational telecommunications operators can
also be found in emerging economies outside of Asia, such as Mexico and South Africa.
Due to technical standards and standardized design and interfaces, ICT manufacturing
value chains are modular in nature where suppliers produce components following the
design of lead firms. As a result of this modularity, ICT manufacturing is among the
industries where the production process is the most fragmented internationally, relying on
a high share of imported inputs.
ICT manufacturing is exemplary for the emergence of "Factory Asia". China, Japan
and Korea are the largest producers of ICT goods and other Asian economies, such as
Malaysia, Singapore, Thailand or Philippines, have also become major ICT
manufacturers. China is the largest exporter of ICT goods accounting for 37% of world
exports. However, gross export flows do not accurately reflect how much value a country
captures in value chains. In particular, China tends to conduct lower value added
activities in the later stages of the ICT value chain, such as the final assembly of
intermediate components, while countries like Japan and the United States tend to
conduct more high value added activities such as specialized component production,
marketing services or engineering services.
Least-developed countries (LDCs) and low- and middle-income countries (LMICs)
are of marginal importance for production and trade in ICT manufacturing chains – with
the exceptions of India, Indonesia and the Philippines. The potential for a developing
country to successfully integrate into ICT manufacturing value chains depends on, among
other things, its closeness to a big market or to regional production networks, for instance
"Factory Asia".
The emergence of international ICT value chains has been fostered by relatively low
tariffs, which are below the average tariff rate of non-agricultural products for all income
groups except LDCs. In particular, the highest tariffs on ICT goods are in African
countries and the LDCs, with average rates of about 12%. The lowest tariffs exist in
OECD countries, with average rates of less than 2%. Low tariff rates are the result of the
WTO Information and Technology Agreement (ITA), in which 75 participants have fully
liberalized trade on a MFN basis for 190 IT products covering more than 60% of ICT
trade.
The increasing interdependence of economies, fostered by value chains, requires a
trade policy that reaches beyond pure market access. Trade reform in the fields of non-
tariff measures (NTMs) and trade facilitation promises the greatest benefits as lead firms

14 - EXECUTIVE SUMMARY
AID FOR TRADE AND VALUE CHAINS IN INFORMATION AND COMMUNICATION TECHNOLOGIES © OECD/WTO 2013
organize production across many countries. For instance, trade in intermediate goods is
particularly sensitive to time.
In many developing countries activities in ICT services, such as telecommunications
and computer services, generate significantly more value added than ICT manufacturing.
Furthermore, ICT services constitute vital inputs to the activities of manufacturing and
other services sectors. Since ICT services offer also a myriad of possibilities to
entrepreneurs, they might be of a higher priority to developing countries compared to ICT
manufacturing.
India represents the most prominent success story of a developing country
successfully integrating into ICT value chains by developing export-oriented software
services industry. India accounts for 60% of the global market for IT services offshoring
and about 20% of world exports in computer services. However, other developing
countries, such as the Philippines and the Latin American countries – Argentina and
Costa Rica – have also successfully built up comparative advantages in computer services
exports.
Telecommunication regulation plays an important role for the productivity of firms
and for economic development by promoting universal access and ensuring competition.
Since the mid-1990s, developing countries have privatized state-owned incumbent
operators, established independent regulators, and facilitated competition in the market.
Most countries in the Americas have introduced full competition in their
telecommunications markets, while Africa and the Arab States still experience the
existence of some monopolies or limited competition. In particular, more efforts are
needed to increase competition in markets for international gateways, which connect
domestic networks to undersea cables and are crucial for the affordability of broadband
access.
Similar to developed countries, developing countries face regulatory challenges such
as spectrum management or IP interconnection. While developing countries have made
significant progress in liberalizing their telecommunications market, a few countries still
apply foreign ownership restrictions or maintain discretion regarding the licensing, and
entry, of foreign firms.
ICT infrastructure access and usage are necessary conditions for economic
development and can be an important catalyst to the achievement of the Millennium
Development Goals (MDGs). Developing countries have made significant progress in
ICT infrastructure development since 2005. Mobile phone penetration in LDCs increased
from 7% in 2005 to 52% in 2012. Despite these positive developments, a large digital
divide still exists between OECD countries and developing countries, particularly LDCs.
Only 8% of LDC inhabitants use the internet, while fixed broadband penetration is below
1%. However, optimism exists from the rapid growth in mobile broadband access in
Africa, where subscriptions are expected to increase from 6% in 2012 to 11% by the end
of 2013.
Following the diffusion of mobile phones, developing countries face the challenge of
ensuring the proliferation of broadband access, which can bring high speed internet to
individuals and businesses, thereby fostering economic growth and development. While
infrastructure investments in undersea cables are, to a large extent private sector driven,
development finance and public-private partnership can incentivize and leverage such
investments. Besides facilitating infrastructure investments, policy makers and regulators
EXECUTIVE SUMMARY – 15
AID FOR TRADE AND VALUE CHAINS IN INFORMATION AND COMMUNICATION TECHNOLOGIES © OECD/WTO 2013
face challenges to increase competition for the access to undersea cables. In doing so,
lower access prices will accelerate the proliferation of broadband.
ICT is an enabler of economic and social development for firms and households using
them. Internet and mobile phones have allowed the rise of e-commerce. E-commerce
provides entrepreneurs with improved access to domestic and foreign markets and allows
for innovative types of services such as mobile money. However, developing countries
still face significant challenges regarding e-commerce, such as the lack of internet access,
insecure payments systems, lack of digital literacy, or inadequate distribution networks
and customs procedures for the shipping of goods sold online. ICT furthermore, enables
and catalyzes social development in areas such as health, education and women's
empowerment towards the achievement of the Millennium Development Goals.
The analysis of the responses from 80 developing country suppliers and 44 lead firms
to the OECD-WTO private sector questionnaire provides insights concerning the main
difficulties developing country firms face when trying to enter, establish and/or move up
ICT value chains. Access to trade finance and customs procedures are the most often
mentioned trade-related difficulties by suppliers, which are also emphasized by lead
companies. Lead companies additionally consider informal payment requests as a typical
trade problem when dealing with developing country suppliers.
Access to finance and a lack of ICT labour force skills are the main national
supply-side constraints for suppliers from developing countries. The absence of a sound
business environment and transparency in the regulatory environment are the most typical
obstacles for lead companies when establishing a commercial presence in developing
countries. Regarding physical infrastructure, power supply problems are considered by
both suppliers and lead firms as the main constraint, ranking higher than
telecommunications and transport infrastructure.
Hence, in many instances, ICT firms face similar problems to suppliers in other value
chains and would benefit from aid-for-trade interventions targeted at significant
horizontal constraints, such as access to finance (trade finance), the business and
regulatory environment, as well as customs procedures and delays.
Aid-for-trade donors and partners both consider ICT services as a priority. More than
55% of partners have identified communication services, including computer and
information services, as sources of growth in their development strategies. The majority
of donors are currently engaged in public-private partnerships that have ICT as a sectoral
focus. On the other hand, manufacturing of office and telecoms equipment is only
mentioned by 12% of partners in their development strategies.
ICT-related aid-for-trade projects can have different objectives and create linkages to
other sectors. They may support firms in the ICT sector, help firms or governments to use
ICT, assist telecommunication regulators or support and facilitate investments in ICT
infrastructure. Aid-for-trade disbursements on ICT projects amounted to USD 418 million
in 2011, accounting for only 1.2% of total aid-for-trade. This is significantly lower than f
to other categories of aid-for-trade disbursements – transport and storage secured 30% of
all disbursements in 2011, while 21% was disbursed to energy generation and supply. The
marginal importance of ICT-related aid for trade reflects the fact that investments into
ICT infrastructure tend to be less capital intensive and more private sector driven than in
the case of transport and energy infrastructure. Consequently, aid for trade to ICT
constitutes only a small fraction of private sector investment and capital expenditure in
most developing countries.

16 - EXECUTIVE SUMMARY
AID FOR TRADE AND VALUE CHAINS IN INFORMATION AND COMMUNICATION TECHNOLOGIES © OECD/WTO 2013
However, the digital divide between developing and developed countries still exists
and is widening in the case of LDCs. Furthermore, the share of ICT projects in total aid
for trade is below the average of partner countries for the majority of the 39 least
connected countries (LCCs). Hence, there might be a more prominent role for aid for
trade in some LDCs and LCCs to support ICT development and to facilitate private
investments.
There are ICT-related aid-for-trade interventions cheaper than infrastructure
development that can still bring significant benefits to developing countries. In particular,
projects can aim at increasing the ICT skills of the workforce, which is a major constraint
highlighted by suppliers in developing countries.
Furthermore, aid for trade can achieve significant development outcomes by
supporting the capacity-building and the policy-making of telecommunications
regulators. For instance, existing aid-for-trade projects support regulators to harmonize
telecommunications legislation, including regulation at a regional level, with the
objective to foster regional integration and competitiveness. Importantly, in addition to
fostering competition and lower prices, a sound regulatory environment can facilitate
private investment in ICT infrastructure.

1. INTRODUCTION – 17
AID FOR TRADE AND VALUE CHAINS IN INFORMATION AND COMMUNICATION TECHNOLOGIES © OECD/WTO 2013
1. Introduction
Major advances in information and communication technology (ICT) have
fundamentally changed the way people live and communicate and how companies
conduct business. In addition to being an enabling technology for social and economic
development, ICT has played a crucial role in facilitating the fragmentation of production
and the rise of global value chains (GVCs) by reducing trade costs in services and by
allowing a multitude of tasks to be traded online.
The prime goal of this report is to describe value chains in the ICT sector, including
the policy environment surrounding it by identifying the barriers developing country
firms face when trying to enter, establish or move up ICT value chains. The report also
assesses the important role of aid for trade in overcoming these barriers.
To identify the barriers that developing country firms face in integrating into ICT
value chains and possible support measures, the report analyses the results of a joint
OECD-WTO private sector questionnaire. The OECD-WTO questionnaire was conducted
in collaboration with the International Telecommunications Union (ITU) as part of the
fourth Global Review of Aid for Trade on "Connecting to Value Chains" and covers 80
developing country suppliers and 44 lead firms in ICT value chains in 55 countries.
While the focus of the report is on firms within ICT value chains, the report also
examines developments and challenges regarding ICT infrastructure and accessibility,
which is recognized as an important catalyst to the achievement of the Millennium
Development Goals (MDGs) (ITU, 2011). Furthermore, the report illustrates the role of
ICT as an enabler for economic and social development.
The report uses the OECD DAC list of official development assistance (ODA)
recipients to group countries by income and region (Annex A). ODA recipients are
referred to as "developing" countries in the report and their respective income and
regional aggregates are benchmarked against OECD Members.
The structure of the report is as follows: Section B describes production and trade
patterns of both ICT manufacturing and services value chains and their respective
regulatory and trade policy environment; Section C assesses the advances in ICT
infrastructure and access of developing countries with a particular focus on broadband;
Section D describes how ICT enables firms to engage in e-commerce and its importance
for social development.
Section E uses the results of the OECD-WTO private sector questionnaire to highlight
the main barriers ICT firms in developing countries face when integrating into value
chains. Section F describes the priorities of Aid for Trade partners and donors and
analyses aid-for-trade disbursements on ICT projects. Section G describes support
initiatives that can help suppliers to overcome the barriers to value chain integration.
Section H provides a concluding discussion of the role of aid for trade for ICT
development and the integration of developing country firms into ICT value chains.


2. ICT VALUE CHAINS: MANUFACTURING AND SERVICES – 19
AID FOR TRADE AND VALUE CHAINS IN INFORMATION AND COMMUNICATION TECHNOLOGIES © OECD/WTO 2013
2. ICT value chains: Manufacturing and services
Definition of the ICT sector
The ICT sector is very diverse covering both manufacturing and services firms.
According to the OECD ICT sector definition (see Table 1), ICT manufacturing covers
the manufacture of electronic components, computer and peripheral equipment,
communication equipment, consumer electronics and magnetic and optical media. ICT
services activities cover software publishing, telecommunications, computer
programming and consultancy, data services and web portals, as well as the repair of
computers and communication equipment.
Table 1 OECD definition of the ICT sector - based on ISIC Rev. 4
ICT manufacturing industries
2610 Electronic components and boards
2620 Computers and peripheral equipment
2630 Communication equipment
2640 Consumer electronics
2680 Magnetic and optical media
ICT trade industries (wholesale)
4651 Computers, computer peripheral equipment and software
4652 Electronic and telecommunications equipment and parts
ICT services industries
5820 Software publishing
61 Telecommunications
620 Computer programming, consultancy and related activities
631 Data processing, hosting and related activities; web portals
951 Repair of computers and communication equipment
Source: OECD (2011).
Top ICT firms
The OECD Internet Economy Outlook 2012 (OECD, 2012) provides data on the Top
250 ICT firms classified into the four manufacturing sectors communication equipment,
electronics & components, semiconductors and IT equipment, and the four services
sectors IT services, software, internet and telecommunications. Out of the Top 250 firms,
128 are manufacturing firms with revenues of USD 1,294 billion and accounting for 59%
of the Top 250 revenue, while 122 are services firms with revenues of USD 915 billion
and accounting for 41% of the Top 250 revenue. 201 firms are registered in OECD
countries, 82 of which in the United States and 49 in Japan. Only 3 of the Top 250 are
registered on mainland China, 4 are registered in Hong Kong and 18 in Chinese Taipei.

20 - 2. ICT VALUE CHAINS: MANUFACTURING AND SERVICES
AID FOR TRADE AND VALUE CHAINS IN INFORMATION AND COMMUNICATION TECHNOLOGIES © OECD/WTO 2013
Other "emerging economies" that host one or more of the Top 250 ICT firm are Egypt
(1), India (4), Indonesia (1), Mexico (1), Morocco (1), Russia (1), Philippines (1) and
South Africa (3).
Telecommunications and electronics & components firms are predominant in terms of
number and revenue (Figure 1). The 76 telecommunications firms and the 64 electronics
& components firms have respective revenues of 1,617bn and 1,145bn constituting 60%
of the revenues of all Top 250 ICT firms.
In terms of revenues, services firms have grown faster over the last decade than
manufacturing firms increasing their revenue share among the Top 250 ICT firms from
41% in 2000 to 49% in 2011. In particular, the top internet firms grew 31% per year
compared to about 10% for software and telecommunications firms.
Figure 1 Revenue and number of the Top 250 ICT firms by sector in 2011
Source: OECD Internet Economy Outlook 2012 (OECD, 2012).
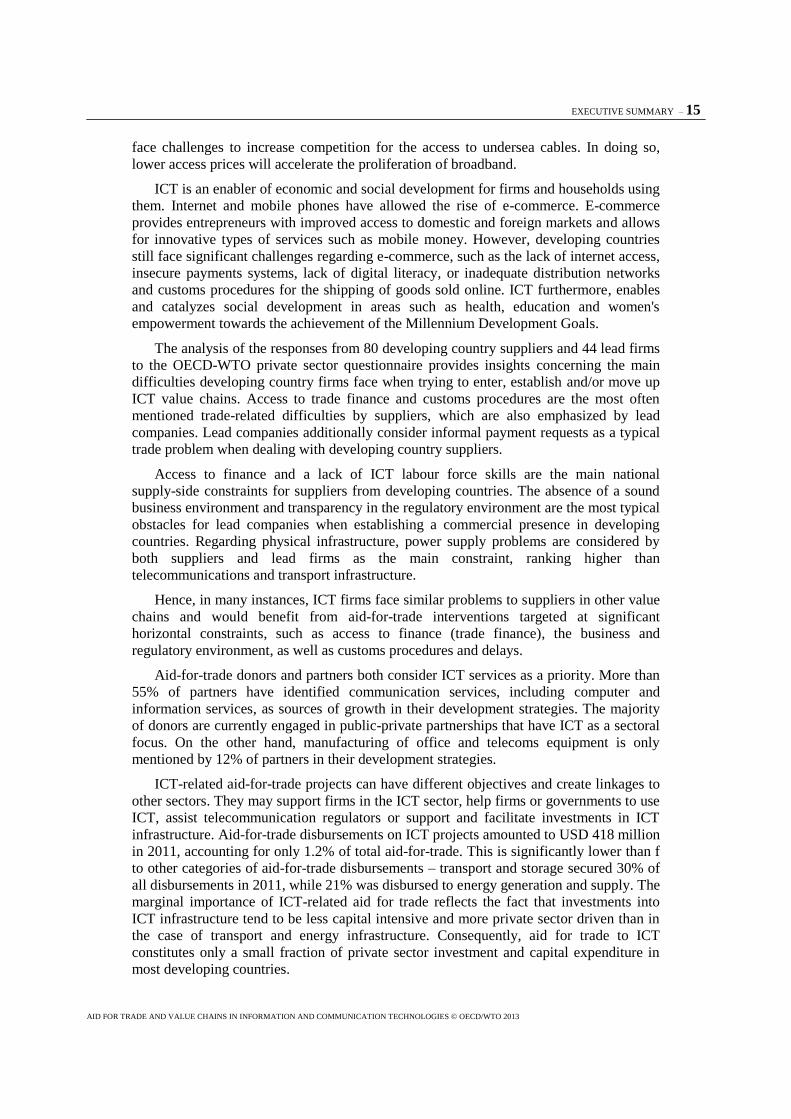
Almost a third of the top 100 non-financial transnational corporations (TNCs) from
developing and transition economies shown in Table 2 are ICT firms or have ICT as a
main activity. The majority of these ICT TNCs are manufacturers headquartered in Asia
and include industrial conglomerates such as Hutchison Whampoa (Hong Kong, China)
and Samsung (Korea), the world's largest electronics manufacturing services (EMS)
provider Hon Hai Precision Industries (Foxconn, Chinese Taipei), and the world's largest
original design manufacturer (ODM) of notebooks Quanta Computer (Chinese Taipei).
While ICT manufacturing is concentrated in Asia, telecommunications TNCs can be
found also in developing and transition countries from other regions. For instance,
América Móvil from Mexico, operates in 18 countries in Latin America, and the MTN
Group from South Africa operates in 21 countries.
0
10
20
30
40
50
60
70
80
0
200
400
600
800
1,000
1,200
1,400
1,600
1,800
Num
ber
of F
irm
s
US
D b
illio
ns
Revenue Firms
2. ICT VALUE CHAINS: MANUFACTURING AND SERVICES – 21
AID FOR TRADE AND VALUE CHAINS IN INFORMATION AND COMMUNICATION TECHNOLOGIES © OECD/WTO 2013
Table 2 ICT companies among the top 100 non-financial transnational corporations from developing and transition economies, 2010
Ranking by:
Assets Sales Employment
Foreign assets
TNIb Corporation Home economy Industryc Foreign Total Foreign Total Foreignd Total TNI(%)
1 15 Hutchison Whampoa Limited Hong Kong, China Diversified 75,447 92,762 21,053 26,924 198,707 240,000 80.8
8 26 Singapore Telecommunications Ltd Singapore Telecommunications 25,877 31,134 8,759 13,563 10,417 23,000 64.3
10 54 América Móvil SAB de CV Mexico Telecommunications 22,300 70,947 27,281 48,105 77,141 148,058 46.7
11 44 Hon Hai Precision Industries Chinese Taipei Electrical & electronic equipment 19,465 47,327 32,739 102,574 789,051 935,000 52.5
13 18 Qatar Telecom Qatar Telecommunications 18,882 27,857 6,011 7,467 1,495 1,900 75.7
14 49 Samsung Electronics Co., Ltd. Korea, Republic of Electrical & electronic equipment 18,075 118,337 111,394 133,756 94,802 190,464 49.4
21 24 MTN Group Ltd South Africa Telecommunications 15,352 23,341 9,845 15,665 23,253 34,588 65.3
25 12 Zain Kuwait Telecommunications 12,210 13,221 3,513 4,716 5,541 6,000 86.4
29 4 Flextronics International Ltd Singapore Electrical & electronic equipment 11,539 11,633 28,102 28,680 171,901 176,000 98.3
32 2 First Pacific Company Ltd Hong Kong, China Electrical & electronic equipment 10,639 10,914 4,640 4,640 70,083 70,121 99.1
35 20 Axiata Group Bhd Malaysia Telecommunications 10,205 12,356 2,741 4,849 21,250 25,000 74.7
41 57 Quanta Computer Inc Chinese Taipei Electrical & electronic equipment 9,006 17,552 5,780 38,492 50,485 68,720 46.6
43 27 Naspers Ltd South Africa Other consumer services 8,342 10,284 1,399 4,598 12,924 15,932 64.2
47 32 Orascom Telecom Holding SAE Egypt Telecommunications 7,458 9,980 3,432 3,825 3,319 14,839 62.3
50 81 VimpelCom Ltd Russian Federation Telecommunications 7,123 19,928 2,398 10,513 9,966 42,025 27.4
53 96 Sistema JSFC Russian Federation Telecommunications 6,151 44,109 2,983 28,098 18,563 135,000 12.8
60 61 Lenovo Group Ltd China Electrical & electronic equipment 5,436 10,706 11,579 21,594 6,247 27,039 42.5
62 17 Acer Inc Chinese Taipei Electrical & electronic equipment 5,231 9,616 20,119 21,528 6,546 7,757 77.4
65 38 Tata Consultancy Services India Other services 5,058 7,335 7,368 8,192 10,475 160,429 55.1
72 40 Advanced Semic. Engineering Inc Chinese Taipei Electrical & electronic equipment 4,113 7,135 3,241 6,459 26,520 48,901 54.0
73 84 Taiwan Semic.Manufacturing Co Ltd Chinese Taipei Electrical & electronic equipment 4,100 24,646 7,599 14,358 3,342 33,232 26.5
75 35 Wistron Corp Chinese Taipei Other equipments goods 3,888 7,462 15,113 21,054 28,475 50,733 60.0
78 33 ASUSTeK Computer Inc Chinese Taipei Electrical & electronic equipment 3,673 6,956 10,995 14,709 6,035 10,318 62.0
80 83 Compal Electronics Inc Chinese Taipei Other consumer goods 3,360 11,424 864 30,356 31,292 63,251 27.2
81 77 ZTE Corp China Other consumer goods 3,189 12,911 5,623 10,378 20,000 85,232 34.1
83 91 Mobile TeleSystems OJSC Russian Federation Telecommunications 3,120 14,478 1,906 11,293 6,385 39,911 18.1
86 88 Reliance Communications Ltd India Telecommunications 3,000 21,214 1,674 4,923 3,968 28,065 20.8
87 34 TPV Technology Limited Hong Kong, China Wholesale trade 2,985 5,127 8,043 11,632 21,815 37,473 61.9
89 87 Turkcell Iletisim Hizmetleri AS Turkey Telecommunications 2,952 9,794 460 5,991 3,371 11,183 22.7
91 60 United Microelectronics Corp Chinese Taipei Electrical & electronic equipment 2,734 9,629 2,704 4,327 5,044 13,671 42.6
95 11 Skyworth Digital Holdings Ltd Hong Kong, China Electrical & electronic equipment 2,396 2,399 3,045 3,130 14,763 23,300 86.8
Source: World Investment Report 2012 (UNCTAD, 2012a). a All data are based on the companies' annual reports unless otherwise stated; corresponds to the financial year from 1 April 2010 to 31 March 2011.b TNI, the Transnationality Index, is calculated as the
average of the following three ratios: foreign assets to total assets, foreign sales to total sales and foreign employment to total employment. c Industry classification for companies follows the United States Standard Industrial Classification as used by the United States Securities and Exchange Commission (SEC). d In a number of cases foreign employment data were calculated by applying the share of foreign employment in total employment of the previous year to total employment of 2010. e In lieu of 2010 figures, 2009 data have been used.
22 – 2. ICT VALUE CHAINS: MANUFACTURING AND SERVICES
AID FOR TRADE AND VALUE CHAINS IN INFORMATION AND COMMUNICATION TECHNOLOGIES © OECD/WTO 2013
ICT manufacturing
Production and trade patterns in ICT manufacturing chains
Most ICT products, such as smartphones, consist of different components which can
be easily connected, owing heavily to technical standards, as well as standardized design
and interfaces. This modularity allows a division between the design and manufacturing
activities resulting in modular value chains where suppliers manufacture products
following the design of lead firms (Gereffi et al., 2005).
Sturgeon and Kawakami (2010) identify three principal types of companies in the
electronics industry, i.e. lead firms, contract manufacturers and platform leaders. Lead
firms, such as Apple or Samsung design the product, place orders with their suppliers and
sell the final product to the consumer. Lead firms are characterized by a strong brand
name and technological leadership and are able to capture a large portion of the value
added through their design, marketing and distribution activities. Contract manufacturers
can be further divided into providers of original design manufacturing (ODM) which
conduct both manufacturing and design activities, and providers of electronics
manufacturing services (EMS) which carry out only manufacturing activities. Contract
manufacturers typically produce generic parts or assemble the final product and are hence
substitutable with low market power against lead firms. The third type of actor in
electronics value chains are platform leaders, such as Intel, which provide the technology
platform that is used by products of other companies.
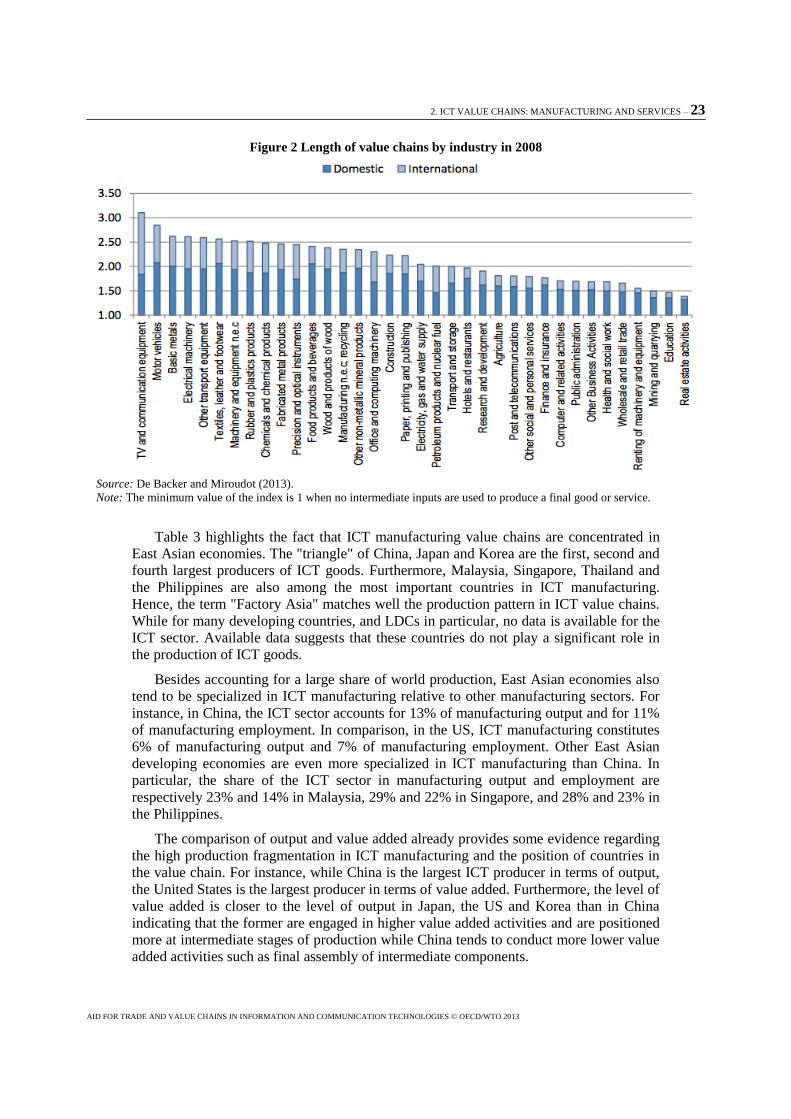
As a result of its modular nature, ICT manufacturing is among the industries where
the production process is the most fragmented internationally. Figure 2 shows an
indicator measuring the length, or "fragmentation" of industries, derived from the use of
domestic and foreign inputs in the production process. The ICT industry "TV and
communication equipment" is the most fragmented and the large contribution of
international inputs highlights the international dimension of the chain. The other two
ICT industries, "Precision and optical instruments" and "Office and computing
machinery", have a shorter length overall. However, the length of the value chain which
is due to traded intermediate inputs is still larger than for most other industries.
Since the indicator on the length of value chains is capturing backward linkages, it is
not surprising that the ICT services industries of "Post and telecommunications" and
"Computer and related services" have shorter lengths. As other services industries,
telecommunications and computer services tend to have more forward linkages, that is,
they constitute essential inputs for manufacturing or other services industries.
2. ICT VALUE CHAINS: MANUFACTURING AND SERVICES – 23
AID FOR TRADE AND VALUE CHAINS IN INFORMATION AND COMMUNICATION TECHNOLOGIES © OECD/WTO 2013
Figure 2 Length of value chains by industry in 2008
Source: De Backer and Miroudot (2013).
Note: The minimum value of the index is 1 when no intermediate inputs are used to produce a final good or service.
Table 3 highlights the fact that ICT manufacturing value chains are concentrated in
East Asian economies. The "triangle" of China, Japan and Korea are the first, second and
fourth largest producers of ICT goods. Furthermore, Malaysia, Singapore, Thailand and
the Philippines are also among the most important countries in ICT manufacturing.
Hence, the term "Factory Asia" matches well the production pattern in ICT value chains.
While for many developing countries, and LDCs in particular, no data is available for the
ICT sector. Available data suggests that these countries do not play a significant role in
the production of ICT goods.
Besides accounting for a large share of world production, East Asian economies also
tend to be specialized in ICT manufacturing relative to other manufacturing sectors. For
instance, in China, the ICT sector accounts for 13% of manufacturing output and for 11%
of manufacturing employment. In comparison, in the US, ICT manufacturing constitutes
6% of manufacturing output and 7% of manufacturing employment. Other East Asian
developing economies are even more specialized in ICT manufacturing than China. In
particular, the share of the ICT sector in manufacturing output and employment are
respectively 23% and 14% in Malaysia, 29% and 22% in Singapore, and 28% and 23% in
the Philippines.
The comparison of output and value added already provides some evidence regarding
the high production fragmentation in ICT manufacturing and the position of countries in
the value chain. For instance, while China is the largest ICT producer in terms of output,
the United States is the largest producer in terms of value added. Furthermore, the level of
value added is closer to the level of output in Japan, the US and Korea than in China
indicating that the former are engaged in higher value added activities and are positioned
more at intermediate stages of production while China tends to conduct more lower value
added activities such as final assembly of intermediate components.

24 – 2. ICT VALUE CHAINS: MANUFACTURING AND SERVICES
AID FOR TRADE AND VALUE CHAINS IN INFORMATION AND COMMUNICATION TECHNOLOGIES © OECD/WTO 2013
Table 3 Output, value added and employment in the ICT sector by country in 2008
Output Value added Employment
Country Million USD
Share in manuf. (%)
Million USD
Share in manuf. (%)
Number in Thousands
Share in manuf. (%)
China (2008/2007/2008) 851,393.0 12.8 143,515.7 11.1 8,607.0 10.6
Japan (2005) 360,113.6 13.4 115,752.4 12.3 827.4 11.0
United States of America 347,259.3 6.3 201,164.5 9.2 910.8 7.1
Republic of Korea (2006) 174,855.0 18.3 77,773.0 22.7 451.9 16.3
Germany 119,348.2 4.8 37,070.3 5.6 348.9 5.1
France 58,292.7 4.7 19,155.5 6.1 187.7 5.9
Malaysia 56,465.5 23.0 9,676.2 20.5 349.6 13.6
Singapore 53,648.2 28.8 10,409.4 31.2 96.9 22.3
Italy 43,736.8 3.1 11,564.8 3.6 134.3 3.5
United Kingdom (2008/2008/2007)
38,599.8 4.2 16,010.2 5.5 154.8 5.2
Finland 34,175.9 19.2 9,187.4 19.0 42.6 9.9
Thailand (2006) 27,787.4 14.4 7,581.9 16.3 354.8 9.3
Sweden 26,652.3 9.6 7,315.2 9.7 47.4 6.9
Hungary 25,097.7 19.5 2,859.6 9.9 70.2 9.5
India (2007) 20,999.6 3.3 3,888.0 3.0 244.9 2.4
Philippines (2006) 16,628.3 28.1 3,454.1 26.3 226.7 22.9
Spain 16,151.2 2.1 3,944.8 2.1 44.8 1.9
Poland 14,451.0 4.2 3,111.8 3.5 85.0 3.5
Netherlands 10,195.2 2.4 2,742.2 3.0 30.7 4.1
Belgium 9,336.8 2.5 2,951.6 4.0 20.2 3.6
Slovakia 8,774.9 12.1 1,021.1 8.9 31.7 7.1
Austria 7,987.7 3.5 2,898.9 4.2 25.9 4.1
Norway 6,579.3 5.1 2,195.2 5.9 12.6 4.6
Portugal 5,806.6 5.0 1,166.0 4.1 16.7 2.2
Indonesia 5,645.8 2.9 1,940.9 2.8 139.8 3.1
Denmark 4,476.7 3.2 1,643.9 3.7 15.4 4.0
Romania (2008/2007/2008) 3,713.3 3.8 702.4 3.7 31.6 2.2
Ukraine 1,867.9 1.5 n.a. n.a. 75.2 3.1
Iran 1,825.8 1.6 522.1 1.3 24.9 2.2
Greece (2007) 1,782.0 2.3 496.8 2.2 6.0 1.9
Malta (2008/2008/2007) 1,351.5 36.6 161.8 14.0 3.2 13.4
Slovenia (2007) 1,027.9 3.2 334.0 3.5 9.1 4.0
Egypt (2006/2005/2006) 804.3 2.3 208.0 2.5 18.3 1.8
Bulgaria (2007) 603.9 2.0 158.1 2.5 11.0 1.7
Peru (2007) 475.0 0.9 143.9 0.9 n.a. n.a.
Lithuania 468.4 1.9 124.3 3.0 5.0 2.2
Jordan 410.4 3.0 86.2 2.1 2.6 1.6
Oman (2006) 296.9 3.8 15.3 0.5 0.5 1.2
Kazakhstan (2007) 210.7 0.9 n.a. n.a. n.a. n.a.
Ecuador 125.5 0.6 21.8 0.3 0.6 0.4
FYR Macedonia 92.0 1.7 36.7 2.2 1.6 1.4
Sri Lanka (2006) 54.4 0.2 23.6 0.2 5.4 0.4
Republic of Moldova (2007) 33.3 1.9 n.a. n.a. n.a. n.a.
Azerbaijan 32.0 0.5 13.1 0.6 2.4 2.1
Armenia 20.7 1.2 n.a. n.a. n.a. n.a.
Kyrgyzstan 6.1 0.3 3.1 0.4 0.7 1.2
Lebanon (2007) 1.7 0.0 0.5 0.0 0.0 0.0
Source: WTO Secretariat, based on the UNIDO Industrial Statistics database (INDSTAT4).
Notes: Data in INDSTAT4 are available at the 4-digit level of the ISIC Rev. 3.1 classification. Table B.1 in Annex B shows the
OECD ICT sector definition for ISIC 3.1 used in the calculation for this Table.
2. ICT VALUE CHAINS: MANUFACTURING AND SERVICES – 25
AID FOR TRADE AND VALUE CHAINS IN INFORMATION AND COMMUNICATION TECHNOLOGIES © OECD/WTO 2013
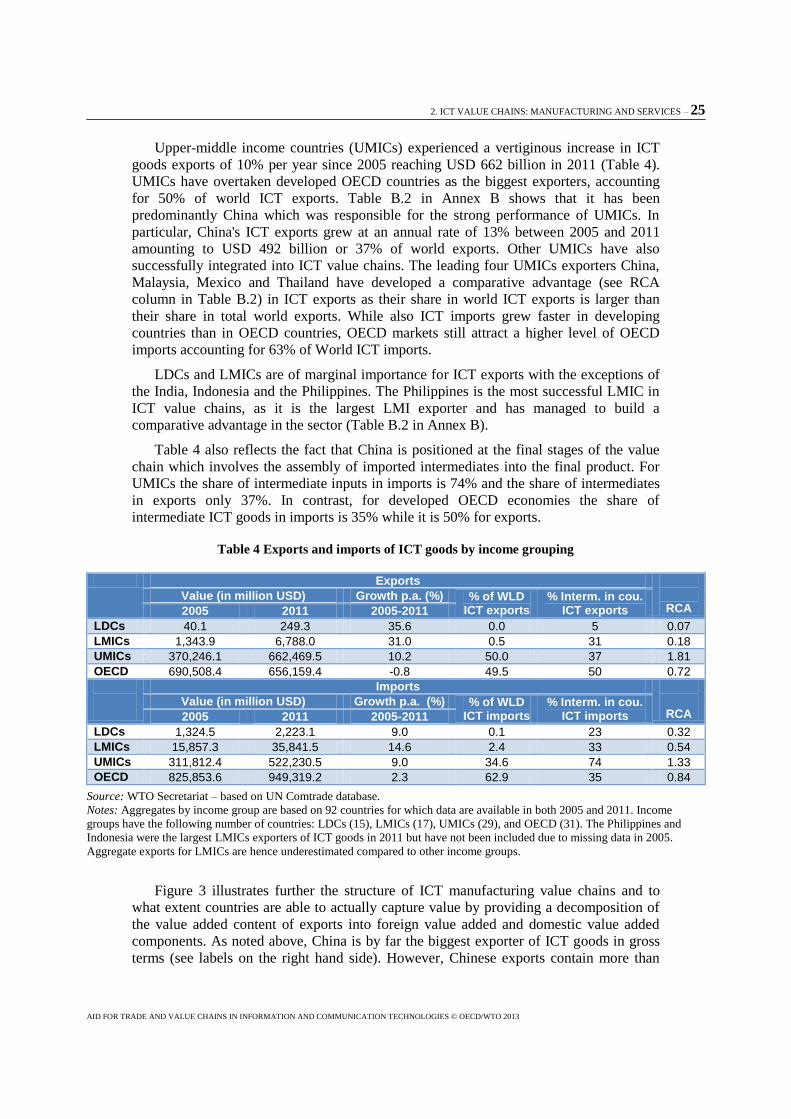
Upper-middle income countries (UMICs) experienced a vertiginous increase in ICT
goods exports of 10% per year since 2005 reaching USD 662 billion in 2011 (Table 4).
UMICs have overtaken developed OECD countries as the biggest exporters, accounting
for 50% of world ICT exports. Table B.2 in Annex B shows that it has been
predominantly China which was responsible for the strong performance of UMICs. In
particular, China's ICT exports grew at an annual rate of 13% between 2005 and 2011
amounting to USD 492 billion or 37% of world exports. Other UMICs have also
successfully integrated into ICT value chains. The leading four UMICs exporters China,
Malaysia, Mexico and Thailand have developed a comparative advantage (see RCA
column in Table B.2) in ICT exports as their share in world ICT exports is larger than
their share in total world exports. While also ICT imports grew faster in developing
countries than in OECD countries, OECD markets still attract a higher level of OECD
imports accounting for 63% of World ICT imports.
LDCs and LMICs are of marginal importance for ICT exports with the exceptions of
the India, Indonesia and the Philippines. The Philippines is the most successful LMIC in
ICT value chains, as it is the largest LMI exporter and has managed to build a
comparative advantage in the sector (Table B.2 in Annex B).
Table 4 also reflects the fact that China is positioned at the final stages of the value
chain which involves the assembly of imported intermediates into the final product. For
UMICs the share of intermediate inputs in imports is 74% and the share of intermediates
in exports only 37%. In contrast, for developed OECD economies the share of
intermediate ICT goods in imports is 35% while it is 50% for exports.
Table 4 Exports and imports of ICT goods by income grouping
Exports
RCA Value (in million USD) Growth p.a. (%) % of WLD
ICT exports % Interm. in cou.
ICT exports 2005 2011 2005-2011
LDCs 40.1 249.3 35.6 0.0 5 0.07
LMICs 1,343.9 6,788.0 31.0 0.5 31 0.18
UMICs 370,246.1 662,469.5 10.2 50.0 37 1.81
OECD 690,508.4 656,159.4 -0.8 49.5 50 0.72
Imports
RCA Value (in million USD) Growth p.a. (%) % of WLD
ICT imports % Interm. in cou.
ICT imports 2005 2011 2005-2011
LDCs 1,324.5 2,223.1 9.0 0.1 23 0.32
LMICs 15,857.3 35,841.5 14.6 2.4 33 0.54
UMICs 311,812.4 522,230.5 9.0 34.6 74 1.33
OECD 825,853.6 949,319.2 2.3 62.9 35 0.84
Source: WTO Secretariat – based on UN Comtrade database.
Notes: Aggregates by income group are based on 92 countries for which data are available in both 2005 and 2011. Income
groups have the following number of countries: LDCs (15), LMICs (17), UMICs (29), and OECD (31). The Philippines and
Indonesia were the largest LMICs exporters of ICT goods in 2011 but have not been included due to missing data in 2005.
Aggregate exports for LMICs are hence underestimated compared to other income groups.
Figure 3 illustrates further the structure of ICT manufacturing value chains and to
what extent countries are able to actually capture value by providing a decomposition of
the value added content of exports into foreign value added and domestic value added
components. As noted above, China is by far the biggest exporter of ICT goods in gross
terms (see labels on the right hand side). However, Chinese exports contain more than

26 – 2. ICT VALUE CHAINS: MANUFACTURING AND SERVICES
AID FOR TRADE AND VALUE CHAINS IN INFORMATION AND COMMUNICATION TECHNOLOGIES © OECD/WTO 2013
40% of foreign value stemming from imported goods and services that have been used as
inputs in the production process.
In contrast to China, Japan adds significantly more domestic value added to its ICT
exports. In particular, in Japan domestic value added accounts for almost 80% of ICT
exports, of which more than 30% stems from the ICT industry itself (domestic direct
VA), about 45% is value added provided through inputs of other Japanese industries
(domestic indirect VA) and a small fraction represents domestic value added that had
already been exported but has been re-imported in the form of intermediate inputs
(domestic re-imported VA).
Figure 3 Foreign and domestic value added shares content of ICT exports
Source: OECD-WTO Trade in Value Added (TiVA) database.
Notes: The data used represent the ISIC Rev. 3.1 industries 30 to 33, labelled as "Electrical and optical equipment" in the TiVA
database. These industries cover all ICT manufacturing (see Table B.1 in Annex B) but also few additional activities.
Trade Policy
The increasing interdependence and integration of economies fostered by value
chains requires a trade policy that reaches beyond pure market access policies. Many
regional trade agreements already reflect this new reality covering issues such as services,
non-tariff measures, competition policy or intellectual property (IP).
Nevertheless, trade costs and tariffs still have an important role to play. Since in value
chains intermediate goods cross borders several times before the final good reaches the
consumer, tariffs have a compounding effect so that changes in tariffs lead to a magnified
response of trade flows (Yi, 2003).
Tariffs on ICT products
Figure 4 shows average applied MFN tariffs for the overall ICT sector and for non-
agricultural products by income group and region. Tariffs on ICT goods are the highest in
1.2
7.3
10.8
22.7
23.6
28.7
30.1
31.1
33.4
41.5
53.0
53.3
53.8
73.7
130.0
147.1
161.5
194.7
476.9
0% 10% 20% 30% 40% 50% 60% 70% 80% 90% 100%
ZAF
BRA
IDN
CAN
SWE
CZE
IRL
FIN
HUN
ITA
CHE
FRA
GBR
MEX
KOR
DEU
USA
JPN
CHN
Foreign VA Domestic direct VA Domestic indirect VA Domestic re-imported VA Exports

2. ICT VALUE CHAINS: MANUFACTURING AND SERVICES – 27
AID FOR TRADE AND VALUE CHAINS IN INFORMATION AND COMMUNICATION TECHNOLOGIES © OECD/WTO 2013
LDCs and in Africa with about 12% each. On the other hand, OECD countries have
slashed their tariffs on ICT goods below 2%, also thanks to the WTO Information
Technology Agreement (ITA), which is described in Box 1. Tariffs on ICT products are
on average lower than tariffs on non-agricultural products for all income groups but
LDCs. Figure 5 shows applied MFN tariffs for ICT and disaggregated ICT product
categories by income group.
Figure 4 Average applied MFN tariffs for ICT products and for non-agricultural products
by income group and region
Source: WTO Secretariat, based on WTO schedules, CTS and IDB databases.
Notes: EU is treated as one country and assigned to OECD. Data on country tariffs are from 2011 or the latest
year available back to 2008 and are based on HS 2007 or on earlier HS versions for some countries. Annex A
details the country composition of income and regional groupings.
Figure 5 Average applied MFN tariffs by income group
Source: WTO Secretariat, based on WTO schedules, CTS and IDB databases.
Notes: EU is treated as one country and assigned to OECD. Data on country tariffs are from 2011 or the latest year
available back to 2008 and are based on HS 2007 or on earlier HS versions for some countries.
0
2
4
6
8
10
12
14
LDCs LMICs UMICs Africa America Asia Europe Oceania OECD
non-agricultural products
0
2
4
6
8
10
12
14
16
18
20
ICT A.Computers &peripheral eqpt
B.Communicationeqpt
C.Consumerelectronic eqpt.
D.ElectronicComponents
E.Miscellaneous
LDCs LMICs UMICs OECD
28 – 2. ICT VALUE CHAINS: MANUFACTURING AND SERVICES
AID FOR TRADE AND VALUE CHAINS IN INFORMATION AND COMMUNICATION TECHNOLOGIES © OECD/WTO 2013
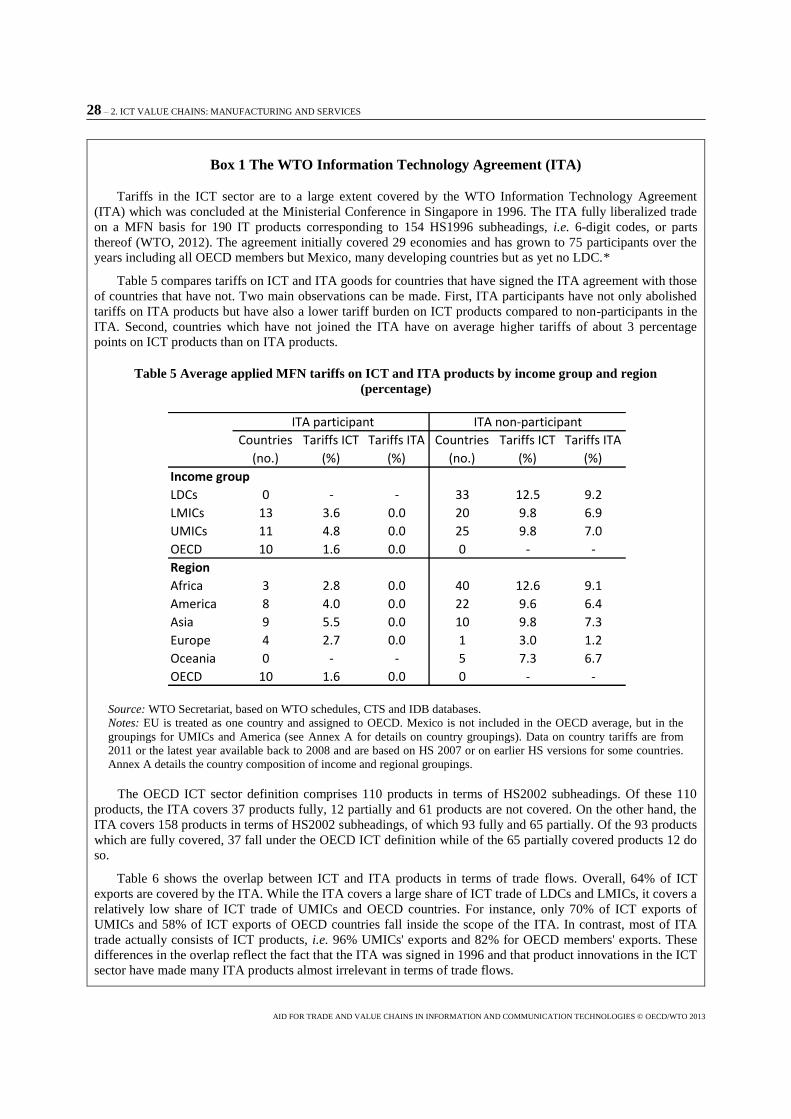
Box 1 The WTO Information Technology Agreement (ITA)
Tariffs in the ICT sector are to a large extent covered by the WTO Information Technology Agreement
(ITA) which was concluded at the Ministerial Conference in Singapore in 1996. The ITA fully liberalized trade
on a MFN basis for 190 IT products corresponding to 154 HS1996 subheadings, i.e. 6-digit codes, or parts
thereof (WTO, 2012). The agreement initially covered 29 economies and has grown to 75 participants over the
years including all OECD members but Mexico, many developing countries but as yet no LDC.*
Table 5 compares tariffs on ICT and ITA goods for countries that have signed the ITA agreement with those
of countries that have not. Two main observations can be made. First, ITA participants have not only abolished
tariffs on ITA products but have also a lower tariff burden on ICT products compared to non-participants in the
ITA. Second, countries which have not joined the ITA have on average higher tariffs of about 3 percentage
points on ICT products than on ITA products.
Table 5 Average applied MFN tariffs on ICT and ITA products by income group and region
(percentage)
Source: WTO Secretariat, based on WTO schedules, CTS and IDB databases.
Notes: EU is treated as one country and assigned to OECD. Mexico is not included in the OECD average, but in the
groupings for UMICs and America (see Annex A for details on country groupings). Data on country tariffs are from
2011 or the latest year available back to 2008 and are based on HS 2007 or on earlier HS versions for some countries.
Annex A details the country composition of income and regional groupings.
The OECD ICT sector definition comprises 110 products in terms of HS2002 subheadings. Of these 110
products, the ITA covers 37 products fully, 12 partially and 61 products are not covered. On the other hand, the
ITA covers 158 products in terms of HS2002 subheadings, of which 93 fully and 65 partially. Of the 93 products
which are fully covered, 37 fall under the OECD ICT definition while of the 65 partially covered products 12 do
so.
Table 6 shows the overlap between ICT and ITA products in terms of trade flows. Overall, 64% of ICT
exports are covered by the ITA. While the ITA covers a large share of ICT trade of LDCs and LMICs, it covers a
relatively low share of ICT trade of UMICs and OECD countries. For instance, only 70% of ICT exports of
UMICs and 58% of ICT exports of OECD countries fall inside the scope of the ITA. In contrast, most of ITA
trade actually consists of ICT products, i.e. 96% UMICs' exports and 82% for OECD members' exports. These
differences in the overlap reflect the fact that the ITA was signed in 1996 and that product innovations in the ICT
sector have made many ITA products almost irrelevant in terms of trade flows.
Countries
(no.)
Tariffs ICT
(%)
Tariffs ITA
(%)
Countries
(no.)
Tariffs ICT
(%)
Tariffs ITA
(%)
Income group
LDCs 0 - - 33 12.5 9.2
LMICs 13 3.6 0.0 20 9.8 6.9
UMICs 11 4.8 0.0 25 9.8 7.0
OECD 10 1.6 0.0 0 - -
Region
Africa 3 2.8 0.0 40 12.6 9.1
America 8 4.0 0.0 22 9.6 6.4
Asia 9 5.5 0.0 10 9.8 7.3
Europe 4 2.7 0.0 1 3.0 1.2
Oceania 0 - - 5 7.3 6.7
OECD 10 1.6 0.0 0 - -
ITA participant ITA non-participant

2. ICT VALUE CHAINS: MANUFACTURING AND SERVICES – 29
AID FOR TRADE AND VALUE CHAINS IN INFORMATION AND COMMUNICATION TECHNOLOGIES © OECD/WTO 2013
Table 6 Overlap between trade covered by the ICT definition and the ITA in 2011
Source: WTO Secretariat, based on UN Comtrade database.
Notes: The share of ICT trade covered by ITA reflects how much of ICT trade falls within the scope of the ITA in terms
of products and not how much ICT trade is actually traded duty-free under the ITA. Aggregates by income group are
based on 92 countries for which data are available in both 2005 and 2011. Income groups have the following number of
countries. LDCs (15), LMICs (17), UMICs (29), OECD (31). The Philippines and Indonesia were the largest LMICs
exporters of ICT goods in 2011 but have not been included due to missing data in 2005. Aggregate exports for LMICs
are hence underestimated compared to other income groups.
As a consequence of the substantial innovations in the ICT sector, a group of ITA participants have started
negotiations in order to update the ITA by expanding its product coverage to adapt the agreement to the current
technological environment. Furthermore, some proponents of an amended ITA would also like to introduce for
the first time commitments regarding non-tariff measures (NTMs) such as technical regulations and conformity
assessment procedures.
*ITA signatories: Albania, Australia, Bahrain, Canada, China, Colombia, Costa Rica, Croatia, Dominican Republic, Egypt,
El Salvador, European Communities (27 member states), Georgia, Guatemala, Honduras, Hong Kong, China, Iceland, India,
Indonesia, Israel, Japan, Jordan, Korea, Kuwait, Kyrgyz Republic, Macao, China, Malaysia, Mauritius, Moldova,
Montenegro, Morocco, New Zealand, Nicaragua, Norway, Oman, Panama, Peru, Philippines, Saudi Arabia, Singapore,
Switzerland, Chinese Taipei, Tajikistan, Thailand, Turkey, Ukraine, United Arab Emirates, United States, Viet Nam.
While some governments intend to raise revenues or to protect domestic companies
through import tariffs, there are at least three economic reasons why developing countries
should refrain from imposing high import tariffs on ICT goods. First, ICT firms will find
it more difficult to integrate into manufacturing value chains. Tariffs on imported
intermediates increase the production cost for domestic firms making them less
competitive compared to suppliers from countries with lower tariffs. This negative effect
has also been highlighted by ICT lead firms in the OECD-WTO questionnaire, where
more than a third of lead firms consider import duties a difficulty when bringing suppliers
from developing countries into their value chain.
Second, ICT products are required by ICT services firms and also by firms in other
manufacturing and services sectors as inputs for their activities. For instance,
telecommunications operators need communications equipment to run their network,
logistics companies need ICT technology to track shipments, managers need smartphones
to increase the efficiency of their communication activities and businesses need
computers and servers for their back-office activities and to control the production
process. Hence, the productivity of domestic firms is affected by the availability and costs
of imported ICT products.
Value
(mill. US$)
% covered
by ITA
Value
(mill. US$)
% covered
by ITA
Value
(mill. US$)
% covered
by ICT
Value
(mill. US$)
% covered
by ICT
LDCs 249 92 2,223 80 238 97 1,943 91
LMICs 6,788 87 35,841 76 6,530 91 29,312 93
UMICs 662,469 70 522,231 46 486,545 96 281,036 86
OECD 656,159 58 949,319 66 457,996 82 692,581 91
Total 1,325,666 64 1,509,614 60 951,309 89 1,004,872 90
ICT products ITA products
Exports Imports Exports Imports

30 – 2. ICT VALUE CHAINS: MANUFACTURING AND SERVICES
AID FOR TRADE AND VALUE CHAINS IN INFORMATION AND COMMUNICATION TECHNOLOGIES © OECD/WTO 2013
Third, low tariffs on ICT products benefit consumers by helping them to more easily
communicate, to access information and services and to increase the utility they draw
from their leisure time. Nonetheless, Figure 5 shows that tariffs on ICT products are
highest for consumer electronic equipment such as television sets and digital cameras
with averages being above 12% for LMICs and UMICs and above 18% for LDCs.
NTMs and trade facilitation
Since tariffs on ICT products are already relatively low, further trade reform would be
most beneficial in the fields of non-tariff measures and trade facilitation, which are of
particular importance for value chains. If NTMs such as technical regulations are
increasingly complex and differ across countries, firms might find it difficult to organize
their value chains across countries. Efforts to achieve some NTM commitments within
the ITA might offer some insights regarding future possibilities to multi-lateralize trade
rules relevant for value chains beyond market access and the existing disciplines of the
TBT Agreement.
Furthermore, trade facilitation measures can reduce trade costs by reducing shipping
times and by reducing the uncertainty regarding the arrival time. In the OECD-WTO
private sector questionnaire, customs procedures are one of the three most often
mentioned difficulties by both suppliers and lead companies. ICT value chains and trade
in intermediate goods are particularly sensitive to time since ICT products depreciate
quickly due to technological progress and since the production process is characterized by
few inventories and just-in-time delivery. Since the production of the final product
requires all intermediate inputs, a delay in shipping can put the production to a halt. For
instance, Gamberoni et al. (2010) demonstrates that the ability to export on time is an
important source of comparative advantage for intermediate goods.
ICT services
Production and trade patterns in ICT services chains
Value chains in ICT manufacturing have received increasing interest from
policymakers thanks to success stories of Asian economies and to illustrative examples
for smartphones and tablets. However, ICT services might be of greater importance to
developing countries as they often account for a larger share of value creation and offer
myriad possibilities to entrepreneurs. Figure 6 shows that for many countries
telecommunications and computer services generate significantly more value added than
ICT manufacturing. For instance, in Brazil manufacturing accounts for just above 10% of
ICT value added while telecommunication and computer services each account for more
than 40% of ICT value added.

2. ICT VALUE CHAINS: MANUFACTURING AND SERVICES – 31
AID FOR TRADE AND VALUE CHAINS IN INFORMATION AND COMMUNICATION TECHNOLOGIES © OECD/WTO 2013
Figure 6 Value added shares of ICT subsectors for selected economies, latest year
Source: UNCTAD (2011).
ICT services are characterized by strong upward linkages in the sense that they
constitute key inputs to the activities of other sectors. For instance, ICT technologies
allow the tracking and tracing of shipments in the transport and logistics chain and a
better management of intermodal transport. In the tourism value chain, ICTs allow
suppliers to advertise their services online and to offer the possibility of online booking to
potential clients. Hence, ICT services are essential for the efficiency of various services
and manufacturing value chains.
The development of a national software system and the software value chains can be
an important contributor to economic development as highlighted in the UNCTAD
Information Economy Report 2012 (UNCTAD, 2012b). Figure 7 shows a possible
development path for countries along the software value chain from software services
such as data entry and software development (e.g. analysis, design, maintenance) for the
domestic market to software services for the export market and the move from software
services to software products such as system software or application software.

32 – 2. ICT VALUE CHAINS: MANUFACTURING AND SERVICES
AID FOR TRADE AND VALUE CHAINS IN INFORMATION AND COMMUNICATION TECHNOLOGIES © OECD/WTO 2013
Figure 7 Possible development path along the software value chain
Source: Information Economy Report 2012 (UNCTAD, 2012b).
India is the most prominent success story of a developing country integrating into ICT
value chains by developing export-oriented software industries (UNCTAD, 2012b). India
has become the main destination for IT services offshoring (Figure 8) exporting software
and business process outsourcing services to the United States and the EU. India's success
has been facilitated by proactive policies, including the development of higher education
in engineering and technical professions, in addition to investments in institutions as well
as physical ICT infrastructure, such as centers of excellence or software technology
parks.
Figure 8 Global market for IT services offshoring by destination in 2011
Source: Information Economy Report 2012 (UNCTAD, 2012b).

2. ICT VALUE CHAINS: MANUFACTURING AND SERVICES – 33
AID FOR TRADE AND VALUE CHAINS IN INFORMATION AND COMMUNICATION TECHNOLOGIES © OECD/WTO 2013
The success of India and other countries such as the Philippines are further
highlighted by their trade performance. Table 7 provides trade indicators for the top five
exporters by income group for computer services, which covers hardware- and software-
related services and data-processing services1.
India exported USD 33 billion of computer services in 2009 accounting for about
20% of world exports. India is also highly specialized in computer services exports. The
revealed comparative advantage (RCA) measure of 5.49 indicates that its world market
share in computer services exports is 5.49 times higher than its share in total services
exports.
A second key development is that computer services exports in LMICs and UMICs
have been growing at much higher rates than in OECD countries. Growth has been
particularly high in the Philippines with exports growing from USD 89 million in 2005 at
an annual rate of 85% to USD 1.9 billion in 2010 building up a comparative advantage in
computer services. Similar success stories can be observed for the two upper-middle
income countries in Latin America, namely Argentina and Costa Rica. Starting at similar
levels in 2005, Argentina and Costa Rica experienced an average yearly growth rate of
more than 35% from 2005 onwards so that both countries exported more than USD 1.2
billion in 2010. Furthermore, RCA indices of 1.79 for Argentina and in particular 5.28 for
Costa Rica indicate that both countries are specialized and hence competitive in computer
services exports.
1 Table B.4 in Annex B provides data for more countries.

34 – 2. ICT VALUE CHAINS: MANUFACTURING AND SERVICES
AID FOR TRADE AND VALUE CHAINS IN INFORMATION AND COMMUNICATION TECHNOLOGIES © OECD/WTO 2013
Table 7 Top five exporters of computer services by income group
Exports Imports
Value ('000 USD) Growth
p.a. (%)
Share (%)
RCA Value ('000 USD) Growth
p.a. (%)
Share (%)
RCA
2005 2010 2005-2010
2010 2010 2005 2010 2005-2010
2010 2010
Least developed countries (LDCs)
Bangladesh 18,557 37,440 15 0.02 0.58 3,792 4,873 5 0.01 0.04
Uganda 32,825 37,407 3 0.02 0.67 22,191 32,579 8 0.04 0.53
Mozambique 121 5,237 112 0.00 0.17 2,659 691 -24 0.00 0.02
Tanzania 265 4,634 77 0.00 0.04 4,597 9,561 16 0.01 0.16
Samoa n.a. 972 n.a. 0.00 0.11 n.a. n.a. n.a. n.a. n.a.
Lower-middle income countries (LMIs)
India (exp.: 2009) n.a. 33,383,179 n.a. 20.35 5.49 1,048,870 2,175,840 16 2.70 0.57
Philippines 89,000 1,928,000 85 1.18 2.55 62,000 109,000 12 0.14 0.30
Morocco n.a. 289,781 n.a. 0.18 0.45 n.a. 60,674 n.a. 0.08 0.32
Sri Lanka 82,470 265,000 26 0.16 2.02 n.a. n.a. n.a. n.a. n.a.
Pakistan 59,000 192,000 27 0.12 1.22 30,000 161,000 40 0.20 0.75
Upper-middle income countries (UMIs)
Malaysia (exp./imp.: 2009) 435,260 1,453,770 35 0.89 0.77 379,295 1,206,030 34 1.50 1.31
Argentina 235,210 1,237,340 39 0.75 1.79 190,730 445,356 18 0.55 0.98
Costa Rica 254,378 1,216,190 37 0.74 5.28 10,721 20,844 14 0.03 0.35
Belarus 24,700 217,700 55 0.13 0.91 9,000 45,600 38 0.06 0.48
Brazil 80,223 195,100 19 0.12 0.12 1,656,840 3,414,480 16 4.24 1.73
OECD Members (high income)
Ireland 19,369,000 37,196,458 14 22.67 7.14 378,053 752,273 15 0.93 0.21
Germany 8,415,411 16,304,988 14 9.94 1.31 8,587,027 14,066,711 10 17.47 1.62
United Kingdom 8,476,394 9,952,424 3 6.07 0.75 3,330,921 5,256,661 10 6.53 0.99
United States 3,554,000 8,771,000 20 5.35 0.31 2,000,000 18,394,000 56 22.84 1.50
Israel 4,528,500 7,699,500 11 4.69 5.94 n.a. n.a. n.a. n.a. n.a.
Source: WTO Secretariat, based on WTO Trade in Services database.
Note: RCA (revealed comparative advantage) is defined as the ratio of a country's world market share in computer services
exports (imports) to its world market share in total services exports (imports).
Cross-border trade in telecommunication services covers mainly the transmission of
sounds, images and other information through telephone, television and satellites. Table 8
provides exports and imports indicators of telecommunication services by income group.
Most noteworthy is that with 19% yearly export growth and 23% yearly import growth,
LDCs have experienced on average significantly higher trade growth than richer
countries. Furthermore, LDCs have a revealed comparative advantage in exporting
telecommunication services. The increasing participation of LDCs in telecommunication
services reflects the positive developments in ICT infrastructure and access highlighted in
Section C.1.
Table B.3 in Annex B provides country detail. Most LDCs export more
telecommunication services than they import, implying predominance of incoming over
outgoing transmissions, e.g. through phone calls from migrants living abroad and foreign
businesses.

2. ICT VALUE CHAINS: MANUFACTURING AND SERVICES – 35
AID FOR TRADE AND VALUE CHAINS IN INFORMATION AND COMMUNICATION TECHNOLOGIES © OECD/WTO 2013
Table 8 Exports and imports of telecommunication services by income group
Exports Imports
Value ('000 USD) Growth p.a. (%)
Share (%)
RCA Value ('000 USD) Growth p.a. (%)
Share (%)
RCA
2005 2010 2005-2010 2010 2010 2005 2010 2005-2010 2010 2010
LDCs 446,724 1,274,509 23 2.51 3.64 258,472 890,328 28 1.99 0.95
LMICs 2,970,312 3,840,004 5 7.57 0.92 912,763 2,033,920 17 4.55 0.49
UMICs 3,065,424 4,037,498 6 7.95 0.99 1,755,222 3,072,279 12 6.87 0.61
OECD 23,669,432 41,606,354 12 81.97 0.99 24,138,680 38,702,781 10 86.58 1.12
Source: WTO Secretariat, based on WTO Trade in Services database.
Notes: Only countries with data available in both 2005 and 2010 were used in calculating trade by income group. Income groups
have the following number of countries. Exports: LDCs (24), LMICs (24), UMICs (25), OECD (22). Imports: LDCs (23),
LMICs (22), UMICs (23), OECD (21). RCA is defined as the ratio of a country's world market share in telecommunication
services exports (imports) to its world market share in total services exports (imports).
Regulation and trade policy in telecommunications
Liberalization and regulation in the telecommunications market
Access to affordable telecommunication services is crucial for the productivity of
domestic companies, their possibility to form and integrate into value chains and the
economic development of countries. Telecommunications regulation plays an important
role for promoting universal access, ensuring competition and bringing down prices.
The rapid progress in ICT technology has been accompanied by a successful trend in
telecommunications liberalization over the last two decades. Figure 9 shows that starting
from the mid-1990s more and more countries have privatized their state-owned
incumbent operators, established independent regulators, and introduced competition by
allowing new entrants to challenge the incumbent monopolist.
Figure 9 Advances in telecommunication liberalization and reform since 1990
Source: ITU Telecommunications/ICT Regulatory database.
The vast majority of countries have introduced full competition in
telecommunications markets by allowing any company to apply for a licence and by
setting no limits on the number of licences available. (Table 9). Countries from the
0
20
40
60
80
100
120
140
160
180
1990 1995 1998 2000 2002 2004 2006 2008 2010 2012
Nu
mb
er
of
co
un
trie
s
Regulators
Competition
Privatization
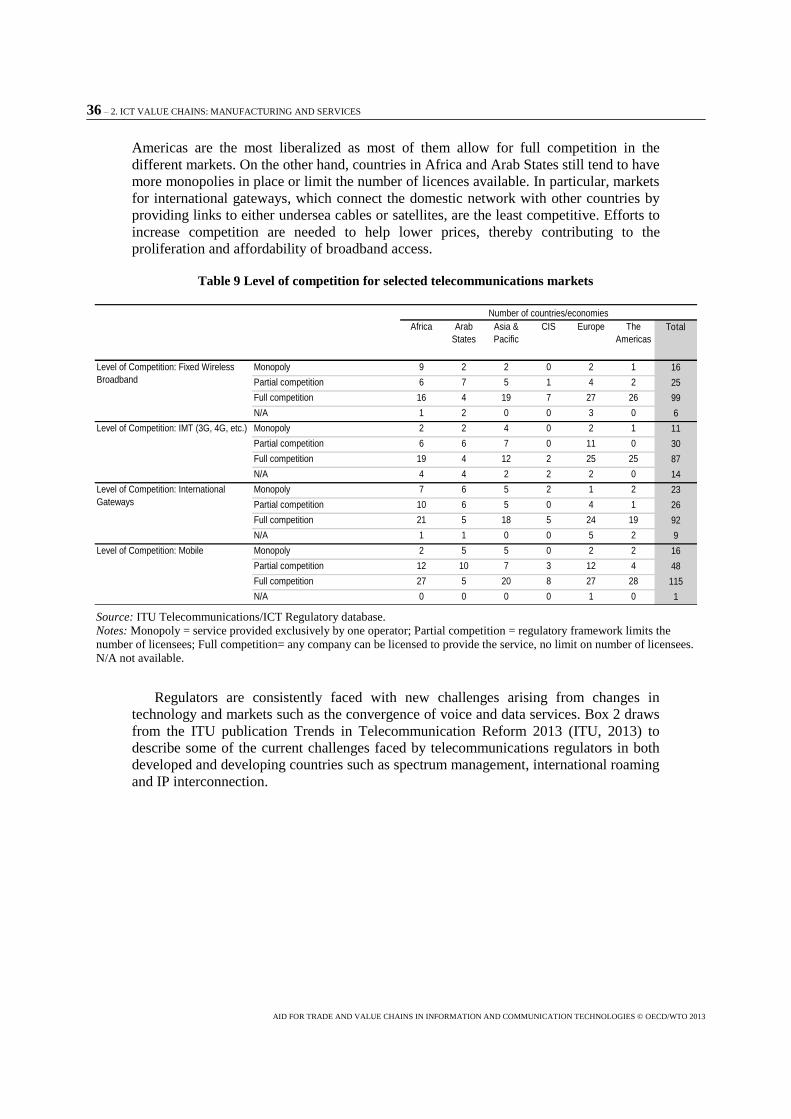
36 – 2. ICT VALUE CHAINS: MANUFACTURING AND SERVICES
AID FOR TRADE AND VALUE CHAINS IN INFORMATION AND COMMUNICATION TECHNOLOGIES © OECD/WTO 2013
Americas are the most liberalized as most of them allow for full competition in the
different markets. On the other hand, countries in Africa and Arab States still tend to have
more monopolies in place or limit the number of licences available. In particular, markets
for international gateways, which connect the domestic network with other countries by
providing links to either undersea cables or satellites, are the least competitive. Efforts to
increase competition are needed to help lower prices, thereby contributing to the
proliferation and affordability of broadband access.
Table 9 Level of competition for selected telecommunications markets
Source: ITU Telecommunications/ICT Regulatory database.
Notes: Monopoly = service provided exclusively by one operator; Partial competition = regulatory framework limits the
number of licensees; Full competition= any company can be licensed to provide the service, no limit on number of licensees.
N/A not available.
Regulators are consistently faced with new challenges arising from changes in
technology and markets such as the convergence of voice and data services. Box 2 draws
from the ITU publication Trends in Telecommunication Reform 2013 (ITU, 2013) to
describe some of the current challenges faced by telecommunications regulators in both
developed and developing countries such as spectrum management, international roaming
and IP interconnection.
Africa Arab
States
Asia &
Pacific
CIS Europe The
Americas
Total
Monopoly 9 2 2 0 2 1 16
Partial competition 6 7 5 1 4 2 25
Full competition 16 4 19 7 27 26 99
N/A 1 2 0 0 3 0 6
Monopoly 2 2 4 0 2 1 11
Partial competition 6 6 7 0 11 0 30
Full competition 19 4 12 2 25 25 87
N/A 4 4 2 2 2 0 14
Monopoly 7 6 5 2 1 2 23
Partial competition 10 6 5 0 4 1 26
Full competition 21 5 18 5 24 19 92
N/A 1 1 0 0 5 2 9
Monopoly 2 5 5 0 2 2 16
Partial competition 12 10 7 3 12 4 48
Full competition 27 5 20 8 27 28 115
N/A 0 0 0 0 1 0 1
Level of Competition: Mobile
Level of Competition: Fixed Wireless
Broadband
Level of Competition: IMT (3G, 4G, etc.)
Level of Competition: International
Gateways
Number of countries/economies

2. ICT VALUE CHAINS: MANUFACTURING AND SERVICES – 37
AID FOR TRADE AND VALUE CHAINS IN INFORMATION AND COMMUNICATION TECHNOLOGIES © OECD/WTO 2013
Box 2 Trends in telecommunication reform
The technological advancement in the ICT sector and its network structure imply that developing and
developed countries face similar challenges in terms of policy.
Current regulatory trends and challenges are described in Trends in Telecommunication Reform 2013 (ITU,
2013) and include among others the search for new spectrum. Spectrum management is especially relevant for
developing countries for which wireless technology is more important than fixed lines to provide the population
with broadband access.
Another remaining challenge is the high prices for international roaming which do not reflect the costs of the
operator. International roaming is of particular importance to services trade if the service is supplied through the
temporary movement of natural persons, i.e. GATS mode 4.*
A third trend is the increasing relevance of efficient internet protocol (IP) interconnection arising from the
growing traffic and services provided through the internet. The growth of the internet has been fostered by
investments into internet exchange points (IXPs), content delivery networks (CDNs) and long-haul facilities
such as undersea cables (see Section C for trends in broadband access). So far the development of global and
regional IP interconnection has been subject to little regulation. Given the technological convergence between
mostly unregulated IP interconnection and traffic and the regulated traditional voice telecommunication, both
firms and regulators face new challenges.
The experiences with unregulated IP markets has been more positive so far as prices for unregulated IP
traffic is by some magnitudes lower than prices for traffic in regulated circuit switched voice (TDM) markets.
Also while, in traditional TDM market regulators imposed an obligation to interconnect in order to guard against
discrimination and anti-competitive behaviour, in IP markets almost all interconnection agreements are informal
hand-shake agreements (ITU, 2012c). While the case for the regulator to intervene seems rather weak and
possibly limited in developed economies, the regulator might play a more active role in developing countries in
the short-term (ITU, 2012c). In particular, in some developing countries the incumbent operator might still have
enough market power to prevent the development of a domestic market.
*International roaming and its relations to the WTO GATS commitments has been discussed at the WTO symposium on
international mobile roaming: www.wto.org/english/tratop_e/serv_e/sym_march12_e/sym_march12_e.htm
Regulatory agencies in developing countries can be quite fragile, under-resourced or
lack political backing. Aid for trade can help regulators in developing countries by
providing support to their policy making and capacity building. Box 3 describes in detail
an EU-ITU project to support harmonized policies in countries belonging to the African
Caribbean and Pacific group of states (ACP).

38 – 2. ICT VALUE CHAINS: MANUFACTURING AND SERVICES
AID FOR TRADE AND VALUE CHAINS IN INFORMATION AND COMMUNICATION TECHNOLOGIES © OECD/WTO 2013
Box 3 Support for the establishment of harmonized policies for the ICT market in ACP
countries
This development Action, implemented by the ITU and financed by the EU (EUR 8 million) and the ITU
(EUR 0.5 million), addresses the ICT policies and legislation challenges facing the countries belonging to the
African Caribbean and Pacific group of states (ACP). It aims at contributing to the creation of an environment
conducive to investments in ICT infrastructure and ICT-enabled applications. The Action started in September
2008 and is planned to end in September 2013.
Objectives
In particular, the Action has three key aims:
To support regional organizations and the sub-regional economic groupings to develop and promote
the use of harmonized ICT policies and legislation
To support individual ACP countries to transpose these regional policies and legislations into their
own national framework
To provide human and institutional capacity building so that local competences are developed and
existing knowledge is shared across all beneficiary countries.
Three regional projects
The Action consists of the following three regional projects, which have been customized to each region’s
specific needs:
1. Enhancing Competitiveness in the Caribbean through the Harmonization of ICT Policies, Legislation
and Regulatory Procedures (HIPCAR);
2. Support for Harmonization of the ICT Policies in Sub-Saharan Africa (HIPSSA);
3. Capacity Building and ICT Policy, Regulatory and Legislative Frameworks Support for Pacific Island
Countries (ICB4PAC).
The methodological approach is broadly the same for the three projects allowing for regional variations and
will be illustrated using the HIPCAR project for the Caribbean ACP countries.
1. Enhancing Competitiveness in the Caribbean through the Harmonization of ICT Policies,
Legislation and Regulatory Procedures (HIPCAR)
Background
The project covers all 15 Caribbean countries in the ACP group of states* and is being implemented within
the framework of the Caribbean Single Market and Economy (CSME) and the CARICOM Connectivity Agenda.
The ITU is the executing agency and the Caribbean Telecommunications Union (CTU) is the project advisor on
behalf of the CARICOM secretariat.
In 1989, the CARICOM heads of government decided to establish the CSME, which came into force on 1
January 2006. In most CARICOM Member States, telecommunications laws were enacted between 1999 and
2002. They have taken the necessary steps to establish regulatory bodies and dismantle the existing monopolies.
However, full liberalization is limited and differs across the Member States. One of the CSME’s goals is to
liberalize the telecommunications sector which requires removing barriers to trade and to harmonize policies,
legislation and regulatory processes so that there is a greater degree of consistency across the Caribbean.

2. ICT VALUE CHAINS: MANUFACTURING AND SERVICES – 39
AID FOR TRADE AND VALUE CHAINS IN INFORMATION AND COMMUNICATION TECHNOLOGIES © OECD/WTO 2013
Project methodology and activities
The project has been launched in Grenada in 2008 with a multi-stakeholder kick-off meeting where the
following list of priorities common to all beneficiary countries was adopted:
1. ICT legislative framework – information society issues
i) e-commerce – transaction; ii) e-commerce – evidence; iii) access to public information (freedom of
information (FOI)); iv) privacy and data protection; v) cybercrime (e-crimes) and v) interception of
communications.
2. Review of the telecommunications acts:
i) universal service/access framework; ii) interconnection; iii) licensing in a convergent environment.
In a second step, an assessment of the current situation for each priority was made, taking into account
outcomes of previous initiatives and identifying regional as well as international best practices. The assessment
results were then used to develop draft regional model policies for each of the identified priority areas. These
documents were reviewed, discussed and adopted by at two regional workshops: the telecommunications acts
meeting (Port of Spain, October 2009); and the ICT legislative framework – information society issues meeting
(St. Lucia, March 2010).
After the discussion and adoption of these regional model policies at two workshops by stakeholders, draft
regional model legislations were developed. These were reviewed, discussed and adopted by at three regional
workshops: the telecommunications meeting (Paramaribo, April 2010); and the ICT legislative framework –
information society issues meetings (St. Kitts and Nevis, July 2010 and Barbados, August 2010).
After the regional model policy guidelines and legislations were prepared, the final phase of the project
started in January 2011 which consists in the transposition of the regional guidelines into national legislative and
regulatory frameworks. In particular, the project team has been providing in-country assistance for the
transposition of the model texts by i) comparing regional guidelines with national policies and legislation, ii)
recommending amendments to national policies and legislation, iii) carrying out consultations with national
stakeholders and iv) providing capacity-building activities for national stakeholders.
Project success factors
In order to ensure the development impact the three projects move away from the traditional ‘one-size-fits-
all’ approach and put regional and national stakeholders are at the heart of the project, from the initial kick-off
meeting to the final stages, giving advice and monitoring progress. Besides stakeholder participation, a second
success factor is to link the substance of policy and legislation with capacity building through in-country
technical assistance (transposition and implementation of regional policies and legislation in the respective
national frameworks) and training of stakeholders. From the outset, the learning of other relevant development
projects has been incorporated. The project has also looked to the future and offered locally based capacity-
building programs that will give the beneficiary countries the skills they need to effectively implement and
manage the project’s outcomes at a local level.
Source: ITU summary report and project website:Error! Hyperlink reference not valid.
*The beneficiary countries of the HIPCAR project are Antigua and Barbuda, The Bahamas, Barbados, Belize, The
Commonwealth of Dominica, the Dominican Republic, Grenada, Guyana, Haiti, Jamaica, St. Kitts and Nevis, St. Lucia, St.
Vincent and the Grenadines, Suriname, and Trinidad and Tobago.
Trade barriers
The WTO General Agreement on Trade in Services (GATS) covers market access
and national treatment restrictions applying to telecommunication services and computer
and related services. By 2009, 109 countries or more than two-thirds of all WTO
Members have made commitments in telecommunications services which is third highest
number of commitments after tourism and financial services (WTO, 2009a). However, as

40 – 2. ICT VALUE CHAINS: MANUFACTURING AND SERVICES
AID FOR TRADE AND VALUE CHAINS IN INFORMATION AND COMMUNICATION TECHNOLOGIES © OECD/WTO 2013
telecommunication services have experienced significant developments in terms of
technology and regulatory environment some commitments no longer reflect actual
regimes, which can be considerably more open or were opened without commitments,
and uncertainties exist regarding the coverage and interpretation of commitments.
While developing countries have significantly liberalized their telecommunications
sectors, still a significant number of countries maintain restrictions regarding the supply
of services through a commercial presence, i.e. mode 3 in GATS terminology. In
particular, according to the World Bank services trade restrictions database only about 40
out of 103 countries were fully open to the establishment of commercial presence by
foreign providers (Borchert et al., 2012).2 In particular, a few countries still maintain
significant government discretion regarding licences and entry of foreign firms such as at
least one country in South Asia and some African countries.
Restrictions on foreign ownership have become less widespread due to the
liberalization efforts in many countries. Out of 125 countries, 87 countries, or 70% of
countries, have no restriction on foreign ownership in place. Figure 10 shows that FDI
restrictions are still most common in the Arab States and in Asia & Pacific with
respectively 8 and 11 countries still having restrictions in place. Removal of foreign
ownership restrictions is also an example of an area in which GATS commitments no
longer reflect actual liberalization in place.
Figure 10 Percentage of countries with no foreign ownership restrictions in telecommunications
Source: ITU Telecommunication/ICT Regulatory database.
Notes: Regional groupings follow ITU. For Africa, the percentage of countries with no foreign ownership
restriction is based on 27 out of 44 countries that provided data. For the other regions, information is
available for the following number of countries: Arab States (13/21), Asia & Pacific (23/30), Commonwealth
of Independent States (CIS) (5/12), Europe (30/43), the Americas (27/35).
2 The database is accessible online at: http://iresearch.worldbank.org/servicetrade/.
0
10
20
30
40
50
60
70
80
90
100
Africa Arab States Asia & Pacific CIS Europe The Americas
%

3. ICT INFRASTRUCTURE AND ACCESS – 41
AID FOR TRADE AND VALUE CHAINS IN INFORMATION AND COMMUNICATION TECHNOLOGIES © OECD/WTO 2013
3. ICT infrastructure and access
Infrastructure access
The spread of mobile telephony has been a success story for developing countries
(Figure 11). Mobile phone subscriptions per 100 inhabitants in LDCs increased more than
sevenfold from 7 in 2005 to 52 in 2012. LMICs and UMICs experienced similar increases
in mobile phone penetration with UMICs now having more mobile subscriptions per 100
inhabitants than OECD countries. Nevertheless, LDCs still lag significantly behind,
which is also reflected by the relatively low penetration rates in Oceania and Africa.
Figure 11 Mobile phone subscriptions per 100 inhabitants by income group and region
Source: ITU World Telecommunication/ICT Indicators database. Annex A details the country composition of income and
regional groupings.
The possibility to access and use the internet is essential for the development of e-
commerce and for integrating into ICT value chains. Figure 12 shows that more
individuals use the internet than in 2005 but overall levels of internet use still remain
rather low. Only 8 out of 100 individuals use the internet in LDCs and only 24 in LMICs.
The low internet use in developing countries is also linked to the limited availability of
fixed line networks. That is why much hope is connected to mobile technology and its
potential to bring people online.
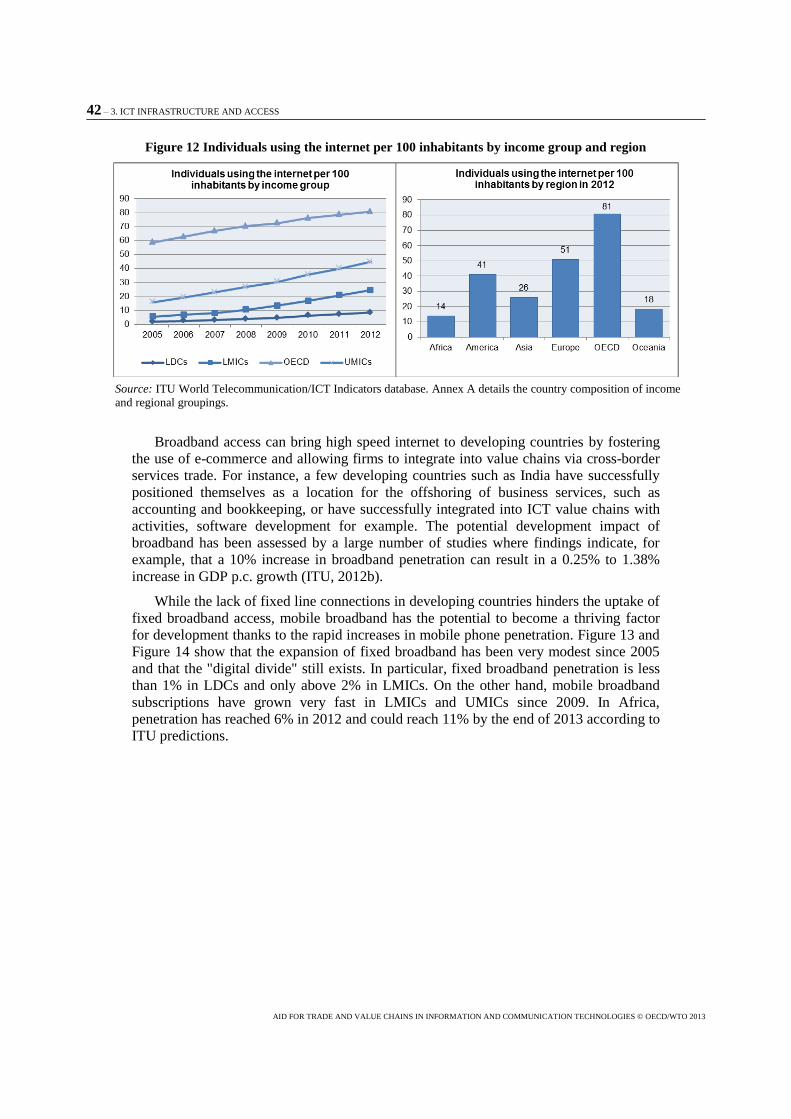
42 – 3. ICT INFRASTRUCTURE AND ACCESS
AID FOR TRADE AND VALUE CHAINS IN INFORMATION AND COMMUNICATION TECHNOLOGIES © OECD/WTO 2013
Figure 12 Individuals using the internet per 100 inhabitants by income group and region
Source: ITU World Telecommunication/ICT Indicators database. Annex A details the country composition of income
and regional groupings.
Broadband access can bring high speed internet to developing countries by fostering
the use of e-commerce and allowing firms to integrate into value chains via cross-border
services trade. For instance, a few developing countries such as India have successfully
positioned themselves as a location for the offshoring of business services, such as
accounting and bookkeeping, or have successfully integrated into ICT value chains with
activities, software development for example. The potential development impact of
broadband has been assessed by a large number of studies where findings indicate, for
example, that a 10% increase in broadband penetration can result in a 0.25% to 1.38%
increase in GDP p.c. growth (ITU, 2012b).
While the lack of fixed line connections in developing countries hinders the uptake of
fixed broadband access, mobile broadband has the potential to become a thriving factor
for development thanks to the rapid increases in mobile phone penetration. Figure 13 and
Figure 14 show that the expansion of fixed broadband has been very modest since 2005
and that the "digital divide" still exists. In particular, fixed broadband penetration is less
than 1% in LDCs and only above 2% in LMICs. On the other hand, mobile broadband
subscriptions have grown very fast in LMICs and UMICs since 2009. In Africa,
penetration has reached 6% in 2012 and could reach 11% by the end of 2013 according to
ITU predictions.

3. ICT INFRASTRUCTURE AND ACCESS – 43
AID FOR TRADE AND VALUE CHAINS IN INFORMATION AND COMMUNICATION TECHNOLOGIES © OECD/WTO 2013
Figure 13 Fixed and mobile broadband subscriptions per 100 inhabitants by income group
Source: ITU World Telecommunication/ICT Indicators database. Annex A details the country composition of income and
regional groupings.
Figure 14 Fixed and mobile broadband subscriptions per 100 inhabitants by region in 2011
Source: ITU World Telecommunication/ICT Indicators database. Annex A details the country composition of income and
regional groupings.
Table 10 highlights the 39 least connected countries (LCCs) for which the "digital
divide", in terms of ICT access, usage and skills is greatest in 2011 (ITU, 2012a). The
group of LCCs consists of 31 LDCs and 8 LMICs such as India, Pakistan, Nigeria and
Ghana. The majority of LCCs, i.e. 29, are African countries, while 8 LCCs are in Asia
and two in Oceania.

44 – 3. ICT INFRASTRUCTURE AND ACCESS
AID FOR TRADE AND VALUE CHAINS IN INFORMATION AND COMMUNICATION TECHNOLOGIES © OECD/WTO 2013
Table 10 The 39 least connected countries in terms of the ICT Development Index (IDI) 2011
Country IDI Country IDI Country IDI Country IDI
Ghana 2.23 Pakistan 1.75 Nepal 1.63 Mozambique 1.28
Bhutan 2.13 Djibouti 1.74 Cameroon 1.60 Guinea 1.28
India 2.10 Côte d'Ivoire 1.69 Tanzania 1.60 Liberia 1.26
Lao P.D.R. 1.99 Comoros 1.68 Congo 1.60 Ethiopia 1.15
Cambodia 1.96 Myanmar 1.67 Benin 1.55 Burkina Faso 1.14
Nigeria 1.93 Uganda 1.67 Papua New Guinea 1.44 Eritrea 1.09
Solomon Islands
1.85 Rwanda 1.66 Madagascar 1.44 Central African Rep.
0.97
Senegal 1.85 Togo 1.65 Malawi 1.42 Chad 0.94
Gambia 1.84 Zambia 1.65 Mali 1.38 Niger 0.88
Yemen 1.76 Mauritania 1.64 Congo (Dem. Rep.) 1.30
Source: ITU (2012a).
Notes: The IDI is a composite index produced by the ITU for 155 countries. It covers 11 indicators grouped by three ICT
sub-indices, i.e. access, use and skills. The IDI ranges from 0 to 10 with scores increasing in ICT development.
Broadband – the next step in ICT development
After the diffusion of mobile technology in developing countries, developing
countries face the challenge of ensuring the proliferation of broadband access.
Recognizing the importance of broadband access for achieving the Millennium
Development Goals (MDGs), the ITU and UNESCO established the Broadband
Commission for Digital Development in 2010 It consists of senior policy makers and
industry leaders with the aim of boosting the importance of broadband on the
international policy agenda.
At its fourth meeting in Geneva 2011, the broadband commission set four broadband
targets the world should achieve by 2015 (ITU, 2012a). These four targets are: 1) making
broadband policy universal by establishing broadband plans and definitions; 2) making
broadband affordable with prices below 5% of a country's GNI p.c.; 3) connecting homes
to broadband by providing internet access to 40% of households; and 4) getting people
online so that worldwide internet penetration reaches 60%.
Demand for bandwidth has grown rapidly over the last decade. Since 2002,
international bandwidth capacity has increased more than 49-fold. Between 2007 and
2011, growth has been highest in Africa, Latin America, and the Middle East with
compound annual growth rates of more than 70%. This growing demand has been
matched by significant investments in the upgrade and construction of undersea cables.
Since 2007, most of the growth in lit capacity has actually come from upgrades of
existing cable systems, while new investment have made significant contributions to
increased capacities in Sub-Saharan Africa between Europe and Asia and across the
Pacific.
According to TeleGeography, 47 new cable systems worth USD 7.9 billion were
launched between 2008 and 2011, 15 cables were expected to be launched in 2012 and a
further nine in 2013. While the greatest numbers of undersea cable projects are currently
carried out in Asia, Figure 15 shows that project costs are highest in Africa, which is in
part due to the length of the cables. Box 4 provides some more detail on the development

3. ICT INFRASTRUCTURE AND ACCESS – 45
AID FOR TRADE AND VALUE CHAINS IN INFORMATION AND COMMUNICATION TECHNOLOGIES © OECD/WTO 2013
of African undersea cables and illustrates the positive role development finance can play
taking the successful public private partnership for the EASSy undersea cable taken as an
example.
Figure 15 Construction costs of new undersea cables entering service by region, 2011-2013
Source: TeleGeography.
$0.0 $0.5 $1.0 $1.5 $2.0 $2.5 $3.0
Trans-Pacific
Trans-Atlantic
Oceania
Middle East
Mediterranean
Latin America & Caribbean
Europe-Asia
Europe
Asia
Africa
Construction Costs (USD billion)

46 – 3. ICT INFRASTRUCTURE AND ACCESS
AID FOR TRADE AND VALUE CHAINS IN INFORMATION AND COMMUNICATION TECHNOLOGIES © OECD/WTO 2013
Box 4 Undersea cables in Africa
Broadband connectivity has the potential to have a significant positive long-term economic impact on the
African continent. As part of its broadband transition, ICT infrastructure in Africa has experienced substantial
developments after the first submarine undersea cable went live in 1999. The proliferation of investments
resulted in approximately 20 undersea cables by 2012 connecting most of coastal Africa to the rest of the world
(Map 1).
Map 1 African undersea cables
Source: http://manypossibilities.net/african-undersea-cables/
Investments into African undersea cables and ICT infrastructure more generally are to a large extent private-
sector driven and often undertaken in the form of public-private partnerships. For instance, the West Indian
Ocean Cable Company (WIOCC), which comprises 13 African telecommunications shareholders, has invested
in five undersea cables throughout the sub-continent.

3. ICT INFRASTRUCTURE AND ACCESS – 47
AID FOR TRADE AND VALUE CHAINS IN INFORMATION AND COMMUNICATION TECHNOLOGIES © OECD/WTO 2013
WIOCC is the largest shareholder (30%) of EASSy, a 10,000km submarine cable system connecting nine
East African countries from Sudan to South Africa to the high-speed global telecommunications network.
EASSy is owned and operated by a group of 16 African (92%) and 5 international (8%) shareholders. The USD
248 million project has been co-financed through the public-private-partnership (PPP) between 28
telecommunication operators' (including WOICC parties) equity and loans from the following five Development
Financial Institutions: the African Development Bank (AfDB), the Development Bank of France (AFD), the
European Investment Bank (EIB), Germany's development bank (KfW) and International Finance Corporation
(IFC).
Expected benefits from EASSy include increasing the supply of high quality reliable broadband capacity
while simultaneously reducing wholesale and consumer prices. Increasing efficiency and reducing the cost of
connectivity is also expected to benefit educational and medical institutions and will help boost general computer
usage and literacy.
Source: Company websites of EASSy and WIOCC (www.wiocc.net/ and www.wiocc.net/).
Undersea cables are the first step for developing countries in providing high-speed
broadband access to their people. The second step relies on the development of terrestrial
networks and to bridge the "last km" to the final user, the latter being particularly costly
in sparsely populated areas.
The example of Sub-Saharan Africa shows that the spread of terrestrial networks is
increasing rapidly but also that more than half of the population is still out of reach of a
terrestrial fibre node. According to HamiltonResearch (www.africabandwidthmaps.com)
the length of terrestrial transmission networks in Sub-Saharan Africa increased from
585,468km in 2010 to 732,662km in 2012. In 2012, 345 million people, or 40% of the
population in Sub-Saharan Africa were within a 25km range of a terrestrial fibre node –
up from 31% in 2010. If the network, which is currently planned and or under
construction, is completed then 439 million people, or 51% of the population, should be
within a 25km range of a node.
A significant question for Africa's broadband development will be whether the prices
for accessing undersea cables will decrease. In particular, the continued high incidence of
monopoly, or dominant operator control, over gateways might sustain high access
charges.


4. ICT AS ENABLER OF ECONOMIC AND SOCIAL DEVELOPMENT – 49
AID FOR TRADE AND VALUE CHAINS IN INFORMATION AND COMMUNICATION TECHNOLOGIES © OECD/WTO 2013
4. ICT as enabler of economic and social development
The mobile revolution and e-commerce
ICTs have allowed the rise of e-commerce, i.e. the sale or purchase of goods and
services online. E-commerce can involve transactions between businesses and consumers
(B2C), between businesses and governments (B2G) and between businesses (B2B),
where transaction for the latter are estimated to account for about 90% of global e-
commerce. In developing countries, potential for e-commerce is greatest in the form of
"mobile" e-commerce (WTO, 2013). Since fixed line access is limited, high rates of
mobile phone penetration and the prospect to increase mobile broadband access make
mobile phones the most suitable means to conduct e-commerce in developing countries.
E-commerce and mobile e-commerce can contribute to development in a variety of
ways. First, e-commerce can provide micro-entrepreneurs and companies with improved
access to the domestic and foreign markets. Traditionally, the reach of individuals and
companies has been confined to the nearest marketplace or established distribution
networks. In contrast, the internet allows firms to display their products to all potential
customers with internet access.
A successful example of a private initiative using e-commerce is "My Country My
Village" from Bangladesh, which established an online market providing farmers and
micro-entrepreneurs with nationwide and international access to customers.3 My Country
My Village set up several e-centres in rural areas of Bangladesh which are managed by
local youth and women serving as a hub and providing support services for the e-
ecommerce activities of rural micro-entrepreneurs. The initiative helps in bridging the
digital divide between rural and urban areas in addition to generating employment for
youth and women and also helps in alleviating poverty by increasing the income of
micro-entrepreneurs.
E-commerce offers a particular potential for services trade. While online sales of
goods still require the physical delivery and are therefore affected by transportation costs,
e-commerce involving services is not affected by distance. Countries like India have
managed to successfully integrate into international value chains as an offshore location
for software development and other IT services.
Furthermore, e-commerce allows for new types of services creating new businesses
and employment opportunities and benefiting domestic value chains and consumers. For
instance, the Senegalese ICT company Manobi provides a variety of e-commerce services
aimed at improving the efficiency along the agriculture value chain such as price
monitoring of agricultural products in different markets, weather forecasts, yield
calculation and the matching of farmers with suppliers and buyers. 4 Financial services
3 Information on the initiative "My Country My Village" based on a presentation given at the WTO Workshop on
E-Commerce, Development and Small and Medium-sized Enterprises (SMEs):
www.wto.org/english/tratop_e/devel_e/wkshop_apr13_e/wkshop_apr13_e.htm.
4 Information on Manobi based on company website (www.manobi.com/) and on a presentation given at the WTO
Workshop on E-Commerce, Development and Small and Medium-sized Enterprises (SMEs):
www.wto.org/english/tratop_e/devel_e/wkshop_apr13_e/wkshop_apr13_e.htm.

50 – 4. ICT AS ENABLER OF ECONOMIC AND SOCIAL DEVELOPMENT
AID FOR TRADE AND VALUE CHAINS IN INFORMATION AND COMMUNICATION TECHNOLOGIES © OECD/WTO 2013
conducted via a mobile phone are another example of new services types which have
blossomed in developing countries. Box 5 describes in more detail the developments and
challenges of "mobile money".
Despite the development potential of e-commerce and several success stories from
developing countries, significant challenges remain for the further growth and
development impact of e-commerce.5 Many individuals and micro-entrepreneurs still lack
access to the internet. Consumers have limited trust with on-line transactions and secure
electronic payment systems are difficult to implement and are often missing. Lack of
digital literacy hinders both potential producers and users to engage in e-commerce.
Finally, many e-commerce transactions still involve the physical delivery of goods
requiring solid transport infrastructure, distribution networks and functioning customs
procedures. Aid-for-trade interventions and trade facilitation measures can help in
overcoming these challenges.
Box 5 Mobile money
Mobile money is increasingly used in developing countries and can provide poor people with access to
formal financial institutions. While mobile money is still predominantly used to transfer money, more
sophisticated financial services such as savings, credit and insurance could prove far more beneficial to the poor
(WTO, 2013).
According to the GSMA Global Money Adoption Survey (Pénicaud, 2013), the number of available mobile
money services has increased dramatically in recent years, growing from 15 in 2008, to 65 in 2010 and reaching
150 in 2012 (Figure 16). In 2012, 150 mobile money services were available in 72 countries and served about 30
million customer accounts. Mobile money is a particular success story in Sub-Saharan Africa, where 56% of
worldwide mobile money services are offered.
Figure 16. Number of mobile money services by region (year-end)
Source: Pénicaud (2013).
5 The presentation given by UNCTAD at the WTO Workshop on E-Commerce, Development and Small and
Medium-sized Enterprises (SMEs) provides a summary of challenges and opportunities of e-commerce
for developing countries:
www.wto.org/english/tratop_e/devel_e/wkshop_apr13_e/fredriksson_ecommerce_e.pdf.

4. ICT AS ENABLER OF ECONOMIC AND SOCIAL DEVELOPMENT – 51
AID FOR TRADE AND VALUE CHAINS IN INFORMATION AND COMMUNICATION TECHNOLOGIES © OECD/WTO 2013
The mobile money market is dominated by mobile network operators which offer 72% of mobile money
services and include companies such as M-Pesa (Rwanda), MTN MobileMoney (Benin, Cameroon, Cote
d’Ivoire, Ghana, Guinea Bissau, Nigeria, Rwanda, South Africa, Swaziland, Uganda, Zambia), Tigo (Tanzania,
Rwanda, Ghana, Paraguay, El Salvador, Guatemala, Honduras, Bolivia) or Telenor (Pakistan).
Domestic money transfers account for more than 80% of value moved on mobile money platforms. On the
other hand, international transfers of remittances via mobiles are not yet widespread but offer a great
development potential by making transfers easier and cheaper. Furthermore, operators are starting to offer
customers the possibility to pay for water or electricity bills, for goods in shops, or to receive salary or
government payments on their mobile money accounts. For instance, the DR Congo has introduced mobile
banking for salary payments of civil servants replacing cash payments that are prone to partial retention by
superiors.*
Since mobile money is new, dynamic market and encompasses financial and telecommunication services, a
number of regulatory questions arise. UNCTAD (2012c) highlights several issues which might be addressed by
policy makers and regulators, i.e. consumer protection, registration and transaction limits, agent networks,
interoperability, taxation and collaboration between national and international regulators. For instance, to protect
consumers, transparency and information needs to be provided; appropriate privacy and data retention legislation
is needed and issues such as theft, fraud or deposit insurance need to be addressed. Furthermore, in order to
support the use of mobile money for international transactions such as remittances or mobile payments, the
interoperability between mobile money platforms and other payment systems as well regulator collaboration
become critical.
* www.globalpost.com/dispatch/news/afp/130413/dr-congo-banking-wage-revolution-state-workers
ICT and social development
ICT does not only spur economic development, but also enables and catalyzes social
development in areas such as health, education and women's empowerment towards the
achievement of the Millennium Development Goals.
World Bank (2012a) provides examples of how ICTs contribute to Africa's
development in a variety of areas including agriculture, climate change adaptation, health,
education and modernizing government. For example, in the health sector, eLearning can
improve human resources for health professionals by providing health education and
training at distance; telemedicine allows the provision of healthcare services such as
monitoring and diagnosis to people in rural areas; electronic health information systems
can reduce paperwork and associated time costs, allowing for better analysis and decision
making of health care providers and policy makers.
Further examples of the beneficial uses of mobile phones in developing countries are
manifold (World Bank, 2012b). For instance, mobile phones can be used to track and
increase student attendance and they help increasing the safety and independence of
women.

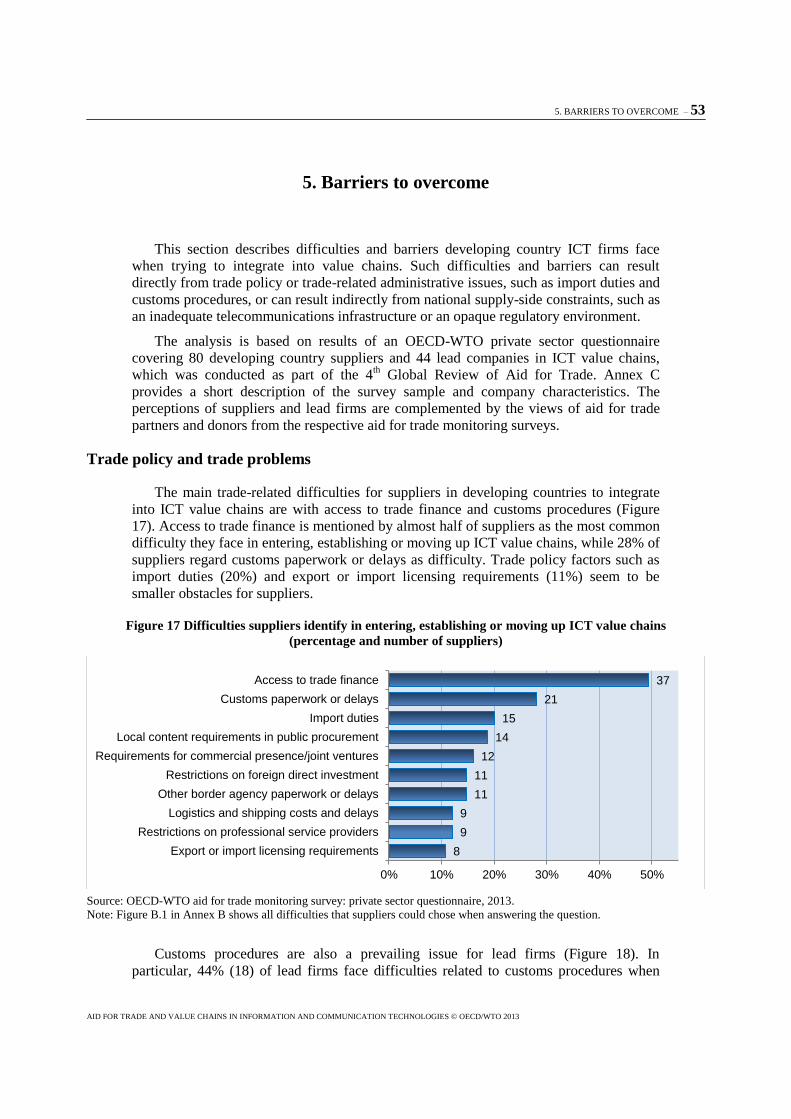
5. BARRIERS TO OVERCOME – 53
AID FOR TRADE AND VALUE CHAINS IN INFORMATION AND COMMUNICATION TECHNOLOGIES © OECD/WTO 2013
5. Barriers to overcome
This section describes difficulties and barriers developing country ICT firms face
when trying to integrate into value chains. Such difficulties and barriers can result
directly from trade policy or trade-related administrative issues, such as import duties and
customs procedures, or can result indirectly from national supply-side constraints, such as
an inadequate telecommunications infrastructure or an opaque regulatory environment.
The analysis is based on results of an OECD-WTO private sector questionnaire
covering 80 developing country suppliers and 44 lead companies in ICT value chains,
which was conducted as part of the 4th Global Review of Aid for Trade. Annex C
provides a short description of the survey sample and company characteristics. The
perceptions of suppliers and lead firms are complemented by the views of aid for trade
partners and donors from the respective aid for trade monitoring surveys.
Trade policy and trade problems
The main trade-related difficulties for suppliers in developing countries to integrate
into ICT value chains are with access to trade finance and customs procedures (Figure
17). Access to trade finance is mentioned by almost half of suppliers as the most common
difficulty they face in entering, establishing or moving up ICT value chains, while 28% of
suppliers regard customs paperwork or delays as difficulty. Trade policy factors such as
import duties (20%) and export or import licensing requirements (11%) seem to be
smaller obstacles for suppliers.
Figure 17 Difficulties suppliers identify in entering, establishing or moving up ICT value chains
(percentage and number of suppliers)
Source: OECD-WTO aid for trade monitoring survey: private sector questionnaire, 2013.
Note: Figure B.1 in Annex B shows all difficulties that suppliers could chose when answering the question.
Customs procedures are also a prevailing issue for lead firms (Figure 18). In
particular, 44% (18) of lead firms face difficulties related to customs procedures when
8
9
9
11
11
12
14
15
21
37
0% 10% 20% 30% 40% 50%
Export or import licensing requirements
Restrictions on professional service providers
Logistics and shipping costs and delays
Other border agency paperwork or delays
Restrictions on foreign direct investment
Requirements for commercial presence/joint ventures
Local content requirements in public procurement
Import duties
Customs paperwork or delays
Access to trade finance

54 – 5. BARRIERS TO OVERCOME
AID FOR TRADE AND VALUE CHAINS IN INFORMATION AND COMMUNICATION TECHNOLOGIES © OECD/WTO 2013
bringing new suppliers from developing countries or LDCs into their value chain.
Compared to suppliers, relatively more lead firms have mentioned export or import
licensing requirements (44%) and import duties (37%) as further difficulty. However, this
is not too surprising as lead firms will refer to trade policy barriers they encounter in
developing countries while supply firms will refer to both developed and developing
country barriers. Section B.3 (b) illustrates that tariffs on ICT products are indeed
significantly higher in developing countries compared to OECD Members. For instance,
while the average applied MFN tariff on ICT imports is less than 2% in OECD countries,
the respective average tariff rate is above 12% in LDCs.
Figure 18 Difficulties lead firms face in bringing new suppliers from developing countries into their supply
chains
(percentage and number of lead companies)
Source: OECD-WTO aid for trade monitoring survey: private sector questionnaire, 2013.
Note: Figure B.2 in Annex B shows all difficulties that lead companies could chose when answering the question.
Lead firms highlight three particularly typical trade problems that arise when dealing
with developing country suppliers (Figure 19). Informal practices and payment requests
constitute a problem for the majority (56%) of lead firms. Problems are also experienced
with customs delays and procedures (54%) and trade financing (33%). Almost two thirds,
i.e. 64% of lead firms, consider these trade problems to be specific to developing-country
and LDC suppliers.
Figure 19 Trade problems that lead firms identify when dealing with developing country suppliers
(percentage and number of lead companies)
Source: OECD-WTO aid for trade monitoring survey: private sector questionnaire, 2013.
Customs procedures, tariffs and other barriers are also highlighted by company case
studies on value chain barriers (WEF, 2013). For instance, a global semiconductor
7
8
11
15
18
18
0% 10% 20% 30% 40% 50%
Visa restrictions on professional service providers
Other border procedures
National restrictions on professional service providers
Import duties
Customs procedures
Export or import licensing requirements
1
4
5
9
10
10
13
21
22
0% 10% 20% 30% 40% 50% 60%
None
Non-compliance with labour standards
Non-compliance with environmental standards
Non-compliance with technical specifications
Other border delays and procedures
Intellectual property problems
Trade financing difficulties
Customs delays and procedures
Informal practices and payment requests

5. BARRIERS TO OVERCOME – 55
AID FOR TRADE AND VALUE CHAINS IN INFORMATION AND COMMUNICATION TECHNOLOGIES © OECD/WTO 2013
manufacturer mentions customs delays as a major problem driving up costs for working
capital, administration and warehousing. Further barriers encountered in various countries
are unclear or inconsistent regulations, low security levels, difficulties in obtaining export
licences and local-content and technical standards requirements. Reporting on its
operations in Latin America and Africa, a mobile handset distributor identifies import
tariffs as a major barrier. While in large markets like Brazil, the company has decided to
set-up a local assembly. In the African countries of Nigeria and the Democratic Republic
of Congo, import duties and regulations have led the company to choose not to deliver to
these countries.
National supply-side constraints
Figures 20 and 21 present national supply-side constraints that respectively hinder
developing country suppliers to integrate into ICT value chains and lead companies to
establish a commercial presence in developing countries. In the following section, survey
results will be discussed by the main groupings of supply-side constraints.
Figure 20 Main national supply-side constraints, identified by suppliers that affect their ability to enter,
establish and move up ICT value chains
(percentage and number of suppliers)
Source: OECD-WTO aid for trade monitoring survey: private sector questionnaire, 2013.
7
8
8
12
14
15
16
18
19
19
22
25
34
35
0% 10% 20% 30% 40% 50% 60%
Inadequate national transport infrastructure
Lack of business service providers
National spectrum management regulations
Supply chain governance issues
National ICT standards
National access pricing regulations
Inadequate telecommunications infrastructure
Unreliable power infrastructure
Inadequate national IP protection laws
Lack of established dialogue with national authorities
Lack of transparency in regulatory environment
Business environment
Lack of labour force ICT skills
Access to finance

56 – 5. BARRIERS TO OVERCOME
AID FOR TRADE AND VALUE CHAINS IN INFORMATION AND COMMUNICATION TECHNOLOGIES © OECD/WTO 2013
Figure 21 Obstacles identified by lead companies in establishing a commercial presence in developing
countries
(percentage and number of lead companies)
Source: OECD-WTO aid for trade monitoring survey: private sector questionnaire, 2013.
Access to finance and human capital
Access to finance and a lack of ICT labor force skills are the most significant national
supply-side constraints as each factor is mentioned by about 45% of suppliers. Access to
finance is a typical problem for firms who would like to establish themselves on the
export market, as exporting requires firms to burden additional fixed costs related to
foreign market entry and transport, including search costs for trading partners, market
research, and marketing or transport insurance costs.
While access to finance affects firms in different sectors in a similar way, the lack of
ICT skills of workers represents a constraint that is more specific to ICT firms. Many
segments of the ICT sector require high-skilled workers being capable of conducting
activities such as software and product engineering, computer programming, web design
or database administration. However, more general skills such as English language skills
or general business skills are important for the sector. While the lack of (ICT) skilled
labor force constitutes a difficulty for about a quarter of lead firms, it appears to be a
more pressing difficulty for suppliers in developing countries.
Certain trade and supply-side factors affect small companies more heavily than large
ones. Not surprisingly, micro companies and SMEs mention that access to finance is their
main supply-side constraint, less so for large suppliers and multinationals. On the other
hand, the lack of ICT labor force skills is a significant constraint to suppliers of all sizes.
Institutional and regulatory environment
After access to finance and lack of ICT skills in the labour force, suppliers highlight
the business environment (33%) and the lack of transparency in the regulatory
environment (29%) as the main national supply-side constraints.
For lead companies, a sound business and regulatory environment are the most
important factors for the integration of developing country suppliers into ICT value
6
7
9
10
10
11
11
13
15
23
23
0% 10% 20% 30% 40% 50% 60%
Inadequate airport, maritime or transport capacity
Inadequate telecommunications networks
Poor safety management in local supply chain
Equity and/or ownership restrictions
Labour skills
Labour practices and regulations
Local supplier or content requirements
Power supply problems
Inadequate standards infrastructure
Business environment
Lack of transparency in regulatory environment

5. BARRIERS TO OVERCOME – 57
AID FOR TRADE AND VALUE CHAINS IN INFORMATION AND COMMUNICATION TECHNOLOGIES © OECD/WTO 2013
chains. In particular, 51% of lead companies regard the lack of transparency in the
regulatory environment as a major difficulty in bringing developing country suppliers into
their value chains (Figure B.2 in Annex B). Likewise, Figure 21 shows that the business
environment and the lack of transparency are also the most relevant obstacles when
establishing a commercial presence in developing countries, as mentioned by 58% of lead
companies.
Closely related to a sound business and regulatory environment is the absence of
corruption and graft. For about 60% of lead companies, these two factors have the most
negative influence on their sourcing and investment decisions in their value chains.
While the lack of transparency in regulatory environment is more general in nature, it
is of particular importance to the telecommunication sector. Furthermore, a significant
part of suppliers underline the importance of telecommunications regulation. In
particular, suppliers mention national regulations regarding access pricing (20%) and
spectrum management (10%) respectively as important national supply-side constraints.
Since the sample covers a broad array of ICT companies, the fact that 20% of suppliers
have highlighted access pricing regulations as a main constraint reflects the importance of
telecommunication regulation for creating competition in the telecommunications market
resulting in higher-quality and lower-priced services.
Section B.4(b) describes the remarkable progress that developing countries have
made in terms of liberalizing their telecommunication markets but also points to
regulatory challenges such as spectrum management, roaming and IP interconnection. In
particular, more efforts are needed regarding the liberalization of international gateways
which is vital to provide firms and individuals with affordable access to broadband
internet.
Physical infrastructure
When it comes to physical or "hard" infrastructure both suppliers and lead companies
highlight difficulties with power supply. Energy infrastructure and power supply is a
fundamental supply-side factor that allows the continuous operations of businesses and is
of great importance to ICT firms relying on fixed-line internet access for its servers.
While IT technology increases the connectivity of remote areas and offers great business
opportunities for individuals and micro companies, in many LDCs access and provision
of electricity is still a major problem.
In particular, 23% of suppliers regard unreliable power infrastructure as a main
national supply-side constraint and 33% of lead companies mention power supply as a
typical obstacle when establishing a commercial presence in a developing country.
Unreliable power infrastructure is the most important barrier in LDCs. In particular,
suppliers from LDCs most often mention unreliable power infrastructure (13 out of 17) as
a main national supply-side constraint, even before access to finance (10 out of 17).
Even though other barriers seem more important, telecommunications infrastructure
still matters for developing country suppliers. In particular, the quality of the
telecommunication infrastructure is of similar importance to ICT suppliers in developing
countries as power supply. Unreliable internet access and bandwidth (Figure B.1 in
Annex B) as well as inadequate telecommunications networks hamper just above 20% of
developing country suppliers to integrate into ICT value chains. Also close to a fifth of
lead companies face difficulties due to inadequate telecommunication networks when

58 – 5. BARRIERS TO OVERCOME
AID FOR TRADE AND VALUE CHAINS IN INFORMATION AND COMMUNICATION TECHNOLOGIES © OECD/WTO 2013
integrating developing country suppliers in their supply chains or setting up a commercial
presence in developing countries.
The case for higher investments into telecommunications infrastructure has also been
made in Section C, which shows that there is still a large digital divide between
developing and developed countries, in particular in terms of internet use and broadband
access. In LDCs, less than 10% of individuals use the internet and fixed broadband
penetration is below 1%.
In contrast to energy and telecommunications infrastructure, less than 10% of
suppliers perceive inadequate transport infrastructure as difficulty to integrate into value
chains and as national supply-side constraint. On the other hand, a similar share of lead
firms, i.e. about 20% perceive inadequate telecommunication networks and transport
capacity and links as a difficulty for integrating developing country suppliers or setting up
a commercial presence in developing countries.
Partner and donor country views
As part of the Aid for Trade monitoring exercise, the OECD-WTO questionnaires for
partners and donors asked about the main obstacles to greater participation of developing
country firms in value chains (Figure 22).
Partners and donors both highlight the same main obstacles. In contrast to the private
sector, partners and donors regard inadequate domestic infrastructure as the most
important obstacle to a greater participation of companies in value chains, followed by
limited access to trade finance and standards compliance.
There is however also some heterogeneity in the views of partners and donors. While
partners highlight the lack of comparative advantage and market entry costs as further
main obstacles, donors consider the lack of labor force skills and the inability to attract
foreign direct investment as more important.
Figure 22 Main obstacles identified by donors and partners for a greater participation of developing country
firms in value chains
Source: OECD-WTO aid for trade monitoring survey: partner and donor questionnaires, 2013.
Note: Replies of partners and donors regarding obstacles to participation in value chains are not specific to the ICT sector.
0% 10% 20% 30% 40% 50% 60% 70%
Burdensome documentation requirements
Trade restrictions
Inability to attract foreign direct investment
Burdensome border procedures in export markets
Lack of labour force skills
Structure of value chains
Market entry costs
Lack of comparative advantage
Standards compliance
Limited access to trade finance
Inadequate domestic infrastructure
Partners
Donors

6. WHERE DO RESOURCES CURRENTLY GO? – 59
AID FOR TRADE AND VALUE CHAINS IN INFORMATION AND COMMUNICATION TECHNOLOGIES © OECD/WTO 2013
6. Where do resources currently go?
Priorities in partners' strategies and in donors' activities
In the OECD-WTO partner questionnaire, beneficiaries were asked whether their
national development strategies identify specific sectors as sources of growth (Figure 23).
More than 80% (65 out of 79) of beneficiaries have identified the following sectors as
sources of growth in their development strategies: agriculture; fisheries and forestry; and
services. Manufacturing seems to be less relevant as it is included by less than 60% of
beneficiaries in their development strategies.
With regard to specific sectors, ICT services sectors are considered priority sectors by
developing countries. In particular, close to 60% of aid-for-trade beneficiaries have
included communication services and computer and information services in their
development strategies. On the other hand, only 9 partners identified manufacturing of
office and telecoms equipment in their development strategies. Most countries also have
national strategies for these sectors but only about half of partners have trade objectives
for services integrated into their sector strategies.
Figure 23 Sectors identified in national development strategies as sources of growth
(percentage and number of partners)
Source: OECD-WTO AFT monitoring survey: partner questionnaire.
According to the OECD-WTO donor questionnaire, almost all donors (38 out of 41)
engage the private sector in the implementation of their aid-for-trade strategy. More than
half of these 38 donors are engaged in public-private partnerships that have ICT as a
28
41
43
43
46
47
63
65
9
13
15
16
31
45
32
65
0% 10% 20% 30% 40% 50% 60% 70% 80% 90% 100%
Business and professional services
Banking
Construction
Computer and information services
Communication services
Transportation
Tourism services
SERVICES
Office and telecoms equipment
Automotive products
Iron and steel
Chemicals
Textiles
MANUFACTURING
FUELS AND MINING PRODUCTS
AGRICULTURE, FISHERY AND FORESTRY

60 – 6. WHERE DO RESOURCES CURRENTLY GO?
AID FOR TRADE AND VALUE CHAINS IN INFORMATION AND COMMUNICATION TECHNOLOGIES © OECD/WTO 2013
sectoral focus. However, while most donors have experience in value chain development
in traditional development sectors such as agriculture, only few donors have experience in
ICT value chain development.
Figure 24 Sectoral focus of private sector engagement in the implementation of aid-for-trade projects
(percentage and number of donors)
Source: OECD-WTO aid for trade monitoring survey: donor questionnaire, 2013.
Aid-for-trade disbursements on ICT
Aid for trade in ICT compared to other categories
In Aid-for-trade statistics, the ICT sector is covered by the three communications
categories i) communications policy and administrative management, ii)
telecommunications and iii) information and communication technology (ICT). Within
these three categories, aid-for-trade projects can have different objectives and linkages to
other sectors. Projects may support firms in the ICT sector, help firms or governments to
use ICT, assist telecommunication regulators or support and facilitate investments in ICT
infrastructure.
Table 11 provides information on disbursements of official development assistance
(ODA), i.e. aid for trade, and non-concessional other official flows (OOF) by aid-for-
trade category.6 OOF is, to a large extent, loans by development banks with grant
elements of less than 25% and therefore increases in importance with a country's
development.
ICT-related aid-for-trade flows amounted to USD 418 million in 2011. While ICT
accounted for only 1.2% of total aid for trade, the other economic infrastructure
categories – transport and storage and energy generation and supply – accounted for 30%
and 21% of disbursed aid for trade in 2011. Hence, ICT is a low priority compared to
other aid-for-trade categories.
6 Other official flows are defined as transactions by the official sector with countries on the DAC List of ODA
Recipients which do not meet the conditions for eligibility as Official Development Assistance, either
because they are not primarily aimed at development, or because they have a grant element of less than
25 per cent.
25
15
24
14
17
0%
10%
20%
30%
40%
50%
60%
70%
80%
90%
100%
Agri-business andfood processing
Textiles andapparel
Transport andlogistics
Tourism ICT

6. WHERE DO RESOURCES CURRENTLY GO? – 61
AID FOR TRADE AND VALUE CHAINS IN INFORMATION AND COMMUNICATION TECHNOLOGIES © OECD/WTO 2013
Furthermore, aid for trade to support ICT grew significantly less than total aid for
trade, including aid for trade to economic infrastructure. Specifically, nominal ICT aid-
for-trade disbursements in 2011 were only 19% higher than the 2006-2008 average,
which is a significantly lower increase compared to 53% and 62% for total aid for trade
and aid for trade to economic infrastructure respectively.
On the other hand, OOF on ICT amounted to USD 665 million in 2011 accounting for
2.4% of total OOF. While OOF disbursements on ICT projects were greater than
respective ODA disbursements, for transport and storage and energy generation and
power supply ODA disbursements were higher.
The lower level of aid for trade to ICT, compared to other infrastructure categories –
transport and storage and energy generation and supply – is likely to reflect the fact that
investments in ICT infrastructure tend to be more private-sector driven. Investment in
energy and transport infrastructure tends to be more basic and capital intensive but still
underdeveloped in many LDCs and developing countries. For instance, in the aid-for-
trade private sector questionnaire, 23.4% of suppliers from developing countries mention
that unreliable power infrastructure is a main supply-side constraint.
Despite the positive developments in ICT infrastructure, the digital divide between
developing and developed countries still exists and is widening in the case of LDCs.
Hence, there should be a more prominent role for aid for trade in some of the least
connected countries if private investment is lacking.
Table 11 Aid for trade official development assistance and other official flows by category
(disbursements, USD million)
Category
Official development assistance (ODA) Other official flows (OOF)
2006-08 avg.
2010 2011 Δ%:
06/08-2011
Share (%) in 2011
2006-08
avg. 2010 2011
Δ%: 06/08-2011
Share (%) in 2011
Trade Policy & Regulations 704 1,170 982 39.5 2.9 86 379 232 169.2 0.8
02_Trade Facilitation 112 325 259 130.8 0.8 17 324 94 465.8 0.3
Economic Infrastructure 10,973 17,636 17,740 61.7 52.6 4,055 13,498 14,720 263.0 52.2
06_Transport and Storage 6,028 9,804 10,165 68.6 30.1 2,603 7,322 8,218 215.7 29.2
07_Communications 467 536 506 8.3 1.5 243 668 685 182.3 2.4
of which ICT 352 419 418 18.8 1.2 243 666 665 173.9 2.4
08_Energy Gen. and Supply 4,478 7,296 7,069 57.9 21.0 1,209 5,508 5,817 381.0 20.6
Building Productive Capacity 10,314 14,053 14,999 45.4 44.5 5,619 16,226 13,239 135.6 47.0
09_Business And Other Services 1,742 1,576 1,600 -8.2 4.7 460 1,241 894 94.3 3.2
10_Banking & Financial Services 2,164 2,440 2,699 24.7 8.0 1,741 7,602 5,061 190.7 18.0
11_Agriculture 3,935 6,764 6,549 66.4 19.4 731 1,439 1,135 55.3 4.0
12_Forestry 520 1,200 1,110 113.6 3.3 52 248 217 317.6 0.8
13_Fishing 274 343 351 28.0 1.0 2 52 7 359.2 0.0
14_Industry 1,208 1,402 2,060 70.6 6.1 1,983 3,799 4,448 124.2 15.8
15_Mineral Resources and Mining 400 172 464 16.0 1.4 593 1,728 1,373 131.5 4.9
16_Tourism 72 155 167 131.2 0.5 57 117 104 82.3 0.4
Trade-related Adjustment 68 17
Total 22,001 32,927 33,739 53.4 100 9,760 30,102 28,191 188.8 100
Source: OECD, DAC-CRS Aid Activities database.
Note: ICT covers the categories communications policy and administrative management, telecommunications and information and
communication technology (ICT).
Aid for trade and investment in telecommunications infrastructure
Table 12 shows capital expenditure in telecommunication services by income group
and region. Capital expenditure in 2010 was USD 156 billion in 28 OECD countries,
which is significantly higher than the USD 93 billion of the 43 developing countries –

62 – 6. WHERE DO RESOURCES CURRENTLY GO?
AID FOR TRADE AND VALUE CHAINS IN INFORMATION AND COMMUNICATION TECHNOLOGIES © OECD/WTO 2013
underlying income and regional aggregates. Growth in capital investment was highest in
LDCs and negative in OECD countries, reflecting the greater need for ICT infrastructure
in developing countries.
The role of aid for trade to ICT infrastructure investments is marginal. For instance,
in 2010, USD 419 million of aid for trade was disbursed to ICT for all partners (Table
11), while capital expenditure on telecommunication infrastructure, of eight LDCs,
amounted to USD 6,884 million (Table 12).
In relative terms, telecommunication investment is most important in LDCs and
Africa, accounting respectively for 10% and 8.4% of overall gross fixed capital
formation. This stresses the greater need of LDCs and developing countries to improve
their infrastructure in order to foster private sector development while in advanced
economies relatively more investment can be undertaken in manufacturing and services
sectors.
Table 12 Capital expenditure in telecommunication services by income group and by region
Capital expenditure (in million USD) Growth p.a. (%) Share in gross fixed capital formation (%)
2000/02 2005/07 2010 02-10 07-10 2000/02 2005/07 2010
By income group
LDCs 391 5,429 6,884 43.1 8.2 8.8 13.0 10.0
LMICs 7,052 24,723 23,735 16.4 -1.3 5.8 7.9 5.0
UMICs 46,513 47,818 62,606 3.8 9.4 4.8 3.2 3.3
OECD 159,349 166,030 156,324 -0.2 -2.0 3.5 2.1 2.2
By region
Africa 3,571 10,794 14,381 19.0 10.0 8.4 11.0 8.4
America 14,295 14,059 19,758 4.1 12.0 5.3 5.0 3.7
Asia 35,140 48,864 54,899 5.7 4.0 3.8 4.1 2.9
Europe 949 4,253 4,188 20.4 -0.5 5.6 4.8 4.7
OECD 159,349 166,030 156,324 -0.2 -2.0 3.5 2.1 2.2
Source: WTO Secretariat, based on ITU World Telecommunication/ICT Indicators database.
Notes: Data have been averaged over the three year periods 2000/02 and 2005/07. Aggregates are based on data for 71 countries
allocated as follows: 8 LDCs, 15 LMICs, 20 UMICs and 28 OECD Members; 14 Africa, 10 America, 13 Asia, 6 Europe and 28
OECD. Table B.5 in Annex B provides country information.
Compared to transport and energy infrastructure, market-driven investment by private
investors plays a greater role for the development of ICT infrastructure. For instance,
Africa experienced significant inflows of private investment following the liberalization
of the telecommunications sector in many countries in the 1990s (ITU, 2012a; World
Bank, 2011). Most of the investments were Greenfield projects financed to a large extent
by investors from developing countries and with African investors accounting for more
than half of investments. Private investors relied mainly on debt from banks in
developing countries or on bonds. Development finance institutions also contributed to
finance infrastructure projects, such as undersea cables (see Box 4). France Telecom and
Vodafone were the main private investors from the OECD area. More recently, India
emerged as a new investor in African telecommunications, while China financed network
equipment supplied by large Chinese manufacturers.
Table 13 further highlights that investment into ICT infrastructure is more private-
sector driven and relies less on aid for trade than energy infrastructure. In particular, it
shows that the ratio of aid-for-trade disbursements to private infrastructure investment is
significantly lower for communications than for energy in most countries. For instance, in
Nicaragua aid-for-trade disbursements on ICT projects equaled 1.19% of private
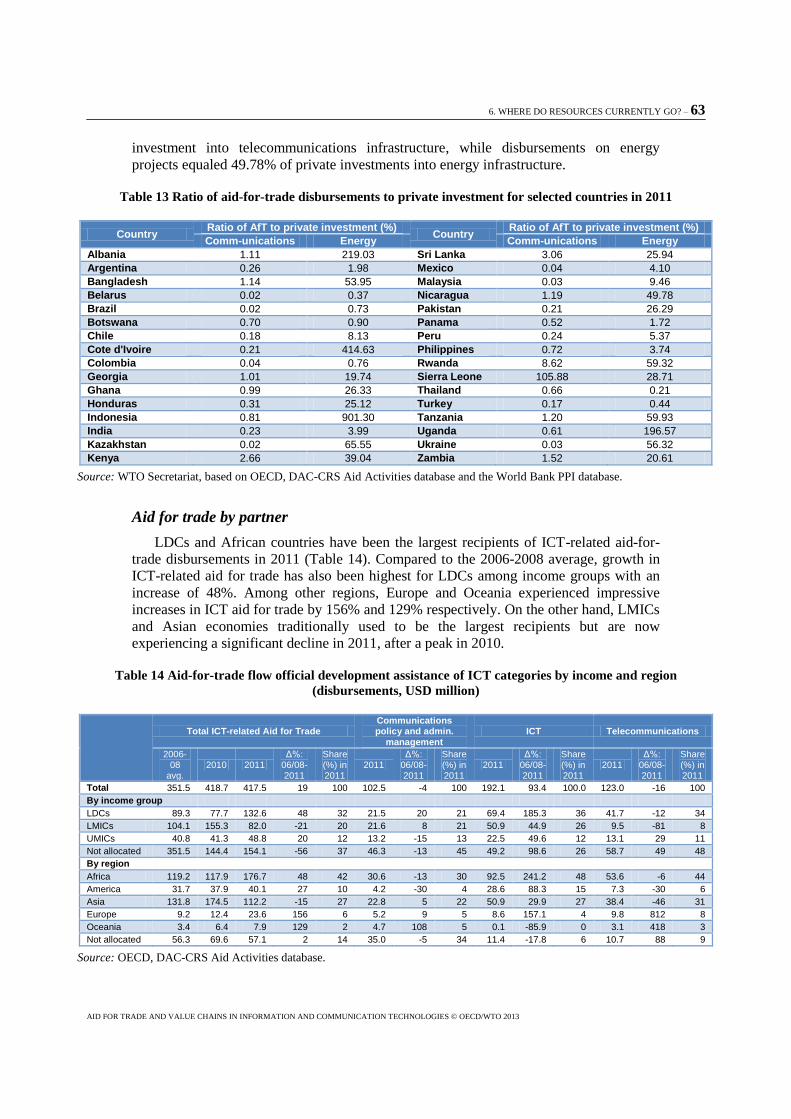
6. WHERE DO RESOURCES CURRENTLY GO? – 63
AID FOR TRADE AND VALUE CHAINS IN INFORMATION AND COMMUNICATION TECHNOLOGIES © OECD/WTO 2013
investment into telecommunications infrastructure, while disbursements on energy
projects equaled 49.78% of private investments into energy infrastructure.
Table 13 Ratio of aid-for-trade disbursements to private investment for selected countries in 2011
Country Ratio of AfT to private investment (%)
Country Ratio of AfT to private investment (%)
Comm-unications Energy Comm-unications Energy
Albania 1.11 219.03 Sri Lanka 3.06 25.94
Argentina 0.26 1.98 Mexico 0.04 4.10
Bangladesh 1.14 53.95 Malaysia 0.03 9.46
Belarus 0.02 0.37 Nicaragua 1.19 49.78
Brazil 0.02 0.73 Pakistan 0.21 26.29
Botswana 0.70 0.90 Panama 0.52 1.72
Chile 0.18 8.13 Peru 0.24 5.37
Cote d'Ivoire 0.21 414.63 Philippines 0.72 3.74
Colombia 0.04 0.76 Rwanda 8.62 59.32
Georgia 1.01 19.74 Sierra Leone 105.88 28.71
Ghana 0.99 26.33 Thailand 0.66 0.21
Honduras 0.31 25.12 Turkey 0.17 0.44
Indonesia 0.81 901.30 Tanzania 1.20 59.93
India 0.23 3.99 Uganda 0.61 196.57
Kazakhstan 0.02 65.55 Ukraine 0.03 56.32
Kenya 2.66 39.04 Zambia 1.52 20.61
Source: WTO Secretariat, based on OECD, DAC-CRS Aid Activities database and the World Bank PPI database.
Aid for trade by partner
LDCs and African countries have been the largest recipients of ICT-related aid-for-
trade disbursements in 2011 (Table 14). Compared to the 2006-2008 average, growth in
ICT-related aid for trade has also been highest for LDCs among income groups with an
increase of 48%. Among other regions, Europe and Oceania experienced impressive
increases in ICT aid for trade by 156% and 129% respectively. On the other hand, LMICs
and Asian economies traditionally used to be the largest recipients but are now
experiencing a significant decline in 2011, after a peak in 2010.
Table 14 Aid-for-trade flow official development assistance of ICT categories by income and region
(disbursements, USD million)
Total ICT-related Aid for Trade Communications policy and admin.
management ICT Telecommunications
2006-08
avg. 2010 2011
Δ%: 06/08-2011
Share (%) in 2011
2011 Δ%:
06/08-2011
Share (%) in 2011
2011 Δ%:
06/08-2011
Share (%) in 2011
2011 Δ%:
06/08-2011
Share (%) in 2011
Total 351.5 418.7 417.5 19 100 102.5 -4 100 192.1 93.4 100.0 123.0 -16 100
By income group
LDCs 89.3 77.7 132.6 48 32 21.5 20 21 69.4 185.3 36 41.7 -12 34
LMICs 104.1 155.3 82.0 -21 20 21.6 8 21 50.9 44.9 26 9.5 -81 8
UMICs 40.8 41.3 48.8 20 12 13.2 -15 13 22.5 49.6 12 13.1 29 11
Not allocated 351.5 144.4 154.1 -56 37 46.3 -13 45 49.2 98.6 26 58.7 49 48
By region
Africa 119.2 117.9 176.7 48 42 30.6 -13 30 92.5 241.2 48 53.6 -6 44
America 31.7 37.9 40.1 27 10 4.2 -30 4 28.6 88.3 15 7.3 -30 6
Asia 131.8 174.5 112.2 -15 27 22.8 5 22 50.9 29.9 27 38.4 -46 31
Europe 9.2 12.4 23.6 156 6 5.2 9 5 8.6 157.1 4 9.8 812 8
Oceania 3.4 6.4 7.9 129 2 4.7 108 5 0.1 -85.9 0 3.1 418 3
Not allocated 56.3 69.6 57.1 2 14 35.0 -5 34 11.4 -17.8 6 10.7 88 9
Source: OECD, DAC-CRS Aid Activities database.

64 – 6. WHERE DO RESOURCES CURRENTLY GO?
AID FOR TRADE AND VALUE CHAINS IN INFORMATION AND COMMUNICATION TECHNOLOGIES © OECD/WTO 2013
Over the period 2006-2011, LDCs have received, on average, less aid for trade to ICT
projects than LMICs (Figure 25). Even though the average share of ICT in total aid for
trade was higher in LDCs than in LMICs, it would be appropriate to prioritize aid for
trade more towards ICT in LDCs, given the large digital lag of most LDCs and the
importance of ICTs for private sector development. Relative to other aid-for-trade
categories, aid for trade to ICT projects has been most important in American countries
and Oceania, constituting on average more than 2.5% of total aid for trade.
Figure 25 Country averages of ICT disbursements and ICT shares in total aid for trade by income groups
and regions (2006-2011)
Source: OECD, DAC-CRS Aid Activities database.
Notes: ICT disbursements and shares by income groups and regions are simple country averages. Aid-for-trade flows not
assigned to a country are excluded.
Table 15 provides some country examples along the lines of Figure 25. In particular,
it shows that over the period 2006-2011, disbursements to ICT projects were highest for
three Asian countries: Iraq; Bangladesh; and Vietnam. All of the top 10 receivers are
African or Asian countries. Table 15 further shows the top 10 partner countries in terms
of the share of ICT projects in total aid-for-trade disbursements. Aid for trade to ICT
plays a significant role for small and remote countries. For instance, the top three
countries of Sao Tome & Principe, St. Kitts-Nevis and Maldives are all islands, for which
ICT projects accounted for 33%, 21% and 14% respectively of aid-for-trade
disbursements over the period 2006-2011.
Table 15 Top 10 partners in terms of ICT disbursements and ICT share in total aid for trade
Top 10 partners: Average value of ICT disbursements (2006-2011)
Top 10 partners: Average share of ICT in total aid for trade disbursements (2006-2011)
Country USD million % of total AfT IDI Country USD million % of total
AfT IDI
Iraq 16.8 1.6
Sao Tome & Principe 2.6 33.0
Bangladesh 12.7 3.2
St. Kitts-Nevis 0.5 20.9
Vietnam 12.1 0.9 3.68 Maldives 1.5 13.9 4.30
Mozambique 10.3 3.0 1.28 Fiji 1.0 11.5 3.50
India 8.7 0.5 2.10 Syria 7.5 10.1 3.15
Egypt 8.6 1.4 3.66 Panama 0.9 8.4 4.41
Indonesia 8.2 1.0 3.19 Gambia 1.7 6.0 1.84
Syria 7.5 10.1 3.15 Angola 2.7 6.0
Kenya 7.0 2.0 2.32 Niue 0.2 5.8
Ethiopia 7.0 1.1 1.15 Mongolia 5.8 5.7 3.63
Source: OECD, DAC-CRS Aid Activities database and ITU (2012a).
0.0%
0.5%
1.0%
1.5%
2.0%
2.5%
3.0%
3.5%
0
0.5
1
1.5
2
2.5
3
3.5
4
LDCs LMICs UMICs Africa America Asia Europe Oceania
ICT Aid for Trade (US$) Share in total Aid for Trade (%)

6. WHERE DO RESOURCES CURRENTLY GO? – 65
AID FOR TRADE AND VALUE CHAINS IN INFORMATION AND COMMUNICATION TECHNOLOGIES © OECD/WTO 2013
Figure 26 sets the ICT development of the 39 least connected countries (LCCs) in
terms of the ITU ICT Development Index (IDI) 2011 and in relation to their relative
reliance on aid for trade to ICT. Only for a few LCCs such as Gambia, Bhutan, Myanmar
or the Solomon Islands, the share in total aid-for-trade disbursements to ICT is above the
mean across all 146 aid-for-trade partner countries. For the majority of LCCs this share is
below both the mean and median of aid-for-trade partners. Therefore, it might be useful
for LCC partners to consider whether aid-for-trade priorities should be moved more
towards ICT and how aid for trade can better support ICT development and facilitate
private investments.
Figure 26 The 39 least connected countries (LCCs) in terms of the ICT development index (IDI) 2011 and
their ICT share in total aid-for-trade disbursments
Source: WTO Secretariat, based on ITU (2012a) and OECD, DAC-CRS Aid Activities database.
Niger
Chad Central African Rep.
Eritrea
Burkina Faso Ethiopia
Liberia
Guinea Mozambique Congo, Dem. Rep.
Mali Malawi
Madagascar
Papua New Guinea
Benin
Cameroon Congo, Rep. Tanzania
Nepal
Mauritania Togo Zambia
Rwanda Myanmar Uganda
Comoros Cote d'Ivoire
Djibouti Pakistan Yemen
Gambia Senegal Solomon Islands
Nigeria Cambodia
Laos
India Bhutan
Ghana
0.70
0.90
1.10
1.30
1.50
1.70
1.90
2.10
2.30
0 1 2 3 4 5 6 7
Mean for 146 Median for 146 AfT partners: 1%
ICT DeveIopment Index
ICT share in total AfT (%)


7. OVERCOMING THE BARRIERS – 67
AID FOR TRADE AND VALUE CHAINS IN INFORMATION AND COMMUNICATION TECHNOLOGIES © OECD/WTO 2013
7. Overcoming the barriers
Support types to help suppliers integrate into ICT value chains
Three types of support are considered by the majority of suppliers as most effective in
helping them enter, establish or move up value chains (Figure 27). In particular, better
market access and investment incentives are considered by 60% of supply firms as an
effective support, followed by better access to finance (48%).
Further support types often mentioned are investment in communications
infrastructure (34%) and labor force training schemes (32%). The request for labor force
training schemes is ranked higher by the 34 suppliers that consider the lack of ICT labor
force skills as a main supply-side constraint. Of these 34 suppliers, 21 (62%) consider
labor force training schemes as most effective.
Support to improve the business environment and trade facilitation measures to
streamline customs are only considered by about a fifth of suppliers as the most effective
form of support, even though the business environment and customs procedures are
regarded as the main constraints to integrate into value chains.
Figure 27 Types of support identified as ‘most effective’ by developing country suppliers in helping them to
enter, establish, or move up value chains
(percentage and number of suppliers)
Source: OECD-WTO AFT monitoring survey: private sector questionnaire.
The majority of suppliers (55%) think that future support should be best focused at
improving the business environment, followed by sectors with the most export potential
(34%) and through participation of foreign investors (32%).
12
14
17
17
18
20
21
25
27
38
47
47
0% 10% 20% 30% 40% 50% 60% 70%
Trade facilitation to streamline customs and border delays
Appropriate competition policy
Standards and certification capacity
Support to improve business environment
Establishment of export/special economic zones
Investment in infrastructure (road, rail, port, airport)
Public-private dialogue with national authorities
Labour force training schemes
Investment in communications infrastructure
Better access to finance
Better market access
Incentives for investment (domestic and foreign)

68 – 7. OVERCOMING THE BARRIERS
AID FOR TRADE AND VALUE CHAINS IN INFORMATION AND COMMUNICATION TECHNOLOGIES © OECD/WTO 2013
Similar to suppliers, many lead companies regard better market access as an effective
support type to bring new developing-country suppliers into their value chain (Figure 28).
However, the two support types most often mentioned by lead companies are investments
in communications infrastructure and trade facilitation measures to streamline customs.
Figure 28 Types of support lead companies suggest would be
‘most effective’ to bring new developing-country suppliers into their value chains
(percentage and number of lead companies)
Source: OECD-WTO aid for trade monitoring survey: private sector questionnaire, 2013.
As a result, both suppliers and lead companies regard measures aimed at better
market access, incentivizing investment, as well as investments in communication’s
infrastructure as priority. Furthermore suppliers are particularly interested in measures to
improve access to finance and labor force training schemes, while lead firms regard trade
facilitation measures as key to integrating developing country suppliers into their value
chain.
According to the OECD /WTO aid for trade monitoring survey, partner countries
consider infrastructure development support as most effective, followed by labor skills
development, support to improve the business climate, including trade and investment
promotion. The Caribbean Community Regional Aid-for-Trade Strategy 2013-2015 is an
example of partner countries prioritizing infrastructure development, including ICT
infrastructure, in their Aid-for-trade Strategies (Box 6).
1
5
7
8
9
14
14
14
15
16
16
18
20
20
0% 10% 20% 30% 40% 50%
None; leave it to the private sector
Improved labour standards and enforcement
Less stringent rules of origin
Labour force training schemes
Establishment of export processing zones
Better public-private dialogue with national authorities
Better standards infrastructure and certification capacity
Support to improve the quality of government regulation
Support to improve business environment
Incentives for foreign direct investment
Investment in infrastructure (road, rail, port, airport)
Better market access
Investment in communications infrastructure
Trade facilitation to streamline customs and border delays
7. OVERCOMING THE BARRIERS – 69
AID FOR TRADE AND VALUE CHAINS IN INFORMATION AND COMMUNICATION TECHNOLOGIES © OECD/WTO 2013
Box 6 Caribbean Community regional aid-for-trade strategy 2013-2015
At the 24th Inter-Sessional Meeting of the Conference of the Caribbean Community (CARICOM) in Haiti in
February 2013, heads of government endorsed the Regional Aid-for-trade Strategy 2013-2015. The strategy is
considered as a critical tool for mobilizing resources needed for the region to enhance its competitiveness in the
international market place.
The goals of the Strategy are i) upgrading key economic infrastructure; ii) enhancing competitiveness and
facilitating trade expansion and diversification; iii) and deepening regional integration and maximizing gains
from external trade agreements. Regarding i) economic infrastructure, the principal objective of the Strategy is to
secure complementary resources or identify public-private partnerships for upgrading the infrastructures of
maritime transport, ICT and energy.
The upgrading of the ICT infrastructure aims at reducing the digital divide between Caribbean economies
and developed economies, which at present is greater than the development gap. In particular, the strategy
highlights the development of a Caribbean Broadband Transformation Strategy as one of five regional anchor
projects for early harvest. The project has the objective to increase competition in the delivery of broadband
services to promote increased internet access. Besides national projects, the development of a Caribbean
Broadband Transformation Strategy will include regional projects aimed at creating a single ICT space,
developing a broadband strategy and roadmap for analog switchover, and creating a mechanism for public-
private partnerships.
Source: Caribbean Community Regional Aid-for-trade Strategy 2013-2015
Participation in support initiatives
More than a third of suppliers in the sample, i.e. 31 out of 81, have benefited from
support, the majority of which, from either a government or development agency
initiative. Suppliers mentioned the following beneficial impacts, in part from support
received: Better export market intelligence (14); Exports to new markets (14); higher
exports sales in existing markets (10); investment in sector (10); improved firm or sector
competitiveness (10); improved workforce skills (19); and resolution of a market access
problem (10).
Among the 31 suppliers who benefitted from initiatives, there are nine Bangladeshi
ICT firms which have participated in a project by the Netherlands Trust Fund and the
International Trade Centre (ITC), which are aimed at assisting with market access and
export promotion. Box 7 describes in more details the objectives, activities, and outcomes
of the project.
A larger share of lead companies have participated in support initiatives compared to
suppliers. Of the 44 lead firms, 28 (64%) have taken part in an action to address value
chain obstacles, 17 of which have been led by the company itself. As the main motives
for their engagement, lead companies mention that the activities relate to their core
business strategy (16), or that they were part of their corporate social responsibility (CSR)
agenda (12).
The majority of the activities of 28 lead companies focus on ICT infrastructure
development or ICT training, the latter being consistent with the lack of labor force ICT
skills highlighted by suppliers. Furthermore, more than a third of lead companies are
engaged in activities addressing the business environment, customs and border
procedures, and sustainable development. The majority of lead companies found support

70 – 7. OVERCOMING THE BARRIERS
AID FOR TRADE AND VALUE CHAINS IN INFORMATION AND COMMUNICATION TECHNOLOGIES © OECD/WTO 2013
activities to be useful to build networks with governments but, at the same time, have
experienced difficulties in working with the public sector.
Box 8 and Box 9 illustrate the activities of the International Trade Centre (ITC) and
the African Development Bank (AfDB) regarding ICT. While the ITC helps companies to
use ICTs to facilitate access to export markets, the most recent AfDB project focuses on
building up an ICT platform for payment and settlement systems in countries of the
Eastern African Community.
Box 7 NTF II – Improving the export competitiveness of the IT and ITES sector in Bangladesh
The information technology (IT) and information technology enabled services (ITES) sector in Bangladesh
offers a strong value proposition, with a large pool of trained engineers and operators. However, despite the fast
growth of the sector, it remains a marginal contributor to Bangladeshi exports. Some of the binding constraints
are a) the lack of concrete, coordinated actions to exploit the sector’s foreign-trade potential, b) the inability of
the IT association to provide a results-oriented B2B matchmaking service to its members and c) the insufficient,
sporadic branding efforts, which result in a low visibility of Bangladesh on the global IT outsourcing
marketplace.
Against this backdrop, the Netherlands Trust Fund II (NTFII) project, funded by the Government of the
Netherlands, is supporting the IT and ITES sector in Bangladesh to improve its export competitiveness and to
benefit from business links with selected markets in Europe. The International Trade Centre (ITC) has been
implementing the project in partnership with Dhaka Chamber of Commerce and Industry (DCCI) and
Bangladesh Association of Software & Information Services (BASIS). The project, which was implemented
between October 2010 and 30 June 2013, has benefited 40 Bangladeshi companies.
In order to address these constraints, the main activities and outcomes of the project have been the
following:
1. Establish sustainable business relationships
Between January 2011 and October 2012, the project organised nine specialized business matchmaking
events in Denmark (2 events), the Netherlands (3), the United Kingdom (1), Germany (2) and Bangladesh (2).
These events were attended by 32 Bangladeshi companies, 147 buyers from the target markets, and resulted in
737 pre-scheduled business to business meetings.
The business-linkage activities resulted in an increase in exports of Bangladeshi IT & ITES services. A
survey undertaken in November 2012, in which 25 of the 40 NTFII companies participated, showed that 52% of
the companies had experienced an increase in exports in 2012 directly related to NTFII Bangladesh B2B
activities.
Amongst the success stories of Bangladeshi-European partnerships, which can be accredited to the project,
nSales, a Danish company is now outsourcing its sales automation to Bangladeshi-based BrainStation-23. The
Bangladeshi firm Structured Data Systems Ltd (SDSL) was hired by a Danish consulting company to develop
an iPhone application, as well as to create the server back-end and a website to accompany it. Furthermore,
follow-up business resulted from this initial deal for SDSL.
2. Strengthening of competencies of trade support institutions to provide business linkage services to
SMEs
ITC provided assistance to the trade support institutions BASIS and DCCI to extend their service portfolio
with a B2B matchmaking service so that they can contribute to the development of the Bangladeshi IT & ITES
sector on overseas markets. Support consisted in assisting and training staff at BASIS and DCCI to design the
business linkage service as a viable support service for SMEs; to manage the business linkage service
effectively; to undertake demand side analysis for the new service offering; and to build links with partner trade
support institutions in the selected European markets. Both partner organizations, BASIS and DCCI, deployed
the B2B matchmaking service as part of their service portfolio and have assigned a specific person to manage the

7. OVERCOMING THE BARRIERS – 71
AID FOR TRADE AND VALUE CHAINS IN INFORMATION AND COMMUNICATION TECHNOLOGIES © OECD/WTO 2013
service. For the first time, BASIS provided the service commercially to 16 of its members during the visit of a
delegation of European IT companies looking for business partners in February 2013.
3. Enhancing branding capacity
ITC supported BASIS and DCCI to develop a more effective and comprehensive brand for the industry
through specific public relations activities and mobilizing industry analysts. The project has been able to define a
strategic framework for the IT industry and to catch the attention of media and consultancies specialized in IT
outsourcing in the target markets.
Companies that are actively participating in the NTFII project have also completed the WTO/OECD
questionnaire. It is clear that linking Bangladeshi ICT sector is just one piece of the puzzle. There remain
challenges to the IT and ITES sector in Bangladesh in moving up or entering the value chain. Branding has been
highlighted as a challenge because Bangladesh is a destination difficult to sell on the global sourcing market.
Aside from branding, the companies indicated that the main challenges to entering or moving up the value chain
are inadequate or unreliable power infrastructure, requirements for commercial presence or joint ventures, access
to trade finance and unreliable internet access. Additional supply-side constraints include the business
environment and lack of labour force with high-end ICT skills.
This was the first project of this kind and scale at ITC. Given the success of the project, discussions are on-
going with development partners and countries to undertake similar activities for other emerging IT & ITES
sourcing destinations.
Source: International Trade Centre
Box 8 Activities of the International Trade Centre (ITC) to support the use of ICTs in
developing countries
For many years ITC has been involved in promoting the use of ICTs by developing countries and transition
economies to support trade development efforts. ITC has focused on two main areas of intervention:
1. Use ICTs to support the development of services’ exports
2. Use ICTs to improve positioning and visibility of partner countries in export markets
1. Use ICTs to support the development of services’ exports
ICT and other Business Services cover a broad spectrum of services, including IT & Software Services,
Business Process Outsourcing and other IT Enabled Services (ITES). Focusing on the IT and ITES sector, the
International Trade Centre aims at enhancing the capacity of developing countries to increase ICT and other
business services exports. In particular, ITC aims at targeting its technical assistance towards youth, as the
employment generation in this sector primarily targets young, skilled graduates.
ITC has used an integrated sectoral approach to re-enforce and expand current services’ exports, which
include the following activities:
Supporting branding /marketing
Supporting analysis of /build stakeholder confidence in developing the appropriate regulatory
framework needed for IT and ITES
Strengthening sector associations
Business-to-business linkages
Some examples of ITC work in this area:
72 – 7. OVERCOMING THE BARRIERS
AID FOR TRADE AND VALUE CHAINS IN INFORMATION AND COMMUNICATION TECHNOLOGIES © OECD/WTO 2013
In Bangladesh, within the framework of the NTFII project, funded by the Netherlands, ITC provided
advisory services on web strategies to export-oriented SMEs from the local IT industry, with a focus on
web advertisement, social media and search-engine optimization (SEO), as well as selling services to
new markets. As a result, NTFII beneficiaries have reported improved online visibility for their
companies and landed new clients.
In Fiji, ITC links rural producers with traders and exporters thanks to an innovative business-matching
platform which combines mobile and web applications. Current work focuses on connecting this system
to the local mobile-payment facility to cover the complete transaction cycle. Thanks to the financial
support of the EU, ITC has deployed similar services in the Maldives, Liberia and Benin.
2. Use ICTs to improve positioning and visibility of partner countries in export markets
In the second area of work, ITC focuses on using Information and communication technologies (ICTs) to
achieve increased market visibility and export development. Typically, to support this area, ITC projects include
production of websites and platforms (static, dynamic, with varying levels of complexity) to deliver information
and increase the visibility of partners export capabilities and competitive advantage. The ITC projects might
include as well the creation of web- or CD Rom-based tools such as diagnostic tools and use of mobile solutions
to enhance export competitiveness.
A few examples of such solutions delivered by ITC as part of its Trade-Related Technical Assistance
(TRTA) projects:
In Morocco, ITC has supported the upgrade of the web portal of the textile industry association AMITH
and is currently doing the same for the leather industry association FEDIC within the framework of
ITC’s EnACT programme. This allows the associations to link potential buyers with local suppliers
online.
In Algeria, ITC’s web marketing and e-commerce capacity building portfolio has been deployed across
seven cities to benefit more than 160 trainees, close to half of them women. This was done with the
support of the Algerian trade promotion organization ALGEX and the women entrepreneurs association
SEVE. The carpet makers association of Ghardaia, for example, is among the 70% of participants who
reported that their businesses had benefited directly from the training within 6 months
Source: International Trade Centre

7. OVERCOMING THE BARRIERS – 73
AID FOR TRADE AND VALUE CHAINS IN INFORMATION AND COMMUNICATION TECHNOLOGIES © OECD/WTO 2013
Box 9 Activities of the African Development Bank on ICT to support regional integration
The African Development Bank (AfDB) is well positioned to foster Africa’s economic integration to create
larger, more attractive markets, link landlocked countries to international markets and support intra-African
trade. Infrastructure being a key impediment to trade, the AfDB is taking a regionally integrated approach to
infrastructure development and is therefore participating fully in the implementation of the Programme for
Infrastructure Development in Africa (PIDA). According to the AfDB’s Annual Report for 2011, the largest
share (38.1%) of the Bank Group’s loan and grant approvals in 2011 was targeted at the infrastructure sector,
comprising Information and Communication Technology (ICT), amounting to UA 1.57 billion (approximately
USD 2.41 billion). Only two ICT projects were approved for a total amount of UA 21.6 million (approximately
USD 33.2 million), which constituted 0.5% of the AfDB’s total sectoral approvals in 2011.
ICTs represent a vital factor for an economy to compete and grow. In the case of the African continent,
which has been lagging behind in terms of fixed-line telephony, current innovative technologies and business
models are circumventing market inefficiencies and institutional bottlenecks. The strategic application of ICTs is
transforming African markets, with mobile money and e-banking at the lead. The AfDB’s two projects in 2011
were aligned to the Bank Group’s Medium-Term Strategy as well as its ICT Strategy. The objective of one of the
two projects, namely, ‘the Bamako Digital Complex Support Project’, was to support the Government of Mali’s
development strategy through sustainable capacity building in ICT fields, and so boost the country’s
competitiveness and economic growth. The expected outcomes e.g. include: sustainable ICT training and
incubation capacity; private–public partnerships established for: development of the sector; 25 ICT SMEs
established; and more women trained and involved in ICT activity.
The most recent AfDB intervention in the ICT sector in Africa is an UA15 million ADF (Regional
Operations) Grant financed Multinational Project entitled ‘the EAC Payment and Settlement Systems Integration
Project’. The project which covers all the East African Community (EAC) member countries – Kenya, Tanzania,
Uganda, Rwanda and Burundi and will be implemented from January 2013 to December 2016 encompasses an
ICT-based technological platform that provides a common foundation for the countries in the region and a basis
for further enhancements and development. The project also has a capacity development component to ensure
sustainability. The expected outcome of the proposed project is a sound platform aimed at enhancing payment
and settlement systems in the EAC Partner States as a prelude to the successful introduction of the East African
Monetary Union. Amongst others, this innovative project will contribute to:
Technical upgrade to payments systems, in the EAC Partner States, making cross-border settlements
faster and safer, and providing a basis for regional currency convertibility;
More effective implementation of monetary policy in the region and hence promotion of
macroeconomic stability and mitigation of systemic risk;
Increased cross-border trade in the EAC region;
Better financial market regulation and greater predictability to financial transactions ; and
Policy dialogue and movement toward economic integration; and
Assist the EAC to redress weaknesses in the legal and regulatory arrangements in banking and payment
and settlement systems through the harmonization of national legislation, regulations and policies
Source: African Development Bank

8. CONCLUSIONS – 75
AID FOR TRADE AND VALUE CHAINS IN INFORMATION AND COMMUNICATION TECHNOLOGIES © OECD/WTO 2013
8. Conclusions
ICT value chains cover both manufacturing and services activities. Value chains in ICT
manufacturing are concentrated in "Factory Asia" with China, Japan and Korea being
the largest producers of ICT goods, and China alone accounting for 37% of world ICT
exports. Developing countries which are not close to Factory Asia or to another big
market such as the United States only play a minor role in ICT manufacturing value
chains.
ICT services might offer a greater potential for developing countries to integrate into
ICT value chains as distance and scale economies are less important than for
manufacturing. Furthermore, ICT services such as telecommunications and computer
services are vital inputs to other sectors and are hence crucial for the productivity of
domestic firms and a country's broader economic development. Results from the
OECD-WTO partner questionnaires confirm that ICT services are a greater priority for
developing countries than ICT manufacturing. While more than 55% of ODA recipients
have included communication services and computer and information services in their
development strategies, only 12% have done so for the manufacturing of office and
telecommunications equipment.
The most prominent example of a successful developing country in ICT services value
chains is India which is the main destination for IT offshoring and accounts for about
20% of world exports in computer services. Other developing and emerging countries
like the Philippines, Argentina and Costa Rica have also been able to build up
comparative advantages in computer services exports.
While the focus of this report is on ICT value chains, it also examines advances in
ICT infrastructure and ICT as an enabling technology as ICT can be an important catalyst
to the achievement of the Millennium Development Goals. While the spread of mobile
telephony across developing countries has been a success story in development, with
mobile phone penetration in LDCs increasing from 8% in 2005 to 52% in 2012, the
digital divide between developing and developed countries is still large as illustrated by a
fixed broadband penetration in LDCs of below 1%.
The proliferation of fixed and mobile broadband access is promoted by the ITU-
UNESCO Broadband Commission for Digital Development and regarded as a stepping
stone for developing countries. While private investments in undersea cables in Africa
have grown significantly in recent years, regulators face the challenge to increase
competition in order to lower access prices to these cables and further investments into
terrestrial networks are required to bridge the "last kilometre" to users.
To identify the barriers that developing country firms face in integrating into ICT
value chains and possible support measures, the report analyses the results of a joint
OECD-WTO private sector questionnaire covering 80 suppliers and 44 lead companies in
ICT value chains from 55 countries.

76 – 8. CONCLUSIONS
AID FOR TRADE AND VALUE CHAINS IN INFORMATION AND COMMUNICATION TECHNOLOGIES © OECD/WTO 2013
In many instances, ICT firms face similar problems to suppliers in other value chains,
and would hence benefit from Aid-for-trade interventions targeted at such horizontal
constraints. These main horizontal constraints are access to finance and trade financing,
the business and regulatory environment and customs procedures and delays. The
importance of customs procedures stresses furthermore the potential benefits from
agreement on trade facilitation at the WTO.
Aid-for-trade interventions play a significant role in helping to overcome three sector-
specific barriers. First, the lack of ICT skills of the labour force represents a major
constraint faced by firms in developing countries. The ICT sector is skill intensive as
workers are required to conduct activities such as software and product engineering,
computer programming, web design or database administration. Aid-for-trade projects
may complement educational initiatives or support labour force training schemes to
address skills shortages. However, besides ICT-specific skills, ICT workers require also
horizontal skills such as English language skills or general business skills. In a broader
context, the digital literacy of ICT users is needed to foster the growth of e-commerce and
to allow poor people to exploit the development opportunities of ICT.
Second, developing country suppliers and lead firms highlight inadequate
telecommunications infrastructure as a significant barrier for developing country firms to
integrate into ICT value chains. Similarly, both partner and donor countries regard
inadequate domestic infrastructure as the most important obstacle of to greater
participation of companies in value chains. However, Aid for Trade on ICT projects is
much lower than Aid for Trade on transport and energy infrastructure. This lower support
can be explained by the fact that investments in ICT infrastructure tend to be more
private-sector driven and less capital intensive. Furthermore, the OECD-WTO
questionnaire reveals that, while ICT infrastructure is as important as power supply to
many developing country suppliers, power supply is the main supply-side constraint
faced by LDC suppliers. On the other hand, the digital divide between developing and
developed countries still exists and is widening in the case of LDCs. Hence, there should
be a more prominent role for Aid for Trade in certain LDCs and least connected countries
(LCCs) to support ICT development and facilitate private investments into ICT
infrastructure.
Third, Aid for Trade can achieve significant development outcomes by supporting the
capacity-building and the policy-making of telecommunications regulators. For instance,
existing Aid-for-trade projects foster regional integration and competitiveness by
supporting regulators to harmonize telecommunications legislation and regulation at a
regional level. Besides fostering competition and low prices, a sound regulatory
environment can facilitate private investment in ICT infrastructure.

REFERENCES – 77
AID FOR TRADE AND VALUE CHAINS IN INFORMATION AND COMMUNICATION TECHNOLOGIES © OECD/WTO 2013
References
Borchert, I., B. Gootiiz and A. Mattoo (2012), "Policy Barriers to International Trade in
Services: Evidence from a New Database", Policy Research Working Paper Series
6109, The World Bank.
De Backer, K. and S. Miroudot (2013), "Mapping Global Value Chains", OECD Trade
Policy Working Papers, No. 158, OECD.
Gereffi, G., J. Humphrey and T. Sturgeon (2005), "The governance of global value
chains", Review of
International Political Economy 12(1), 78-104.
ITU (2011), The Role of ICT in Advancing Growth in Least Developed Countries:
Trends, Challenges and Opportunities 2011, Geneva, ITU.
ITU (2012a), Measuring the Information Society 2012, Geneva, ITU.
ITU (2012b), Impact of Broadband on the Economy, Broadband Series, Geneva, ITU.
ITU (2012c), "Blurring boundaries: Global and regional IP interconnection", GSR 2012
Discussion Paper.
ITU (2013), Trends in Telecommunication Reform 2013: Transnational Aspects of
Regulation in a Networked Society, Geneva, ITU.
OECD (2011), OECD Guide to Measuring the Information Society 2011, Paris, OECD
Publishing.
OECD (2012), OECD Internet Economy Outlook 2012, Paris, OECD Publishing.
Pénicaud, C. (2013), State of the Industry: Results from the 2012 Global Mobile Money
Adoption Survey, GSMA Mobile Money for the Unbanked.
Sturgeon, T. and M. Kawakami (2010), “Global Value Chains in the Electronics Industry:
Was the Crisis a Window of Opportunity for Developing Countries?”, In: O. Cattaneo,
G. Gereffi and C. Staritz (eds.), Global Value Chains in a Postcrisis World. The World
Bank: Washington,D.C., 245-302.
UNCTAD (2011), Information Economy Report 2011: ICTs as Enabler for Private Sector
Development, Geneva, United Nations.
UNCTAD (2012a), World Investment Report 2012: Towards a New Generation of
Investment Policies, Geneva, United Nations.
UNCTAD (2012b), Information Economy Report 2012: The Software Industry and
Developing Countries, Geneva, United Nations.
UNCTAD (2012c), Mobile Money for Business Development in the East African
Community: A Comparative Study of Existing Platforms and Regulations, Geneva,
United Nations.
World Bank (2011), Africa's ICT infrastructure: Building on the Mobile Revolution,
Washington D.C., The World Bank.

78 – REFERENCES
AID FOR TRADE AND VALUE CHAINS IN INFORMATION AND COMMUNICATION TECHNOLOGIES © OECD/WTO 2013
World Bank (2012a), eTransform Africa: The Transformational Use of Information and
Communication Technologies in Africa, Washington D.C., The World Bank.
World Bank (2012b), Information and Communication for Development 2012:
Maximizing Mobile Maximising Mobile, Washington D.C., The World Bank.
World Economic Forum (WEF) (2013), Enabling Trade: Valuing Growth Opportunities,
Geneva, WEF.
WTO (2009a), Telecommunication services, Background Note by the Secretariat,
S/C/W/299.
WTO (2012), 15 Years of the Information Technology Agreement: Trade, innovation and
global production networks, Geneva, WTO.
WTO (2013), Electronic commerce, development and small, medium-sized enterprises,
Background Note by the Secretariat, WT/COMTD/W/193.
Yi, K-M. (2003), "Can Vertical Specialization Explain the Growth of World Trade?",
Journal of Political Economy, 111(1), 52-102.

ANNEX A. COUNTRY GROUPINGS BY INCOME AND REGION – 79
AID FOR TRADE AND VALUE CHAINS IN INFORMATION AND COMMUNICATION TECHNOLOGIES © OECD/WTO 2013
Annex A
Country groupings by income and region
Countries are grouped according to the OECD DAC list of official development
assistance (ODA) recipients. For practical purposes, the low income countries Kenya,
Kyrgyz Republic, Tajikistan and Zimbabwe are grouped together with LMICs. Income
and regional aggregates of ODA recipients are benchmarked against OECD Members.
The OECD Members Chile, Mexico and Turkey are included in the respective ODA
income or regional grouping and are therefore not included in OECD aggregates.
48 Least-developed countries (LDCs)
Country Region Country Region Country Region Country Region
Afghanistan Asia Djibouti Africa Madagascar Africa Sierra Leone Africa
Angola Africa Equatorial Guinea Africa Malawi Africa Solomon Islands Oceania
Bangladesh Asia Eritrea Africa Mali Africa Somalia Africa
Benin Africa Ethiopia Africa Mauritania Africa Sudan Africa
Bhutan Asia Gambia Africa Mozambique Africa Tanzania Africa
Burkina Faso Africa Guinea Africa Myanmar Asia Timor-Leste Asia
Burundi Africa Guinea-Bissau Africa Nepal Asia Togo Africa
Cambodia Asia Haiti America Niger Africa Tuvalu Oceania
Central African Rep. Africa Kiribati Oceania Rwanda Africa Uganda Africa
Chad Africa Laos Asia Samoa Oceania Vanuatu Oceania
Comoros Africa Lesotho Africa Sao Tome & Principe Africa Yemen Asia
Congo, Dem. Rep. Africa Liberia Africa Senegal Africa Zambia Africa
40 Low income and lower middle income countries (LMICs)
Country Region Country Region Country Region Country Region
Armenia Asia Georgia Asia Micronesia, F. States Oceania Sri Lanka Asia
Belize America Ghana Africa Moldova Europe Swaziland Africa
Bolivia America Guatemala America Mongolia Asia Syria Asia
Cameroon Africa Guyana America Morocco Africa Tajikistan Asia
Cape Verde Africa Honduras America Nicaragua America Tonga Oceania
Congo, Rep. Africa India Asia Nigeria Africa Turkmenistan Asia
Cote d'Ivoire Africa Indonesia Asia Pakistan Asia Ukraine Europe
Egypt Africa Iraq Asia Papua New Guinea Oceania Uzbekistan Asia
El Salvador America Kenya Africa Paraguay America Vietnam Asia
Fiji Oceania Kyrgyz Republic Asia Philippines Asia Zimbabwe Africa
46 Upper middle income countries (UMICs)
Country Region Country Region Country Region Country Region
Albania Europe Costa Rica America Libya Africa South Africa Africa
Algeria Africa Cuba America Macedonia, FYR Europe St. Kitts-Nevis America
Antigua and Barbuda America Dominica America Malaysia Asia St. Lucia America
Argentina America Dominican Republic America Maldives Asia St.Vinc.&Grenadines America
Azerbaijan Asia Ecuador America Mauritius Africa Suriname America
Belarus Europe Gabon Africa Mexico America Thailand Asia
Bosnia-Herzegovina Europe Grenada America Montenegro Europe Tunisia Africa
Botswana Africa Iran Asia Namibia Africa Turkey Europe
Brazil America Jamaica America Panama America Uruguay America
Chile America Jordan Asia Peru America Venezuela America
China Asia Kazakhstan Asia Serbia Europe
Colombia America Lebanon Asia Seychelles Africa

80 – ANNEX A. COUNTRY GROUPINGS BY INCOME AND REGION
AID FOR TRADE AND VALUE CHAINS IN INFORMATION AND COMMUNICATION TECHNOLOGIES © OECD/WTO 2013
31 OECD Members
Australia France Japan Slovakia
Austria Germany Luxembourg Slovenia
Belgium Greece Netherlands Spain
Canada Hungary New Zealand Sweden
Czech Rep. Iceland Norway Switzerland
Denmark Ireland Poland United Kingdom
Estonia Israel Portugal USA
Finland Italy Rep. of Korea

ANNEX B. TABLES AND FIGURES – 81
AID FOR TRADE AND VALUE CHAINS IN INFORMATION AND COMMUNICATION TECHNOLOGIES © OECD/WTO 2013
Annex B
Tables and figures
Table B.1 OECD definition of the ICT sector based on ISIC Rev. 3.1
ICT manufacturing industries
2610 Electronic components and boards
2620 Computers and peripheral equipment
2630 Communication equipment
2640 Consumer electronics
2680 Magnetic and optical media
ICT trade industries (wholesale)
4651 Computers, computer peripheral equipment and software
4652 Electronic and telecommunications equipment and parts
ICT services industries
5820 Software publishing
61 Telecommunications
620 Computer programming, consultancy and related activities
631 Data processing, hosting and related activities; web portals
951 Repair of computers and communication equipment
Source: OECD (2011).
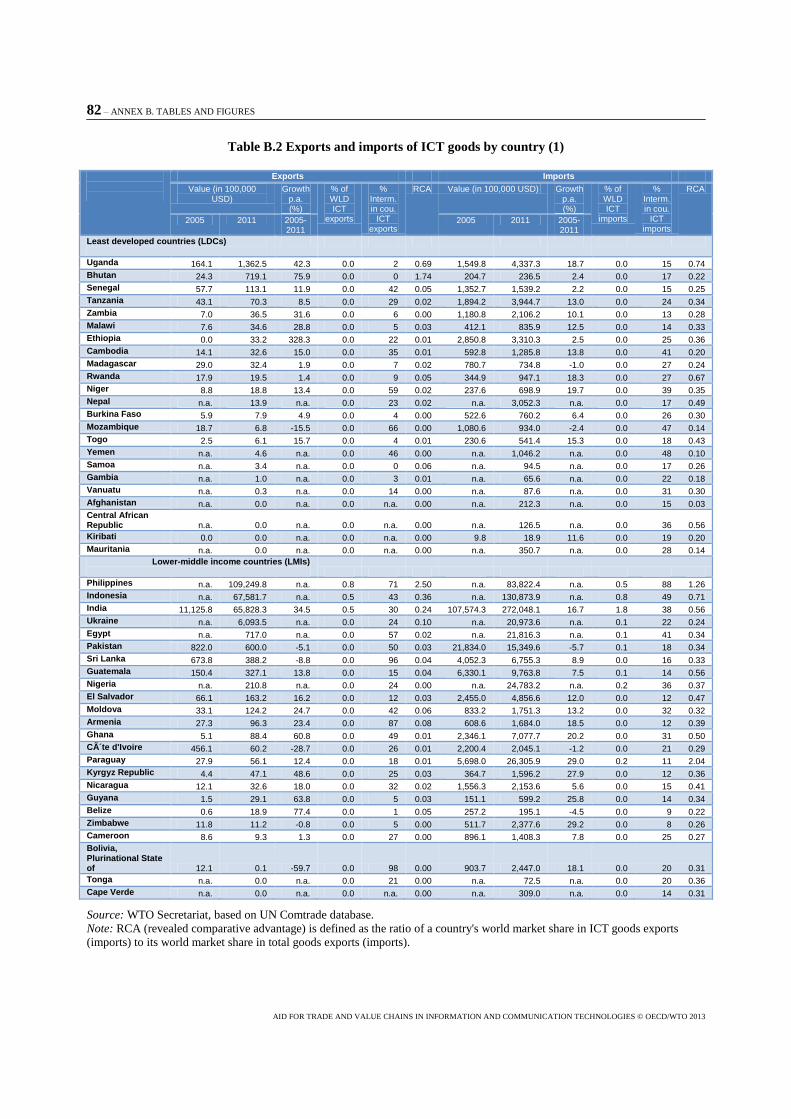
82 – ANNEX B. TABLES AND FIGURES
AID FOR TRADE AND VALUE CHAINS IN INFORMATION AND COMMUNICATION TECHNOLOGIES © OECD/WTO 2013
Table B.2 Exports and imports of ICT goods by country (1)
Exports Imports
Value (in 100,000 USD)
Growth p.a. (%)
% of WLD ICT
exports
% Interm. in cou.
ICT exports
RCA Value (in 100,000 USD) Growth p.a. (%)
% of WLD ICT
imports
% Interm. in cou.
ICT imports
RCA
2005 2011 2005-2011
2005 2011 2005-2011
Least developed countries (LDCs)
Uganda 164.1 1,362.5 42.3 0.0 2 0.69 1,549.8 4,337.3 18.7 0.0 15 0.74
Bhutan 24.3 719.1 75.9 0.0 0 1.74 204.7 236.5 2.4 0.0 17 0.22
Senegal 57.7 113.1 11.9 0.0 42 0.05 1,352.7 1,539.2 2.2 0.0 15 0.25
Tanzania 43.1 70.3 8.5 0.0 29 0.02 1,894.2 3,944.7 13.0 0.0 24 0.34
Zambia 7.0 36.5 31.6 0.0 6 0.00 1,180.8 2,106.2 10.1 0.0 13 0.28
Malawi 7.6 34.6 28.8 0.0 5 0.03 412.1 835.9 12.5 0.0 14 0.33
Ethiopia 0.0 33.2 328.3 0.0 22 0.01 2,850.8 3,310.3 2.5 0.0 25 0.36
Cambodia 14.1 32.6 15.0 0.0 35 0.01 592.8 1,285.8 13.8 0.0 41 0.20
Madagascar 29.0 32.4 1.9 0.0 7 0.02 780.7 734.8 -1.0 0.0 27 0.24
Rwanda 17.9 19.5 1.4 0.0 9 0.05 344.9 947.1 18.3 0.0 27 0.67
Niger 8.8 18.8 13.4 0.0 59 0.02 237.6 698.9 19.7 0.0 39 0.35
Nepal n.a. 13.9 n.a. 0.0 23 0.02 n.a. 3,052.3 n.a. 0.0 17 0.49
Burkina Faso 5.9 7.9 4.9 0.0 4 0.00 522.6 760.2 6.4 0.0 26 0.30
Mozambique 18.7 6.8 -15.5 0.0 66 0.00 1,080.6 934.0 -2.4 0.0 47 0.14
Togo 2.5 6.1 15.7 0.0 4 0.01 230.6 541.4 15.3 0.0 18 0.43
Yemen n.a. 4.6 n.a. 0.0 46 0.00 n.a. 1,046.2 n.a. 0.0 48 0.10
Samoa n.a. 3.4 n.a. 0.0 0 0.06 n.a. 94.5 n.a. 0.0 17 0.26
Gambia n.a. 1.0 n.a. 0.0 3 0.01 n.a. 65.6 n.a. 0.0 22 0.18
Vanuatu n.a. 0.3 n.a. 0.0 14 0.00 n.a. 87.6 n.a. 0.0 31 0.30
Afghanistan n.a. 0.0 n.a. 0.0 n.a. 0.00 n.a. 212.3 n.a. 0.0 15 0.03
Central African Republic n.a. 0.0 n.a. 0.0 n.a. 0.00 n.a. 126.5 n.a. 0.0 36 0.56
Kiribati 0.0 0.0 n.a. 0.0 n.a. 0.00 9.8 18.9 11.6 0.0 19 0.20
Mauritania n.a. 0.0 n.a. 0.0 n.a. 0.00 n.a. 350.7 n.a. 0.0 28 0.14
Lower-middle income countries (LMIs)
Philippines n.a. 109,249.8 n.a. 0.8 71 2.50 n.a. 83,822.4 n.a. 0.5 88 1.26
Indonesia n.a. 67,581.7 n.a. 0.5 43 0.36 n.a. 130,873.9 n.a. 0.8 49 0.71
India 11,125.8 65,828.3 34.5 0.5 30 0.24 107,574.3 272,048.1 16.7 1.8 38 0.56
Ukraine n.a. 6,093.5 n.a. 0.0 24 0.10 n.a. 20,973.6 n.a. 0.1 22 0.24
Egypt n.a. 717.0 n.a. 0.0 57 0.02 n.a. 21,816.3 n.a. 0.1 41 0.34
Pakistan 822.0 600.0 -5.1 0.0 50 0.03 21,834.0 15,349.6 -5.7 0.1 18 0.34
Sri Lanka 673.8 388.2 -8.8 0.0 96 0.04 4,052.3 6,755.3 8.9 0.0 16 0.33
Guatemala 150.4 327.1 13.8 0.0 15 0.04 6,330.1 9,763.8 7.5 0.1 14 0.56
Nigeria n.a. 210.8 n.a. 0.0 24 0.00 n.a. 24,783.2 n.a. 0.2 36 0.37
El Salvador 66.1 163.2 16.2 0.0 12 0.03 2,455.0 4,856.6 12.0 0.0 12 0.47
Moldova 33.1 124.2 24.7 0.0 42 0.06 833.2 1,751.3 13.2 0.0 32 0.32
Armenia 27.3 96.3 23.4 0.0 87 0.08 608.6 1,684.0 18.5 0.0 12 0.39
Ghana 5.1 88.4 60.8 0.0 49 0.01 2,346.1 7,077.7 20.2 0.0 31 0.50
Côte d'Ivoire 456.1 60.2 -28.7 0.0 26 0.01 2,200.4 2,045.1 -1.2 0.0 21 0.29
Paraguay 27.9 56.1 12.4 0.0 18 0.01 5,698.0 26,305.9 29.0 0.2 11 2.04
Kyrgyz Republic 4.4 47.1 48.6 0.0 25 0.03 364.7 1,596.2 27.9 0.0 12 0.36
Nicaragua 12.1 32.6 18.0 0.0 32 0.02 1,556.3 2,153.6 5.6 0.0 15 0.41
Guyana 1.5 29.1 63.8 0.0 5 0.03 151.1 599.2 25.8 0.0 14 0.34
Belize 0.6 18.9 77.4 0.0 1 0.05 257.2 195.1 -4.5 0.0 9 0.22
Zimbabwe 11.8 11.2 -0.8 0.0 5 0.00 511.7 2,377.6 29.2 0.0 8 0.26
Cameroon 8.6 9.3 1.3 0.0 27 0.00 896.1 1,408.3 7.8 0.0 25 0.27
Bolivia, Plurinational State of 12.1 0.1 -59.7 0.0 98 0.00 903.7 2,447.0 18.1 0.0 20 0.31
Tonga n.a. 0.0 n.a. 0.0 21 0.00 n.a. 72.5 n.a. 0.0 20 0.36
Cape Verde n.a. 0.0 n.a. 0.0 n.a. 0.00 n.a. 309.0 n.a. 0.0 14 0.31
Source: WTO Secretariat, based on UN Comtrade database.
Note: RCA (revealed comparative advantage) is defined as the ratio of a country's world market share in ICT goods exports
(imports) to its world market share in total goods exports (imports).
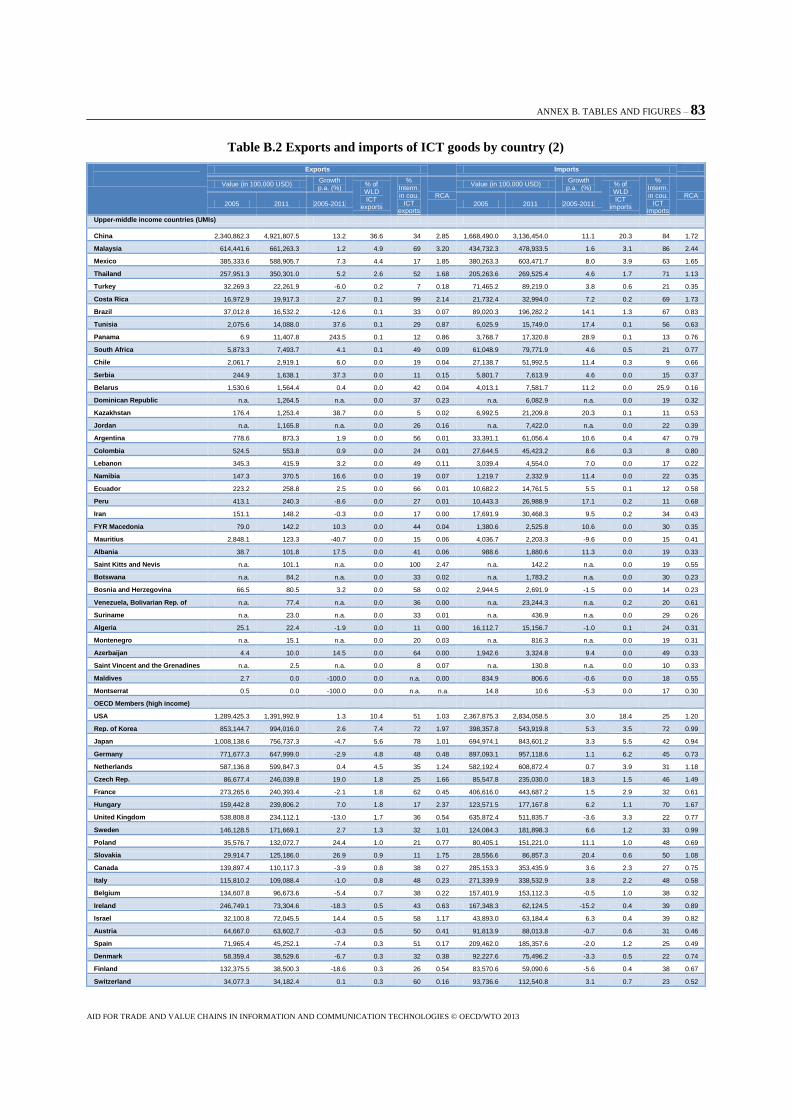
ANNEX B. TABLES AND FIGURES – 83
AID FOR TRADE AND VALUE CHAINS IN INFORMATION AND COMMUNICATION TECHNOLOGIES © OECD/WTO 2013
Table B.2 Exports and imports of ICT goods by country (2)
Exports
Imports
Value (in 100,000 USD) Growth p.a. (%)
% of WLD ICT
exports
% Interm. in cou.
ICT exports
RCA
Value (in 100,000 USD) Growth
p.a. (%) % of WLD ICT
imports
% Interm. in cou.
ICT imports
RCA
2005 2011 2005-2011 2005 2011 2005-2011
Upper-middle income countries (UMIs)
China 2,340,862.3 4,921,807.5 13.2 36.6 34 2.85 1,668,490.0 3,136,454.0 11.1 20.3 84 1.72
Malaysia 614,441.6 661,263.3 1.2 4.9 69 3.20 434,732.3 478,933.5 1.6 3.1 86 2.44
Mexico 385,333.6 588,905.7 7.3 4.4 17 1.85 380,263.3 603,471.7 8.0 3.9 63 1.65
Thailand 257,951.3 350,301.0 5.2 2.6 52 1.68 205,263.6 269,525.4 4.6 1.7 71 1.13
Turkey 32,269.3 22,261.9 -6.0 0.2 7 0.18 71,465.2 89,219.0 3.8 0.6 21 0.35
Costa Rica 16,972.9 19,917.3 2.7 0.1 99 2.14 21,732.4 32,994.0 7.2 0.2 69 1.73
Brazil 37,012.8 16,532.2 -12.6 0.1 33 0.07 89,020.3 196,282.2 14.1 1.3 67 0.83
Tunisia 2,075.6 14,088.0 37.6 0.1 29 0.87 6,025.9 15,749.0 17.4 0.1 56 0.63
Panama 6.9 11,407.8 243.5 0.1 12 0.86 3,768.7 17,320.8 28.9 0.1 13 0.76
South Africa 5,873.3 7,493.7 4.1 0.1 49 0.09 61,048.9 79,771.9 4.6 0.5 21 0.77
Chile 2,061.7 2,919.1 6.0 0.0 19 0.04 27,138.7 51,992.5 11.4 0.3 9 0.66
Serbia 244.9 1,638.1 37.3 0.0 11 0.15 5,801.7 7,613.9 4.6 0.0 15 0.37
Belarus 1,530.6 1,564.4 0.4 0.0 42 0.04 4,013.1 7,581.7 11.2 0.0 25.9 0.16
Dominican Republic n.a. 1,264.5 n.a. 0.0 37 0.23 n.a. 6,082.9 n.a. 0.0 19 0.32
Kazakhstan 176.4 1,253.4 38.7 0.0 5 0.02 6,992.5 21,209.8 20.3 0.1 11 0.53
Jordan n.a. 1,165.8 n.a. 0.0 26 0.16 n.a. 7,422.0 n.a. 0.0 22 0.39
Argentina 778.6 873.3 1.9 0.0 56 0.01 33,391.1 61,056.4 10.6 0.4 47 0.79
Colombia 524.5 553.8 0.9 0.0 24 0.01 27,644.5 45,423.2 8.6 0.3 8 0.80
Lebanon 345.3 415.9 3.2 0.0 49 0.11 3,039.4 4,554.0 7.0 0.0 17 0.22
Namibia 147.3 370.5 16.6 0.0 19 0.07 1,219.7 2,332.9 11.4 0.0 22 0.35
Ecuador 223.2 258.8 2.5 0.0 66 0.01 10,682.2 14,761.5 5.5 0.1 12 0.58
Peru 413.1 240.3 -8.6 0.0 27 0.01 10,443.3 26,988.9 17.1 0.2 11 0.68
Iran 151.1 148.2 -0.3 0.0 17 0.00 17,691.9 30,468.3 9.5 0.2 34 0.43
FYR Macedonia 79.0 142.2 10.3 0.0 44 0.04 1,380.6 2,525.8 10.6 0.0 30 0.35
Mauritius 2,848.1 123.3 -40.7 0.0 15 0.06 4,036.7 2,203.3 -9.6 0.0 15 0.41
Albania 38.7 101.8 17.5 0.0 41 0.06 988.6 1,880.6 11.3 0.0 19 0.33
Saint Kitts and Nevis n.a. 101.1 n.a. 0.0 100 2.47 n.a. 142.2 n.a. 0.0 19 0.55
Botswana n.a. 84.2 n.a. 0.0 33 0.02 n.a. 1,783.2 n.a. 0.0 30 0.23
Bosnia and Herzegovina 66.5 80.5 3.2 0.0 58 0.02 2,944.5 2,691.9 -1.5 0.0 14 0.23
Venezuela, Bolivarian Rep. of n.a. 77.4 n.a. 0.0 36 0.00 n.a. 23,244.3 n.a. 0.2 20 0.61
Suriname n.a. 23.0 n.a. 0.0 33 0.01 n.a. 436.9 n.a. 0.0 29 0.26
Algeria 25.1 22.4 -1.9 0.0 11 0.00 16,112.7 15,156.7 -1.0 0.1 24 0.31
Montenegro n.a. 15.1 n.a. 0.0 20 0.03 n.a. 816.3 n.a. 0.0 19 0.31
Azerbaijan 4.4 10.0 14.5 0.0 64 0.00 1,942.6 3,324.8 9.4 0.0 49 0.33
Saint Vincent and the Grenadines n.a. 2.5 n.a. 0.0 8 0.07 n.a. 130.8 n.a. 0.0 10 0.33
Maldives 2.7 0.0 -100.0 0.0 n.a. 0.00 834.9 806.6 -0.6 0.0 18 0.55
Montserrat 0.5 0.0 -100.0 0.0 n.a. n.a. 14.8 10.6 -5.3 0.0 17 0.30
OECD Members (high income)
USA 1,289,425.3 1,391,992.9 1.3 10.4 51 1.03 2,367,875.3 2,834,058.5 3.0 18.4 25 1.20
Rep. of Korea 853,144.7 994,016.0 2.6 7.4 72 1.97 398,357.8 543,919.8 5.3 3.5 72 0.99
Japan 1,008,138.6 756,737.3 -4.7 5.6 78 1.01 694,974.1 843,601.2 3.3 5.5 42 0.94
Germany 771,677.3 647,999.0 -2.9 4.8 48 0.48 897,093.1 957,118.6 1.1 6.2 45 0.73
Netherlands 587,136.8 599,847.3 0.4 4.5 35 1.24 582,192.4 608,872.4 0.7 3.9 31 1.18
Czech Rep. 86,677.4 246,039.8 19.0 1.8 25 1.66 85,547.8 235,030.0 18.3 1.5 46 1.49
France 273,265.6 240,393.4 -2.1 1.8 62 0.45 406,616.0 443,687.2 1.5 2.9 32 0.61
Hungary 159,442.8 239,806.2 7.0 1.8 17 2.37 123,571.5 177,167.8 6.2 1.1 70 1.67
United Kingdom 538,808.8 234,112.1 -13.0 1.7 36 0.54 635,872.4 511,835.7 -3.6 3.3 22 0.77
Sweden 146,128.5 171,669.1 2.7 1.3 32 1.01 124,084.3 181,898.3 6.6 1.2 33 0.99
Poland 35,576.7 132,072.7 24.4 1.0 21 0.77 80,405.1 151,221.0 11.1 1.0 48 0.69
Slovakia 29,914.7 125,186.0 26.9 0.9 11 1.75 28,556.6 86,857.3 20.4 0.6 50 1.08
Canada 139,897.4 110,117.3 -3.9 0.8 38 0.27 285,153.3 353,435.9 3.6 2.3 27 0.75
Italy 115,810.2 109,088.4 -1.0 0.8 48 0.23 271,339.9 338,532.9 3.8 2.2 48 0.58
Belgium 134,607.8 96,673.6 -5.4 0.7 38 0.22 157,401.9 153,112.3 -0.5 1.0 38 0.32
Ireland 246,749.1 73,304.6 -18.3 0.5 43 0.63 167,348.3 62,124.5 -15.2 0.4 39 0.89
Israel 32,100.8 72,045.5 14.4 0.5 58 1.17 43,893.0 63,184.4 6.3 0.4 39 0.82
Austria 64,667.0 63,602.7 -0.3 0.5 50 0.41 91,813.9 88,013.8 -0.7 0.6 31 0.46
Spain 71,965.4 45,252.1 -7.4 0.3 51 0.17 209,462.0 185,357.6 -2.0 1.2 25 0.49
Denmark 58,359.4 38,529.6 -6.7 0.3 32 0.38 92,227.6 75,496.2 -3.3 0.5 22 0.74
Finland 132,375.5 38,500.3 -18.6 0.3 26 0.54 83,570.6 59,090.6 -5.6 0.4 38 0.67
Switzerland 34,077.3 34,182.4 0.1 0.3 60 0.16 93,736.6 112,540.8 3.1 0.7 23 0.52

84 – ANNEX B. TABLES AND FIGURES
AID FOR TRADE AND VALUE CHAINS IN INFORMATION AND COMMUNICATION TECHNOLOGIES © OECD/WTO 2013
Portugal 29,722.6 22,398.9 -4.6 0.2 78 0.42 51,500.6 39,142.6 -4.5 0.3 37 0.47
Estonia 14,054.3 20,820.1 6.8 0.2 23 1.26 14,363.4 21,515.6 7.0 0.1 74 1.10
Australia 17,814.2 19,659.4 1.7 0.1 44 0.09 139,875.7 223,189.1 8.1 1.4 19 0.91
Norway 12,677.6 16,583.3 4.6 0.1 32 0.11 48,660.6 61,237.9 3.9 0.4 23 0.65
Greece 4,876.7 6,359.8 4.5 0.0 33 0.22 31,532.0 29,777.5 -0.9 0.2 39 0.47
Slovenia 2,285.3 5,522.3 15.8 0.0 28 0.21 8,482.2 12,123.5 6.1 0.1 30 0.37
Luxembourg 9,983.7 4,647.4 -12.0 0.0 49 0.31 14,700.4 10,275.3 -5.8 0.1 30 0.38
New Zealand 3,691.5 4,398.6 3.0 0.0 48 0.13 25,149.7 27,700.4 1.6 0.2 19 0.73
Iceland 31.3 36.0 2.3 0.0 25 0.01 3,178.3 2,073.2 -6.9 0.0 15 0.41
Source: WTO Secretariat, based on UN Comtrade database.
Note: RCA (revealed comparative advantage) is defined as the ratio of a country's world market share in ICT goods exports
(imports) to its world market share in total goods exports (imports).

ANNEX B. TABLES AND FIGURES – 85
AID FOR TRADE AND VALUE CHAINS IN INFORMATION AND COMMUNICATION TECHNOLOGIES © OECD/WTO 2013
Table B.3 Exports and imports of telecommunication services by country (1)
Exports Imports
Value ('000 USD) Growth p.a. (%)
Share (%)
RCA Value ('000 USD) Growth p.a. (%)
Share (%)
RCA
2005 2010 2005-2010 2010 2010 2005 2010 2005-2010 2010 2010
Least developed countries (LDCs)
Angola 14,039 35,122 20 0.06 1.78 23,301 362,170 73 0.67 0.98
Bangladesh 19,237 275,492 70 0.47 9.90 18,394 19,014 1 0.04 0.20
Benin 5,388 32,935 44 0.06 4.11 16,388 30,930 14 0.06 2.67
Burkina Faso 385 49,770 164 0.09 8.09 1,238 35,103 95 0.07 1.87
Cambodia 33,795 40,000 3 0.07 1.04 32,000 37,000 3 0.07 1.48
Djibouti 5,824 7,765 6 0.01 2.27 n.a. n.a. n.a. n.a. n.a.
Ethiopia 40,509 100,741 20 0.17 2.20 17,056 25,307 8 0.05 0.43
Gambia 7,660 12,999 11 0.02 6.40 288 4,523 73 0.01 2.74
Guinea 610 32,670 122 0.06 23.35 6,930 12,800 13 0.02 1.46
Guinea-Bissau n.a. 12,144 n.a. 0.02 16.09 3,811 4,659 5 0.01 2.34
Haiti 9,250 16,550 12 0.03 3.92 19,610 12,000 -9 0.02 0.43
Lao People's Dem. Rep. 5,847 27,259 36 0.05 2.42 1,527 8,891 42 0.02 1.50
Lesotho 1,267 859 -7 0.00 0.85 2,000 1,559 -5 0.00 0.14
Madagascar 1,798 n.a. n.a. n.a. n.a. 5,566 n.a. n.a. n.a. n.a.
Mali 44,236 120,143 22 0.21 14.68 22,940 67,637 24 0.13 2.95
Mozambique 10,557 38,160 29 0.07 2.88 11,177 46,097 33 0.09 1.75
Nepal 39,701 57,901 8 0.10 4.31 4,052 54,715 68 0.10 2.81
Rwanda 4,260 13,300 26 0.02 2.38 4,460 14,430 26 0.03 1.42
Samoa n.a. 4,479 n.a. 0.01 1.23 n.a. 32 n.a. 0.00 0.02
Sao Tome and Principe 915 1,180 5 0.00 4.41 52 1,100 84 0.00 1.55
Senegal 104,702 176,450 11 0.30 8.16 37,481 67,180 12 0.12 2.71
Sierra Leone 69 161 18 0.00 0.12 200 3,950 82 0.01 1.28
Sudan 3,840 65,336 76 0.11 12.68 3,520 15,816 35 0.03 0.31
Tanzania 33,749 38,897 3 0.07 0.83 15,744 20,478 5 0.04 0.48
Timor-Leste n.a. 5,911 n.a. 0.01 9.16 n.a. 2,250 n.a. 0.00 0.63
Uganda 16,671 19,470 3 0.03 0.81 9,588 16,592 12 0.03 0.39
Vanuatu 2,825 5,949 16 0.01 0.95 1,282 8,336 45 0.02 3.03
Yemen 41,388 105,400 21 0.18 3.14 9,244 24,700 22 0.05 0.47
Lower-middle income countries (LMICs)
Armenia 26,814 64,020 19 0.11 3.71 12,825 20,150 9 0.04 0.89
Belize 7,530 13,936 13 0.02 1.86 1,283 2,719 16 0.01 0.77
Bolivia, Plurinational State of 35,465 62,804 12 0.11 5.15 12,680 23,530 13 0.04 0.91
Côte d'Ivoire 86,032 n.a. n.a. n.a. n.a. 65,380 n.a. n.a. n.a. n.a.
El Salvador 102,600 168,100 10 0.29 7.74 18,800 33,460 12 0.06 1.42
Fiji 26,727 9,139 -19 0.02 0.50 17,760 69,946 32 0.13 6.03
Georgia 18,495 25,138 6 0.04 0.72 16,852 11,257 -8 0.02 0.49
Guatemala 172,000 313,200 13 0.54 6.21 11,400 36,400 26 0.07 0.67
Guyana 29,124 44,250 9 0.08 7.75 19,448 29,549 9 0.05 3.73
Honduras 132,900 252,200 14 0.43 10.92 6,548 205,400 99 0.38 6.80
India 782,958 705,417 -2 1.21 0.25 209,005 597,218 23 1.11 0.22
Iraq n.a. n.a. n.a. n.a. n.a. 236,400 n.a. n.a. n.a. n.a.
Kenya 176,492 356,878 15 0.61 5.31 106,994 162,963 9 0.30 3.90
Kyrgyz Republic 6,432 19,756 25 0.03 1.26 5,489 11,745 16 0.02 0.56
Micronesia, Federated States of 1,300 n.a. n.a. n.a. n.a. n.a. n.a. n.a. n.a. n.a.
Moldova 54,760 110,960 15 0.19 7.27 23,940 35,130 8 0.07 2.09
Mongolia 14,450 8,969 -9 0.02 0.81 23,370 26,094 2 0.05 1.49
Morocco 327,887 706,077 17 1.21 2.53 43,906 63,095 8 0.12 0.48
Nicaragua 28,300 71,200 20 0.12 6.36 5,100 26,000 39 0.05 1.64
Nigeria 20,217 47,428 19 0.08 0.79 144,707 271,760 13 0.50 0.59
Pakistan 284,000 239,000 -3 0.41 3.52 74,000 151,000 15 0.28 1.01
Papua New Guinea n.a. 478 n.a. 0.00 0.07 n.a. 40,231 n.a. 0.07 0.64
Paraguay 16,000 15,500 -1 0.03 0.51 n.a. n.a. n.a. n.a. n.a.
Philippines 522,000 305,000 -10 0.52 0.94 115,000 154,000 6 0.29 0.60
Sri Lanka 43,870 83,300 14 0.14 1.47 18,920 56,040 24 0.10 0.79
Syrian Arab Republic 125,000 139,016 2 0.24 0.86 17,000 19,474 3 0.04 0.25
Tajikistan 13,091 76,616 42 0.13 18.24 7,736 26,990 28 0.05 3.02
Tonga 4,600 882 -34 0.00 1.31 2,882 4,290 10 0.01 4.33
Zimbabwe 3,200 2,100 -8 0.00 0.52 n.a. n.a. n.a. n.a. n.a.
Source: WTO Secretariat, based on WTO Trade in Services database.
Note: RCA (revealed comparative advantage) is defined as the ratio of a country's world market share in
telecommunication services exports (imports) to its world market share in total services exports (imports).

86 – ANNEX B. TABLES AND FIGURES
AID FOR TRADE AND VALUE CHAINS IN INFORMATION AND COMMUNICATION TECHNOLOGIES © OECD/WTO 2013
Table B.3 Exports and imports of telecommunication services by country (2)
Exports Imports
Value ('000 USD) Growth p.a. (%)
Share (%)
RCA Value ('000 USD) Growth p.a. (%)
Share (%)
RCA
2005 2010 2005-2010 2010 2010 2005 2010 2005-2010 2010 2010
Upper-middle income countries (UMICs)
Albania 71,201 100,669 7 0.17 1.94 14,582 44,375 25 0.08 0.97
Algeria 86,000 143,000 11 0.24 1.77 123,000 70,000 -11 0.13 0.26
Argentina 169,950 244,090 8 0.42 0.82 238,599 327,465 7 0.61 1.03
Azerbaijan n.a. 75,294 n.a. 0.13 1.62 n.a. 51,922 n.a. 0.10 0.60
Belarus 90,300 167,300 13 0.29 1.63 70,100 102,100 8 0.19 1.54
Bosnia and Herzegovina 115,957 126,474 2 0.22 4.28 56,317 69,630 4 0.13 5.73
Botswana 8,709 4,061 -14 0.01 0.46 14,678 24,143 10 0.04 1.21
Brazil 231,629 401,349 12 0.69 0.58 108,419 269,673 20 0.50 0.20
Colombia 210,059 215,498 1 0.37 2.15 133,189 205,714 9 0.38 1.12
Costa Rica 31,451 37,972 4 0.06 0.38 40,045 74,700 13 0.14 1.82
Dominican Republic 113,500 166,800 8 0.29 1.45 17,100 40,000 19 0.07 0.85
Ecuador 80,075 161,898 15 0.28 5.13 5,982 23,635 32 0.04 0.35
FYR Macedonia 43,920 77,652 12 0.13 3.74 20,375 46,981 18 0.09 2.50
Kazakhstan 70,078 82,195 3 0.14 0.92 68,759 122,960 12 0.23 0.48
Lebanon 240,578 380,820 10 0.65 1.04 138,428 301,746 17 0.56 0.98
Libya n.a. 12,000 n.a. 0.02 1.27 n.a. 48,800 n.a. 0.09 0.40
Malaysia 614,848 560,054 -2 0.96 0.82 679,804 771,798 3 1.43 1.20
Mauritius 17,061 72,125 33 0.12 1.18 16,112 50,778 26 0.09 1.13
Mexico 547,927 202,448 -18 0.35 0.58 118,606 79,949 -8 0.15 0.16
Montenegro n.a. 35,543 n.a. 0.06 1.56 n.a. 19,917 n.a. 0.04 1.99
Namibia 16,774 14,223 -3 0.02 0.74 283 215 -7 0.00 0.02
Panama 126,800 249,300 14 0.43 1.80 25,100 46,200 13 0.09 0.78
Peru 68,719 101,862 8 0.17 1.16 96,490 180,049 13 0.33 1.34
Serbia n.a. 150,261 n.a. 0.26 1.85 n.a. 107,034 n.a. 0.20 1.34
Seychelles 12,616 7,583 -10 0.01 0.56 n.a. 923 n.a. 0.00 0.09
South Africa 176,044 207,336 3 0.35 0.66 153,740 365,397 19 0.68 0.88
Tunisia 45,166 302,082 46 0.52 2.40 27,747 59,592 17 0.11 0.82
Turkey 412,000 462,999 2 0.79 0.59 183,000 226,000 4 0.42 0.54
Uruguay 17,910 29,762 11 0.05 0.51 15,854 43,192 22 0.08 1.26
Venezuela, Bolivarian Rep. of 61,000 78,000 5 0.13 2.08 69,000 298,000 34 0.55 1.23
OECD Members (high income)
Australia 212,563 170,617 -4 0.29 0.16 436,861 409,114 -1 0.76 0.36
Austria 754,862 908,555 4 1.56 0.73 634,234 822,468 5 1.53 0.97
Belgium 1,418,942 3,540,186 20 6.06 1.80 962,543 2,758,776 23 5.12 1.53
Canada 1,133,063 1,726,883 11 2.96 1.25 817,819 1,168,752 9 2.17 0.64
Czech Republic 353,332 480,104 6 0.82 1.00 342,618 546,975 10 1.02 1.41
Denmark 607,814 426,558 -7 0.73 0.31 686,019 578,227 -3 1.07 0.50
Estonia 75,772 193,735 21 0.33 1.87 89,111 193,678 17 0.36 3.04
Finland 212,058 148,508 -7 0.25 0.23 500,771 404,877 -4 0.75 0.64
France n.a. 4,448,741 n.a. 7.61 1.34 n.a. 3,756,068 n.a. 6.97 1.24
Germany 2,676,217 3,570,648 6 6.11 0.67 3,717,107 5,236,774 7 9.72 0.87
Greece 342,014 393,937 3 0.67 0.46 285,803 n.a. n.a. n.a. n.a.
Hungary 293,173 376,452 5 0.64 0.85 305,905 379,280 4 0.70 1.07
Iceland n.a. 30,104 n.a. 0.05 0.54 n.a. 43,716 n.a. 0.08 0.88
Ireland 430,284 580,098 6 0.99 0.26 705,119 1,280,718 13 2.38 0.52
Israel 161,400 288,800 12 0.49 0.52 211,300 298,200 7 0.55 0.73
Italy 1,979,804 6,492,355 27 11.11 2.89 2,444,909 6,264,594 21 11.63 2.50
Korea, Republic of n.a. 599,900 n.a. 1.03 0.30 n.a. 892,200 n.a. 1.66 0.41
Luxembourg 1,068,249 2,575,476 19 4.41 1.69 1,112,023 797,966 -6 1.48 0.95
Netherlands 1,875,986 n.a. n.a. n.a. n.a. 1,657,976 n.a. n.a. n.a. n.a.
Norway 302,211 563,792 13 0.97 0.62 219,480 1,546,220 48 2.87 1.59
Poland 279,093 467,616 11 0.80 0.62 337,817 534,607 10 0.99 0.79
Portugal 480,612 578,151 4 0.99 1.09 327,625 534,273 10 0.99 1.63
Slovak Republic 102,456 106,484 1 0.18 0.80 69,249 114,430 11 0.21 0.73
Slovenia 109,009 283,873 21 0.49 2.01 134,234 310,535 18 0.58 3.13
Spain n.a. n.a. n.a. n.a. n.a. n.a. 2,240,926 n.a. 4.16 1.12
Sweden 1,268,819 1,557,401 4 2.67 1.03 1,428,191 1,865,968 5 3.46 1.68
United Kingdom 5,792,748 6,808,008 3 11.65 1.20 4,954,563 5,819,101 3 10.81 1.58
United States 4,748,000 11,095,000 19 18.99 0.91 4,519,000 8,006,000 12 14.87 0.94
Source: WTO Secretariat, based on WTO Trade in Services database.
Note: RCA (revealed comparative advantage) is defined as the ratio of a country's world market share in
telecommunication services exports (imports) to its world market share in total services exports (imports).
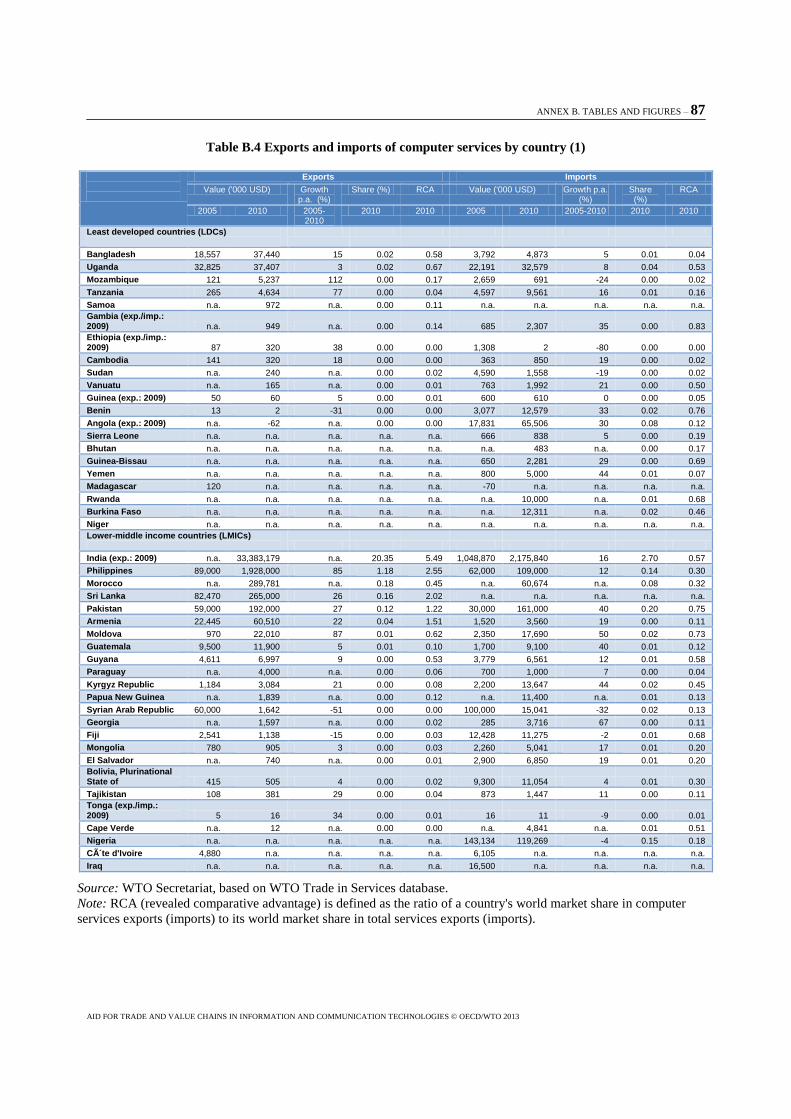
ANNEX B. TABLES AND FIGURES – 87
AID FOR TRADE AND VALUE CHAINS IN INFORMATION AND COMMUNICATION TECHNOLOGIES © OECD/WTO 2013
Table B.4 Exports and imports of computer services by country (1)
Exports Imports
Value ('000 USD) Growth p.a. (%)
Share (%) RCA Value ('000 USD) Growth p.a. (%)
Share (%)
RCA
2005 2010 2005-2010
2010 2010 2005 2010 2005-2010 2010 2010
Least developed countries (LDCs)
Bangladesh 18,557 37,440 15 0.02 0.58 3,792 4,873 5 0.01 0.04
Uganda 32,825 37,407 3 0.02 0.67 22,191 32,579 8 0.04 0.53
Mozambique 121 5,237 112 0.00 0.17 2,659 691 -24 0.00 0.02
Tanzania 265 4,634 77 0.00 0.04 4,597 9,561 16 0.01 0.16
Samoa n.a. 972 n.a. 0.00 0.11 n.a. n.a. n.a. n.a. n.a.
Gambia (exp./imp.: 2009) n.a. 949 n.a. 0.00 0.14 685 2,307 35 0.00 0.83
Ethiopia (exp./imp.: 2009) 87 320 38 0.00 0.00 1,308 2 -80 0.00 0.00
Cambodia 141 320 18 0.00 0.00 363 850 19 0.00 0.02
Sudan n.a. 240 n.a. 0.00 0.02 4,590 1,558 -19 0.00 0.02
Vanuatu n.a. 165 n.a. 0.00 0.01 763 1,992 21 0.00 0.50
Guinea (exp.: 2009) 50 60 5 0.00 0.01 600 610 0 0.00 0.05
Benin 13 2 -31 0.00 0.00 3,077 12,579 33 0.02 0.76
Angola (exp.: 2009) n.a. -62 n.a. 0.00 0.00 17,831 65,506 30 0.08 0.12
Sierra Leone n.a. n.a. n.a. n.a. n.a. 666 838 5 0.00 0.19
Bhutan n.a. n.a. n.a. n.a. n.a. n.a. 483 n.a. 0.00 0.17
Guinea-Bissau n.a. n.a. n.a. n.a. n.a. 650 2,281 29 0.00 0.69
Yemen n.a. n.a. n.a. n.a. n.a. 800 5,000 44 0.01 0.07
Madagascar 120 n.a. n.a. n.a. n.a. -70 n.a. n.a. n.a. n.a.
Rwanda n.a. n.a. n.a. n.a. n.a. n.a. 10,000 n.a. 0.01 0.68
Burkina Faso n.a. n.a. n.a. n.a. n.a. n.a. 12,311 n.a. 0.02 0.46
Niger n.a. n.a. n.a. n.a. n.a. n.a. n.a. n.a. n.a. n.a.
Lower-middle income countries (LMICs)
India (exp.: 2009) n.a. 33,383,179 n.a. 20.35 5.49 1,048,870 2,175,840 16 2.70 0.57
Philippines 89,000 1,928,000 85 1.18 2.55 62,000 109,000 12 0.14 0.30
Morocco n.a. 289,781 n.a. 0.18 0.45 n.a. 60,674 n.a. 0.08 0.32
Sri Lanka 82,470 265,000 26 0.16 2.02 n.a. n.a. n.a. n.a. n.a.
Pakistan 59,000 192,000 27 0.12 1.22 30,000 161,000 40 0.20 0.75
Armenia 22,445 60,510 22 0.04 1.51 1,520 3,560 19 0.00 0.11
Moldova 970 22,010 87 0.01 0.62 2,350 17,690 50 0.02 0.73
Guatemala 9,500 11,900 5 0.01 0.10 1,700 9,100 40 0.01 0.12
Guyana 4,611 6,997 9 0.00 0.53 3,779 6,561 12 0.01 0.58
Paraguay n.a. 4,000 n.a. 0.00 0.06 700 1,000 7 0.00 0.04
Kyrgyz Republic 1,184 3,084 21 0.00 0.08 2,200 13,647 44 0.02 0.45
Papua New Guinea n.a. 1,839 n.a. 0.00 0.12 n.a. 11,400 n.a. 0.01 0.13
Syrian Arab Republic 60,000 1,642 -51 0.00 0.00 100,000 15,041 -32 0.02 0.13
Georgia n.a. 1,597 n.a. 0.00 0.02 285 3,716 67 0.00 0.11
Fiji 2,541 1,138 -15 0.00 0.03 12,428 11,275 -2 0.01 0.68
Mongolia 780 905 3 0.00 0.03 2,260 5,041 17 0.01 0.20
El Salvador n.a. 740 n.a. 0.00 0.01 2,900 6,850 19 0.01 0.20
Bolivia, Plurinational State of 415 505 4 0.00 0.02 9,300 11,054 4 0.01 0.30
Tajikistan 108 381 29 0.00 0.04 873 1,447 11 0.00 0.11
Tonga (exp./imp.: 2009) 5 16 34 0.00 0.01 16 11 -9 0.00 0.01
Cape Verde n.a. 12 n.a. 0.00 0.00 n.a. 4,841 n.a. 0.01 0.51
Nigeria n.a. n.a. n.a. n.a. n.a. 143,134 119,269 -4 0.15 0.18
Côte d'Ivoire 4,880 n.a. n.a. n.a. n.a. 6,105 n.a. n.a. n.a. n.a.
Iraq n.a. n.a. n.a. n.a. n.a. 16,500 n.a. n.a. n.a. n.a.
Source: WTO Secretariat, based on WTO Trade in Services database.
Note: RCA (revealed comparative advantage) is defined as the ratio of a country's world market share in computer
services exports (imports) to its world market share in total services exports (imports).
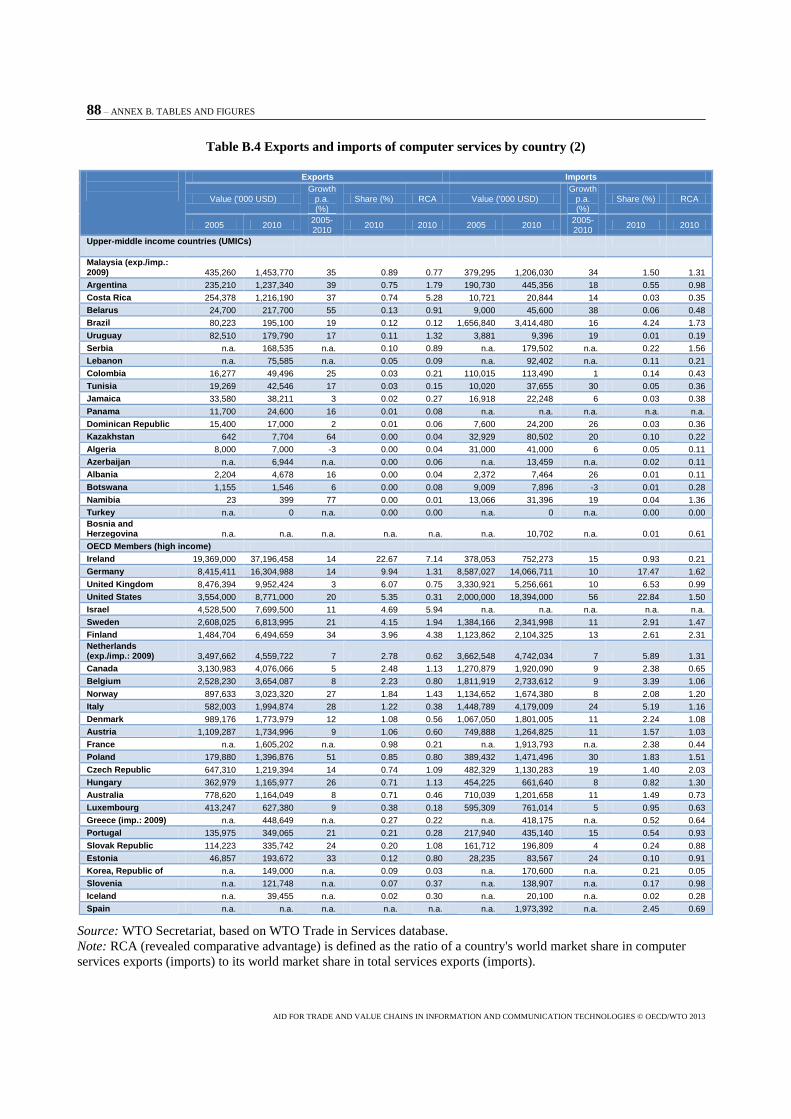
88 – ANNEX B. TABLES AND FIGURES
AID FOR TRADE AND VALUE CHAINS IN INFORMATION AND COMMUNICATION TECHNOLOGIES © OECD/WTO 2013
Table B.4 Exports and imports of computer services by country (2)
Exports Imports
Value ('000 USD) Growth
p.a. (%)
Share (%) RCA Value ('000 USD) Growth
p.a. (%)
Share (%) RCA
2005 2010 2005-2010
2010 2010 2005 2010 2005-2010
2010 2010
Upper-middle income countries (UMICs)
Malaysia (exp./imp.: 2009) 435,260 1,453,770 35 0.89 0.77 379,295 1,206,030 34 1.50 1.31
Argentina 235,210 1,237,340 39 0.75 1.79 190,730 445,356 18 0.55 0.98
Costa Rica 254,378 1,216,190 37 0.74 5.28 10,721 20,844 14 0.03 0.35
Belarus 24,700 217,700 55 0.13 0.91 9,000 45,600 38 0.06 0.48
Brazil 80,223 195,100 19 0.12 0.12 1,656,840 3,414,480 16 4.24 1.73
Uruguay 82,510 179,790 17 0.11 1.32 3,881 9,396 19 0.01 0.19
Serbia n.a. 168,535 n.a. 0.10 0.89 n.a. 179,502 n.a. 0.22 1.56
Lebanon n.a. 75,585 n.a. 0.05 0.09 n.a. 92,402 n.a. 0.11 0.21
Colombia 16,277 49,496 25 0.03 0.21 110,015 113,490 1 0.14 0.43
Tunisia 19,269 42,546 17 0.03 0.15 10,020 37,655 30 0.05 0.36
Jamaica 33,580 38,211 3 0.02 0.27 16,918 22,248 6 0.03 0.38
Panama 11,700 24,600 16 0.01 0.08 n.a. n.a. n.a. n.a. n.a.
Dominican Republic 15,400 17,000 2 0.01 0.06 7,600 24,200 26 0.03 0.36
Kazakhstan 642 7,704 64 0.00 0.04 32,929 80,502 20 0.10 0.22
Algeria 8,000 7,000 -3 0.00 0.04 31,000 41,000 6 0.05 0.11
Azerbaijan n.a. 6,944 n.a. 0.00 0.06 n.a. 13,459 n.a. 0.02 0.11
Albania 2,204 4,678 16 0.00 0.04 2,372 7,464 26 0.01 0.11
Botswana 1,155 1,546 6 0.00 0.08 9,009 7,896 -3 0.01 0.28
Namibia 23 399 77 0.00 0.01 13,066 31,396 19 0.04 1.36
Turkey n.a. 0 n.a. 0.00 0.00 n.a. 0 n.a. 0.00 0.00
Bosnia and Herzegovina n.a. n.a. n.a. n.a. n.a. n.a. 10,702 n.a. 0.01 0.61
OECD Members (high income)
Ireland 19,369,000 37,196,458 14 22.67 7.14 378,053 752,273 15 0.93 0.21
Germany 8,415,411 16,304,988 14 9.94 1.31 8,587,027 14,066,711 10 17.47 1.62
United Kingdom 8,476,394 9,952,424 3 6.07 0.75 3,330,921 5,256,661 10 6.53 0.99
United States 3,554,000 8,771,000 20 5.35 0.31 2,000,000 18,394,000 56 22.84 1.50
Israel 4,528,500 7,699,500 11 4.69 5.94 n.a. n.a. n.a. n.a. n.a.
Sweden 2,608,025 6,813,995 21 4.15 1.94 1,384,166 2,341,998 11 2.91 1.47
Finland 1,484,704 6,494,659 34 3.96 4.38 1,123,862 2,104,325 13 2.61 2.31
Netherlands (exp./imp.: 2009) 3,497,662 4,559,722 7 2.78 0.62 3,662,548 4,742,034 7 5.89 1.31
Canada 3,130,983 4,076,066 5 2.48 1.13 1,270,879 1,920,090 9 2.38 0.65
Belgium 2,528,230 3,654,087 8 2.23 0.80 1,811,919 2,733,612 9 3.39 1.06
Norway 897,633 3,023,320 27 1.84 1.43 1,134,652 1,674,380 8 2.08 1.20
Italy 582,003 1,994,874 28 1.22 0.38 1,448,789 4,179,009 24 5.19 1.16
Denmark 989,176 1,773,979 12 1.08 0.56 1,067,050 1,801,005 11 2.24 1.08
Austria 1,109,287 1,734,996 9 1.06 0.60 749,888 1,264,825 11 1.57 1.03
France n.a. 1,605,202 n.a. 0.98 0.21 n.a. 1,913,793 n.a. 2.38 0.44
Poland 179,880 1,396,876 51 0.85 0.80 389,432 1,471,496 30 1.83 1.51
Czech Republic 647,310 1,219,394 14 0.74 1.09 482,329 1,130,283 19 1.40 2.03
Hungary 362,979 1,165,977 26 0.71 1.13 454,225 661,640 8 0.82 1.30
Australia 778,620 1,164,049 8 0.71 0.46 710,039 1,201,658 11 1.49 0.73
Luxembourg 413,247 627,380 9 0.38 0.18 595,309 761,014 5 0.95 0.63
Greece (imp.: 2009) n.a. 448,649 n.a. 0.27 0.22 n.a. 418,175 n.a. 0.52 0.64
Portugal 135,975 349,065 21 0.21 0.28 217,940 435,140 15 0.54 0.93
Slovak Republic 114,223 335,742 24 0.20 1.08 161,712 196,809 4 0.24 0.88
Estonia 46,857 193,672 33 0.12 0.80 28,235 83,567 24 0.10 0.91
Korea, Republic of n.a. 149,000 n.a. 0.09 0.03 n.a. 170,600 n.a. 0.21 0.05
Slovenia n.a. 121,748 n.a. 0.07 0.37 n.a. 138,907 n.a. 0.17 0.98
Iceland n.a. 39,455 n.a. 0.02 0.30 n.a. 20,100 n.a. 0.02 0.28
Spain n.a. n.a. n.a. n.a. n.a. n.a. 1,973,392 n.a. 2.45 0.69
Source: WTO Secretariat, based on WTO Trade in Services database.
Note: RCA (revealed comparative advantage) is defined as the ratio of a country's world market share in computer
services exports (imports) to its world market share in total services exports (imports).

ANNEX B. TABLES AND FIGURES – 89
AID FOR TRADE AND VALUE CHAINS IN INFORMATION AND COMMUNICATION TECHNOLOGIES © OECD/WTO 2013
Table B.5 Capital expenditure in telecommunication services (1)
Capital expenditure (in 100,000 USD)
Growth p.a. (%) Share in gross fixed capital
formation (%)
2000/02 2005/07 2010 02-10 07-10 2000/02 2005/07 2010
Least developed countries (LDCs)
Sudan 1,099 49,654 62,550 65.7 8.0 4.3 58.4 47.9
Cambodia n.a. n.a. 4,290 n.a. n.a. n.a. n.a. 23.6
Senegal 845 1,800 3,271 18.4 22.0 7.3 6.2 8.8
Bangladesh 799 n.a. 2,618 16.0 n.a. 0.7 n.a. 1.1
Mali 172 935 1,930 35.2 27.3 2.5 6.8 n.a.
Rwanda n.a. 179 1,815 n.a. 116.4 n.a. 3.4 15.4
Niger 107 438 1,329 37.0 44.8 4.4 7.0 n.a.
Congo (Democratic Republic of the) n.a. 5,516 1,209 n.a. -39.7 n.a. 41.5 3.9
Uganda 637 673 1,006 5.9 14.3 5.4 3.0 2.5
Benin 280 695 934 16.3 10.4 6.0 7.3 5.5
Madagascar 107 508 886 30.2 20.3 1.6 3.1 n.a.
Togo 234 631 461 8.8 -9.9 11.7 17.9 7.7
Mauritania 676 651 429 -5.5 -13.0 30.9 6.4 4.9
Central African Rep. 1 n.a. 271 98.3 n.a. 0.1 n.a. 9.5
Lesotho 115 17 112 -0.3 85.7 4.3 0.6 1.8
Sao Tome and Principe 19 13 101 22.9 95.8 n.a. n.a. n.a.
Bhutan 23 169 81 16.9 -21.8 0.8 3.9 1.0
Vanuatu n.a. 27 24 n.a. -4.6 n.a. 2.8 n.a.
Lower-middle income countries (LMIs)
India 35,119 131,111 132,747 18.1 0.4 3.0 4.1 2.6
Egypt 6,691 15,618 35,262 23.1 31.2 3.9 7.4 8.7
Indonesia 10,183 36,651 24,990 11.9 -12.0 3.0 4.2 1.1
Nigeria 1,623 9,310 15,303 32.4 18.0 n.a. n.a. n.a.
Philippines 9,305 n.a. 12,455 3.7 n.a. 5.5 n.a. 3.0
Pakistan 1,866 23,977 11,959 26.1 -20.7 1.6 9.5 4.9
Ghana 485 n.a. 7,664 41.2 n.a. 3.9 n.a. 10.3
Ukraine 3,760 17,990 7,415 8.9 -25.6 5.2 6.4 2.8
Morocco 5,703 5,534 7,223 3.0 9.3 5.9 2.8 2.6
Kenya 3,043 6,993 7,122 11.2 0.6 13.5 16.0 10.9
Iraq n.a. n.a. 2,991 n.a. n.a. n.a. n.a. n.a.
Syria 1,813 1,012 2,848 5.8 41.2 4.5 1.4 2.6
Cote d'Ivoire 1,072 3,097 2,720 12.3 -4.2 9.3 18.8 8.6
Bolivia 1,185 n.a. 2,613 10.4 n.a. 9.2 n.a. 8.0
Moldova 411 1,131 1,395 16.5 7.2 18.4 10.6 10.6
Georgia 767 n.a. 1,287 6.7 n.a. 9.3 n.a. 5.7
Armenia 224 343 1,195 23.3 51.6 5.5 1.4 3.9
Honduras 428 2,127 806 8.2 -27.6 2.4 6.8 2.2
Congo n.a. n.a. 738 n.a. n.a. n.a. n.a. 3.0
Kyrgyzstan 32 542 680 46.4 7.9 1.2 8.3 5.0
Mongolia 33 555 663 45.5 6.1 1.1 5.0 3.3
Guyana 144 549 331 11.0 -15.5 9.1 15.7 5.8
Swaziland 88 n.a. 309 17.0 n.a. 3.2 n.a. 7.5
Belize 161 178 300 8.1 18.9 7.2 7.9 n.a.
Upper-middle income countries (UMIs)
China 275,778 266,033 343,499 2.8 8.9 5.9 2.4 1.3
Brazil 68,611 66,413 88,056 3.2 9.9 7.2 3.6 2.1
Mexico 46,543 34,985 56,748 2.5 17.5 3.7 1.8 2.7
Turkey 3,958 16,794 25,022 25.9 14.2 1.0 1.4 1.8
Chile 8,356 12,956 19,198 11.0 14.0 5.5 4.3 4.1
South Africa 12,831 19,714 18,181 4.5 -2.7 7.1 4.0 2.6

90 – ANNEX B. TABLES AND FIGURES
AID FOR TRADE AND VALUE CHAINS IN INFORMATION AND COMMUNICATION TECHNOLOGIES © OECD/WTO 2013
Table B.5 Capital expenditure in telecommunication services (2)
Capital expenditure (in 100,000 USD)
Growth p.a. (%) Share in gross fixed capital
formation (%)
2000/01 2005/06 2010 02-10 06-10 2000/01 2005/06 2010
Malaysia 11,625 16,726 17,338 5.1 1.2 4.9 4.5 3.2
Venezuela 9,452 14,170 14,668 5.6 1.2 3.8 3.3 2.0
Peru 2,444 4,126 8,471 16.8 27.1 2.4 2.2 2.2
Thailand 12,267 7,966 7,354 -6.2 -2.6 4.5 1.4 0.9
Uruguay 1,047 1,038 5,834 24.0 77.8 4.0 2.9 7.9
Belarus 538 4,842 4,916 31.9 0.5 1.8 4.4 2.3
Tunisia 2,260 2,656 4,070 7.6 15.3 4.1 3.4 3.8
Serbia n.a. 4,251 3,567 n.a. -5.7 n.a. 6.3 4.1
Jordan 2,249 2,009 3,096 4.1 15.5 12.6 4.9 5.1
Azerbaijan 190 1,549 2,541 38.3 17.9 1.2 2.5 2.9
Dominican Rep. 4,059 2,529 1,955 -8.7 -8.2 8.2 3.8 2.3
Bosnia and Herzegovina 583 1,168 1,693 14.3 13.1 5.0 3.5 6.0
Jamaica 1,871 1,701 1,517 -2.6 -3.7 7.1 5.3 5.7
Albania 242 600 1,436 24.9 33.8 2.3 2.4 4.7
Cuba 1,237 838 671 -7.4 -7.1 3.7 1.7 n.a.
Namibia 228 204 466 9.3 31.6 3.3 1.2 1.6
Saint Lucia n.a. 113 137 n.a. 6.7 n.a. 3.5 3.5
Grenada n.a. 130 70 n.a. -18.4 n.a. 4.6 4.2
Dominica n.a. 69 46 n.a. -12.5 n.a. 8.9 4.5
Saint Kitts and Nevis n.a. 83 37 n.a. -23.7 n.a. 3.0 1.5
OECD Members (high income)
United States 692,073 767,870 701,490 0.2 -3.0 3.5 3.0 3.4
Japan 255,187 190,281 169,359 -5.0 -3.8 2.5 1.9 1.5
France 63,569 83,669 86,212 3.9 1.0 2.5 1.8 1.7
Canada 47,451 59,890 81,553 7.0 10.8 3.4 2.1 2.3
Italy 75,565 94,637 81,457 0.9 -4.9 3.2 2.3 2.0
Germany 86,064 83,772 78,146 -1.2 -2.3 2.2 1.6 1.4
Australia 49,310 51,456 61,725 2.8 6.3 5.1 2.5 2.0
United Kingdom 152,943 n.a. 56,878 -11.6 n.a. 6.0 n.a. 1.7
Korea (Rep. of) 77,874 63,887 55,371 -4.2 -4.7 5.0 2.3 1.9
Spain 64,271 73,187 52,711 -2.4 -10.4 3.9 1.9 1.7
Netherlands 28,546 22,359 24,817 -1.7 3.5 3.3 1.6 1.8
Poland 13,685 21,445 23,914 7.2 3.7 3.5 3.0 2.6
Switzerland 18,469 30,349 20,673 1.4 -12.0 3.1 3.4 1.9
Belgium 12,973 14,006 16,435 3.0 5.5 2.7 1.6 1.8
Portugal 11,069 13,104 14,281 3.2 2.9 3.4 2.8 3.2
Greece 15,814 12,280 14,172 -1.4 4.9 5.2 1.9 2.7
Denmark 11,363 13,542 12,655 1.4 -2.2 3.5 2.3 2.4
New Zealand 3,017 5,605 11,175 17.8 25.9 2.6 2.0 4.2
Sweden 19,756 13,822 9,742 -8.5 -11.0 4.6 1.8 1.2
Israel 8,271 n.a. 9,692 2.0 n.a. 3.8 n.a. 2.5
Austria 10,331 10,293 9,229 -1.4 -3.6 2.3 1.4 1.2
Finland 7,855 5,775 8,344 0.8 13.1 3.2 1.3 1.9
Czech Republic 10,793 6,655 7,839 -3.9 5.6 5.7 1.7 1.6
Hungary 6,594 4,559 6,762 0.3 14.0 5.0 1.7 2.9
Ireland 3,763 6,273 5,868 5.7 -2.2 1.6 1.0 2.4
Slovak Republic 3,536 4,644 4,756 3.8 0.8 4.2 2.5 2.5
Slovenia 2,861 3,789 2,000 -4.4 -19.2 5.4 3.5 2.0
Luxembourg 632 1,175 1,215 8.5 1.1 1.4 1.3 1.3
Estonia 597 976 913 5.5 -2.2 3.4 1.6 2.5
Iceland 471 1,003 431 -1.1 -24.6 2.7 1.9 2.7
Source: WTO Secretariat, based on ITU World Telecommunication/ICT Indicators database.

ANNEX B. TABLES AND FIGURES – 91
AID FOR TRADE AND VALUE CHAINS IN INFORMATION AND COMMUNICATION TECHNOLOGIES © OECD/WTO 2013
Figure B.1 Difficulties suppliers face in entering, establishing, or moving up ICT value chains
(percentage and number of suppliers)
Source: OECD-WTO AFT monitoring survey: private sector questionnaire.
Figure B.2 Difficulties lead firms face in bringing new suppliers from developing countries into their supply
chains
(percentage and number of lead companies)
Source: OECD-WTO AFT monitoring survey: private sector questionnaire.
7
8
9
9
11
11
12
14
15
15
15
18
18
21
27
37
0% 10% 20% 30% 40% 50%
Inadequate transport infrastructure capacity or links
Export or import licensing requirements
Restrictions on professional service providers
Logistics and shipping costs and delays
Other border agency paperwork or delays
Restrictions on foreign direct investment
Requirements for commercial presence/joint ventures
Local content requirements in public procurement
Import duties
Inadequate national telecommunications networks
Supply chain governance issues
Inadequate or unreliable power infrastructure
Unreliable internet access and/or low band width
Customs paperwork or delays
Lack of transparency in regulatory environment
Access to trade finance
4
6
7
7
8
8
9
11
12
15
18
18
21
0% 10% 20% 30% 40% 50%
Inability to meet environment standards
Inability of suppliers to meet volume requirements
Inability to meet labour or other social standards
Visa restrictions on professional service providers
Other border procedures
Inadequate telecommunications networks
Inadequate airport, maritime or transport capacity or links
National restrictions on professional service providers
Irregular supply and/or inconsistent quality
Import duties
Customs procedures
Export or import licensing requirements
Lack of transparency in regulatory environment


ANNEX C. THE PRIVATE SECTOR QUESTIONNAIRE – 93
AID FOR TRADE AND VALUE CHAINS IN INFORMATION AND COMMUNICATION TECHNOLOGIES © OECD/WTO 2013
Annex C
The private sector questionnaire
Description of the sample
The WTO/OECD private sector questionnaire was filled by 80 suppliers and 44 lead
companies (Table C.1). While the majority these 124 respondents were companies (104),
20 associations replied also to the questionnaire.
Table C.1 Supply and lead companies by type of respondent
Suppliers Lead comp.
Respondent Share Number Share Number
Associations 19% 15 11% 5
Companies 81% 65 89% 39
Total respondents 100% 80 100% 44
Source: OECD-WTO AFT monitoring survey: private sector questionnaire.
Suppliers with their head office in America are predominant in the sample
constituting 32 out of 80 respondents, while 18 suppliers have their head office in Asia
and 14 in Africa (Table C.2). The countries which have been mentioned most often are
Bangladesh (9), Uruguay (8), Costa Rica (6), Mexico (5) and India (4). Out of the 44 lead
companies, 19 are headquartered in OECD countries followed by 12 in Africa and 6 in
America. The three countries Japan (7), Barbados (3) and the United States (3) have been
mentioned most often by lead companies as their head office country.
Table C.2 Supply and lead companies by region of head office
Suppliers Lead comp.
Region Share Number Share Number
Africa 18% 14 27% 12
America 40% 32 14% 6
Asia 23% 18 9% 4
Europe 1% 1 2% 1
Oceania 1% 1 2% 1
OECD 15% 12 43% 19
Other 3% 2 2% 1
Total 100% 80 100% 44
Source: OECD-WTO AFT monitoring survey: private sector questionnaire.
Table C.3 shows the distribution of suppliers and lead companies by company size.
Not surprisingly, 39% of suppliers are micro companies with less than 10 employees
while almost half of lead companies are multinationals. On the other hand, the group of
developing country suppliers also covers 10 multinationals, which are predominantly

94 – ANNEX C. THE PRIVATE SECTOR QUESTIONNAIRE
AID FOR TRADE AND VALUE CHAINS IN INFORMATION AND COMMUNICATION TECHNOLOGIES © OECD/WTO 2013
subsidiaries of multinationals headquartered in developed countries but also few
multinationals headquartered in developing countries.
Table C.3 Supply and lead companies by company size
Company size Suppliers Lead comp.
Share Number Share Number
Micro (less than 10 employees) 39% 25 21% 8
Small (10 - 49 employees) 17% 11 13% 5
Medium (50 - 250 employees) 17% 11 11% 4
Large (more than 250 employees) 12% 8 8% 3
Multinational (more than 250 employees and operating in more than one country)
15% 10 47% 18
All companies 100% 65 100% 38
Source: OECD-WTO AFT monitoring survey: private sector questionnaire.
Note: The 20 associations which responded to the questionnaire are not covered by the table.
Trade patterns
Figure C.1 shows the number of ICT suppliers (out of 80) which are engaged imports
or exports of goods and services products. Several issues are worth highlighting.
Figure C.1 Number of ICT suppliers trading goods and services products
Source: OECD-WTO AFT monitoring survey: private sector questionnaire.
First, more ICT suppliers are engaged in the exports of services than of goods. In
particular, the most commonly exported services are computer services, design services,
advertising services and communication services.
0
5
10
15
20
25
30
Goods Services
Import Export

ANNEX C. THE PRIVATE SECTOR QUESTIONNAIRE – 95
AID FOR TRADE AND VALUE CHAINS IN INFORMATION AND COMMUNICATION TECHNOLOGIES © OECD/WTO 2013
Second, imported goods and services are essential for the activities of ICT suppliers.
More suppliers import rather than export intermediate or final ICT goods which indicates
that ICT firms rely on imported intermediate inputs in order to serve the domestic market
with ICT goods. Furthermore, imported ICT goods are needed by ICT services firms for
their business. Likewise, ICT suppliers rely on imports of intra-industry inputs such as
computer and communication services, but also on imports of inter-industry inputs such
as financial services and transport services. The importance of imports can be
summarised by the fact that more than 75% of suppliers regard imports of goods and
services as important for their exports, with almost half of suppliers regarding them as
essential.
Third, firms in developing countries may find it easier to integrate into international
value chains by offering services. For instance, out of 17 LDC suppliers in the sample,
not one exports ICT goods and, i.e. intermediate inputs or final products. On the other
hand, 7 suppliers export computer services and 4 design services among others. This
illustrates well the point that it can be easier for companies in LDCs to join value chains
providing ICT services rather than producing ICT goods as scale economies, transport
infrastructure and access to finance are less are of lesser importance for services than for
goods production.

Front cover photos courtesy of Shutterstock; ©Anton Balazh, ©thanapun, and the World Bank; ©Simone D. McCourtie, ©Eric Miller
The study highlighted that ICT manufacturing is highly fragmented internationally with value chains mainly concentrated in “Factory Asia”. Barriers for developing country firms to enter, establish or move up ICT value chains are access to (trade) finance, the business and regulatory environment and customs procedures and delays. In addition, more ICT-related constraints are the lack of ICT skills in the labor force, telecommunications infrastructure and the regulation of telecommunications market. Given the “digital divide” between developed and developing countries and the importance of ICT for a country’s economic and social development, aid for trade could play a prominent role in facilitating investments in ICT infrastructure, particularly for the “Least Connected Countries” and certain LDCs.
Contents
1. Introduction
2. ICT value chains: Manufacturing and services
3. ICT infrastructure and access
4. ICT as enabler of economic and social development
5. Barriers to overcome
6. Where do resources currently go?
7. Overcoming the barriers
8. Conclusions
Annex A. Country groupings by income and region
Annex B. Tables and figures
Annex C. The private sector questionnaire
AID FOR TRADE AND VALUE CHAINS IN INFORMATION AND COMMUNICATION TECHNOLOGY AID FOR TRADE AND VALUE CHAINS
IN INFORMATION AND COMMUNICATION TECHNOLOGY
Recommended