AHRI Standards 550/590 (I-P)-2015 & 551/591 (SI)-2015
Updates from 2011 Version with Addendum 3
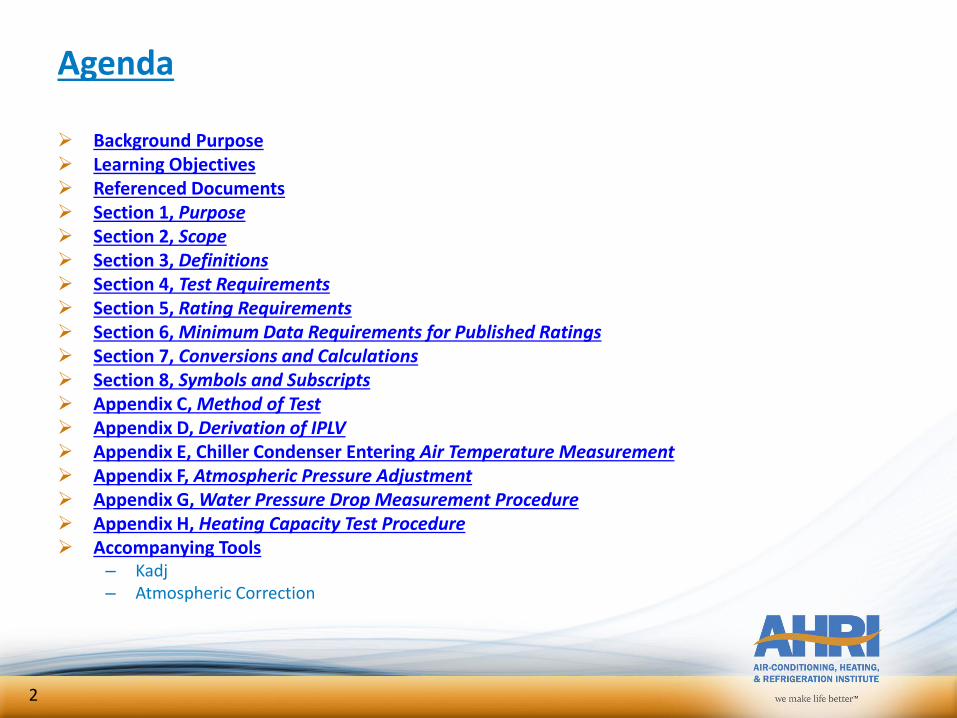
Agenda
Background Purpose Learning Objectives Referenced Documents Section 1, Purpose Section 2, Scope Section 3, Definitions Section 4, Test Requirements Section 5, Rating Requirements Section 6, Minimum Data Requirements for Published Ratings Section 7, Conversions and Calculations Section 8, Symbols and Subscripts Appendix C, Method of Test Appendix D, Derivation of IPLV Appendix E, Chiller Condenser Entering Air Temperature Measurement Appendix F, Atmospheric Pressure Adjustment Appendix G, Water Pressure Drop Measurement Procedure Appendix H, Heating Capacity Test Procedure Accompanying Tools
– Kadj– Atmospheric Correction
2
Background Purpose
Background– In 2015 work was completed on updating the AHRI 550/590 (IP) and
AHRI 551/591 (SI) Standards which have been released as AHRI 550/590 (IP)-2015 and AHRI 551/591 (S)-2015
– All sections except Section 4 are effective April 1, 2016
• Section 4 is effective January 1, 2017
– In addition the Operational Manuals for the ACCL and WCCL certification programs have been updated and released as of 4/1/2016
Purpose– This presentation will focus on the changes to the Standards and a
separate presentation will cover the Operational Manual changes
– Review changes in the 2015 version of both standards that differ from the 2011 version
3

Learning Objectives
4
Learning Objectives
Learning Objective Goals
– To provide and overview of the changes to the AHRI 550/590 (IP) and AHRI 551/591 (SI) standards relative to the 2011 version with addendum 3
– The intent is to provide a uniform training document that can be used by users of the standard and laboratories around the world
– As there have been significant changes to testing requirements and procedures the presentation will also provide further insight into the reasons for the changes and how they are applied
– The intent of this presentation is to supplement the Standards but is not intended to replace the standard and all requirements interpretations will be based on the standard documents
5
Reference Documents
Document Location– The following documents are available free of charge at the AHRI websitehttp://www.ahrinet.org/site/686/Standards/HVACR-Industry-Standards/Search-Standards
Reference Documents– AHRI Standard 550/590 (I-P)–2015 with Errata, Performance Rating of
Water-chilling and Heat Pump Water-heating Packages Using the Vapor Compression Cycle
– ANSI/AHRI Standard 550/590 (I-P)-2011 with Addendum 3– AHRI Standard 551/591 (SI)-2015 with Errata, Performance Rating of
Water-chilling and Heat Pump Water-heating Packages Using the Vapor Compression Cycle
– ANSI/AHRI Standard 551/591 (SI)-2011 with Addendum 3– Appendix G Pressure Drop Adjustments – Calibration Worksheet
Other References– Kadj Calculation Spreadsheet Tool– ASHRAE 90.1
6

Section 1, Purpose
7
Section 1, Purpose
The purpose of this standard is to establish for Water-chilling and Heat Pump Water-heating Packages using the vapor compression cycle with the following areas of focus: – Definitions – Test requirements – Rating requirements – Minimum data requirements for Published Ratings – Marking and nameplate data – Conversions and calculations – Nomenclature – Conformance conditions
The standard is intended for guidance of the industry, including manufacturers, engineers, installers, efficiency regulators, contractors and users.
This standard is subject to review and amendment as technology advances. It is typically updated every 5 years but there may also be addendums
8
Section 2, Scope
9
Section 2, Scope
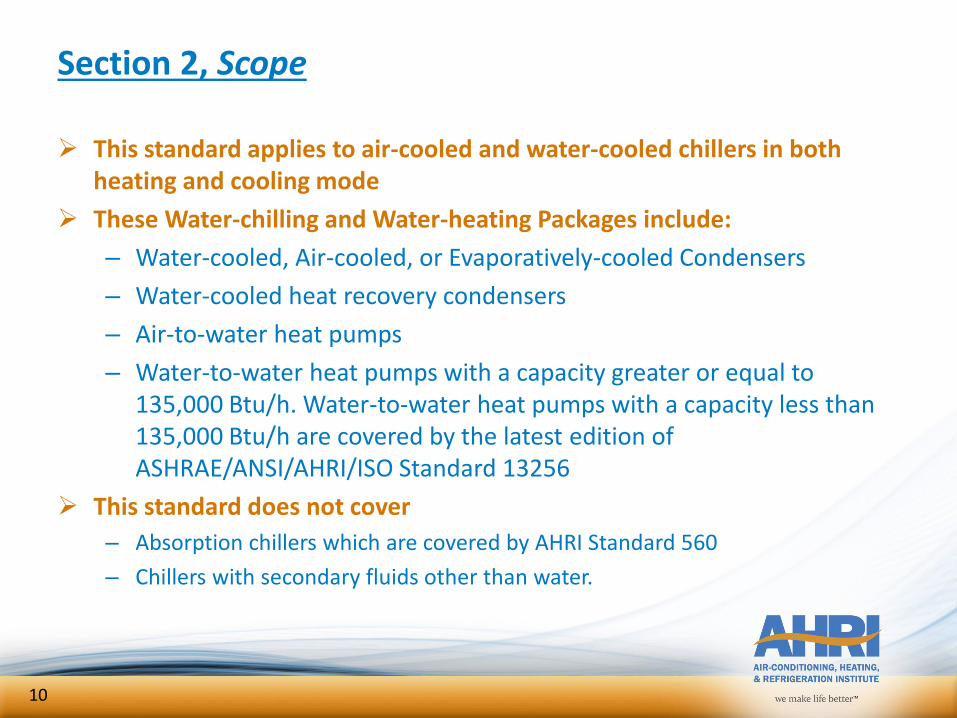
This standard applies to air-cooled and water-cooled chillers in both heating and cooling mode
These Water-chilling and Water-heating Packages include:
– Water-cooled, Air-cooled, or Evaporatively-cooled Condensers
– Water-cooled heat recovery condensers
– Air-to-water heat pumps
– Water-to-water heat pumps with a capacity greater or equal to 135,000 Btu/h. Water-to-water heat pumps with a capacity less than 135,000 Btu/h are covered by the latest edition of ASHRAE/ANSI/AHRI/ISO Standard 13256
This standard does not cover
– Absorption chillers which are covered by AHRI Standard 560
– Chillers with secondary fluids other than water.
10
Section 2, Scope
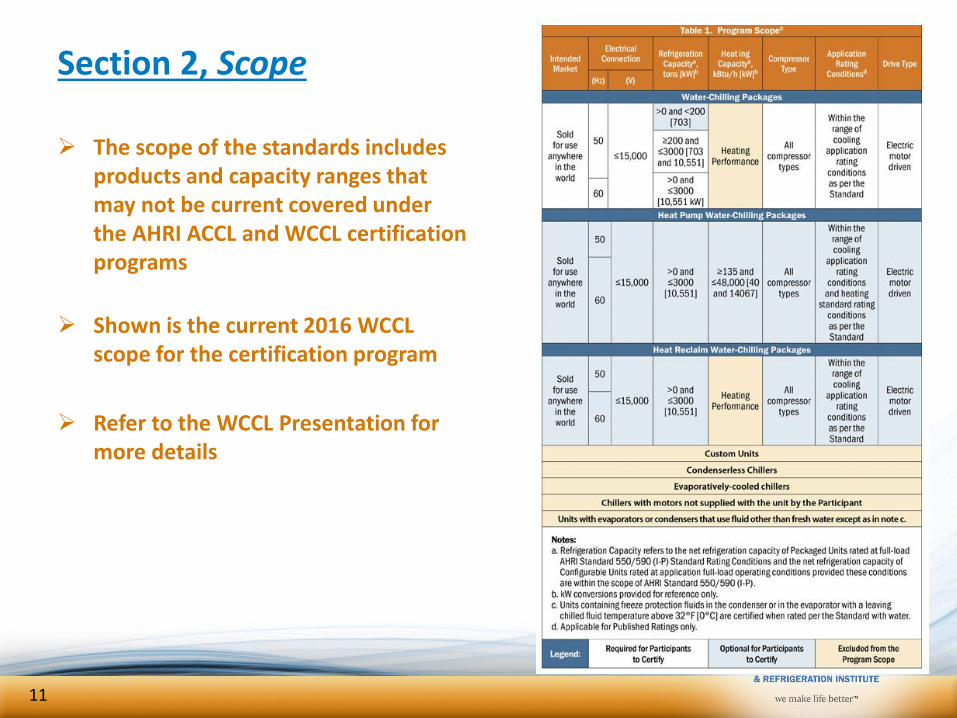
The scope of the standards includes products and capacity ranges that may not be current covered under the AHRI ACCL and WCCL certification programs
Shown is the current 2016 WCCL scope for the certification program
Refer to the WCCL Presentation for more details
11
Section 2, Scope
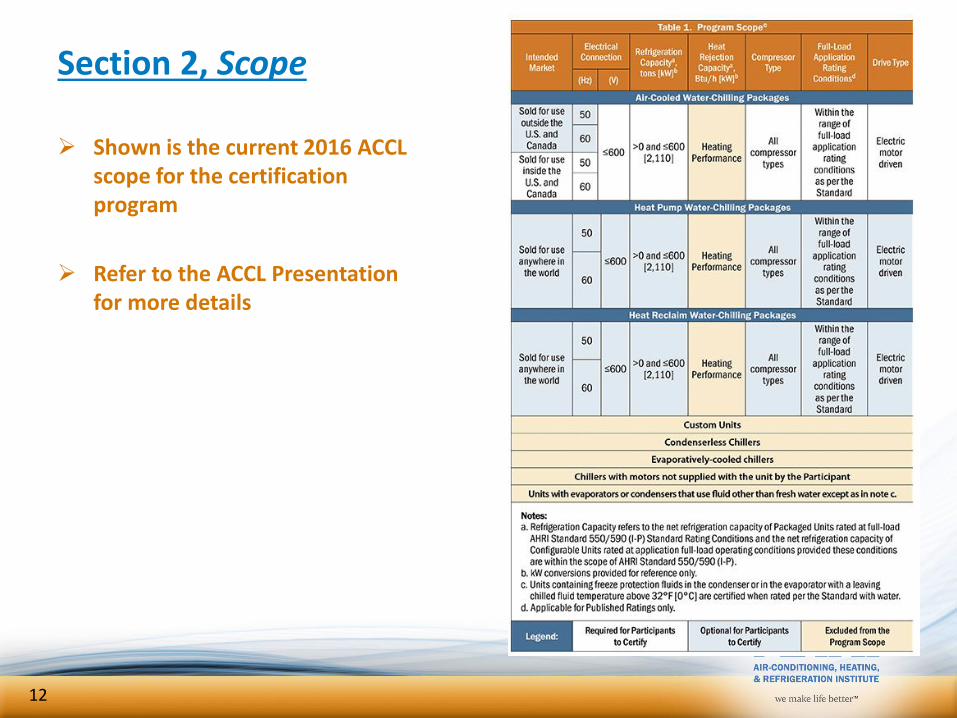
Shown is the current 2016 ACCL scope for the certification program
Refer to the ACCL Presentation for more details
12
Section 3, Definitions
13
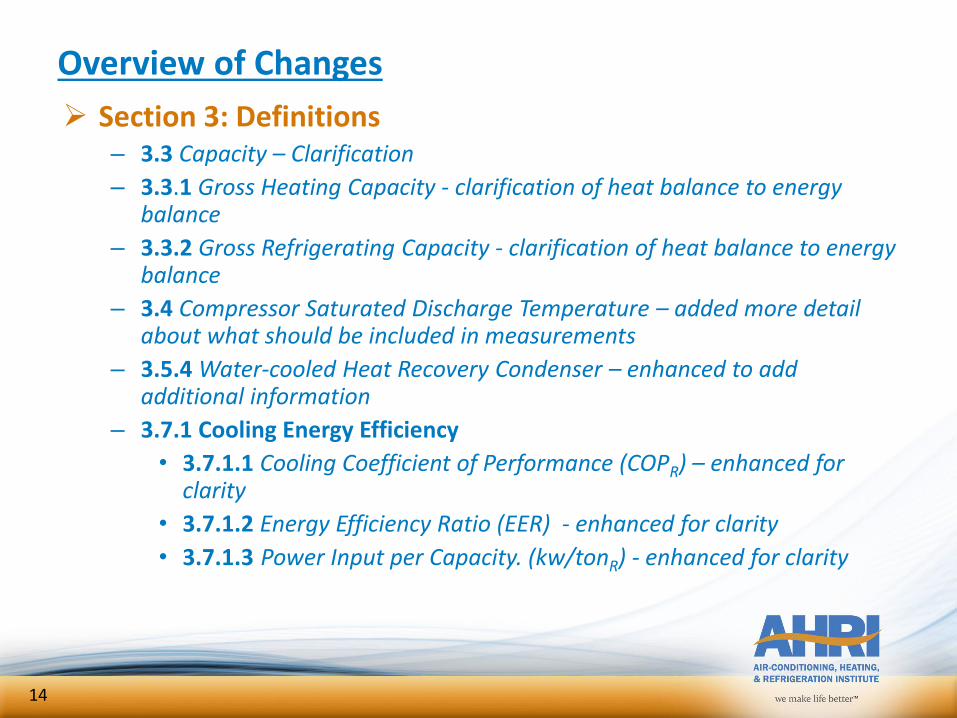
Overview of Changes
Section 3: Definitions– 3.3 Capacity – Clarification
– 3.3.1 Gross Heating Capacity - clarification of heat balance to energy balance
– 3.3.2 Gross Refrigerating Capacity - clarification of heat balance to energy balance
– 3.4 Compressor Saturated Discharge Temperature – added more detail about what should be included in measurements
– 3.5.4 Water-cooled Heat Recovery Condenser – enhanced to add additional information
– 3.7.1 Cooling Energy Efficiency
• 3.7.1.1 Cooling Coefficient of Performance (COPR) – enhanced for clarity
• 3.7.1.2 Energy Efficiency Ratio (EER) - enhanced for clarity
• 3.7.1.3 Power Input per Capacity. (kw/tonR) - enhanced for clarity
14
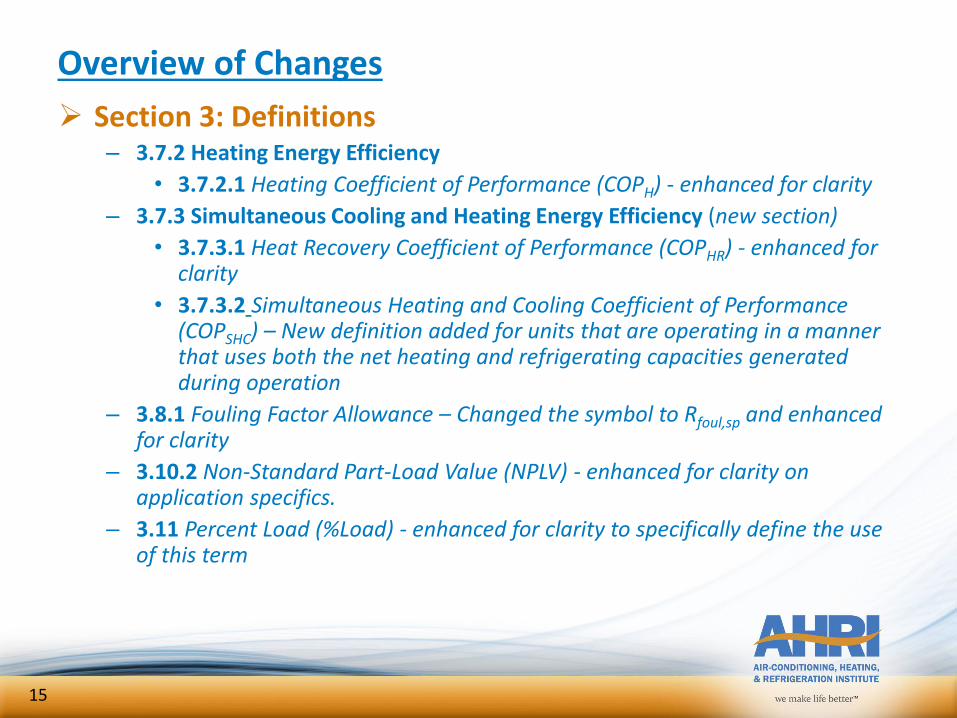
Overview of Changes
Section 3: Definitions– 3.7.2 Heating Energy Efficiency
• 3.7.2.1 Heating Coefficient of Performance (COPH) - enhanced for clarity
– 3.7.3 Simultaneous Cooling and Heating Energy Efficiency (new section)
• 3.7.3.1 Heat Recovery Coefficient of Performance (COPHR) - enhanced for clarity
• 3.7.3.2 Simultaneous Heating and Cooling Coefficient of Performance (COPSHC) – New definition added for units that are operating in a manner that uses both the net heating and refrigerating capacities generated during operation
– 3.8.1 Fouling Factor Allowance – Changed the symbol to Rfoul,sp and enhanced for clarity
– 3.10.2 Non-Standard Part-Load Value (NPLV) - enhanced for clarity on application specifics.
– 3.11 Percent Load (%Load) - enhanced for clarity to specifically define the use of this term
15
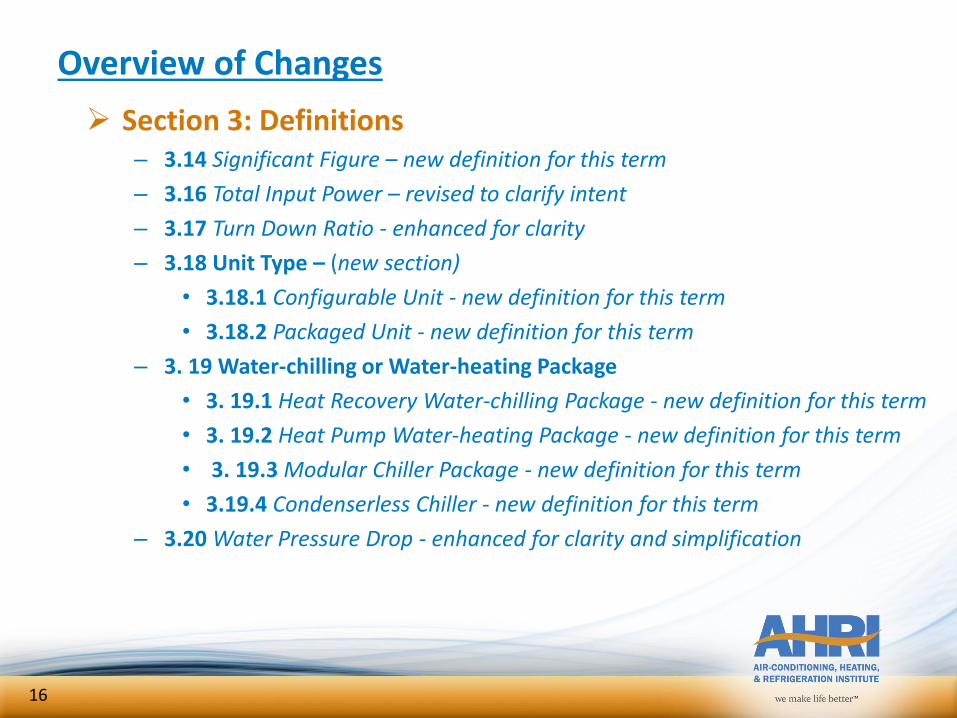
Overview of Changes
Section 3: Definitions– 3.14 Significant Figure – new definition for this term
– 3.16 Total Input Power – revised to clarify intent
– 3.17 Turn Down Ratio - enhanced for clarity
– 3.18 Unit Type – (new section)
• 3.18.1 Configurable Unit - new definition for this term
• 3.18.2 Packaged Unit - new definition for this term
– 3. 19 Water-chilling or Water-heating Package
• 3. 19.1 Heat Recovery Water-chilling Package - new definition for this term
• 3. 19.2 Heat Pump Water-heating Package - new definition for this term
• 3. 19.3 Modular Chiller Package - new definition for this term
• 3.19.4 Condenserless Chiller - new definition for this term
– 3.20 Water Pressure Drop - enhanced for clarity and simplification
16
Section 4, Test Requirements
17
Impact of Significant Figures & Rounding on Pass-Fail Acceptance
18
Significant Figures & Rounding Digits
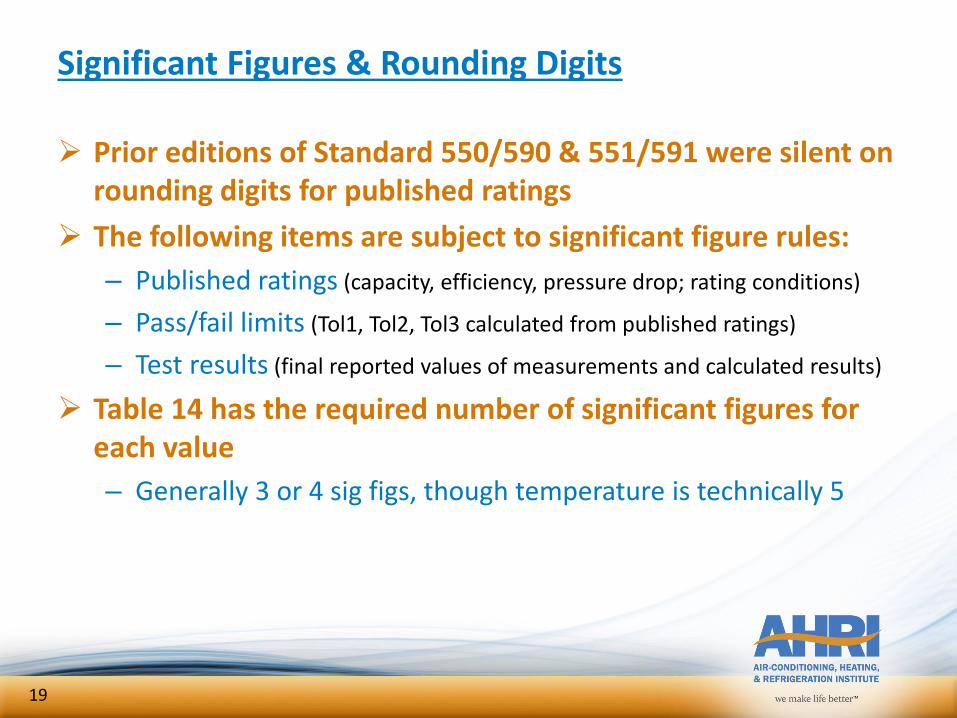
Prior editions of Standard 550/590 & 551/591 were silent on rounding digits for published ratings
The following items are subject to significant figure rules:
– Published ratings (capacity, efficiency, pressure drop; rating conditions)
– Pass/fail limits (Tol1, Tol2, Tol3 calculated from published ratings)
– Test results (final reported values of measurements and calculated results)
Table 14 has the required number of significant figures for each value
– Generally 3 or 4 sig figs, though temperature is technically 5
19
Significant Figures & Rounding Digits
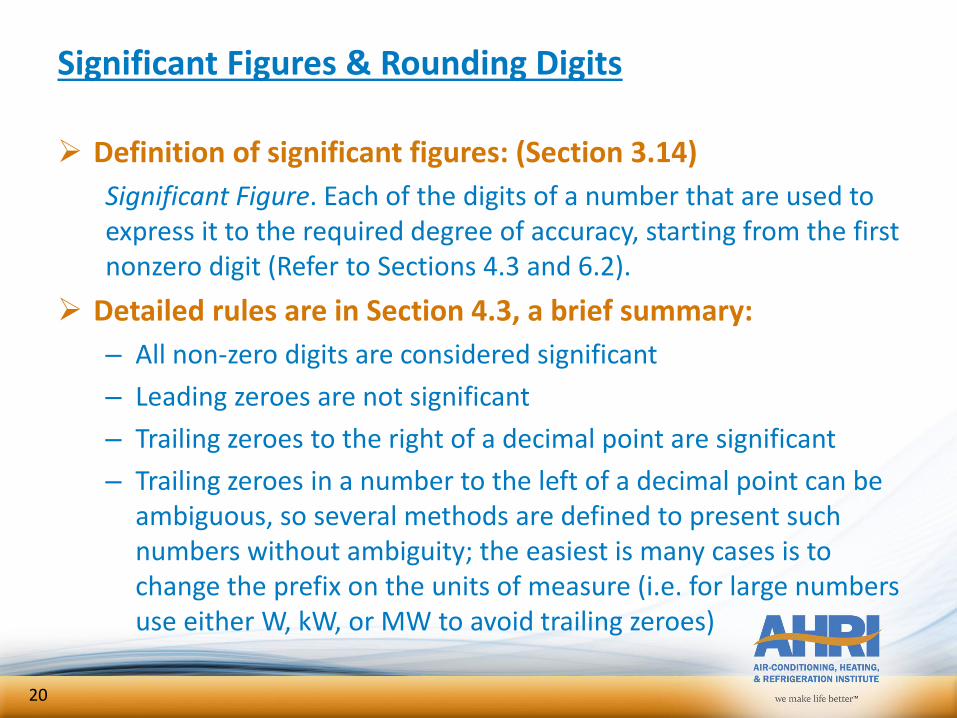
Definition of significant figures: (Section 3.14)
Significant Figure. Each of the digits of a number that are used to express it to the required degree of accuracy, starting from the first nonzero digit (Refer to Sections 4.3 and 6.2).
Detailed rules are in Section 4.3, a brief summary:
– All non-zero digits are considered significant
– Leading zeroes are not significant
– Trailing zeroes to the right of a decimal point are significant
– Trailing zeroes in a number to the left of a decimal point can be ambiguous, so several methods are defined to present such numbers without ambiguity; the easiest is many cases is to change the prefix on the units of measure (i.e. for large numbers use either W, kW, or MW to avoid trailing zeroes)
20
Significant Figures
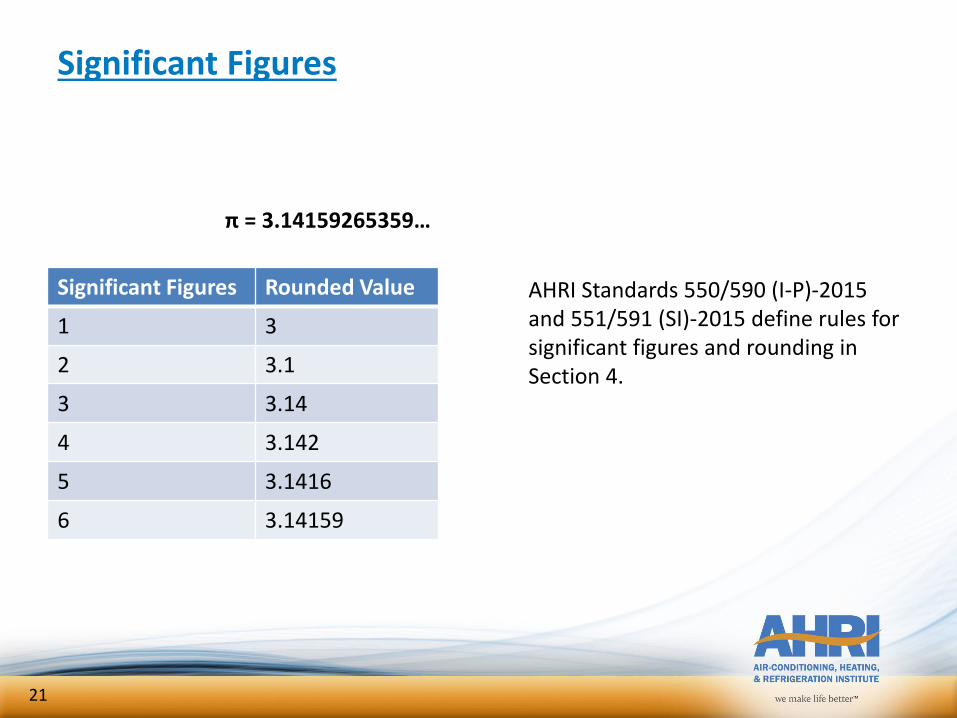
Significant Figures Rounded Value
1 3
2 3.1
3 3.14
4 3.142
5 3.1416
6 3.14159
π = 3.14159265359…
AHRI Standards 550/590 (I-P)-2015 and 551/591 (SI)-2015 define rules for significant figures and rounding in Section 4.
21
Rounding Error
Rounding error can be up to ±½ digit beyond the least significant digit (last digit moving to the right)
Example:
– Take the number 2.5 with two significant digits
– The least significant digit is “5”
– ±½ of the next digit is ±0.05
– Result “2.5” may have come from a value ranging from 2.4500000… to 2.5499999…
– The rounding error could be up to ±0.05, or (±0.05)/2.5 = ±2.0%
22
Rounding Error 2 Significant Figures
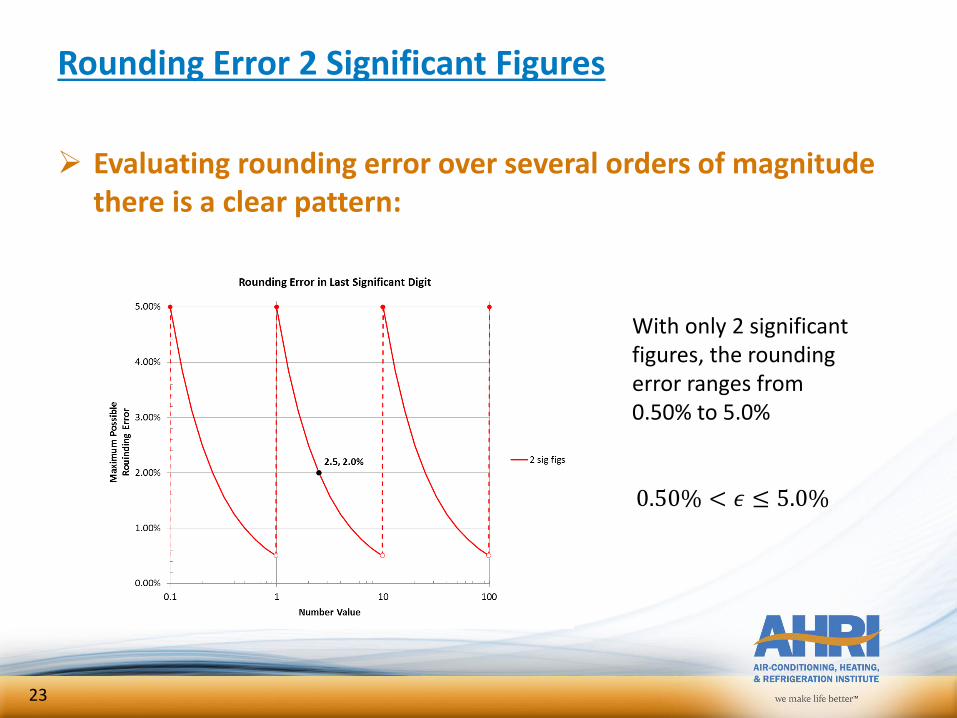
Evaluating rounding error over several orders of magnitude there is a clear pattern:
With only 2 significant figures, the rounding error ranges from 0.50% to 5.0%
0.50% < 𝜖 ≤ 5.0%
23
Rounding Error 3 Significant Figures
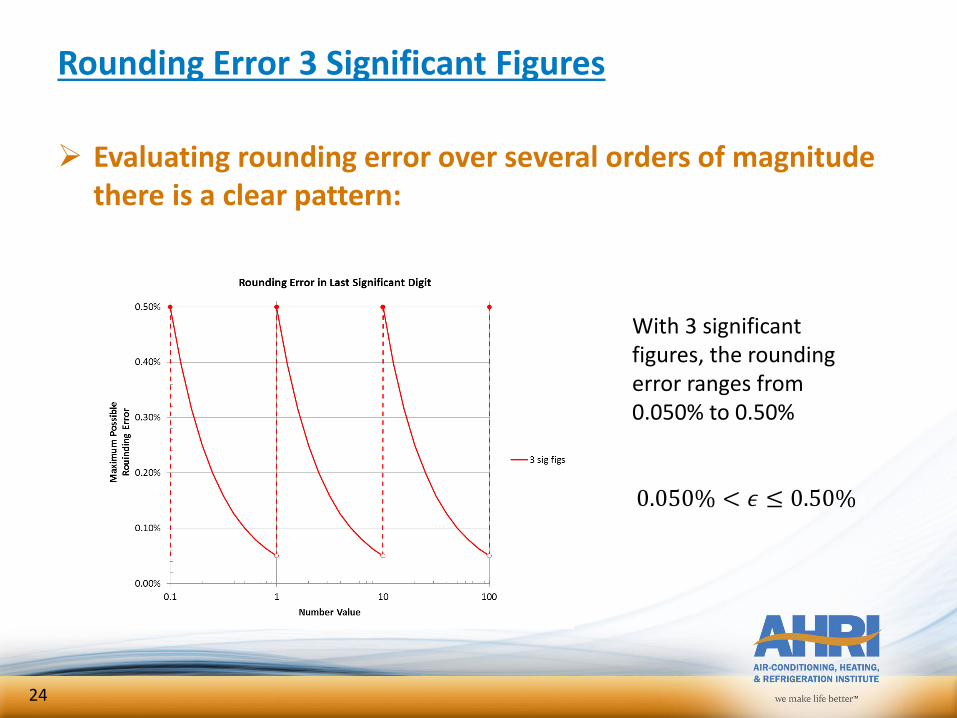
Evaluating rounding error over several orders of magnitude there is a clear pattern:
With 3 significant figures, the rounding error ranges from 0.050% to 0.50%
0.050% < 𝜖 ≤ 0.50%
24
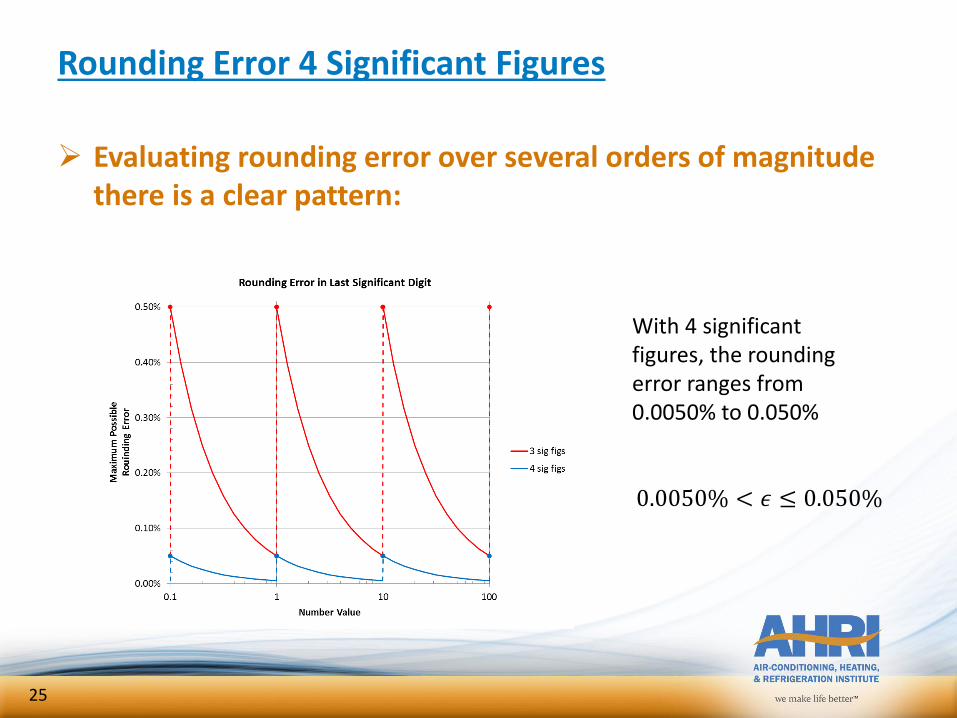
Rounding Error 4 Significant Figures
Evaluating rounding error over several orders of magnitude there is a clear pattern:
With 4 significant figures, the rounding error ranges from 0.0050% to 0.050%
0.0050% < 𝜖 ≤ 0.050%
25
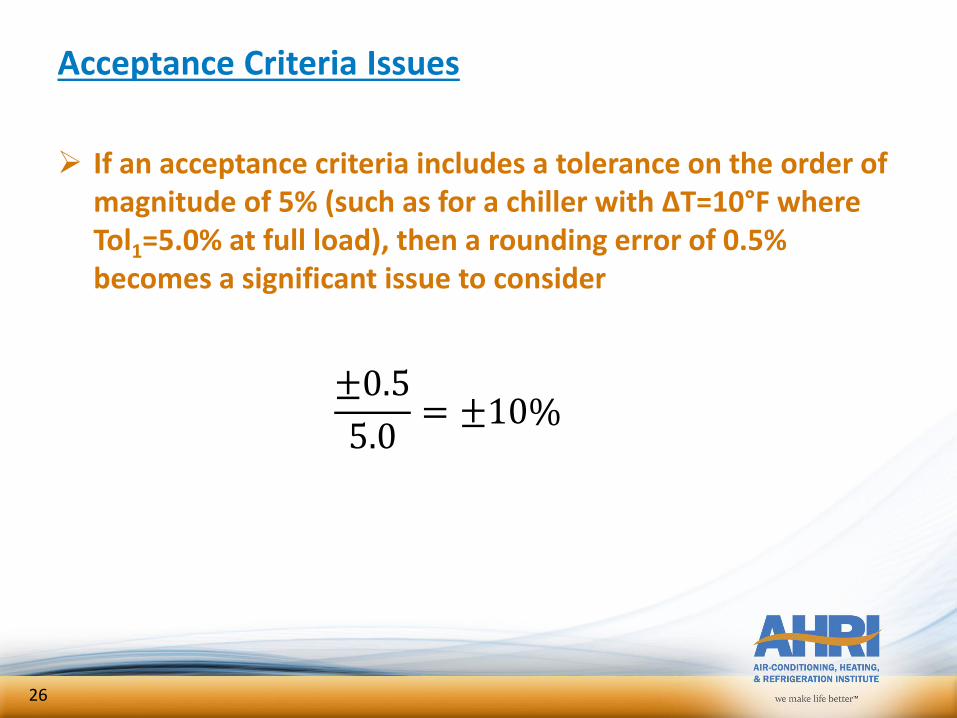
Acceptance Criteria Issues
If an acceptance criteria includes a tolerance on the order of magnitude of 5% (such as for a chiller with ΔT=10°F where Tol1=5.0% at full load), then a rounding error of 0.5% becomes a significant issue to consider
±0.5
5.0= ±10%
26
Examples
The next few slides walk through some examples that demonstrate the impact of rounding issues– First showing how a rating software program might calculate an
efficiency value, which is then rounded to the published rating value
– Next showing how the tolerance limit is calculated from the published rating, and then rounded to established the pass/fail criterion for a test
– Next showing how a test result calculated from test measurements is rounded and used to determine pass/fail
The example starts from very coarse resolution, then moving towards finer resolution that demonstrates why AHRI Standards 550/590 and 551/591 selected the required significant figures shown in Table 14
27
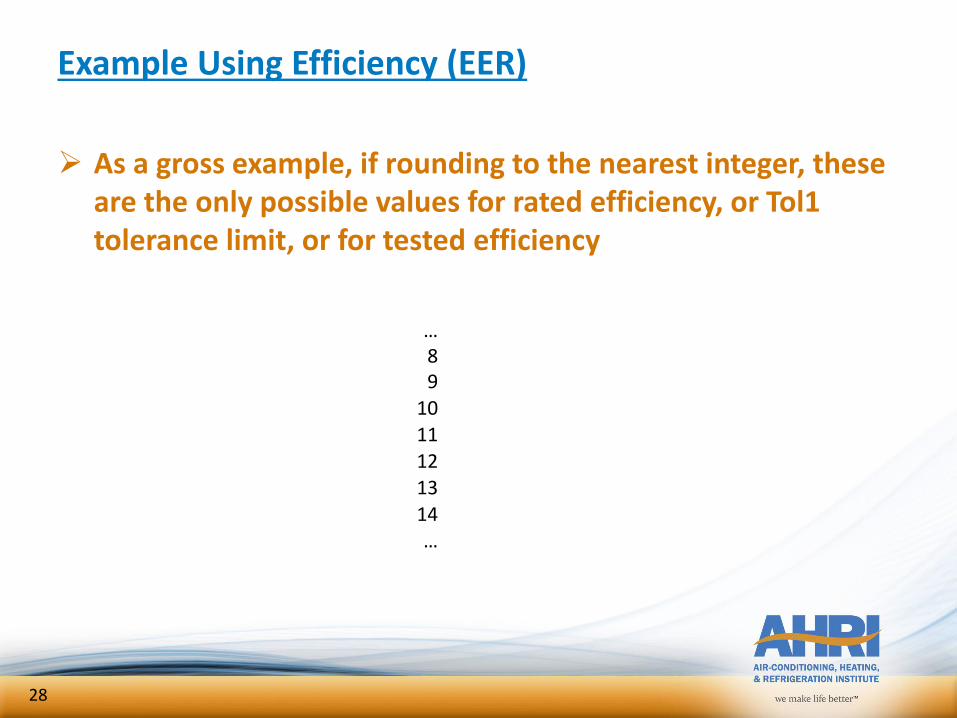
Example Using Efficiency (EER)
As a gross example, if rounding to the nearest integer, these are the only possible values for rated efficiency, or Tol1 tolerance limit, or for tested efficiency
…89
1011
12
13
14…
28
9.0
9.5
10
11
12
RATED VALUE
MIN ALLOWED
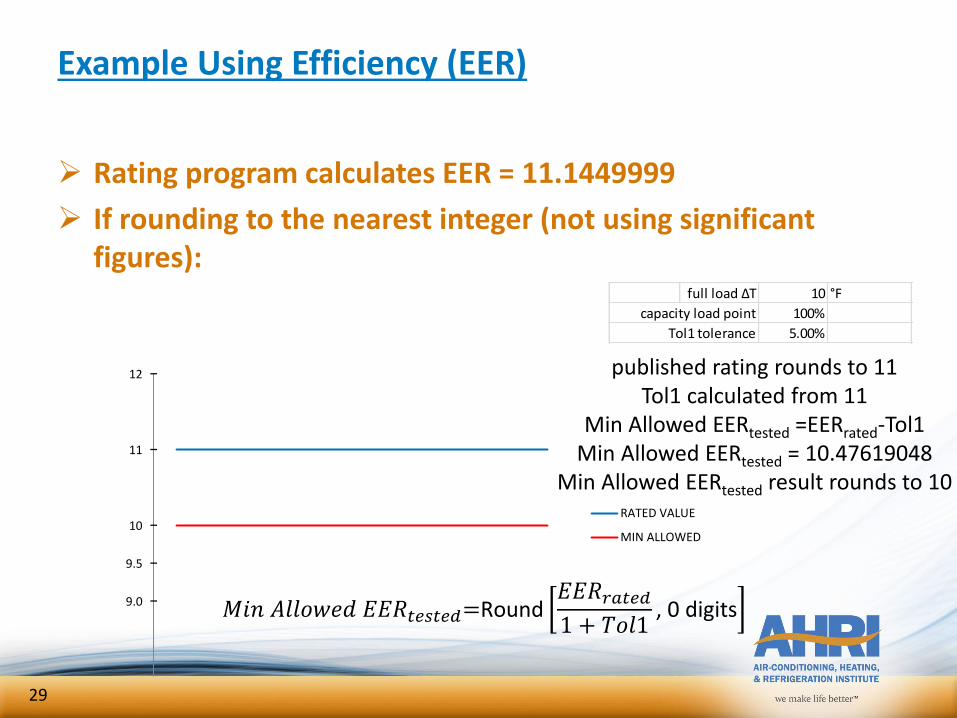
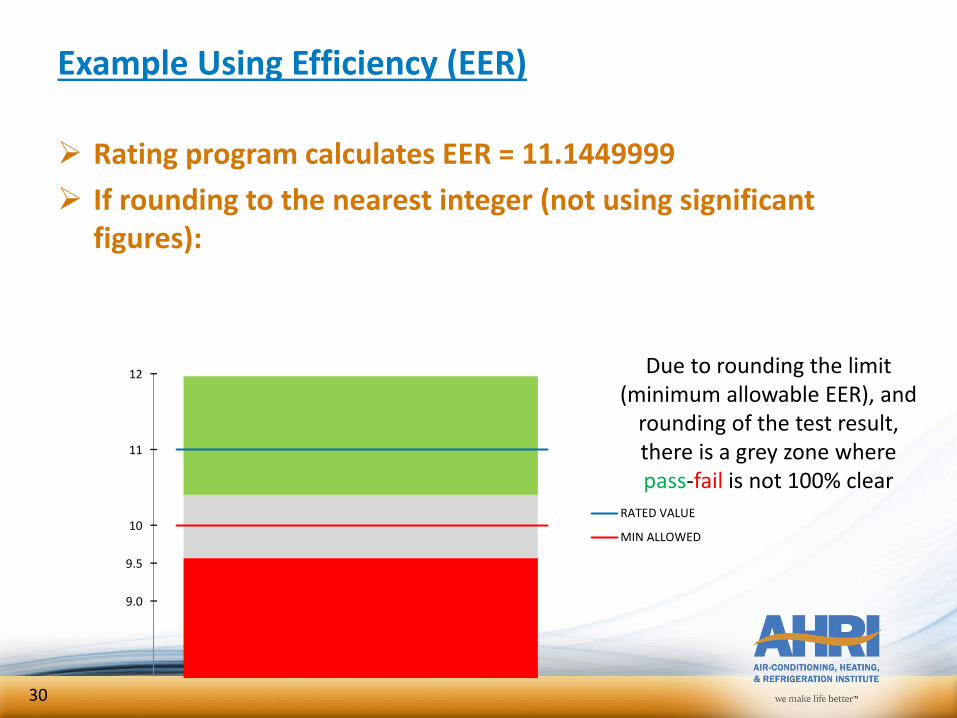
Example Using Efficiency (EER)
Rating program calculates EER = 11.1449999
If rounding to the nearest integer (not using significant figures):
full load ΔT 10 °F
capacity load point 100%
Tol1 tolerance 5.00%
published rating rounds to 11Tol1 calculated from 11
Min Allowed EERtested =EERrated-Tol1Min Allowed EERtested = 10.47619048
Min Allowed EERtested result rounds to 10
𝑀𝑖𝑛 𝐴𝑙𝑙𝑜𝑤𝑒𝑑 𝐸𝐸𝑅𝑡𝑒𝑠𝑡𝑒𝑑=Round𝐸𝐸𝑅𝑟𝑎𝑡𝑒𝑑1 + 𝑇𝑜𝑙1
, 0 digits
29
Example Using Efficiency (EER)
Rating program calculates EER = 11.1449999
If rounding to the nearest integer (not using significant figures):
Due to rounding the limit (minimum allowable EER), and
rounding of the test result, there is a grey zone where pass-fail is not 100% clear
9.0
9.5
10
11
12
RATED VALUE
MIN ALLOWED
30
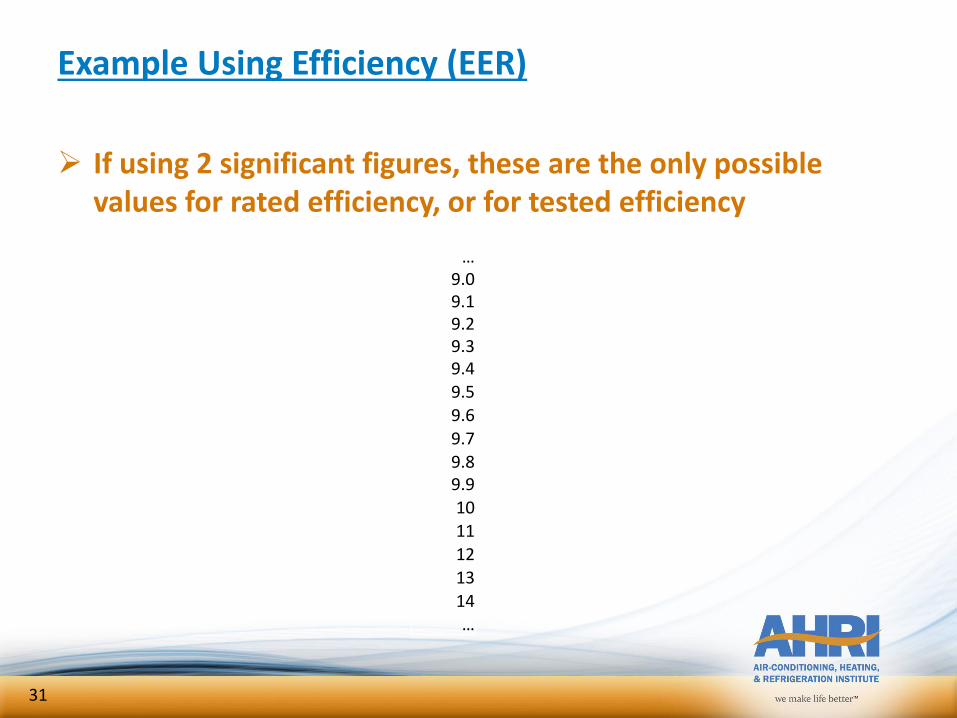
Example Using Efficiency (EER)
If using 2 significant figures, these are the only possible values for rated efficiency, or for tested efficiency
…9.09.19.29.39.49.5
9.69.79.89.910111213
14…
31
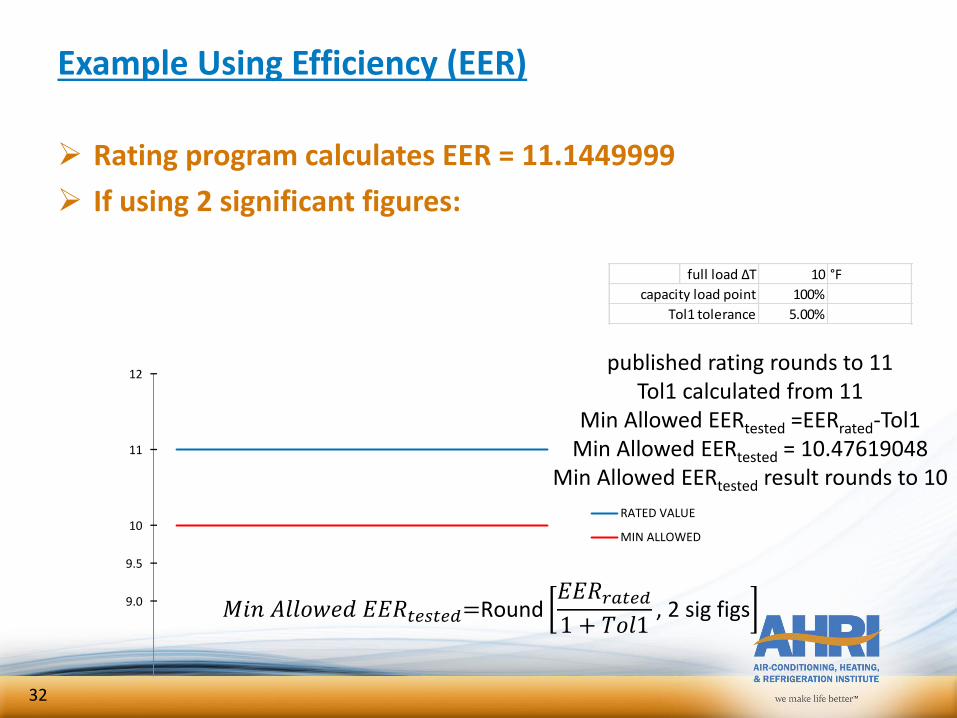
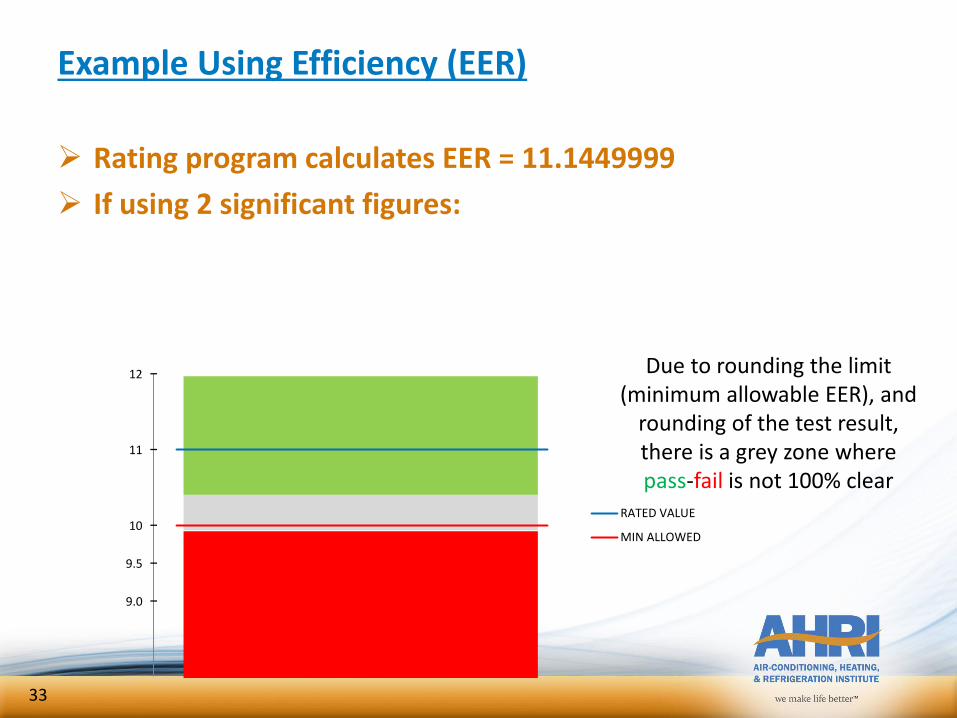
Example Using Efficiency (EER)
Rating program calculates EER = 11.1449999
If using 2 significant figures:
full load ΔT 10 °F
capacity load point 100%
Tol1 tolerance 5.00%
9.0
9.5
10
11
12
RATED VALUE
MIN ALLOWED
𝑀𝑖𝑛 𝐴𝑙𝑙𝑜𝑤𝑒𝑑 𝐸𝐸𝑅𝑡𝑒𝑠𝑡𝑒𝑑=Round𝐸𝐸𝑅𝑟𝑎𝑡𝑒𝑑1 + 𝑇𝑜𝑙1
, 2 sig figs
32
published rating rounds to 11Tol1 calculated from 11
Min Allowed EERtested =EERrated-Tol1Min Allowed EERtested = 10.47619048
Min Allowed EERtested result rounds to 10
Example Using Efficiency (EER)
Rating program calculates EER = 11.1449999
If using 2 significant figures:
Due to rounding the limit (minimum allowable EER), and
rounding of the test result, there is a grey zone where pass-fail is not 100% clear
9.0
9.5
10
11
12
RATED VALUE
MIN ALLOWED
33
9.0
9.5
10
11
12
RATED VALUE
MIN ALLOWED
POSSIBLE TEST POINTS
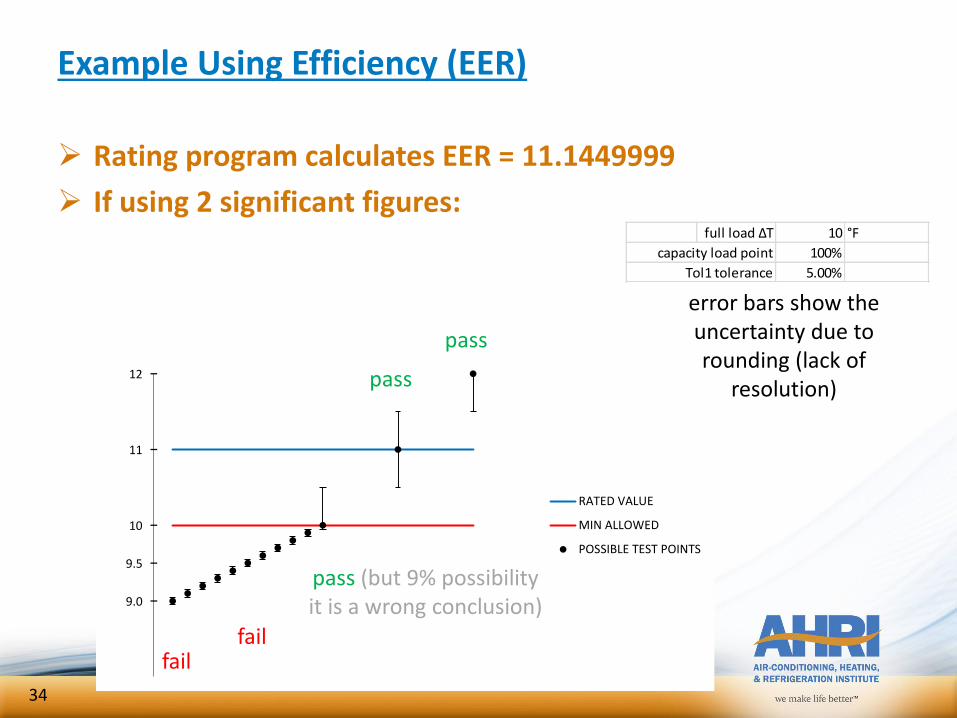
Example Using Efficiency (EER)
Rating program calculates EER = 11.1449999
If using 2 significant figures:full load ΔT 10 °F
capacity load point 100%
Tol1 tolerance 5.00%
pass (but 9% possibilityit is a wrong conclusion)
failfail
pass
pass
error bars show the uncertainty due to rounding (lack of
resolution)
34
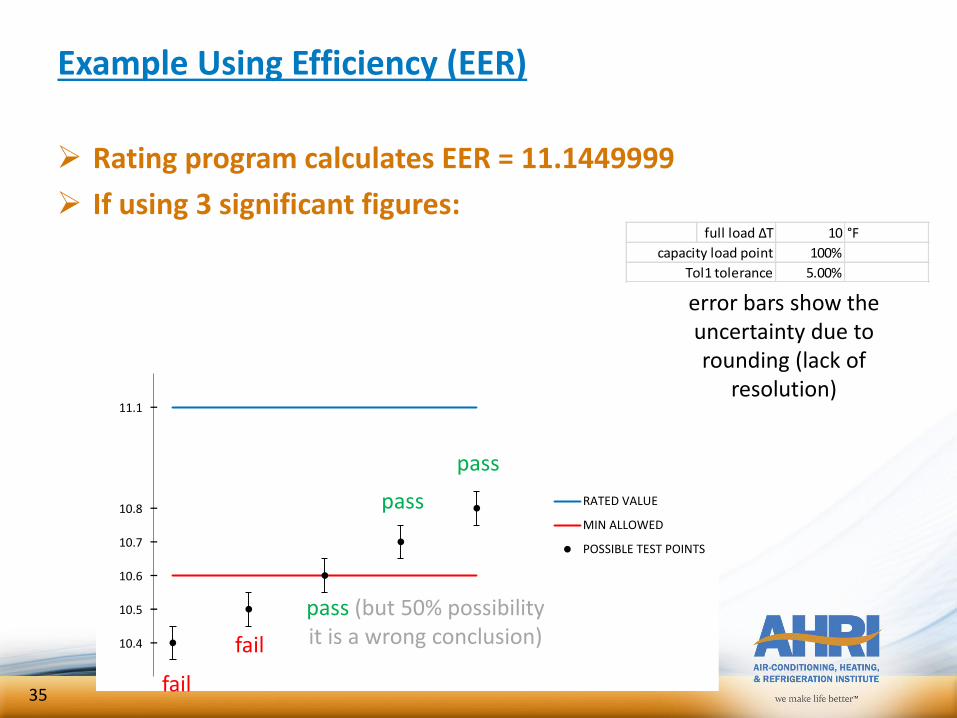
Example Using Efficiency (EER)
Rating program calculates EER = 11.1449999
If using 3 significant figures:
10.4
10.5
10.6
10.7
10.8
11.1
RATED VALUE
MIN ALLOWED
POSSIBLE TEST POINTS
fail
fail
pass (but 50% possibilityit is a wrong conclusion)
pass
pass
full load ΔT 10 °F
capacity load point 100%
Tol1 tolerance 5.00%
error bars show the uncertainty due to rounding (lack of
resolution)
35
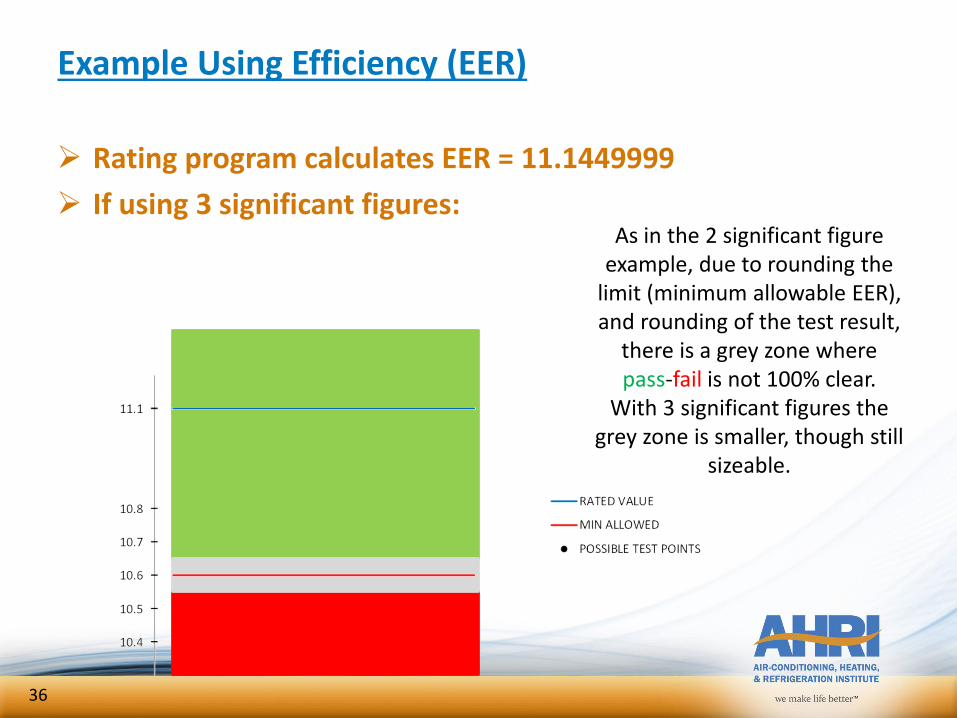
Example Using Efficiency (EER)
Rating program calculates EER = 11.1449999
If using 3 significant figures:
fail
As in the 2 significant figure example, due to rounding the
limit (minimum allowable EER), and rounding of the test result,
there is a grey zone where pass-fail is not 100% clear.
With 3 significant figures the grey zone is smaller, though still
sizeable.
36
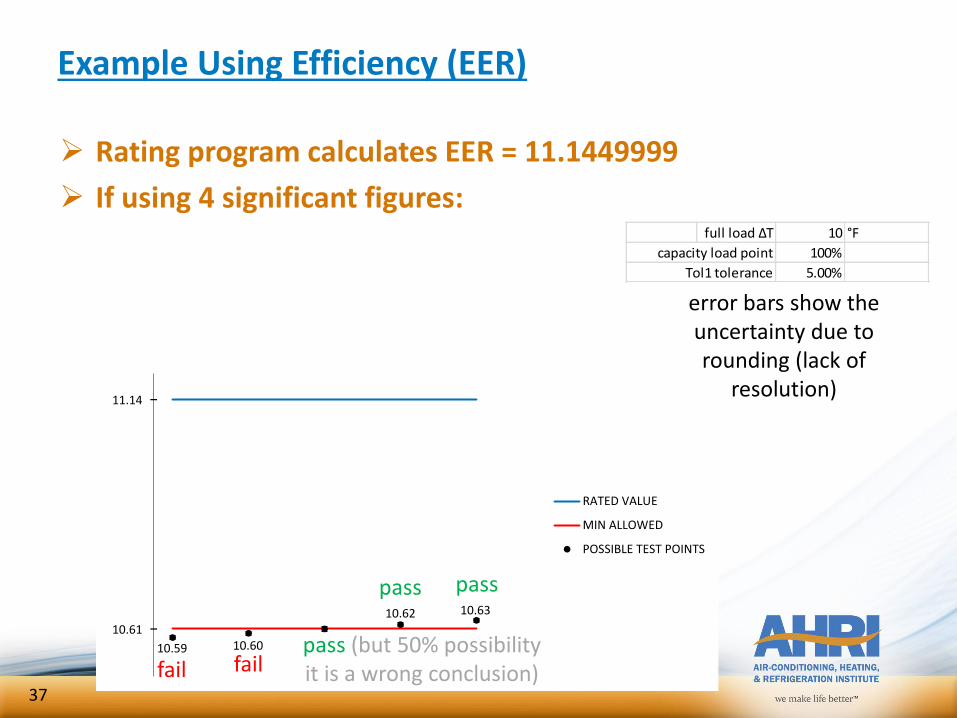
Example Using Efficiency (EER)
Rating program calculates EER = 11.1449999
If using 4 significant figures:
10.61
11.14
RATED VALUE
MIN ALLOWED
POSSIBLE TEST POINTS
fail failpass (but 50% possibilityit is a wrong conclusion)
pass pass10.62 10.63
10.6010.59
error bars show the uncertainty due to rounding (lack of
resolution)
full load ΔT 10 °F
capacity load point 100%
Tol1 tolerance 5.00%
37
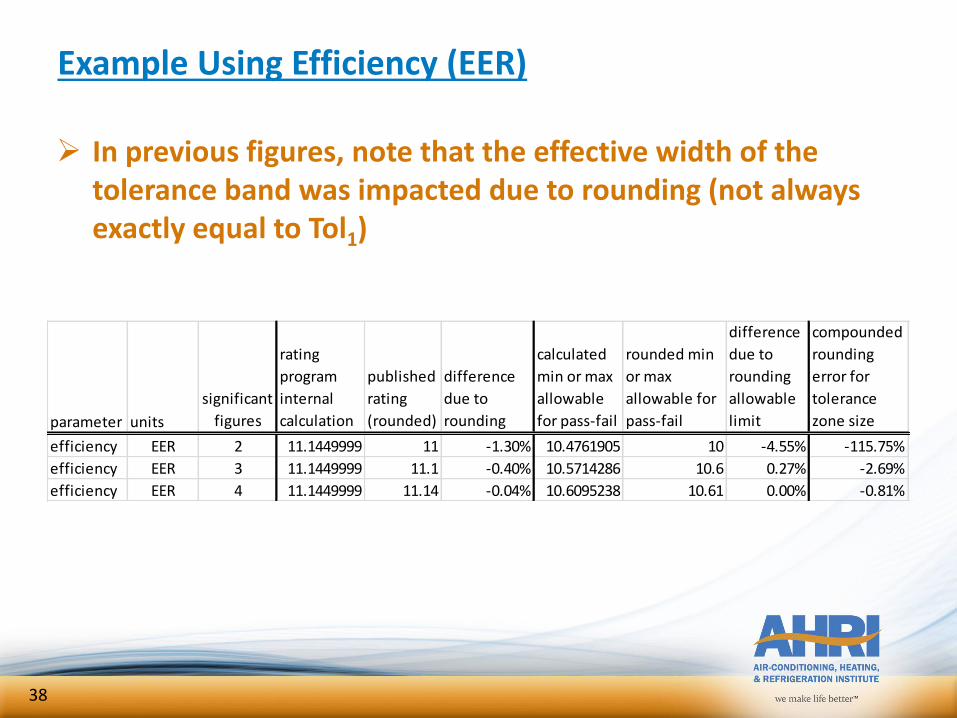
Example Using Efficiency (EER)
In previous figures, note that the effective width of the tolerance band was impacted due to rounding (not always exactly equal to Tol1)
parameter units
significant
figures
rating
program
internal
calculation
published
rating
(rounded)
difference
due to
rounding
calculated
min or max
allowable
for pass-fail
rounded min
or max
allowable for
pass-fail
difference
due to
rounding
allowable
limit
compounded
rounding
error for
tolerance
zone size
efficiency EER 2 11.1449999 11 -1.30% 10.4761905 10 -4.55% -115.75%
efficiency EER 3 11.1449999 11.1 -0.40% 10.5714286 10.6 0.27% -2.69%
efficiency EER 4 11.1449999 11.14 -0.04% 10.6095238 10.61 0.00% -0.81%
38
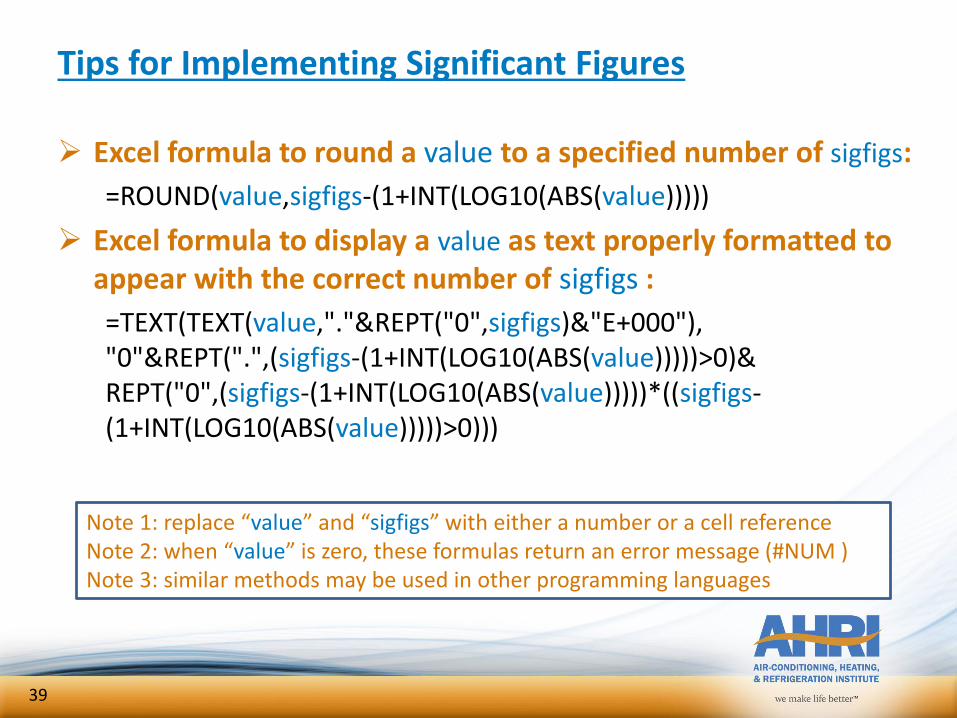
Tips for Implementing Significant Figures
Excel formula to round a value to a specified number of sigfigs:
=ROUND(value,sigfigs-(1+INT(LOG10(ABS(value)))))
Excel formula to display a value as text properly formatted to appear with the correct number of sigfigs :
=TEXT(TEXT(value,"."&REPT("0",sigfigs)&"E+000"), "0"&REPT(".",(sigfigs-(1+INT(LOG10(ABS(value)))))>0)& REPT("0",(sigfigs-(1+INT(LOG10(ABS(value)))))*((sigfigs-(1+INT(LOG10(ABS(value)))))>0)))
Note 1: replace “value” and “sigfigs” with either a number or a cell referenceNote 2: when “value” is zero, these formulas return an error message (#NUM )Note 3: similar methods may be used in other programming languages
39

Section 5, Rating Requirements
40
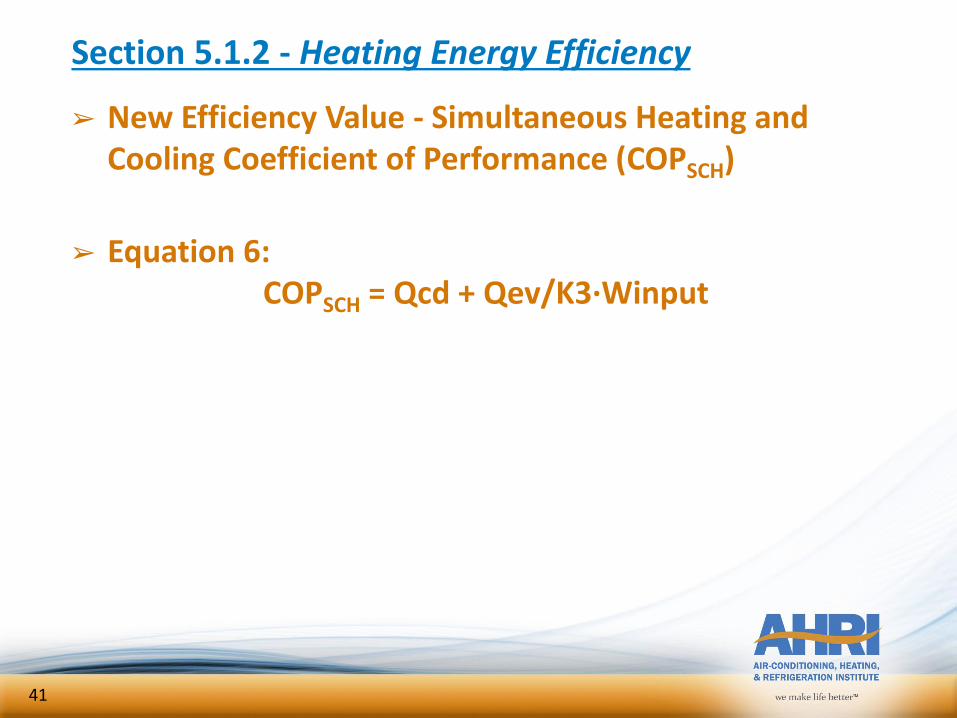
Section 5.1.2 - Heating Energy Efficiency
➢ New Efficiency Value - Simultaneous Heating and Cooling Coefficient of Performance (COPSCH)
➢ Equation 6:COPSCH = Qcd + Qev/K3∙Winput
41
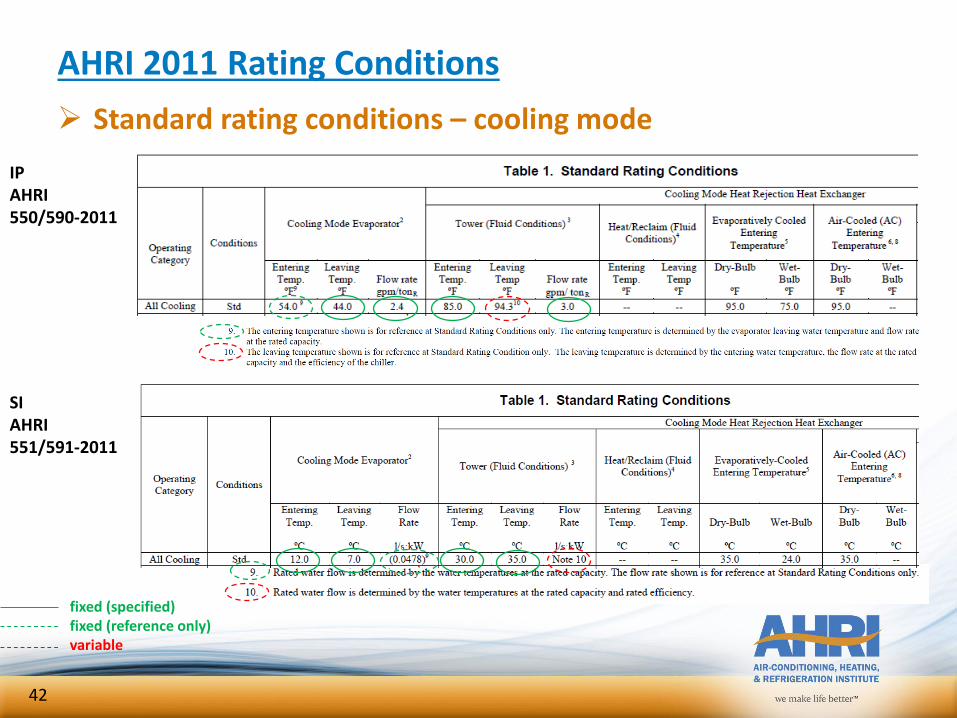
AHRI 2011 Rating Conditions
Standard rating conditions – cooling mode
IPAHRI550/590-2011
SIAHRI551/591-2011
fixed (specified)fixed (reference only)variable
42
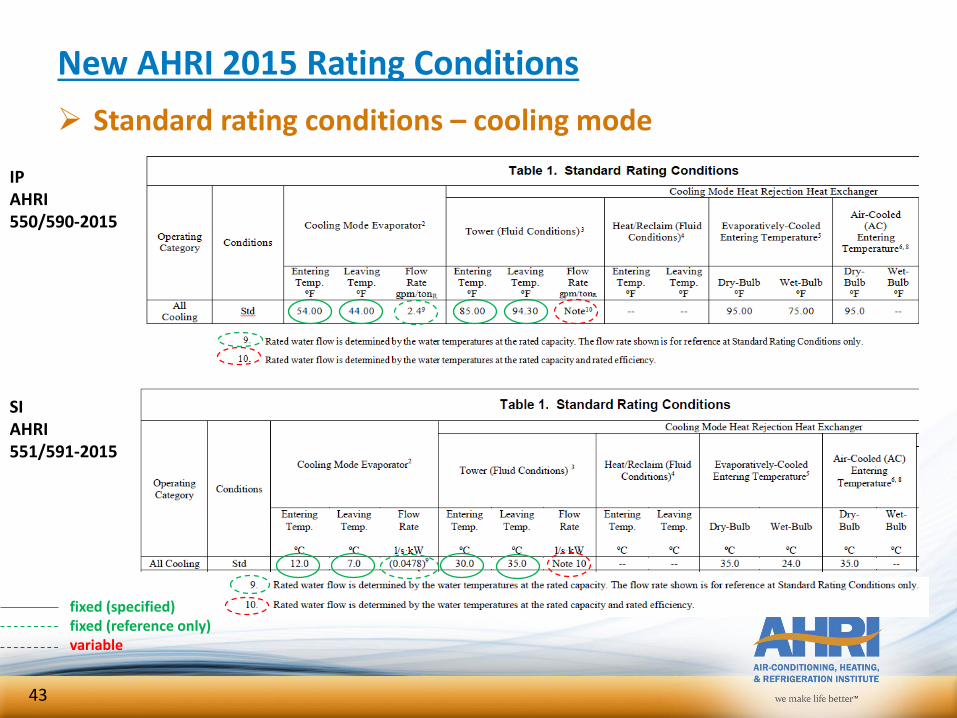
New AHRI 2015 Rating Conditions
Standard rating conditions – cooling mode
IPAHRI550/590-2015
SIAHRI551/591-2015
fixed (specified)fixed (reference only)variable
43
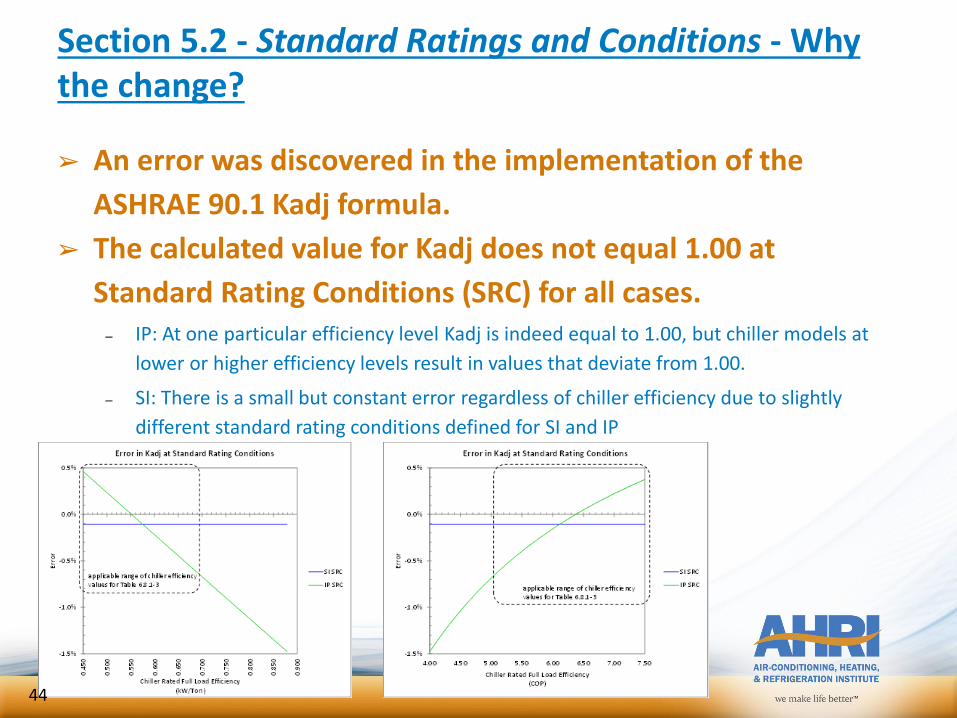
Section 5.2 - Standard Ratings and Conditions - Why the change?
➢ An error was discovered in the implementation of the
ASHRAE 90.1 Kadj formula.
➢ The calculated value for Kadj does not equal 1.00 at
Standard Rating Conditions (SRC) for all cases.– IP: At one particular efficiency level Kadj is indeed equal to 1.00, but chiller models at
lower or higher efficiency levels result in values that deviate from 1.00.
– SI: There is a small but constant error regardless of chiller efficiency due to slightly
different standard rating conditions defined for SI and IP
44
Section 5.3 - Application Rating Conditions
➢ Full and Part-load Application Rating Conditions➢ Table 2
– No changes to ranges from 2011 Standard
– Additional notes have been added to clarify the intent of the
application rating conditions
45
Section 5.4 – Part-Load Ratings
➢ Table 3, Part-load Conditions for Rating, Changes
– New Clarification for Note 6:
“Air-cooled and evaporatively-cooled unit ratings are at standard
atmospheric condition (sea level). Measured data shall be corrected to
standard atmospheric pressure of 14.696 psia per Appendix F.”
46
Section 5.4 – Part-Load Ratings
➢ IPLV & NPLV Nomenclature
– It is important to identify which standard was used to determine
ratings because the IP & SI Standard Rating Conditions are not exact
conversions
– IPLV or NPLV should be appended with “.SI” or “.IP”
IPLV.SIIPLV.IP
– NPLV applies only to Water-Cooled chillers
47
Section 5.4.1.2 - Stepped Capacity Part Load Ratings
➢ IPLV
– If a chiller can not operate at a defined part load point, the point
may be interpolated, but not extrapolated
– In cases where the equipment cannot unload to obtain a point, 5.4.1
and the subsections provide numerous examples of various types to
calculate IPLV
48
Section 5.6, Table 12 - Definition of Operating Condition Tolerances and Stability Criteria
➢ For testing, each stability criteria has been statistically defined
49
Section 5.6.3, Table 13 - Definition of Validity Tolerance
➢ Energy Balance (Tol4) tolerance reduced by 30%➢ New requirement for Voltage Balance (Vbal) of ≤ 2.0%
between phases
50
Section 6, Minimum Data Requirements for Published Ratings
51
Section 6.1 - Minimum Data Requirements for Published Ratings
Clarifies that Standard Ratings are per Section 5.1 (Standard Rating Metrics) and Section 5.2 (Standard Ratings and Conditions)
Adds direction for centrifugal chillers to use Section 5.3 (Application Rating Conditions) with the Fouling Factor Allowance per Table 1 Notes unless the specified application states a different value.
52
Section 6.2 - Published Ratings
Requires all Published Ratings to be rounded to the number of significant figures shown in Table 14 (effective 1/1/17)
Rated Total Input Power to Chiller (6.2.1.4)– Explicitly includes all auxiliary power (previously only stated in
testing requirements).– Include losses from starters, transformers, drives, or gearboxes
(line side power measurement) when those components are provided by the chiller manufacturer (whether unit-mounted, self-contained, free-standing, or remote-mounted).
– Include losses from non-electric drive (prime mover and all driveline components) when those components are provided by the chiller manufacturer.
– Excludes losses (not included in the ratings) from starters, transformers, drives, gearboxes, or prime mover when such equipment is provided by the customer or other third party. If variable speed, assume same speed control method as if provided by the chiller manufacturer.
53
Section 6.2 - Published Ratings (cont’d)
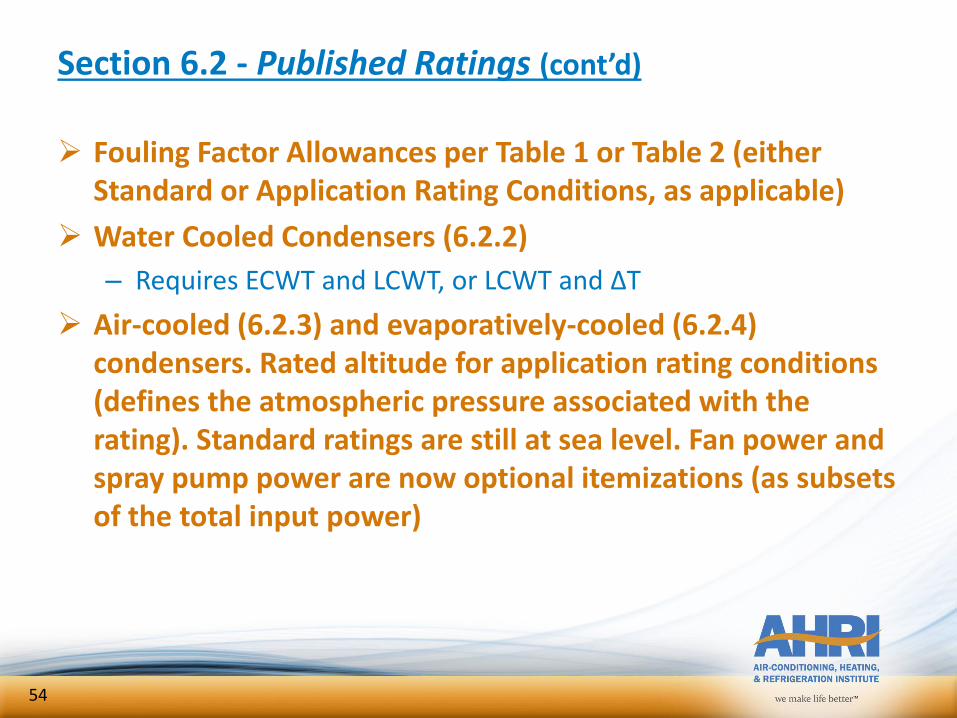
Fouling Factor Allowances per Table 1 or Table 2 (either Standard or Application Rating Conditions, as applicable)
Water Cooled Condensers (6.2.2)
– Requires ECWT and LCWT, or LCWT and ΔT
Air-cooled (6.2.3) and evaporatively-cooled (6.2.4) condensers. Rated altitude for application rating conditions (defines the atmospheric pressure associated with the rating). Standard ratings are still at sea level. Fan power and spray pump power are now optional itemizations (as subsets of the total input power)
54
Section 6.3 - Summary Table of Data to be Published
Added column for significant figures requirement
Required reporting of altitude
Optional itemization notes (fan, spray pump)
Temperature decimal place rounding requirements
55
Section 7, Conversions and Calculations
56
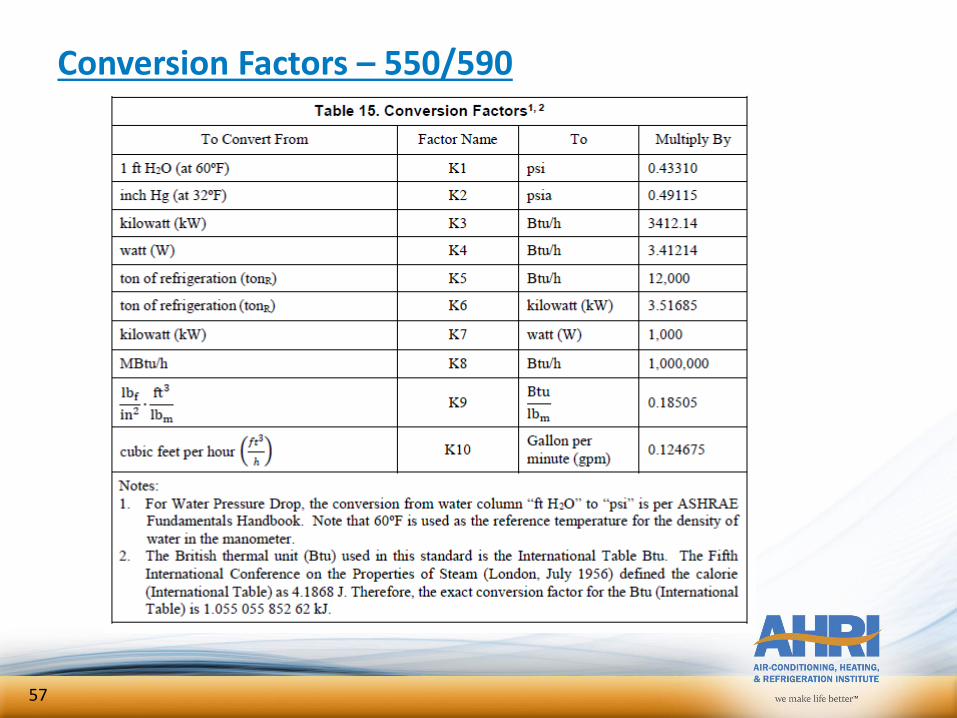
Conversion Factors – 550/590
57
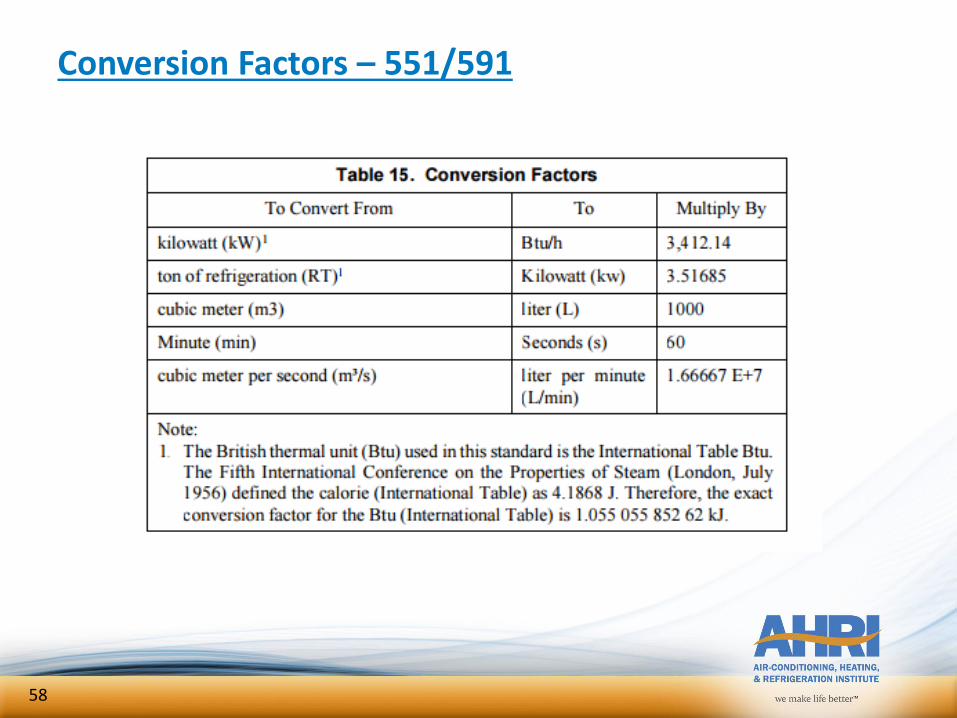
Conversion Factors – 551/591
58
Water Side Properties Calculation Methods
Either of the following 2 methods can be used. In both cases, the value of the water temperature or pressure to be used as input is dependent on the context of the calculation using the density and specific heat terms.
59
Method 1
Use NIST (National Institute of Standards and Technology) Refprop software (version 9.1 or later) to calculate physical properties density and specific heat, as a function of both pressure and temperature.
60
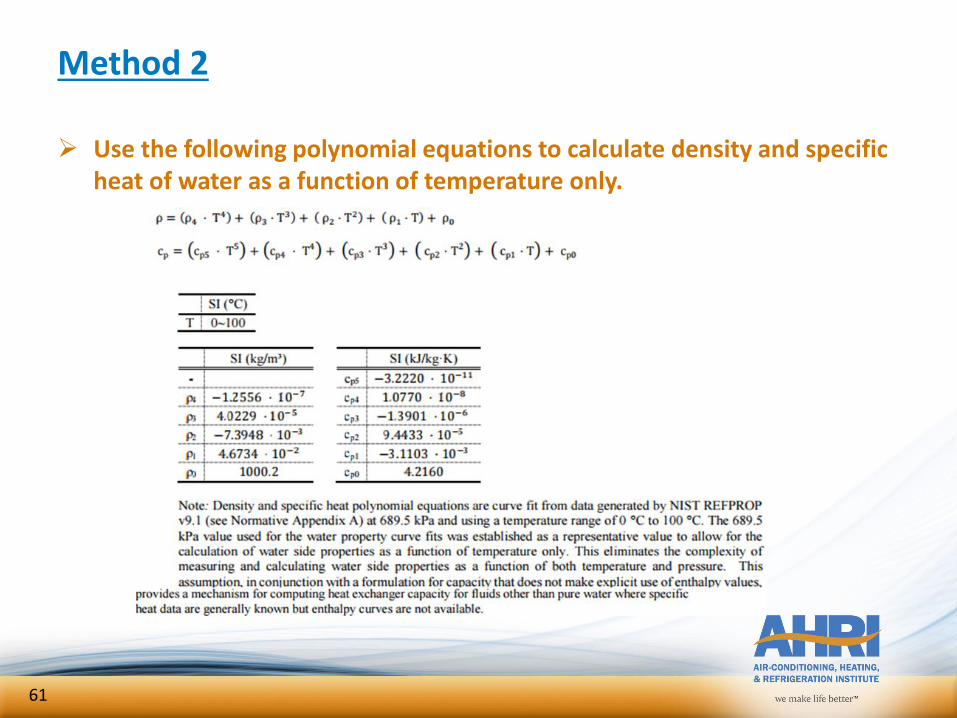
Method 2
Use the following polynomial equations to calculate density and specific heat of water as a function of temperature only.
61
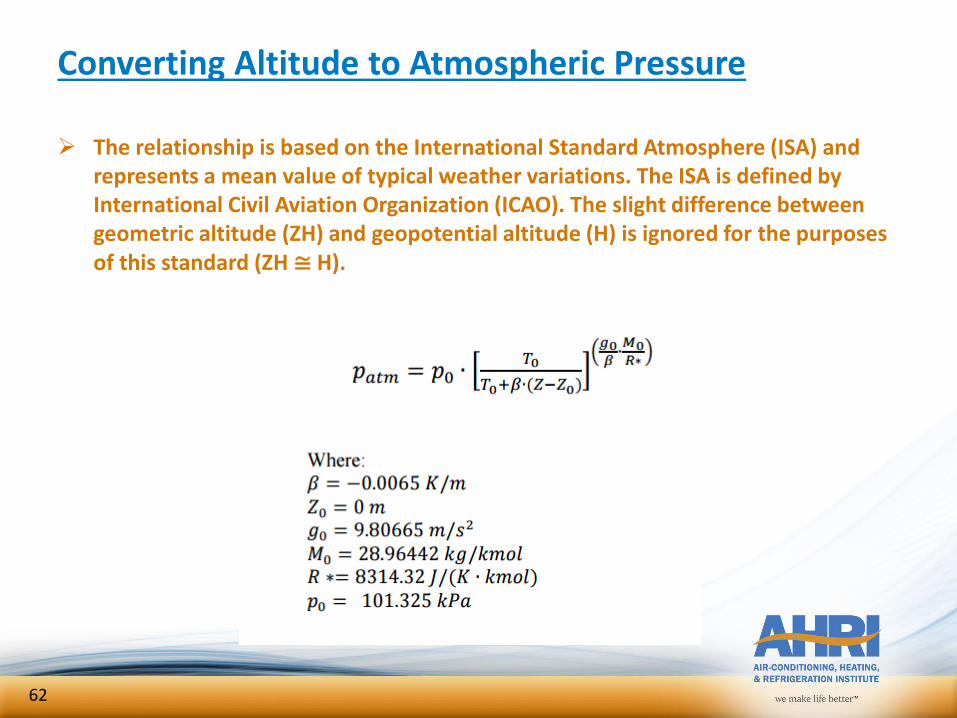
Converting Altitude to Atmospheric Pressure
The relationship is based on the International Standard Atmosphere (ISA) and represents a mean value of typical weather variations. The ISA is defined by International Civil Aviation Organization (ICAO). The slight difference between geometric altitude (ZH) and geopotential altitude (H) is ignored for the purposes of this standard (ZH ≅ H).
62

Section 8, Symbols and Subscripts
63
Symbols and Subscripts
All symbols and subscripts from the standard and all appendices were compiled into a single section
All symbols and subscripts have unique usage
A few new symbols and subscripts were added
64
Appendix C, Method of Testing Water-Chilling and Water-Heating
Packages Using the Vapor Compression Cycle
65
Test Setup
66
Test Setup
Installation
– No changes
Data to be collected
– Previously listed in text of Appendix C. Now organized in Tables C3, C4, and C5.
67
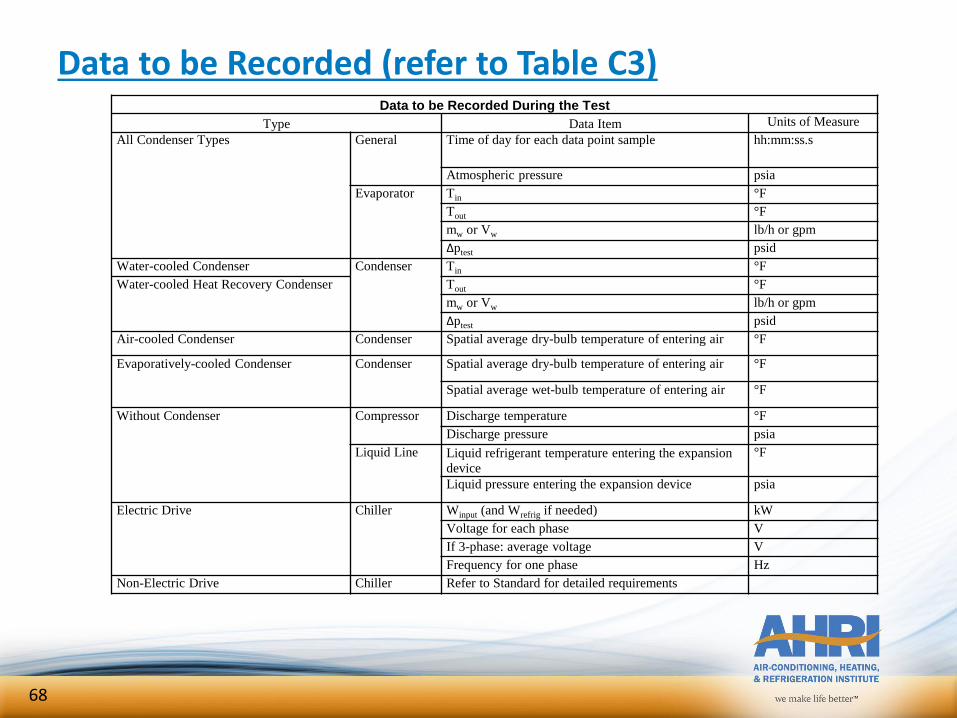
Data to be Recorded (refer to Table C3)Data to be Recorded During the Test
Type Data Item Units of Measure
All Condenser Types General Time of day for each data point sample hh:mm:ss.s
Atmospheric pressure psia
Evaporator Tin °F
Tout °F
mw or Vw lb/h or gpm
Δptest psid
Water-cooled Condenser Condenser Tin °F
Water-cooled Heat Recovery Condenser Tout °F
mw or Vw lb/h or gpm
Δptest psid
Air-cooled Condenser Condenser Spatial average dry-bulb temperature of entering air °F
Evaporatively-cooled Condenser Condenser Spatial average dry-bulb temperature of entering air °F
Spatial average wet-bulb temperature of entering air °F
Without Condenser Compressor Discharge temperature °F
Discharge pressure psia
Liquid Line Liquid refrigerant temperature entering the expansion
device
°F
Liquid pressure entering the expansion device psia
Electric Drive Chiller Winput (and Wrefrig if needed) kW
Voltage for each phase V
If 3-phase: average voltage V
Frequency for one phase Hz
Non-Electric Drive Chiller Refer to Standard for detailed requirements
68
Data to be Recorded (refer to Tables C4 and C5)
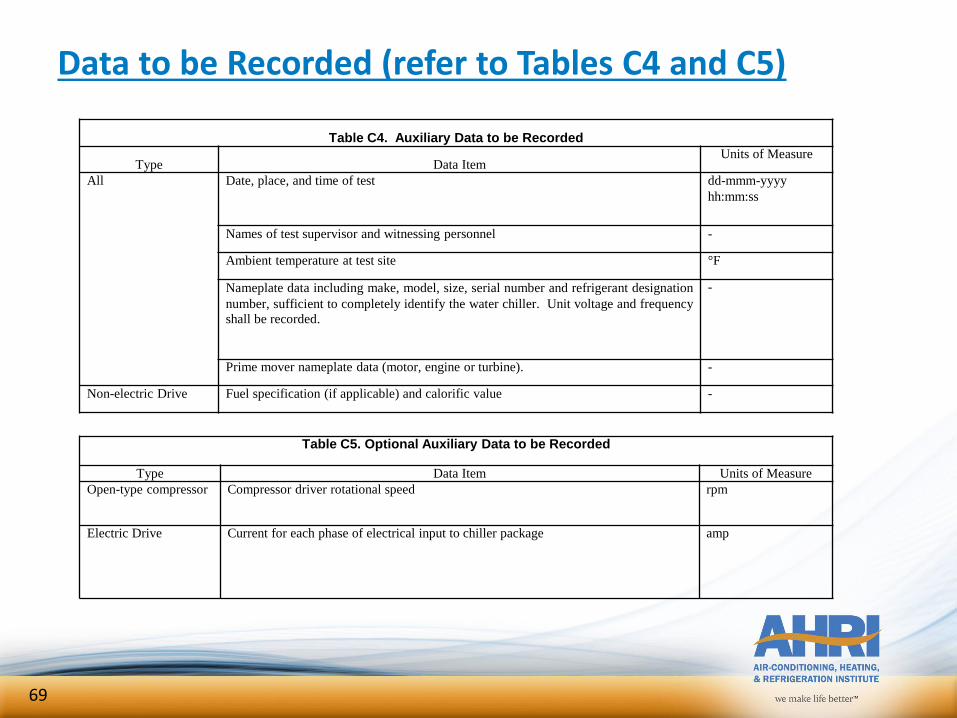
Table C4. Auxiliary Data to be Recorded
Type Data ItemUnits of Measure
All Date, place, and time of test dd-mmm-yyyy
hh:mm:ss
Names of test supervisor and witnessing personnel -
Ambient temperature at test site °F
Nameplate data including make, model, size, serial number and refrigerant designation
number, sufficient to completely identify the water chiller. Unit voltage and frequency
shall be recorded.
-
Prime mover nameplate data (motor, engine or turbine). -
Non-electric Drive Fuel specification (if applicable) and calorific value -
Table C5. Optional Auxiliary Data to be Recorded
Type Data Item Units of Measure
Open-type compressor Compressor driver rotational speed rpm
Electric Drive Current for each phase of electrical input to chiller package amp
69
Data to be Recorded – Special Notes
Pressure– Refer to Section C4.1.4 for requirements for Water Pressure Drop
measurements. – Appendix G is the procedure for Water Pressure Drop Measurement.
• Sections G3 and G4 detail the measurement locations and static pressure tap requirements. Many labs construct special “Appendix G Pipes” in various sizes that meet these requirements and reuse them on multiple tests.
• Section G5 details the procedure for correcting for additional static pressure drop due to external piping. This procedure may not be required on every test. Some labs find it advantageous to include the correction calculations in their computerized data acquisition system so it is calculated in real time during the test. Other labs do the correction calculations on the final test results.
Power– Refer to Section C4.1.5– Clarified that auxiliary, condenser fan, and condenser spray pump power
must be included in Winput , but are not required to be recorded separately.
70
Data to be Recorded – Special Notes
Flow– Refer to Section C4.1.3 for details on the requirements for mass flow
rate and how to calculate it if volumetric flow rate meters are used.– Flow meter installation location
• If using volumetric type flow meter(s), consider installing the flow meter(s) on the flow entering the heat exchanger. Not a requirement but strongly preferred. This avoids the need to make small adjustments in test conditions versus rating conditions (per Section C4.1.3.1).
• Also refer to Sections 5.1.3 and 5.1.4 for chiller ratings requirements being based on volumetric flow entering the evaporator or condenser (so that rated flow and test measured flow correspond to the same temperature and density). At low ΔT the adjustment is insignificant, but at higher ΔT, particularly in the condenser at higher temperatures, the adjustment is significant and can be more than 10% of the ±5% tolerance on flow rate.
71
Collecting/Recording Data
72
Testing Process
Section C6.2.1, General– Unit being tested shall maintain steady state operating conditions and performance for
a minimum of 15 minutes.
– “A minimum of 30 data point measurements shall be collected and recorded”
– Data to be recorded is identified in Tables C3 and C4
– Table C5 data may be recorded but is not mandatory
– Each data point measurement shall be time stamped
– Time interval between data point measurements shall be uniform in duration, e.g. 30 seconds between each of the minimum 30 measurement data points on a 15 minute duration test
– “Intervals between time stamps shall not vary by more than +/- 5% from the average time interval for all data points.”
– This means that the time intervals for the minimum 30 measurement data points at an average time interval of 30 seconds can’t vary by more than +/- 1.5 seconds.
• For example,
– Data point n time stamp 10:25:25.2 (hh:mm:ss.s)
– Data point n+1 time stamp shall be between 10:25:53.7 and 10:25:56.7
73
Recording Data Rules
What is not allowed:– No longer recording 4 points over a 15 minute period.– No longer using tolerances only for pass/fail criteria.
What shall be done:– Using software or other recording method to capture time stamped data.– Test must run a minimum of 15 minutes, no maximum.– A minimum of 30 data point measurements to be collected at uniform time
intervals.• Intervals between time stamps shall not vary more than +/- 5% • Each data point measurement can represent either individual reading or time
averaged value.• If time averaged value is used; whether in hardware or software, the time interval
for averaging of the data samples shall not exceed 1/60 of the total test time period.
– Pass/Fail decisions will use a combination of tolerance and stability criteria.
74
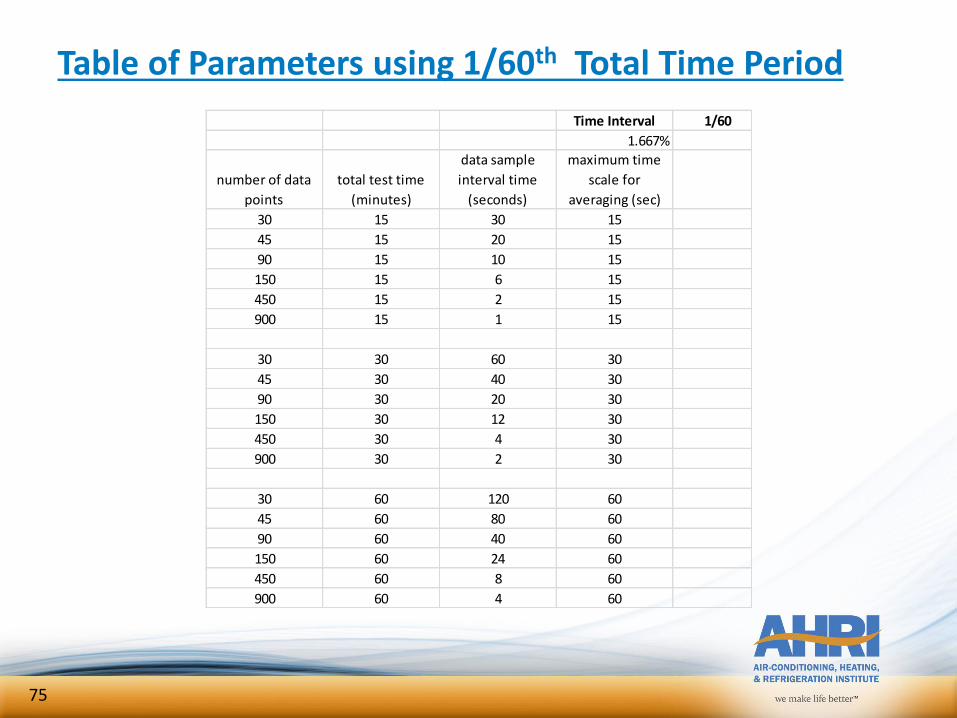
Table of Parameters using 1/60th Total Time Period
Time Interval 1/60
1.667%
number of data
points
total test time
(minutes)
data sample
interval time
(seconds)
maximum time
scale for
averaging (sec)
30 15 30 15
45 15 20 15
90 15 10 15
150 15 6 15
450 15 2 15
900 15 1 15
30 30 60 30
45 30 40 30
90 30 20 30
150 30 12 30
450 30 4 30
900 30 2 30
30 60 120 60
45 60 80 60
90 60 40 60
150 60 24 60
450 60 8 60
900 60 4 60
75
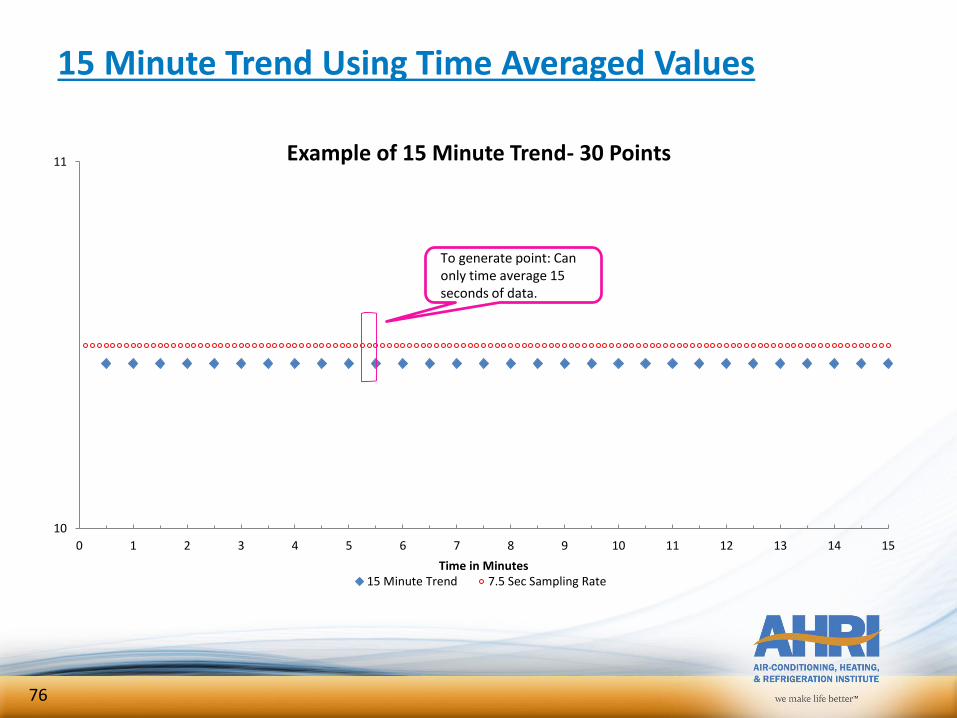
15 Minute Trend Using Time Averaged Values
10
11
0 1 2 3 4 5 6 7 8 9 10 11 12 13 14 15
Time in Minutes
Example of 15 Minute Trend- 30 Points
15 Minute Trend 7.5 Sec Sampling Rate
To generate point: Can only time average 15 seconds of data.
76
Testing Process
Section C6.2.1, General– Each measured value, such as temperature or power, may be single reading or
a time averaged value from a larger number of data points.
• For example, 7 measurement samples on a power meter averaged and used as the measured data point for power.
• Note the time interval for averaging of data samples shall not exceed 1/60th of the total test period. For a 15 minute round, this would be 15 seconds
– Steady State or Stability Criteria.• Determination of stability shall be based upon the criteria established in
Table 12.
• Calculation of the Standard Deviation for each of the measurements identified in Table 12 shall be performed.
77
Testing Process
Section C6.2.1, General– Determination of Steady State Operating Conditions is based upon the
mean value of the 30 or more data points relative to the target value.
– Steady State Operating Conditions (i.e. Stability Criteria)• Determination of stability shall be based upon the criteria established in
Table 12.
• Calculation of the Standard Deviation for each of the measurements identified in Table 12 shall be performed.
• The calculated standard deviation shall be used to determine if the stability criteria is meet as based upon Table 12.
– Performance• Determination of performance shall be based upon Table 11,
Definition of Tolerances and Table 12, Definition of Operating Condition Tolerances and Stability Criteria
78
Testing Process
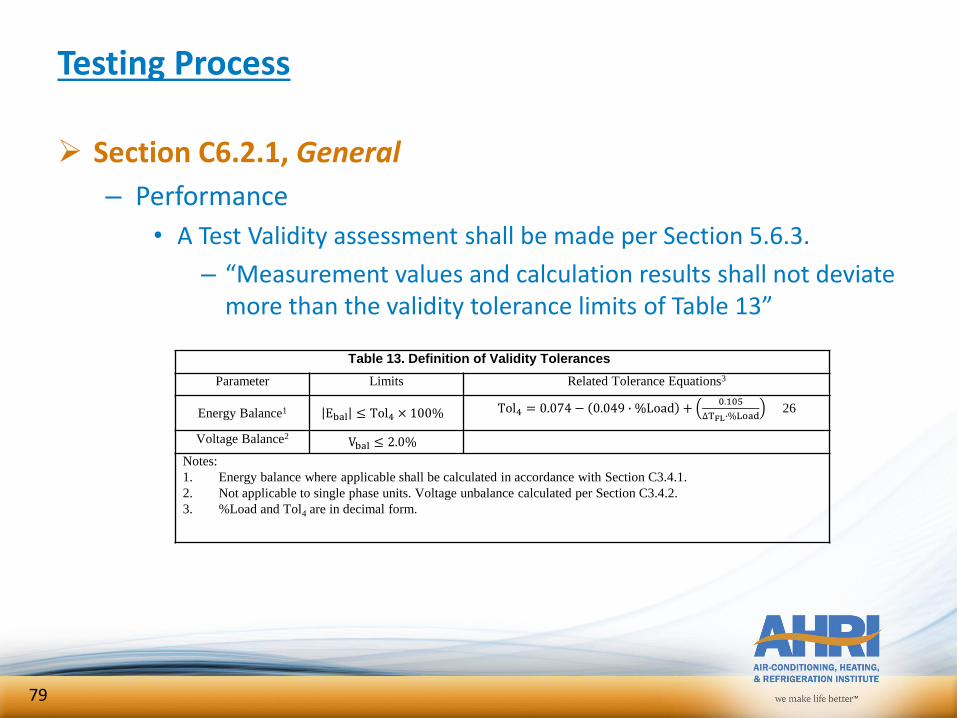
Section C6.2.1, General
– Performance
• A Test Validity assessment shall be made per Section 5.6.3.
– “Measurement values and calculation results shall not deviate more than the validity tolerance limits of Table 13”
Table 13. Definition of Validity Tolerances
Parameter Limits Related Tolerance Equations3
Energy Balance1 Ebal ≤ Tol4 × 100% Tol4 = 0.074 − 0.049 ∙ %Load +0.105
∆TFL∙%Load26
Voltage Balance2Vbal ≤ 2.0%
Notes:
1. Energy balance where applicable shall be calculated in accordance with Section C3.4.1.
2. Not applicable to single phase units. Voltage unbalance calculated per Section C3.4.2.
3. %Load and Tol4 are in decimal form.
79
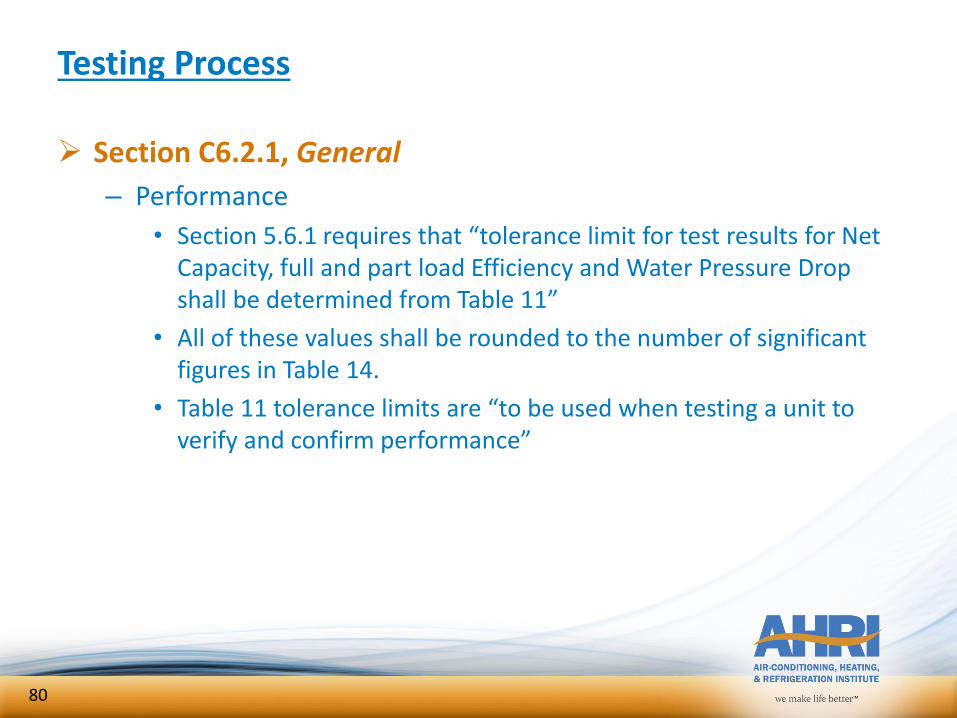
Testing Process
Section C6.2.1, General
– Performance
• Section 5.6.1 requires that “tolerance limit for test results for Net Capacity, full and part load Efficiency and Water Pressure Drop shall be determined from Table 11”
• All of these values shall be rounded to the number of significant figures in Table 14.
• Table 11 tolerance limits are “to be used when testing a unit to verify and confirm performance”
80

Example: Operating Condition Tolerance & StabilityTemperature (°F) [IP]
data data set
point 20
1 44.1000 44.00 adjusted target2 44.0813
3 44.1112 44.22 sample mean4 44.1114 0.07 sample standard deviation
5 44.1328
6 44.1202 44.50 tolerance limit for sample mean (upper)
7 44.1314 43.50 tolerance limit for sample mean (lower)
8 44.1641
9 44.1771 Table 12 Limits
10 44.2081 0.22 mean to target tolerance limit check 0.50 °F
11 44.2049 0.07 stability limit check 0.18 °F
12 44.2089
13 44.2529 PASS
14 44.2607
15 44.2786
16 44.2942
17 44.2723
18 44.3028
19 44.3270
20 44.2941
21 44.2596
22 44.2982
23 44.3087
24 44.3078
25 44.2697
26 44.2761
27 44.2449
28 44.2107
29 44.2131
30 44.1782
43.00
43.50
44.00
44.50
45.00
0 5 10 15 20 25 30
PASS
𝑇 − 𝑇𝑡𝑎𝑟 𝑒𝑡 ≤
≤
81
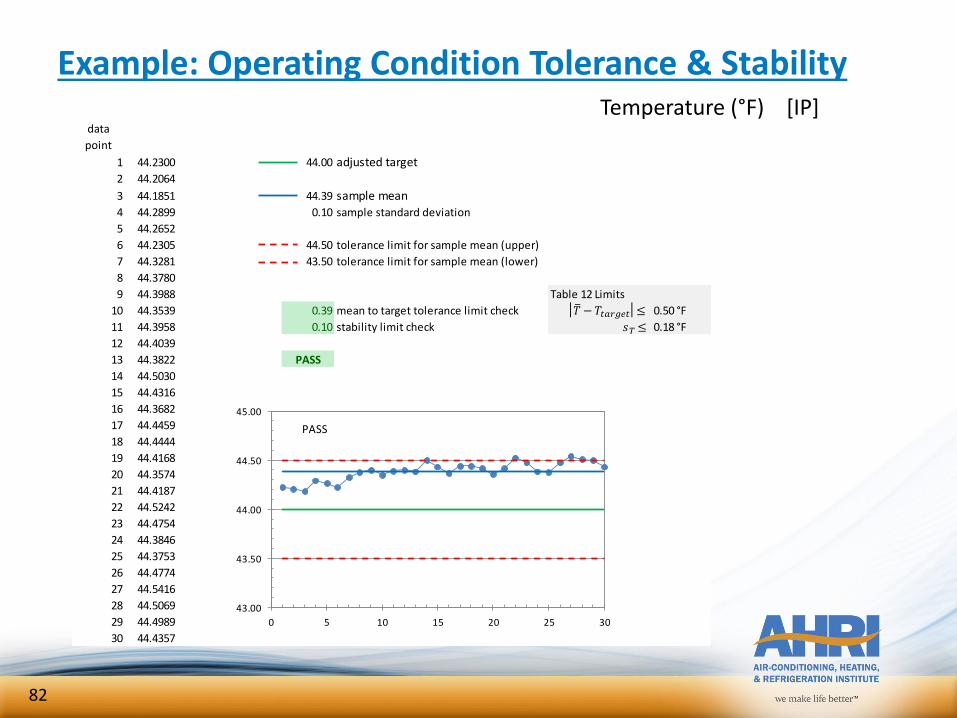
Example: Operating Condition Tolerance & StabilityTemperature (°F) [IP]
data data set
point 21
1 44.2300 44.00 adjusted target2 44.2064
3 44.1851 44.39 sample mean4 44.2899 0.10 sample standard deviation
5 44.2652
6 44.2305 44.50 tolerance limit for sample mean (upper)
7 44.3281 43.50 tolerance limit for sample mean (lower)
8 44.3780
9 44.3988 Table 12 Limits
10 44.3539 0.39 mean to target tolerance limit check 0.50 °F
11 44.3958 0.10 stability limit check 0.18 °F
12 44.4039
13 44.3822 PASS
14 44.5030
15 44.4316
16 44.3682
17 44.4459
18 44.4444
19 44.4168
20 44.3574
21 44.4187
22 44.5242
23 44.4754
24 44.3846
25 44.3753
26 44.4774
27 44.5416
28 44.5069
29 44.4989
30 44.4357
43.00
43.50
44.00
44.50
45.00
0 5 10 15 20 25 30
PASS
𝑇 − 𝑇𝑡𝑎𝑟 𝑒𝑡 ≤
≤
82
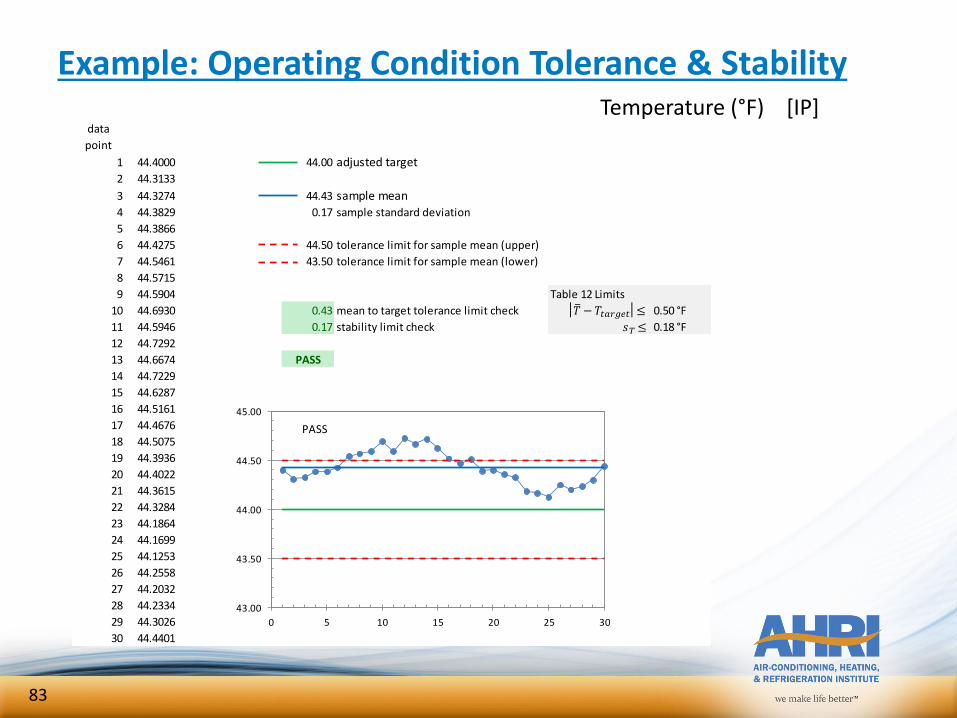
Example: Operating Condition Tolerance & StabilityTemperature (°F) [IP]
data data set
point 25
1 44.4000 44.00 adjusted target2 44.3133
3 44.3274 44.43 sample mean4 44.3829 0.17 sample standard deviation
5 44.3866
6 44.4275 44.50 tolerance limit for sample mean (upper)
7 44.5461 43.50 tolerance limit for sample mean (lower)
8 44.5715
9 44.5904 Table 12 Limits
10 44.6930 0.43 mean to target tolerance limit check 0.50 °F
11 44.5946 0.17 stability limit check 0.18 °F
12 44.7292
13 44.6674 PASS
14 44.7229
15 44.6287
16 44.5161
17 44.4676
18 44.5075
19 44.3936
20 44.4022
21 44.3615
22 44.3284
23 44.1864
24 44.1699
25 44.1253
26 44.2558
27 44.2032
28 44.2334
29 44.3026
30 44.4401
43.00
43.50
44.00
44.50
45.00
0 5 10 15 20 25 30
PASS
𝑇 − 𝑇𝑡𝑎𝑟 𝑒𝑡 ≤
≤
83

Example: Operating Condition Tolerance & StabilityTemperature (°F) [IP]
data data set
point 24
1 44.0800 44.00 adjusted target2 44.1947
3 44.2418 44.49 sample mean4 44.2749 0.17 sample standard deviation
5 44.2513
6 44.2551 44.50 tolerance limit for sample mean (upper)
7 44.2909 43.50 tolerance limit for sample mean (lower)
8 44.3965
9 44.3569 Table 12 Limits
10 44.4994 0.49 mean to target tolerance limit check 0.50 °F
11 44.5967 0.17 stability limit check 0.18 °F
12 44.5135
13 44.6332 PASS
14 44.5413
15 44.6320
16 44.6478
17 44.6737
18 44.6061
19 44.6170
20 44.6478
21 44.6253
22 44.6290
23 44.5881
24 44.5825
25 44.6091
26 44.5754
27 44.5354
28 44.5219
29 44.5343
30 44.5272
43.00
43.50
44.00
44.50
45.00
0 5 10 15 20 25 30
PASS
𝑇 − 𝑇𝑡𝑎𝑟 𝑒𝑡 ≤
≤
84
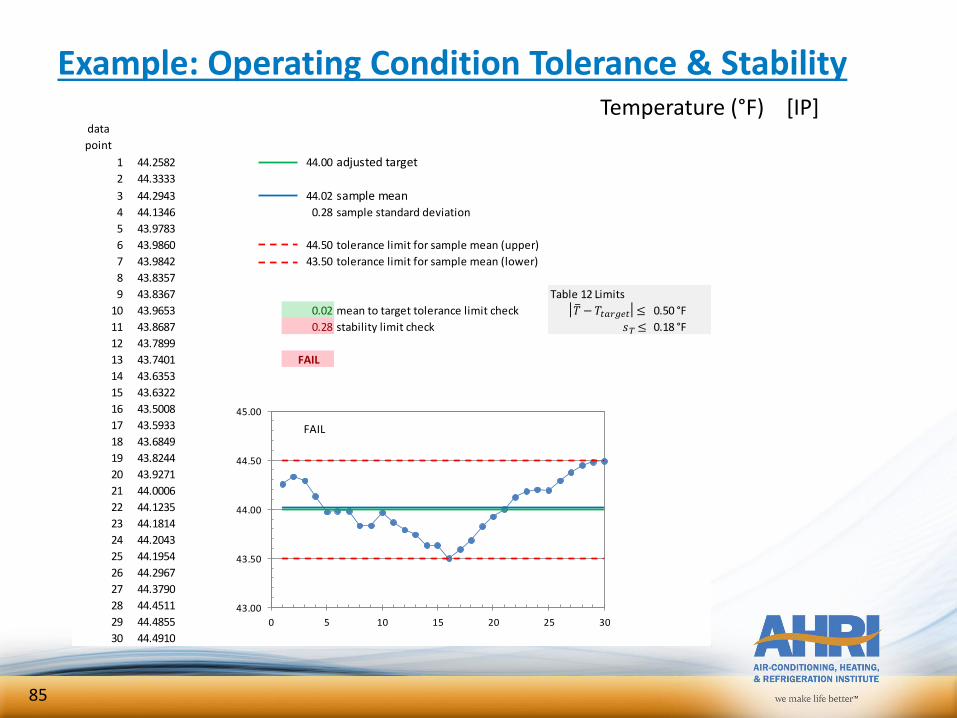
Example: Operating Condition Tolerance & StabilityTemperature (°F) [IP]
data data set
point 22
1 44.2582 44.00 adjusted target2 44.3333
3 44.2943 44.02 sample mean4 44.1346 0.28 sample standard deviation
5 43.9783
6 43.9860 44.50 tolerance limit for sample mean (upper)
7 43.9842 43.50 tolerance limit for sample mean (lower)
8 43.8357
9 43.8367 Table 12 Limits
10 43.9653 0.02 mean to target tolerance limit check 0.50 °F
11 43.8687 0.28 stability limit check 0.18 °F
12 43.7899
13 43.7401 FAIL
14 43.6353
15 43.6322
16 43.5008
17 43.5933
18 43.6849
19 43.8244
20 43.9271
21 44.0006
22 44.1235
23 44.1814
24 44.2043
25 44.1954
26 44.2967
27 44.3790
28 44.4511
29 44.4855
30 44.4910
43.00
43.50
44.00
44.50
45.00
0 5 10 15 20 25 30
FAIL
𝑇 − 𝑇𝑡𝑎𝑟 𝑒𝑡 ≤
≤
85

Example: Operating Condition Tolerance & StabilityTemperature (°F) [IP]
data data set
point 19
1 43.8961 44.00 adjusted target2 43.8178
3 43.8553 44.25 sample mean4 43.8747 0.19 sample standard deviation
5 43.9924
6 44.1124 44.50 tolerance limit for sample mean (upper)
7 44.1870 43.50 tolerance limit for sample mean (lower)
8 44.2367
9 44.2371 Table 12 Limits
10 44.2871 0.25 mean to target tolerance limit check 0.50 °F
11 44.3588 0.19 stability limit check 0.18 °F
12 44.3161
13 44.2851 FAIL
14 44.1644
15 44.2556
16 44.3114
17 44.4313
18 44.4104
19 44.3187
20 44.2660
21 44.2278
22 44.3265
23 44.3860
24 44.4641
25 44.4537
26 44.3344
27 44.3918
28 44.4928
29 44.3978
30 44.4110
43.00
43.50
44.00
44.50
45.00
0 5 10 15 20 25 30
FAIL
𝑇 − 𝑇𝑡𝑎𝑟 𝑒𝑡 ≤
≤
86

Example: Operating Condition Tolerance & StabilityTemperature (°F) [IP]
data data set
point 23
1 44.1000 44.00 adjusted target2 44.2147
3 44.2618 44.51 sample mean4 44.2949 0.17 sample standard deviation
5 44.2713
6 44.2751 44.50 tolerance limit for sample mean (upper)
7 44.3109 43.50 tolerance limit for sample mean (lower)
8 44.4165
9 44.3769 Table 12 Limits
10 44.5194 0.51 mean to target tolerance limit check 0.50 °F
11 44.6167 0.17 stability limit check 0.18 °F
12 44.5335
13 44.6532 FAIL
14 44.5613
15 44.6520
16 44.6678
17 44.6937
18 44.6261
19 44.6370
20 44.6678
21 44.6453
22 44.6490
23 44.6081
24 44.6025
25 44.6291
26 44.5954
27 44.5554
28 44.5419
29 44.5543
30 44.5472
43.00
43.50
44.00
44.50
45.00
0 5 10 15 20 25 30
FAIL
𝑇 − 𝑇𝑡𝑎𝑟 𝑒𝑡 ≤
≤
87
Analyzing Results
88
Section C4.5, Validation
As a part of test validation, the concept previously referred to as “heat balance” is now referred to as “energy balance” to better reflect the true purpose.
Section C4.5.3 includes new requirement to calculate voltage balance per Section C3.4.2 for units that use a multi-phase power supply.
➢ Energy Balance (Tol4) tolerance reduced by 25%➢ New requirement for Voltage Balance (Vbal) of ≤ 2.0%
between phases
89
Analyzing Results
Refer to Section C4.3, Tolerances.
– Section C4.3.1 defines tolerance requirements on Operating Conditions and refers to Table 12.
• Changes related to continuous data collection
– Operating Condition Tolerance Limits for measured data are now based on average value for each measurement
– Stability Criteria added, based on standard deviation.
– Section C4.3.2 defines requirements on performance and refers to Table 11
– Section 5.6.3 defines requirements for Test Validity and refers to Table 13
90
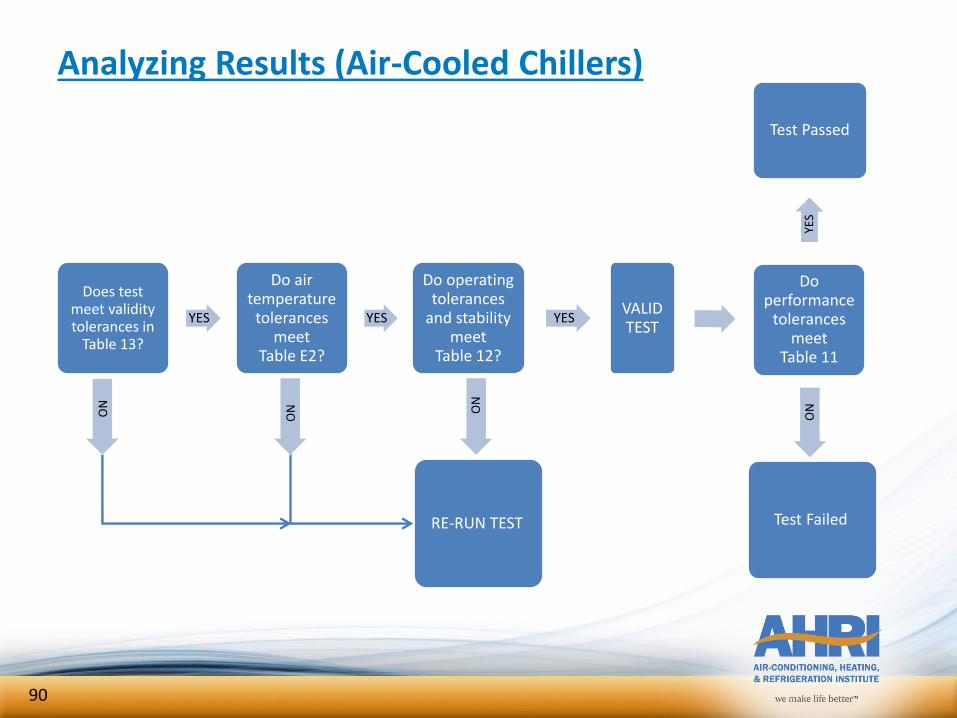
Does test meet validity tolerances in
Table 13?
YES
Do air temperature
tolerances meet
Table E2?
YES
Do operating tolerances
and stability meet
Table 12?
YESVALID TEST
Do performance
tolerances meet
Table 11
Test Passed
Analyzing Results (Air-Cooled Chillers)
NO
NON
O
RE-RUN TEST
90
NO
Test Failed
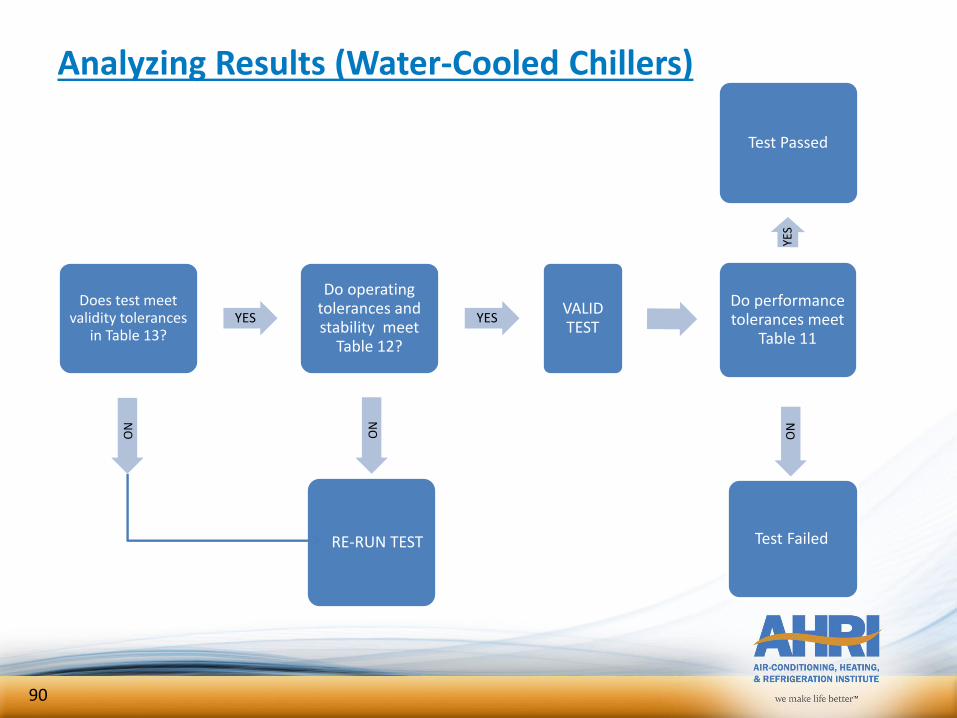
Does test meet validity tolerances
in Table 13?YES
Do operating tolerances and stability meet
Table 12?
YESVALID TEST
Do performance tolerances meet
Table 11
Test Passed
Analyzing Results (Water-Cooled Chillers)
NO
NO
RE-RUN TEST
90
NO
Test Failed
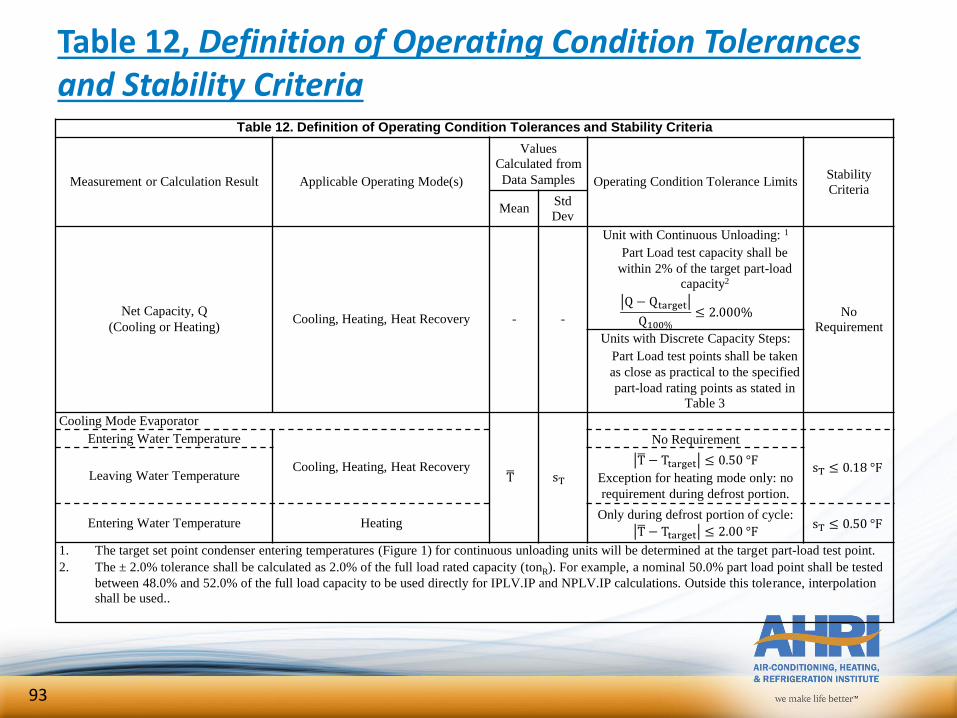
Table 12, Definition of Operating Condition Tolerances and Stability Criteria
Table 12. Definition of Operating Condition Tolerances and Stability Criteria
Measurement or Calculation Result Applicable Operating Mode(s)
Values
Calculated from
Data Samples Operating Condition Tolerance LimitsStability
Criteria
MeanStd
Dev
Net Capacity, Q
(Cooling or Heating)Cooling, Heating, Heat Recovery - -
Unit with Continuous Unloading: 1
No
Requirement
Part Load test capacity shall be
within 2% of the target part-load
capacity2
Q − Qtarget
Q100%≤ 2.000%
Units with Discrete Capacity Steps:
Part Load test points shall be taken
as close as practical to the specified
part-load rating points as stated in
Table 3
Cooling Mode Evaporator
ഥT sT
Entering Water Temperature
Cooling, Heating, Heat Recovery
No Requirement
sT ≤ 0.18 °FLeaving Water Temperature
ഥT − Ttarget ≤ 0.50 °F
Exception for heating mode only: no
requirement during defrost portion.
Entering Water Temperature HeatingOnly during defrost portion of cycle:
ഥT − Ttarget ≤ 2.00 °FsT ≤ 0.50 °F
1. The target set point condenser entering temperatures (Figure 1) for continuous unloading units will be determined at the target part-load test point.
2. The ± 2.0% tolerance shall be calculated as 2.0% of the full load rated capacity (tonR). For example, a nominal 50.0% part load point shall be tested
between 48.0% and 52.0% of the full load capacity to be used directly for IPLV.IP and NPLV.IP calculations. Outside this tolerance, interpolation
shall be used..
93
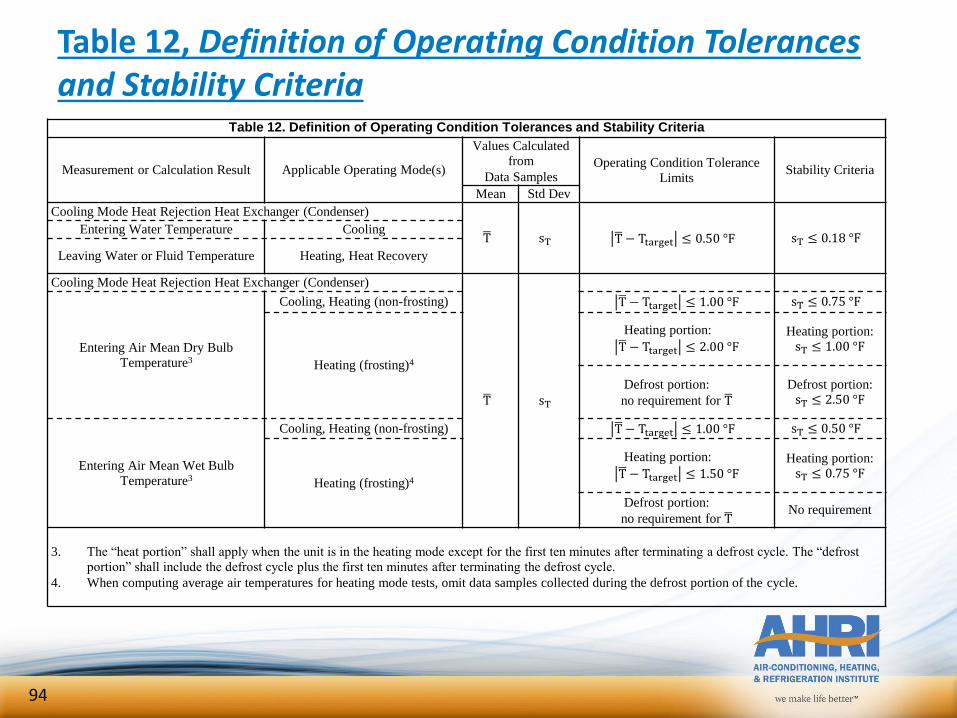
Table 12, Definition of Operating Condition Tolerances and Stability Criteria
Table 12. Definition of Operating Condition Tolerances and Stability Criteria
Measurement or Calculation Result Applicable Operating Mode(s)
Values Calculated
from
Data SamplesOperating Condition Tolerance
LimitsStability Criteria
Mean Std Dev
Cooling Mode Heat Rejection Heat Exchanger (Condenser)
ഥT sT ഥT − Ttarget ≤ 0.50 °F sT ≤ 0.18 °FEntering Water Temperature Cooling
Leaving Water or Fluid Temperature Heating, Heat Recovery
Cooling Mode Heat Rejection Heat Exchanger (Condenser)
ഥT sT
Entering Air Mean Dry Bulb
Temperature3
Cooling, Heating (non-frosting) ഥT − Ttarget ≤ 1.00 °F sT ≤ 0.75 °F
Heating (frosting)4
Heating portion:ഥT − Ttarget ≤ 2.00 °F
Heating portion:
sT ≤ 1.00 °F
Defrost portion:
no requirement for ഥTDefrost portion:
sT ≤ 2.50 °F
Entering Air Mean Wet Bulb
Temperature3
Cooling, Heating (non-frosting) ഥT − Ttarget ≤ 1.00 °F sT ≤ 0.50 °F
Heating (frosting)4
Heating portion:ഥT − Ttarget ≤ 1.50 °F
Heating portion:
sT ≤ 0.75 °F
Defrost portion:
no requirement for ഥTNo requirement
3. The “heat portion” shall apply when the unit is in the heating mode except for the first ten minutes after terminating a defrost cycle. The “defrost
portion” shall include the defrost cycle plus the first ten minutes after terminating the defrost cycle.
4. When computing average air temperatures for heating mode tests, omit data samples collected during the defrost portion of the cycle.
94
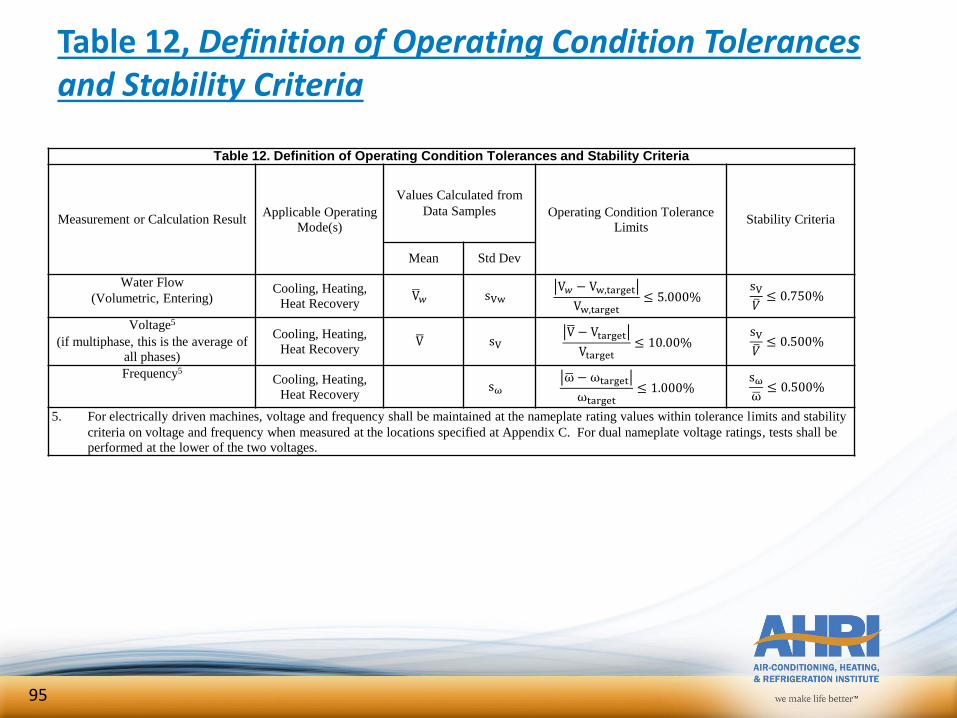
Table 12, Definition of Operating Condition Tolerances and Stability Criteria
Table 12. Definition of Operating Condition Tolerances and Stability Criteria
Measurement or Calculation ResultApplicable Operating
Mode(s)
Values Calculated from
Data Samples Operating Condition Tolerance
LimitsStability Criteria
Mean Std Dev
Water Flow
(Volumetric, Entering)Cooling, Heating,
Heat RecoveryഥV𝑤 sVw
V𝑤 − Vw,target
Vw,target≤ 5.000%
sV 𝑉≤ 0.750%
Voltage5
(if multiphase, this is the average of
all phases)
Cooling, Heating,
Heat RecoveryഥV sV
ഥV − Vtarget
Vtarget≤ 10.00%
sV 𝑉≤ 0.500%
Frequency5Cooling, Heating,
Heat Recoverysω
ഥω − ωtarget
ωtarget≤ 1.000%
sωഥω≤ 0.500%
5. For electrically driven machines, voltage and frequency shall be maintained at the nameplate rating values within tolerance limits and stability
criteria on voltage and frequency when measured at the locations specified at Appendix C. For dual nameplate voltage ratings, tests shall be
performed at the lower of the two voltages.
95
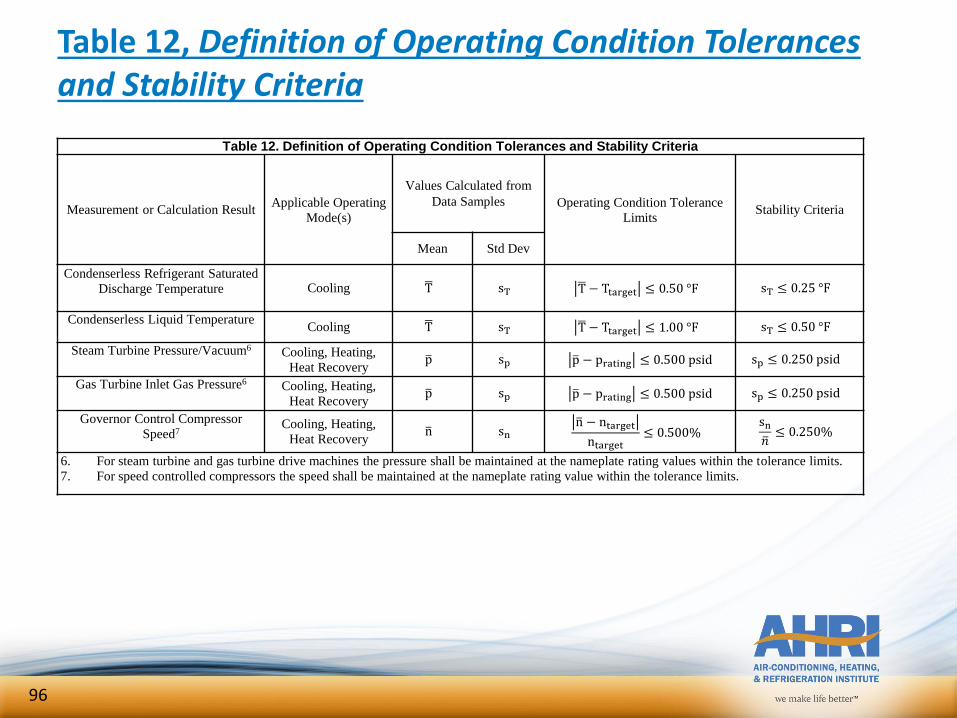
Table 12, Definition of Operating Condition Tolerances and Stability Criteria
Table 12. Definition of Operating Condition Tolerances and Stability Criteria
Measurement or Calculation ResultApplicable Operating
Mode(s)
Values Calculated from
Data Samples Operating Condition Tolerance
LimitsStability Criteria
Mean Std Dev
Condenserless Refrigerant Saturated
Discharge Temperature Cooling ഥT sT ഥT − Ttarget ≤ 0.50 °F sT ≤ 0.25 °F
Condenserless Liquid TemperatureCooling ഥT sT ഥT − Ttarget ≤ 1.00 °F sT ≤ 0.50 °F
Steam Turbine Pressure/Vacuum6 Cooling, Heating,
Heat Recovery p sp p − prating ≤ 0.500 psid sp ≤ 0.250 psid
Gas Turbine Inlet Gas Pressure6 Cooling, Heating,
Heat Recovery p sp p − prating ≤ 0.500 psid sp ≤ 0.250 psid
Governor Control Compressor
Speed7Cooling, Heating,
Heat Recovery n sn
n − ntarget
ntarget≤ 0.500%
sn 𝑛≤ 0.250%
6. For steam turbine and gas turbine drive machines the pressure shall be maintained at the nameplate rating values within the tolerance limits.
7. For speed controlled compressors the speed shall be maintained at the nameplate rating value within the tolerance limits.
96
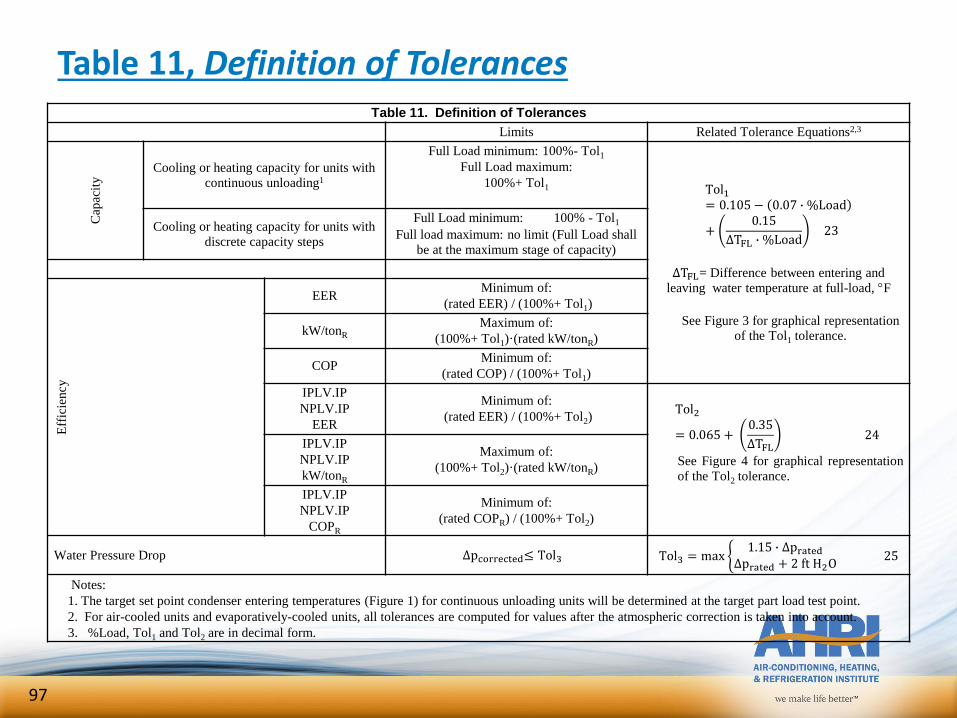
Table 11, Definition of TolerancesTable 11. Definition of Tolerances
Limits Related Tolerance Equations2,3
Cap
acit
y Cooling or heating capacity for units with
continuous unloading1
Full Load minimum: 100%- Tol1
Full Load maximum:
100%+ Tol1 Tol1= 0.105 − 0.07 ∙ %Load
+0.15
∆TFL ∙ %Load23
∆TFL= Difference between entering and
leaving water temperature at full-load, F
See Figure 3 for graphical representation of the Tol1 tolerance.
Cooling or heating capacity for units with
discrete capacity steps
Full Load minimum: 100% - Tol1
Full load maximum: no limit (Full Load shall
be at the maximum stage of capacity)
Eff
icie
ncy
EERMinimum of:
(rated EER) / (100%+ Tol1)
kW/tonR
Maximum of:
(100%+ Tol1)·(rated kW/tonR)
COPMinimum of:
(rated COP) / (100%+ Tol1)
IPLV.IP
NPLV.IP
EER
Minimum of:
(rated EER) / (100%+ Tol2)Tol2
= 0.065 +0.35
∆TFL24
See Figure 4 for graphical representation
of the Tol2 tolerance.
IPLV.IP
NPLV.IP
kW/tonR
Maximum of:
(100%+ Tol2)·(rated kW/tonR)
IPLV.IP
NPLV.IP
COPR
Minimum of:
(rated COPR) / (100%+ Tol2)
Water Pressure Drop ∆pcorrected≤ Tol3 Tol3 = max ቊ1.15 ∙ ∆prated
∆prated + 2 ft H2O25
Notes:
1. The target set point condenser entering temperatures (Figure 1) for continuous unloading units will be determined at the target part load test point.
2. For air-cooled units and evaporatively-cooled units, all tolerances are computed for values after the atmospheric correction is taken into account.
3. %Load, Tol1 and Tol2 are in decimal form.
97
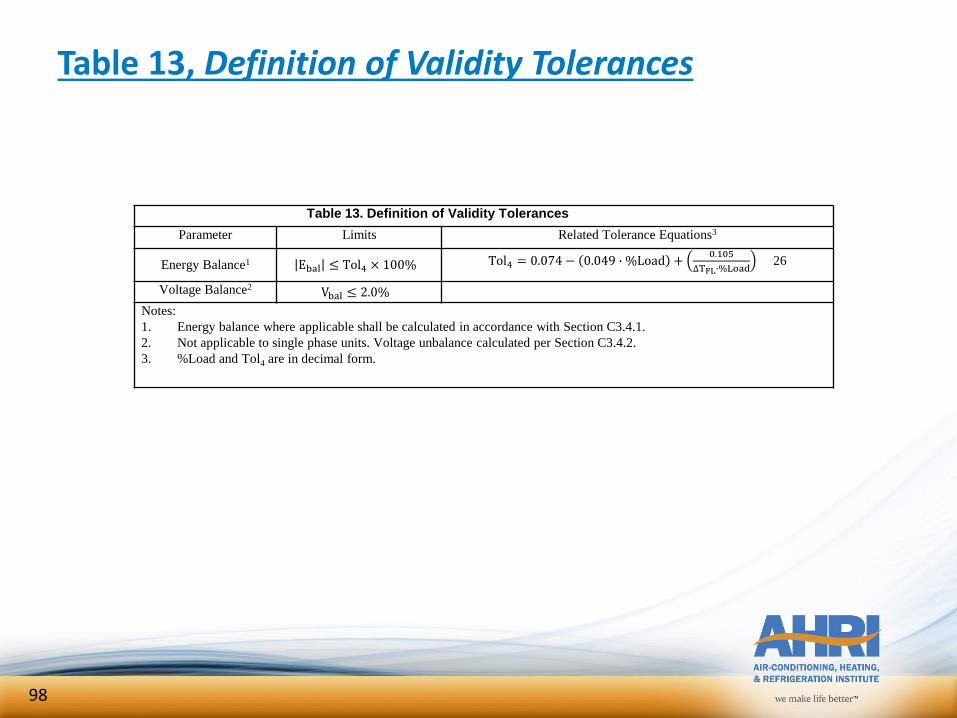
Table 13, Definition of Validity Tolerances
Table 13. Definition of Validity Tolerances
Parameter Limits Related Tolerance Equations3
Energy Balance1 Ebal ≤ Tol4 × 100% Tol4 = 0.074 − 0.049 ∙ %Load +0.105
∆TFL∙%Load26
Voltage Balance2 Vbal ≤ 2.0%
Notes:
1. Energy balance where applicable shall be calculated in accordance with Section C3.4.1.
2. Not applicable to single phase units. Voltage unbalance calculated per Section C3.4.2.
3. %Load and Tol4 are in decimal form.
98
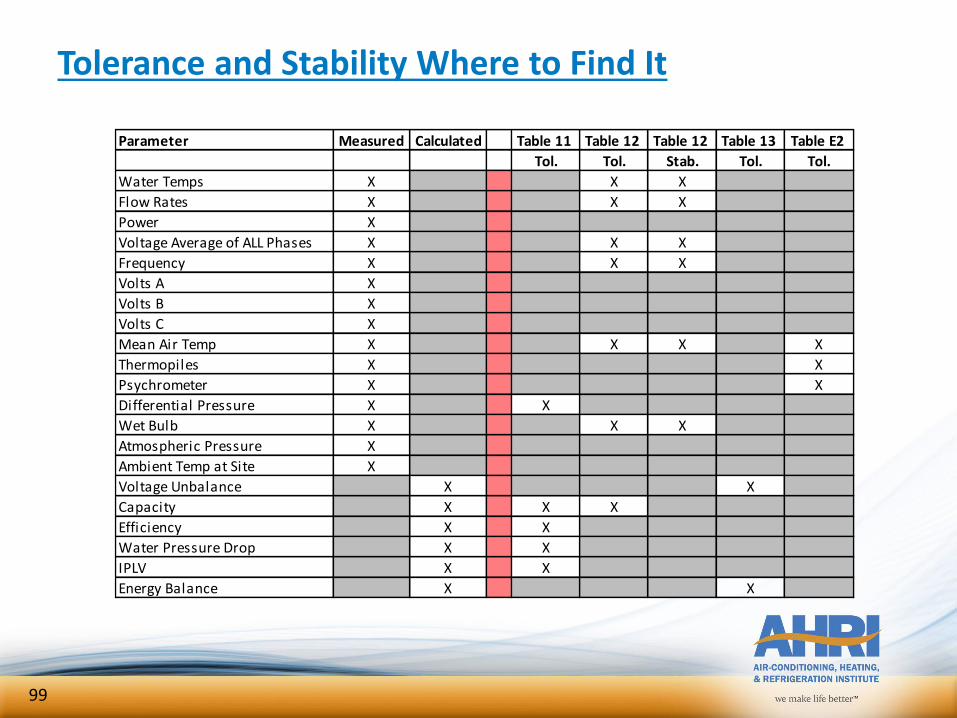
Tolerance and Stability Where to Find It
Parameter Measured Calculated Table 11 Table 12 Table 12 Table 13 Table E2
Tol. Tol. Stab. Tol. Tol.
Water Temps X X X
Flow Rates X X X
Power X
Voltage Average of ALL Phases X X X
Frequency X X X
Volts A X
Volts B X
Volts C X
Mean Air Temp X X X X
Thermopiles X X
Psychrometer X X
Differential Pressure X X
Wet Bulb X X X
Atmospheric Pressure X
Ambient Temp at Site X
Voltage Unbalance X X
Capacity X X X
Efficiency X X
Water Pressure Drop X X
IPLV X X
Energy Balance X X
99
Test Report Requirements
A written or electronic test report shall be generated including items for each test point at a specific load and set of operating conditions. AHRI breaks this down into 3 main parts.
– Data
• Include mean and standard deviation for each measurement value (refer to Section C7.1)
– Calculations
• Refer to Section C7.2
– Results
• Refer to Section C7.3 and Table C6
Examples of each will follow
100
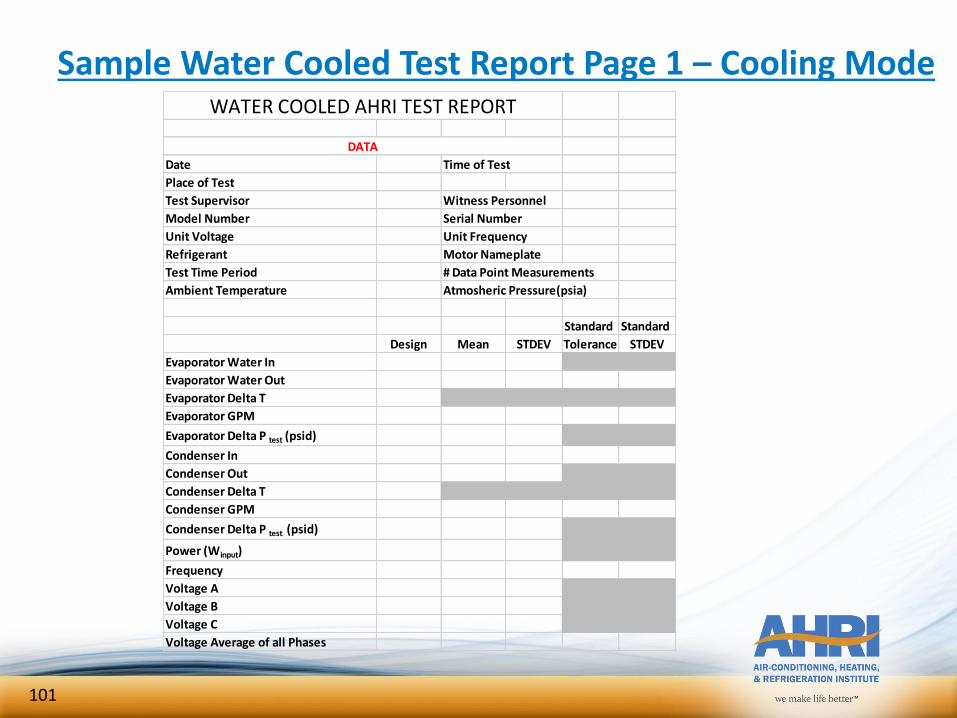
Sample Water Cooled Test Report Page 1 – Cooling Mode
Date Time of Test
Place of Test
Test Supervisor Witness Personnel
Model Number Serial Number
Unit Voltage Unit Frequency
Refrigerant Motor Nameplate
Test Time Period # Data Point Measurements
Ambient Temperature Atmosheric Pressure(psia)
Standard Standard
Design Mean STDEV Tolerance STDEV
Evaporator Water In
Evaporator Water Out
Evaporator Delta T
Evaporator GPM
Evaporator Delta P test (psid)
Condenser In
Condenser Out
Condenser Delta T
Condenser GPM
Condenser Delta P test (psid)
Power (Winput)
Frequency
Voltage A
Voltage B
Voltage C
Voltage Average of all Phases
DATA
WATER COOLED AHRI TEST REPORT
101
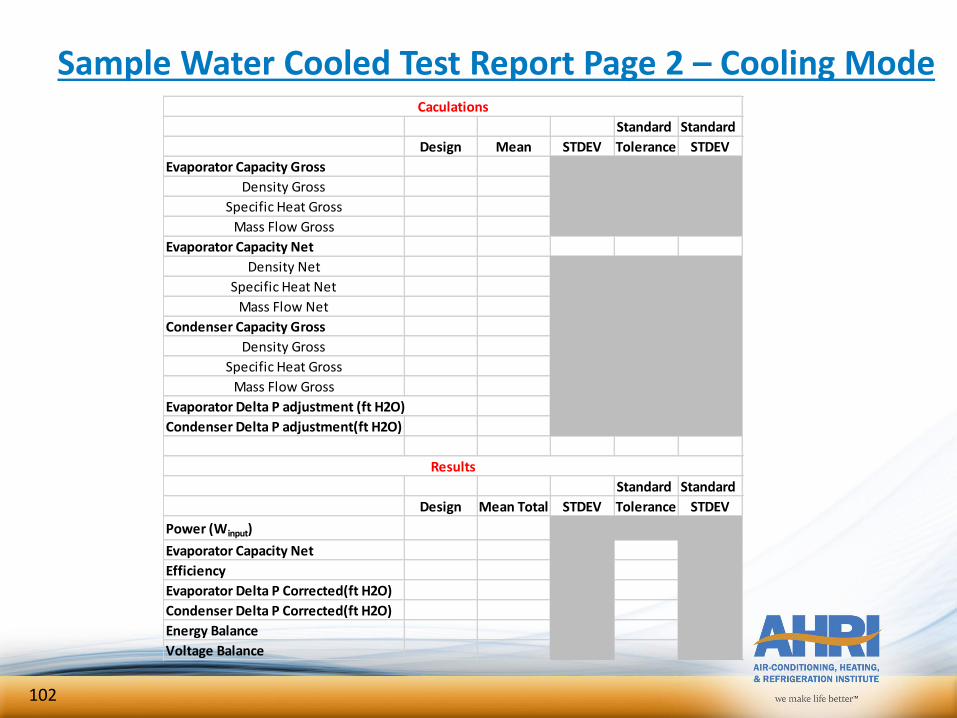
Sample Water Cooled Test Report Page 2 – Cooling Mode
Standard Standard
Design Mean STDEV Tolerance STDEV
Evaporator Capacity Gross
Density Gross
Specific Heat Gross
Mass Flow Gross
Evaporator Capacity Net
Density Net
Specific Heat Net
Mass Flow Net
Condenser Capacity Gross
Density Gross
Specific Heat Gross
Mass Flow Gross
Evaporator Delta P adjustment (ft H2O)
Condenser Delta P adjustment(ft H2O)
Standard Standard
Design Mean Total STDEV Tolerance STDEV
Power (Winput)
Evaporator Capacity Net
Efficiency
Evaporator Delta P Corrected(ft H2O)
Condenser Delta P Corrected(ft H2O)
Energy Balance
Voltage Balance
Results
Caculations
102
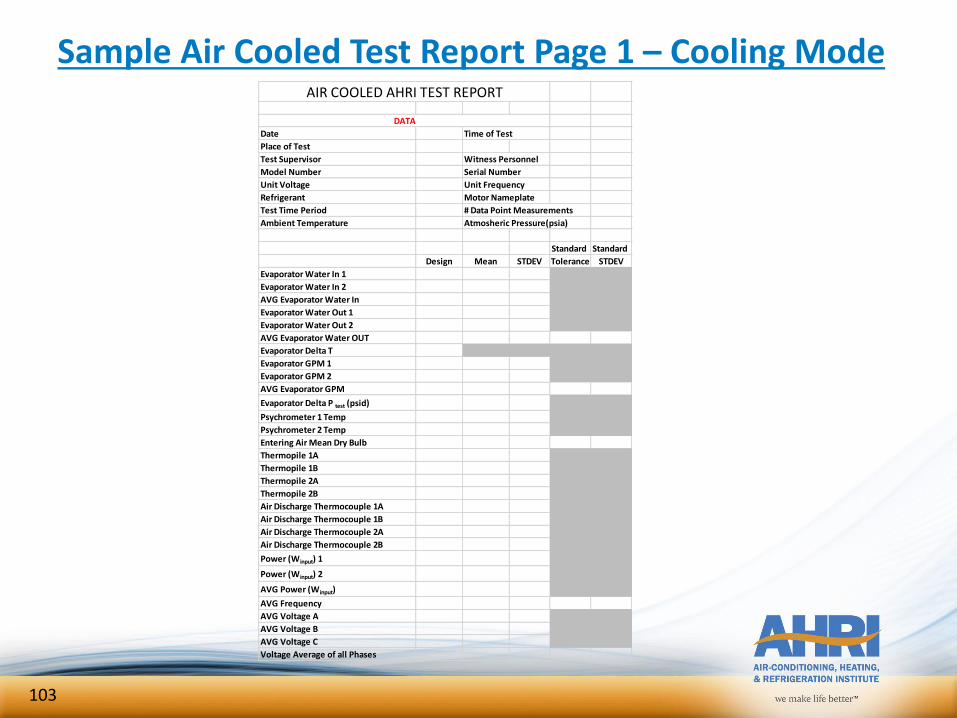
Sample Air Cooled Test Report Page 1 – Cooling Mode
Date Time of Test
Place of Test
Test Supervisor Witness Personnel
Model Number Serial Number
Unit Voltage Unit Frequency
Refrigerant Motor Nameplate
Test Time Period # Data Point Measurements
Ambient Temperature Atmosheric Pressure(psia)
Standard Standard
Design Mean STDEV Tolerance STDEV
Evaporator Water In 1
Evaporator Water In 2
AVG Evaporator Water In
Evaporator Water Out 1
Evaporator Water Out 2
AVG Evaporator Water OUT
Evaporator Delta T
Evaporator GPM 1
Evaporator GPM 2
AVG Evaporator GPM
Evaporator Delta P test (psid)
Psychrometer 1 Temp
Psychrometer 2 Temp
Entering Air Mean Dry Bulb
Thermopile 1A
Thermopile 1B
Thermopile 2A
Thermopile 2B
Air Discharge Thermocouple 1A
Air Discharge Thermocouple 1B
Air Discharge Thermocouple 2A
Air Discharge Thermocouple 2B
Power (Winput) 1
Power (Winput) 2
AVG Power (Winput)
AVG Frequency
AVG Voltage A
AVG Voltage B
AVG Voltage C
Voltage Average of all Phases
AIR COOLED AHRI TEST REPORT
DATA
103
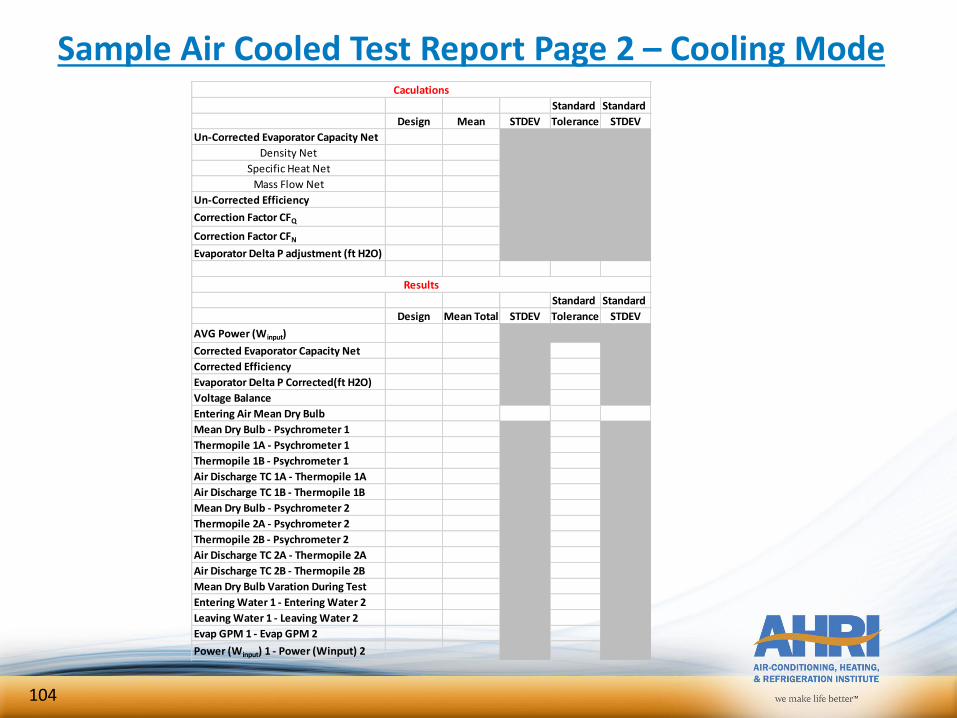
Sample Air Cooled Test Report Page 2 – Cooling Mode
Standard Standard
Design Mean STDEV Tolerance STDEV
Un-Corrected Evaporator Capacity Net
Density Net
Specific Heat Net
Mass Flow Net
Un-Corrected Efficiency
Correction Factor CFQ
Correction Factor CFN
Evaporator Delta P adjustment (ft H2O)
Standard Standard
Design Mean Total STDEV Tolerance STDEV
AVG Power (Winput)
Corrected Evaporator Capacity Net
Corrected Efficiency
Evaporator Delta P Corrected(ft H2O)
Voltage Balance
Entering Air Mean Dry Bulb
Mean Dry Bulb - Psychrometer 1
Thermopile 1A - Psychrometer 1
Thermopile 1B - Psychrometer 1
Air Discharge TC 1A - Thermopile 1A
Air Discharge TC 1B - Thermopile 1B
Mean Dry Bulb - Psychrometer 2
Thermopile 2A - Psychrometer 2
Thermopile 2B - Psychrometer 2
Air Discharge TC 2A - Thermopile 2A
Air Discharge TC 2B - Thermopile 2B
Mean Dry Bulb Varation During Test
Entering Water 1 - Entering Water 2
Leaving Water 1 - Leaving Water 2
Evap GPM 1 - Evap GPM 2
Power (Winput) 1 - Power (Winput) 2
Caculations
Results
104
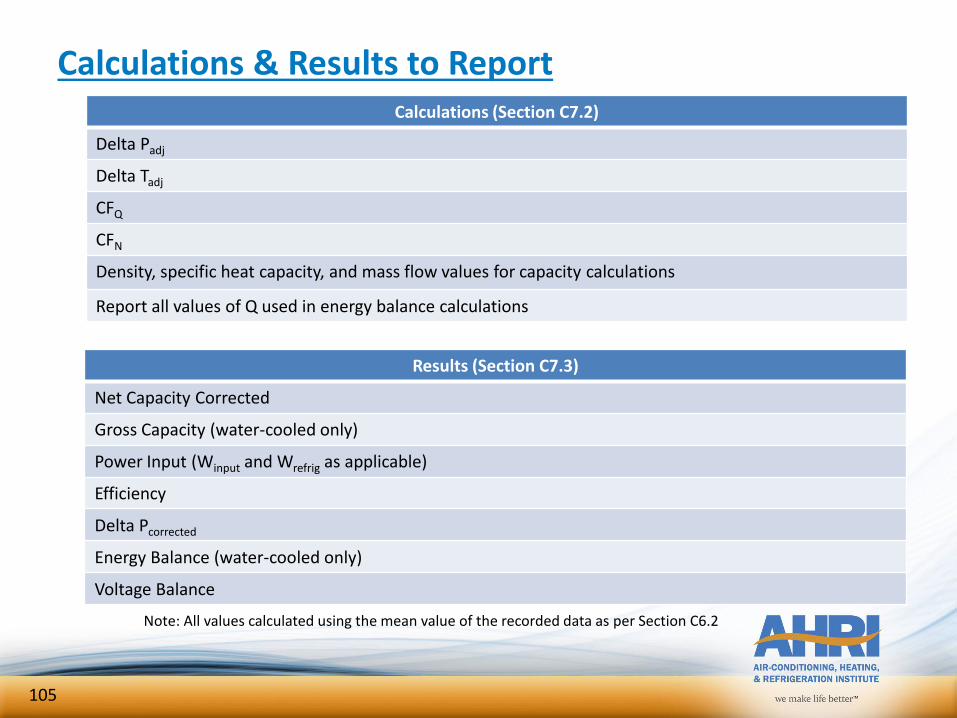
Calculations & Results to ReportCalculations (Section C7.2)
Delta Padj
Delta Tadj
CFQ
CFN
Density, specific heat capacity, and mass flow values for capacity calculations
Report all values of Q used in energy balance calculations
Results (Section C7.3)
Net Capacity Corrected
Gross Capacity (water-cooled only)
Power Input (Winput and Wrefrig as applicable)
Efficiency
Delta Pcorrected
Energy Balance (water-cooled only)
Voltage Balance
Note: All values calculated using the mean value of the recorded data as per Section C6.2
105
APPENDIX D, Derivation of Integrated Part-Load Value (IPLV)
106
Appendix D
Appendix D contains details on the derivation of the IPLV as defined by equation 8 and 9 including the weighting factors and ambient rebalance temperatures
A single chiller’s design rating condition as defined in table 1 represents the performance at the simultaneous occurrence of both full-load and design ambient conditions which typically are the ASHRAE 1% weather conditions. The design efficiency contains no information representative of the chiller’s operating efficiency at any off-design condition (part-load, reduced ambient).
The IPLV metric was developed to create a numerical rating of a single chiller as simulated by 4 distinct operating conditions, established by taking into account blended climate data to incorporate various load and ambient operating conditions.
The intent was to create a metric of part-load/reduced ambient efficiency that, in addition to the design rating, can provide a useful means for regulatory bodies to specify minimum chiller efficiency levels and for Engineering firms to compare chillers of like technology.
The IPLV value is not intended to be used to predict the annualized energy consumption of a chiller in any specific application or operating conditions.
IPLV was intended to be a standard overall rating metric with a weighted full and part load component. NPLV was created to allow for centrifugal chillers to include a PLV metric for chillers that can not operate at full load standard rating conditions, but it has been expanded to cover all water cooled products. Currently it is not a valid metric for air cooled products
107
Appendix D
There are many issues to consider when estimating the efficiency of chillers in actual use. Neither IPLV nor design rating metrics on their own can predict a building’s energy use.
Additionally, chiller efficiency is only a single component of many which contribute to the total energy consumption of a chiller plant.
In addition chillers are typically used in multiple configurations and are part of an overall chilled water HVAC system.
It is for these reasons that AHRI recommends the use of building energy analysis programs, compliant with ASHRAE Standard 140, that are capable of modeling not only the building construction and weather data but also reflect how the building and chiller plant operate.
In this way the building designer and operator will better understand the contributions that the chiller and other chiller plant components make to the total chiller plant energy use.
Modeling software can also be a useful tool for evaluating different operating sequences for the purpose of obtaining the lowest possible energy usage of the entire chiller plant. To use these tools, a complete operating model of the chiller, over the intended load and operating conditions, should be used.
In summary, it is best to use a comprehensive analysis that reflects the actual weather data, building load characteristics, operational hours, economizer capabilities and energy drawn by auxiliaries such as pumps and cooling towers, when calculating the chiller and system efficiency.
The intended use of the IPLV (NPLV) rating is to compare the performance of similar technologies, enabling a side-by-side relative comparison, and to provide a second certifiable rating point that can be referenced by energy codes.
A single metric, such as design efficiency or IPLV shall not be used to quantify energy savings.
108
APPENDIX E. Chiller Condenser Entering Air Temperature Measurement
109
Changes To Appendix E for 2015 Version
Table E2 verbiage changed to clarify the use of “average “ values for tolerance specification (location vs. time).
Figure E1 revised to show more detail for construction of air sampling tree.
Thermopiles or individual thermocouples averaged may be used with the air sampling trees.
For part load test points, “Aspirating Psychrometers” positioned at non operating portions of the coil on the test chiller may be excluded from the calculations.
110
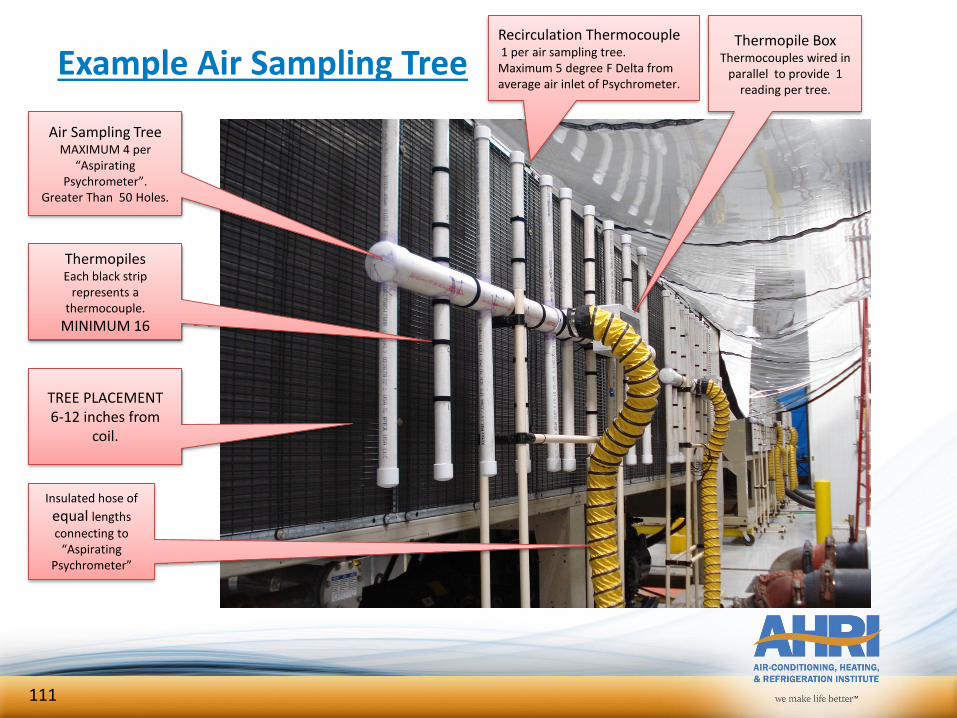
Example Air Sampling TreeRecirculation Thermocouple1 per air sampling tree.
Maximum 5 degree F Delta from average air inlet of Psychrometer.
Air Sampling TreeMAXIMUM 4 per
“Aspirating Psychrometer”.
Greater Than 50 Holes.
ThermopilesEach black strip
represents a thermocouple.
MINIMUM 16
Thermopile BoxThermocouples wired in
parallel to provide 1 reading per tree.
Insulated hose of
equal lengths
connecting to “Aspirating
Psychrometer”
TREE PLACEMENT6-12 inches from
coil.
111
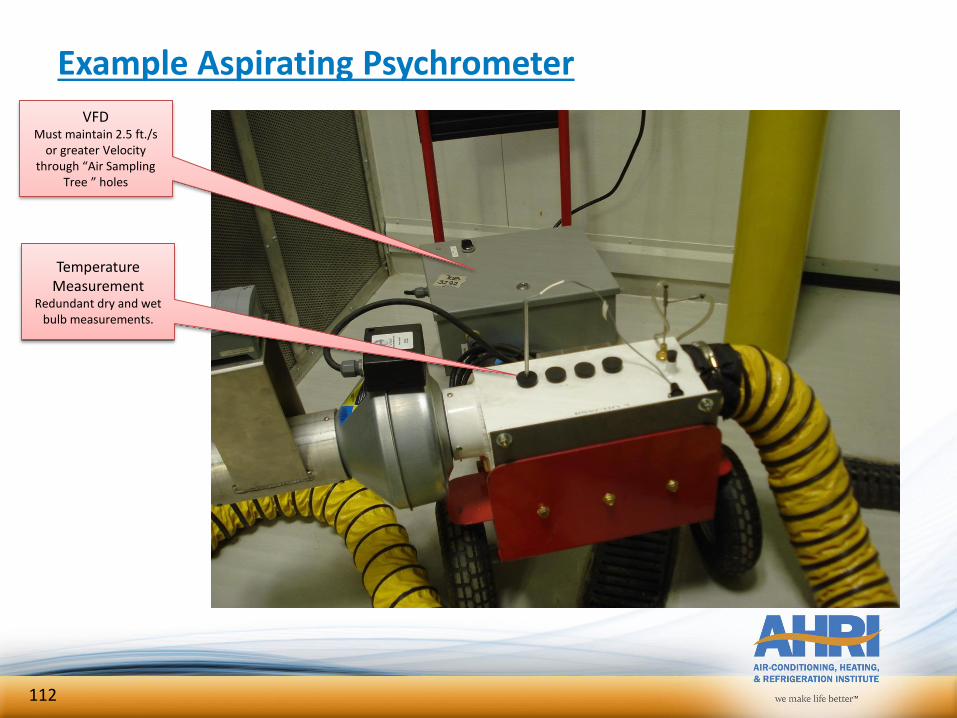
Example Aspirating Psychrometer
VFDMust maintain 2.5 ft./s
or greater Velocity through “Air Sampling
Tree ” holes
Temperature Measurement
Redundant dry and wet bulb measurements.
112
Additional Information
Mixing fans can be used to ensure adequate air distribution in test room – Rule: Must not point at coil air inlet. Fan exhaust must be 90-
270 degrees to that of the air inlet of coil.
Air Sampling Trees– Aspect ratio no greater than 2 to 1
– 1 main flow trunk
– 10-20 branch connections
– Greater than 50 holes
– Minimum of 16 temperature measurement locations per tree
– Tree location 6-12 inches from unit
– Test Setup See figures E3 and E4, Section E6
113
Additional Information
Aspirating Psychrometers
– Fans for Psychrometer can be manual or automatic
– Maximum of 4 air sampling trees per psychrometer
– Redundant measurement wells for dry and/or wet bulb measurement
114
Appendix F, Atmospheric Pressure Adjustment
115
Appendix F, Atmospheric Pressure Adjustment
Purpose
To prescribe a method of adjusting measured test data according to local atmospheric conditions.
Background
To ensure performance can be uniformly compared from one unit and one manufacturer to another, performance testing for air-cooled and evaporatively-cooled chillers should be corrected for air-density variations.
116
Appendix F, Atmospheric Pressure Adjustment
Correction factors based on pressure and not altitude to include effects of weather variations.
Part load correction factors are scaled between 1 and the full load correction based on percentage of full load capacity.
2015 Standard adds method to adjust test data to application conditions.
Correction factor limit changed from 12.23 psia (approx. 5,000 ft) in 2011 Standard to 11.56 psia (approx. 6,500 ft) in 2015 Standard
117
Appendix F, Atmospheric Pressure AdjustmentEquations
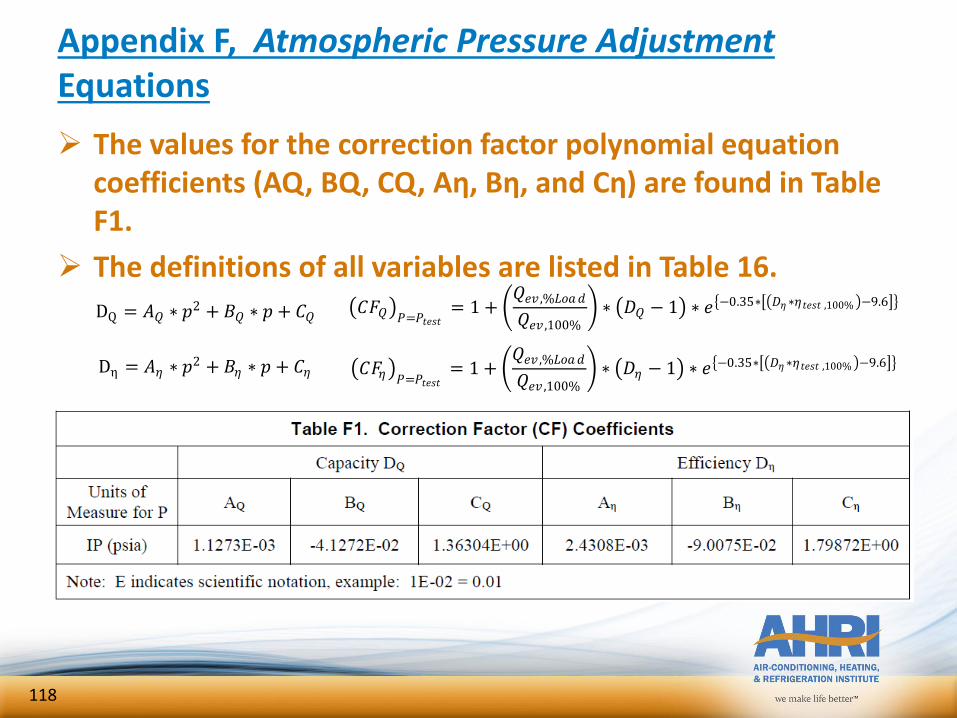
The values for the correction factor polynomial equation coefficients (AQ, BQ, CQ, Aƞ, Bƞ, and Cƞ) are found in Table F1.
The definitions of all variables are listed in Table 16.
DQ = 𝐴𝑄 ∗ 𝑝2 + 𝐵𝑄 ∗ 𝑝+ 𝐶𝑄
Dη = 𝐴𝜂 ∗ 𝑝2 + 𝐵𝜂 ∗ 𝑝 + 𝐶𝜂
𝐶𝐹𝑄 𝑃=𝑃𝑡𝑒 𝑡= 1 +
𝑄𝑒𝑣 ,%𝐿𝑜𝑎𝑑
𝑄𝑒𝑣 ,100% ∗ 𝐷𝑄 − 1 ∗ 𝑒
−0.35∗ 𝐷𝜂 ∗𝜂𝑡𝑒 𝑡 ,100% −9.6
𝐶𝐹𝜂 𝑃=𝑃𝑡𝑒 𝑡= 1 +
𝑄𝑒𝑣 ,%𝐿𝑜𝑎𝑑
𝑄𝑒𝑣 ,100% ∗ 𝐷𝜂 − 1 ∗ 𝑒
−0.35∗ 𝐷𝜂 ∗𝜂𝑡𝑒 𝑡 ,100% −9.6
118
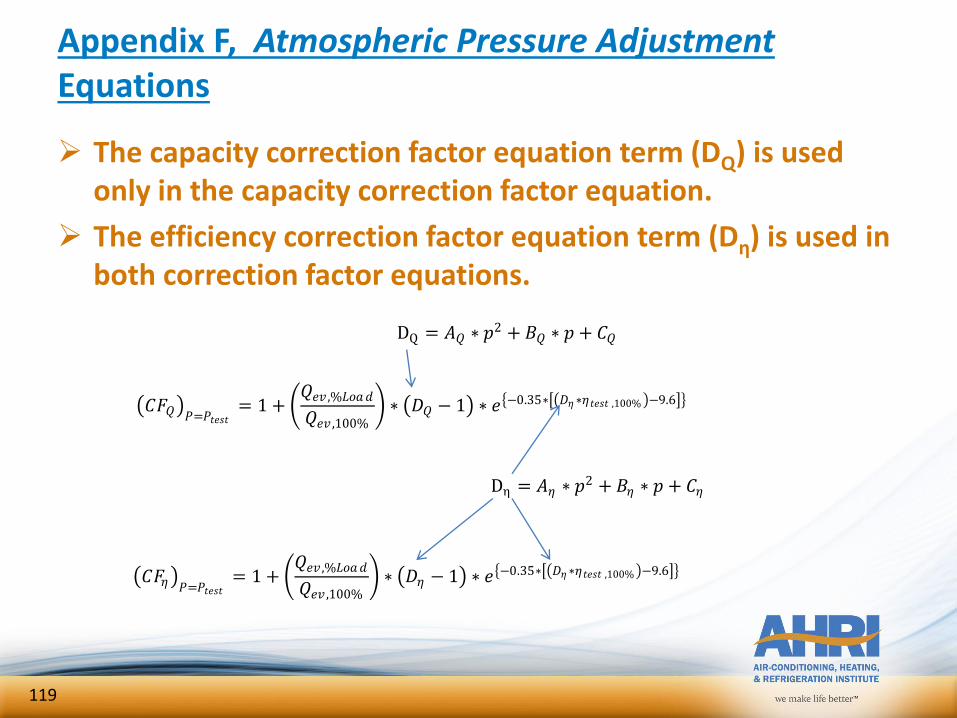
The capacity correction factor equation term (DQ) is used only in the capacity correction factor equation.
The efficiency correction factor equation term (Dƞ) is used in both correction factor equations.
Appendix F, Atmospheric Pressure AdjustmentEquations
𝐶𝐹𝑄 𝑃=𝑃𝑡𝑒 𝑡= 1 +
𝑄𝑒𝑣 ,%𝐿𝑜𝑎𝑑
𝑄𝑒𝑣 ,100% ∗ 𝐷𝑄 − 1 ∗ 𝑒
−0.35∗ 𝐷𝜂 ∗𝜂𝑡𝑒 𝑡 ,100% −9.6
DQ = 𝐴𝑄 ∗ 𝑝2 + 𝐵𝑄 ∗ 𝑝+ 𝐶𝑄
Dη = 𝐴𝜂 ∗ 𝑝2 + 𝐵𝜂 ∗ 𝑝 + 𝐶𝜂
𝐶𝐹𝜂 𝑃=𝑃𝑡𝑒 𝑡= 1 +
𝑄𝑒𝑣 ,%𝐿𝑜𝑎𝑑
𝑄𝑒𝑣 ,100% ∗ 𝐷𝜂 − 1 ∗ 𝑒
−0.35∗ 𝐷𝜂 ∗𝜂𝑡𝑒 𝑡 ,100% −9.6
119
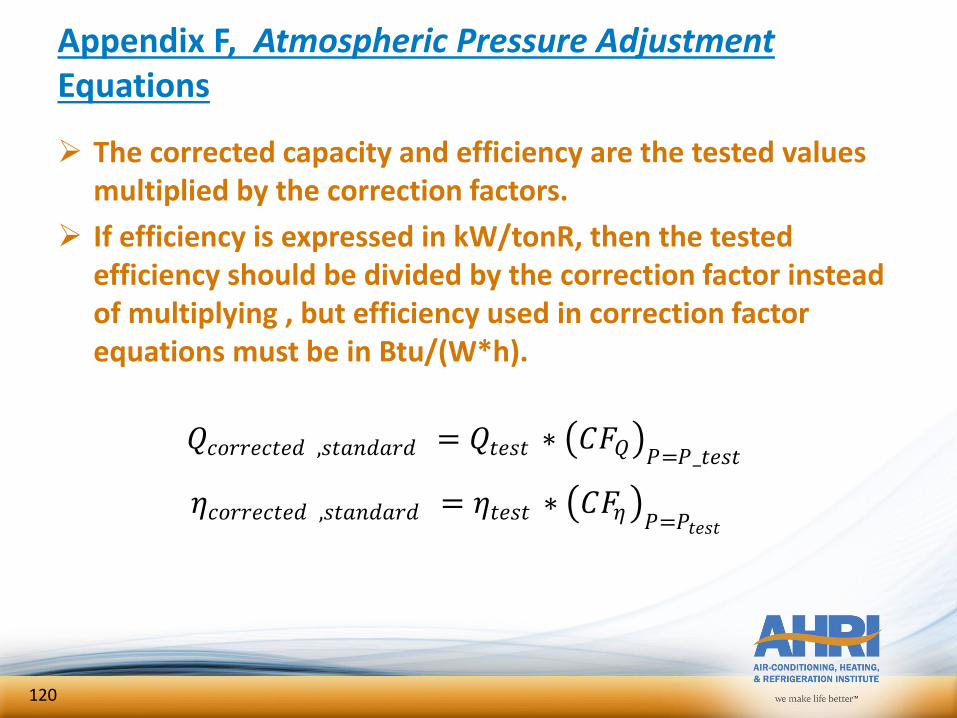
The corrected capacity and efficiency are the tested values multiplied by the correction factors.
If efficiency is expressed in kW/tonR, then the tested efficiency should be divided by the correction factor instead of multiplying , but efficiency used in correction factor equations must be in Btu/(W*h).
Appendix F, Atmospheric Pressure AdjustmentEquations
𝑄𝑐𝑜𝑟𝑟𝑒𝑐𝑡𝑒𝑑 , 𝑡𝑎𝑛𝑑𝑎𝑟𝑑 = 𝑄𝑡𝑒 𝑡 ∗ 𝐶𝐹𝑄 𝑃=𝑃_𝑡𝑒 𝑡
𝜂𝑐𝑜𝑟𝑟𝑒𝑐𝑡𝑒𝑑 , 𝑡𝑎𝑛𝑑𝑎𝑟𝑑 = 𝜂𝑡𝑒 𝑡 ∗ 𝐶𝐹𝜂 𝑃=𝑃𝑡𝑒 𝑡
120
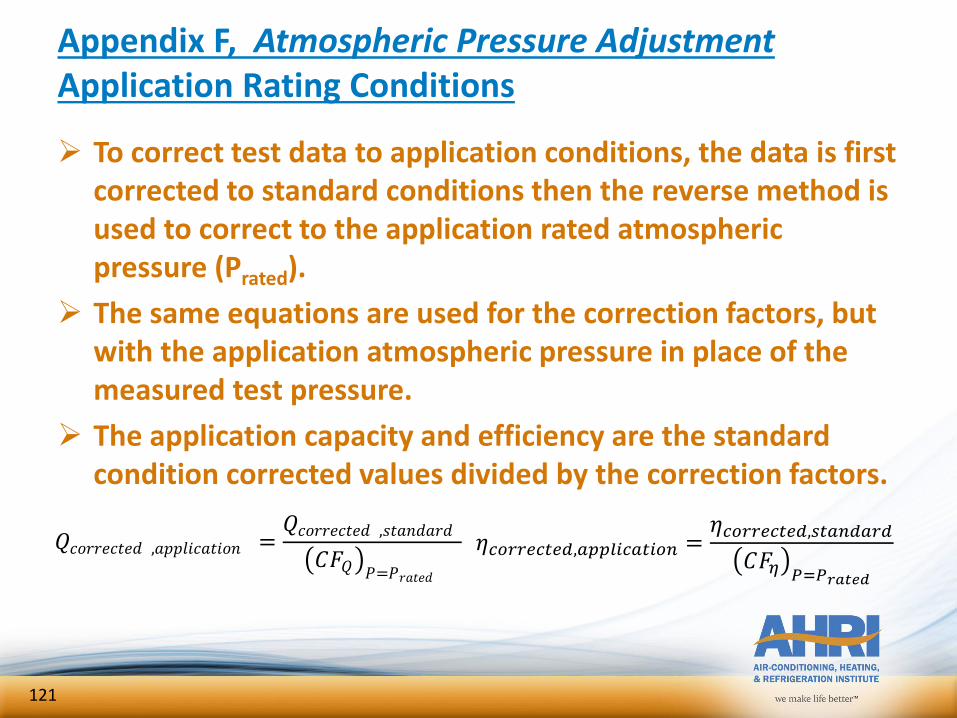
To correct test data to application conditions, the data is first corrected to standard conditions then the reverse method is used to correct to the application rated atmospheric pressure (Prated).
The same equations are used for the correction factors, but with the application atmospheric pressure in place of the measured test pressure.
The application capacity and efficiency are the standard condition corrected values divided by the correction factors.
Appendix F, Atmospheric Pressure AdjustmentApplication Rating Conditions
𝑄𝑐𝑜𝑟𝑟𝑒𝑐𝑡𝑒𝑑 ,𝑎𝑝𝑝𝑙𝑖𝑐𝑎𝑡𝑖𝑜𝑛 =𝑄𝑐𝑜𝑟𝑟𝑒𝑐𝑡𝑒𝑑 , 𝑡𝑎𝑛𝑑𝑎𝑟𝑑
𝐶𝐹𝑄 𝑃=𝑃𝑟𝑎𝑡𝑒𝑑
𝜂𝑐𝑜𝑟𝑟𝑒𝑐𝑡𝑒𝑑,𝑎𝑝𝑝𝑙𝑖𝑐𝑎𝑡𝑖𝑜𝑛 =𝜂𝑐𝑜𝑟𝑟𝑒𝑐𝑡𝑒𝑑,𝑠𝑡𝑎𝑛𝑑𝑎𝑟𝑑
𝐶𝐹𝜂 𝑃=𝑃𝑟𝑎𝑡𝑒𝑑
121
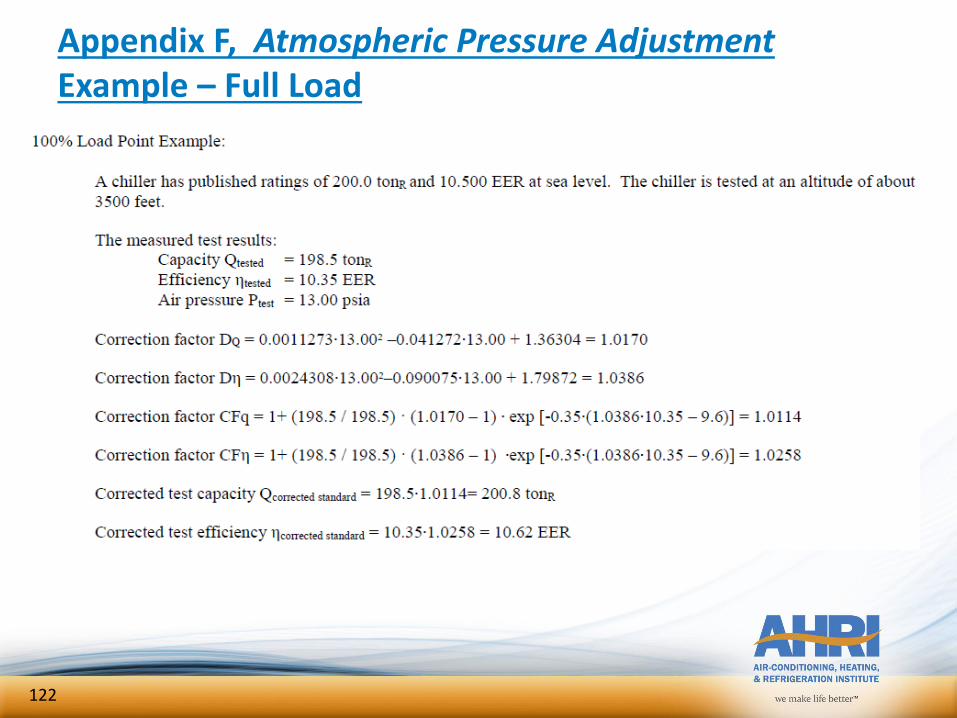
Appendix F, Atmospheric Pressure AdjustmentExample – Full Load
122
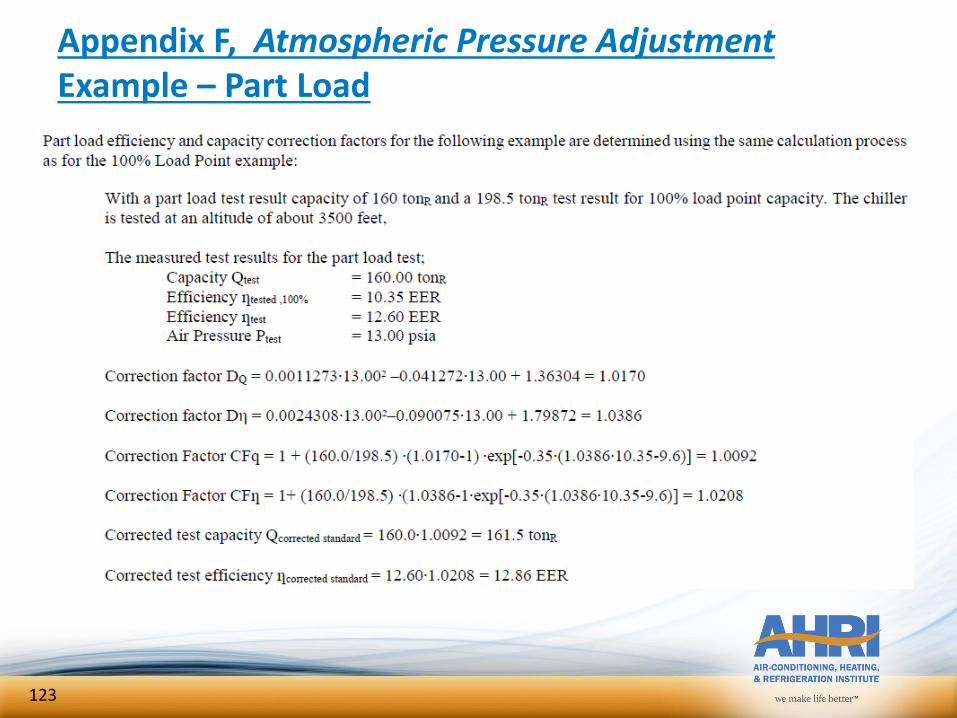
Appendix F, Atmospheric Pressure AdjustmentExample – Part Load
123
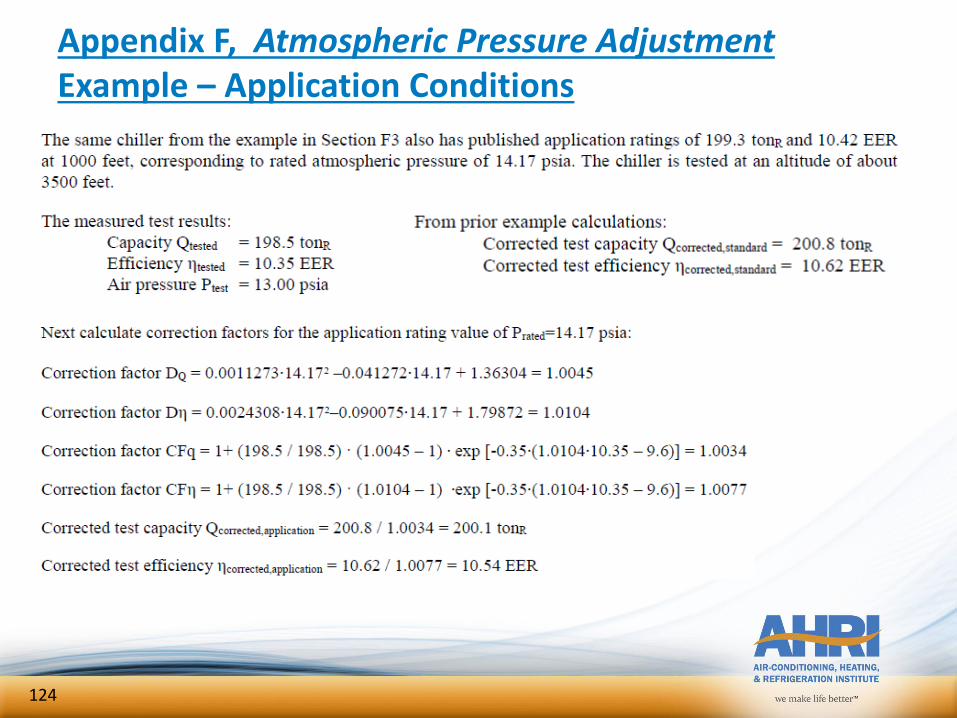
Appendix F, Atmospheric Pressure AdjustmentExample – Application Conditions
124
Appendix G, Water Pressure Drop Measurement Procedure
125
APPENDIX G, WATER PRESSURE DROP MEASUREMENT PROCEDURE – NORMATIVE
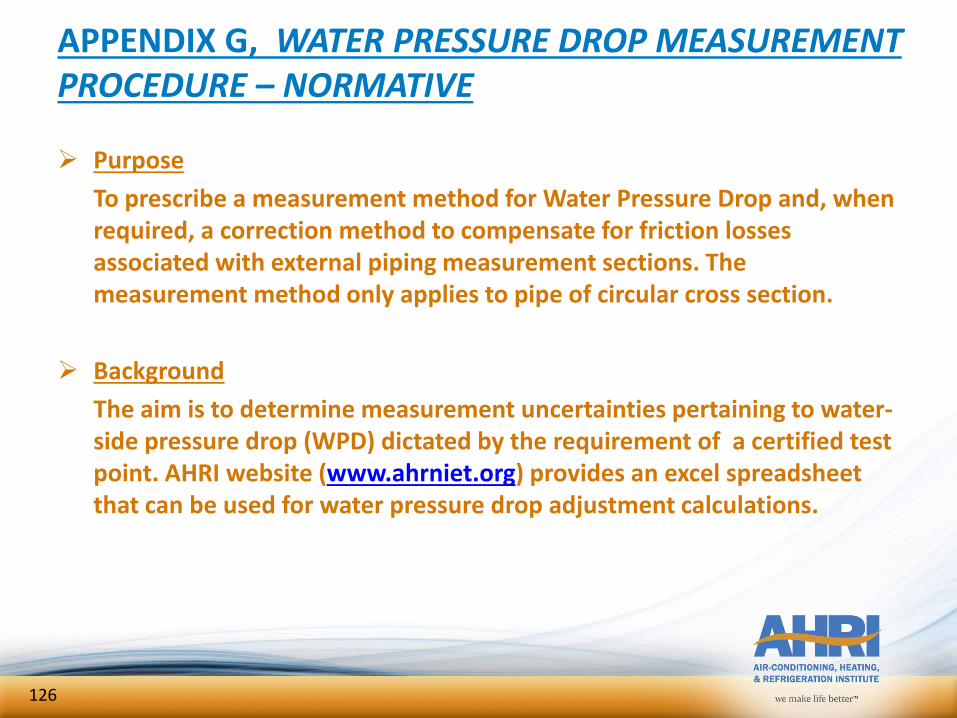
Purpose
To prescribe a measurement method for Water Pressure Drop and, when required, a correction method to compensate for friction losses associated with external piping measurement sections. The measurement method only applies to pipe of circular cross section.
Background
The aim is to determine measurement uncertainties pertaining to water-side pressure drop (WPD) dictated by the requirement of a certified test point. AHRI website (www.ahrniet.org) provides an excel spreadsheet that can be used for water pressure drop adjustment calculations.
126
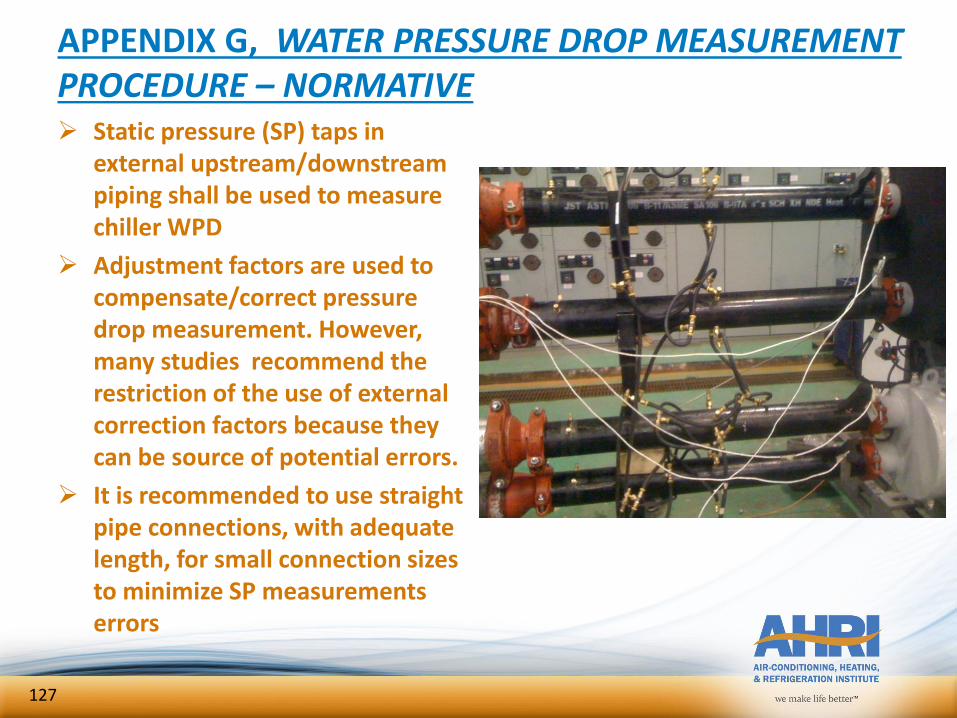
APPENDIX G, WATER PRESSURE DROP MEASUREMENT PROCEDURE – NORMATIVE Static pressure (SP) taps in
external upstream/downstream piping shall be used to measure chiller WPD
Adjustment factors are used to compensate/correct pressure drop measurement. However, many studies recommend the restriction of the use of external correction factors because they can be source of potential errors.
It is recommended to use straight pipe connections, with adequate length, for small connection sizes to minimize SP measurements errors
127
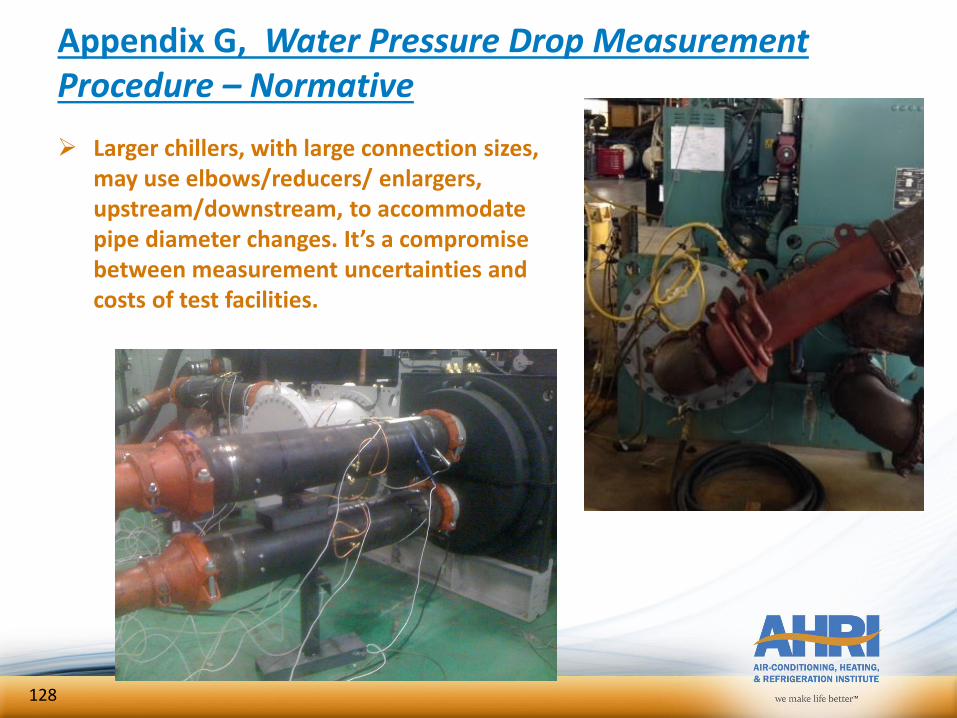
Appendix G, Water Pressure Drop Measurement Procedure – Normative
Larger chillers, with large connection sizes, may use elbows/reducers/ enlargers, upstream/downstream, to accommodate pipe diameter changes. It’s a compromise between measurement uncertainties and costs of test facilities.
128
Appendix G, Water Pressure Drop Measurement Procedure – Normative
129
Appendix G, Water Pressure Drop Measurement Procedure – Normative
130
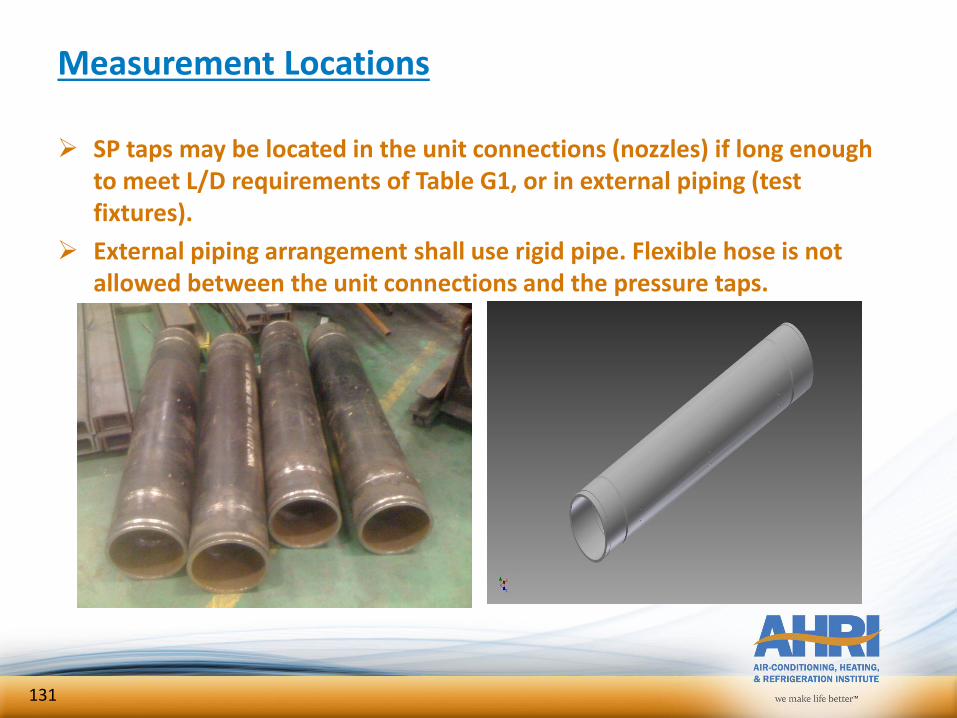
Measurement Locations
SP taps may be located in the unit connections (nozzles) if long enough to meet L/D requirements of Table G1, or in external piping (test fixtures).
External piping arrangement shall use rigid pipe. Flexible hose is not allowed between the unit connections and the pressure taps.
131
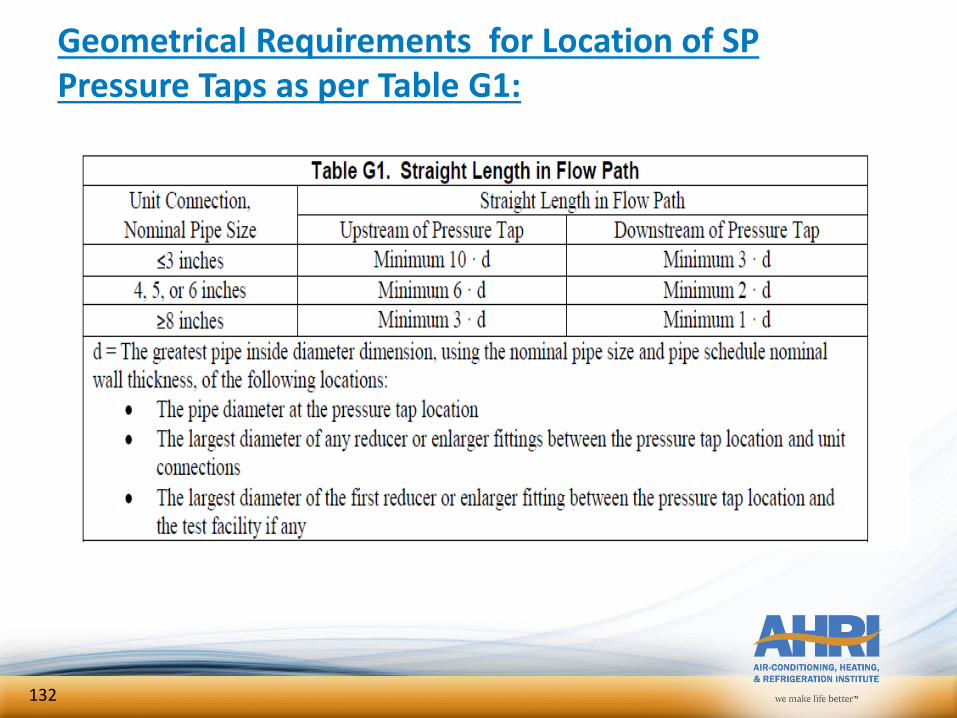
Geometrical Requirements for Location of SPPressure Taps as per Table G1:
132
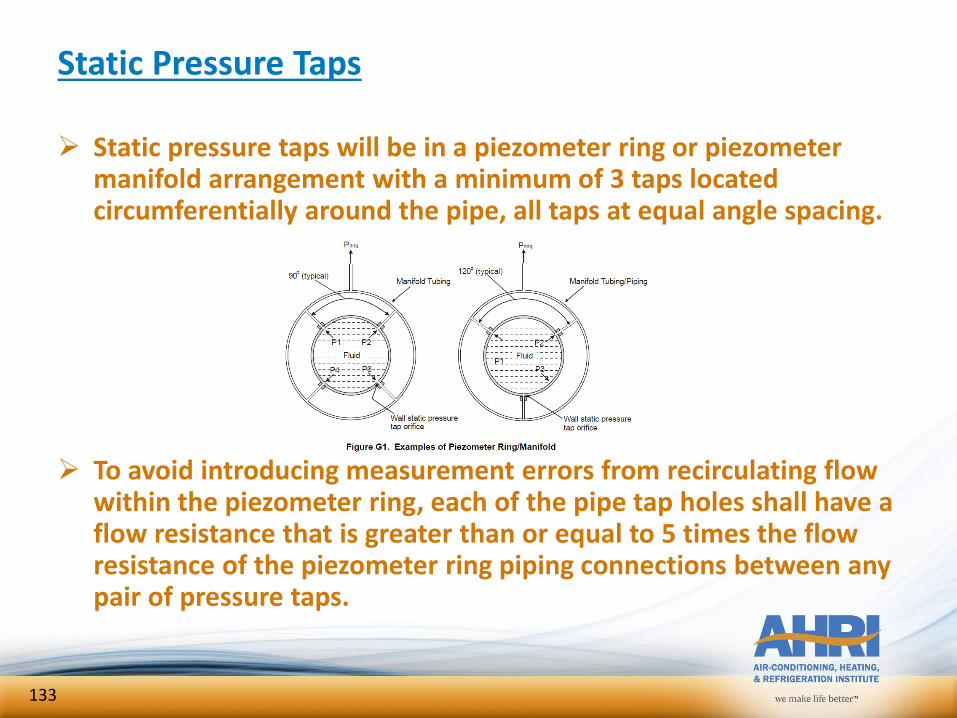
Static Pressure Taps
Static pressure taps will be in a piezometer ring or piezometer manifold arrangement with a minimum of 3 taps located circumferentially around the pipe, all taps at equal angle spacing.
To avoid introducing measurement errors from recirculating flow within the piezometer ring, each of the pipe tap holes shall have a flow resistance that is greater than or equal to 5 times the flow resistance of the piezometer ring piping connections between any pair of pressure taps.
133
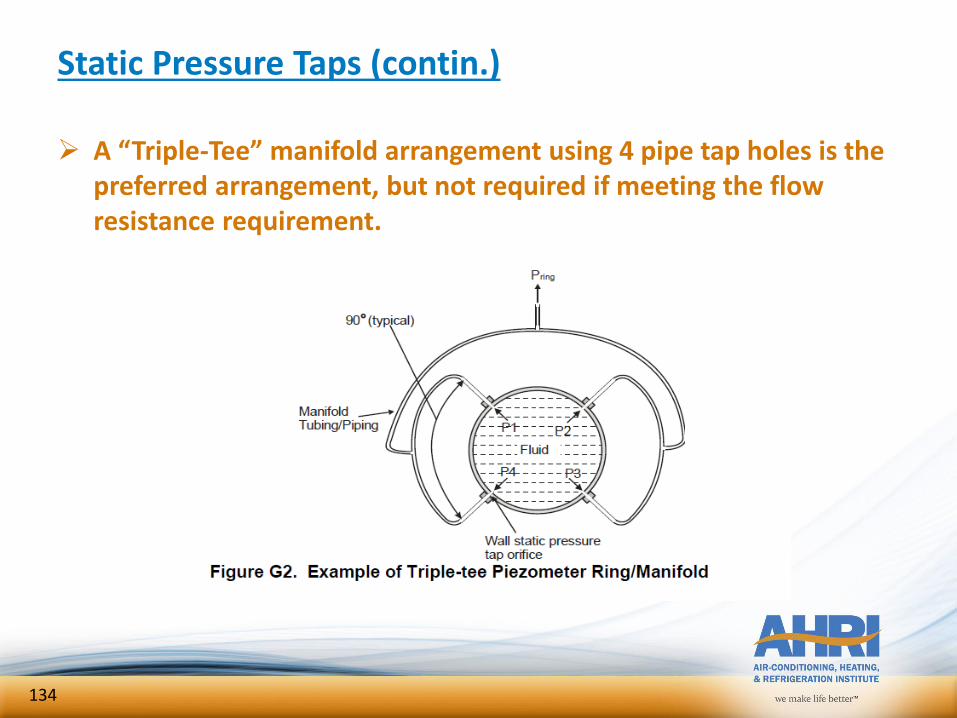
Static Pressure Taps (contin.)
A “Triple-Tee” manifold arrangement using 4 pipe tap holes is the preferred arrangement, but not required if meeting the flow resistance requirement.
134
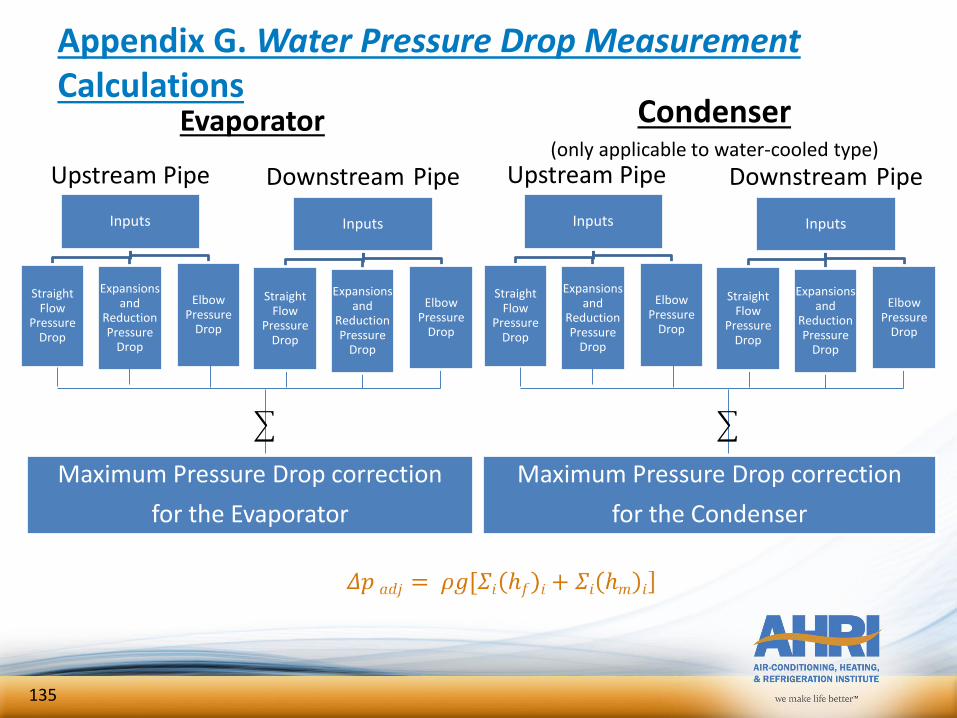
Upstream Pipe
Inputs
Straight Flow
Pressure Drop
Expansions and
Reduction Pressure
Drop
Elbow Pressure
Drop
Downstream Pipe
Maximum Pressure Drop correction
for the Evaporator
Evaporator
Inputs
Straight Flow
Pressure Drop
Expansions and
Reduction Pressure
Drop
Elbow Pressure
Drop
Inputs
Straight Flow
Pressure Drop
Expansions and
Reduction Pressure
Drop
Elbow Pressure
Drop
Downstream Pipe
Maximum Pressure Drop correction
for the Condenser
Inputs
Straight Flow
Pressure Drop
Expansions and
Reduction Pressure
Drop
Elbow Pressure
Drop
Upstream Pipe
Appendix G. Water Pressure Drop Measurement Calculations
Condenser(only applicable to water-cooled type)
135
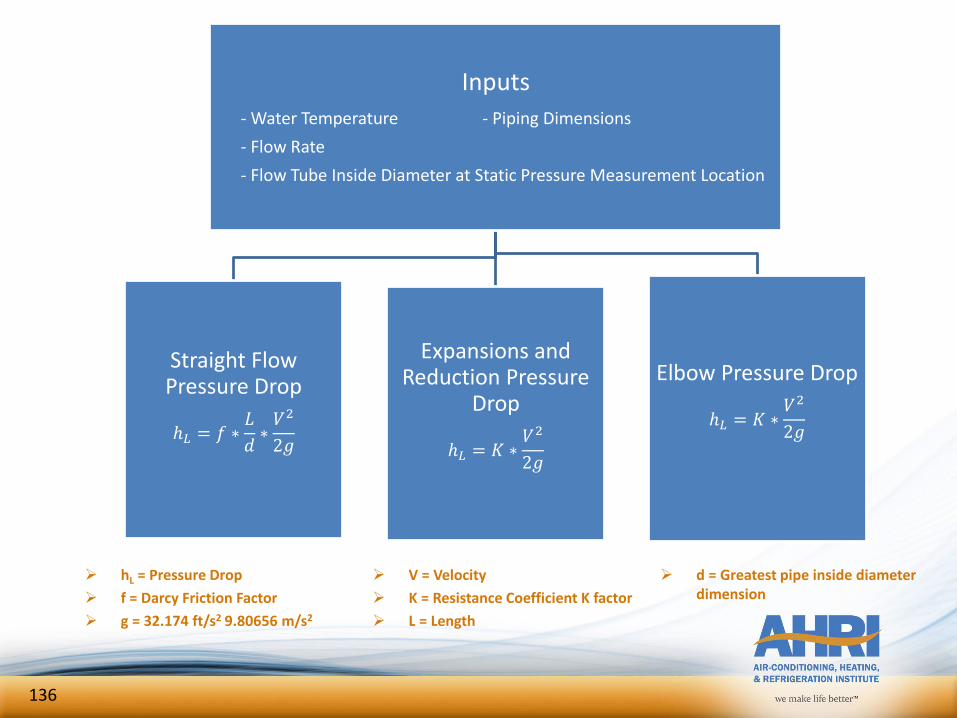
hL = Pressure Drop
f = Darcy Friction Factor
g = 32.174 ft/s2 9.80656 m/s2
V = Velocity
K = Resistance Coefficient K factor
L = Length
d = Greatest pipe inside diameter dimension
Inputs
- Water Temperature - Piping Dimensions
- Flow Rate
- Flow Tube Inside Diameter at Static Pressure Measurement Location
Straight Flow Pressure Drop
ℎ𝐿 = 𝑓 ∗𝐿
𝑑∗𝑉2
2𝑔
Expansions and Reduction Pressure
Drop
ℎ𝐿 = 𝐾 ∗𝑉2
2𝑔
Elbow Pressure Drop
ℎ𝐿 = 𝐾 ∗𝑉2
2𝑔
136
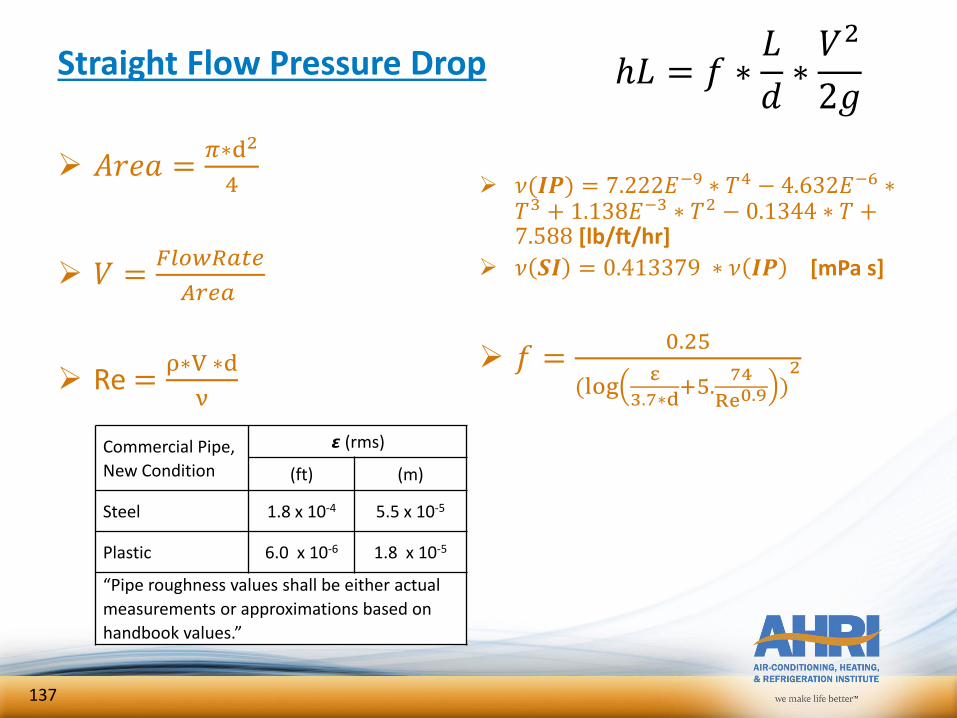
Straight Flow Pressure Drop
𝐴𝑟𝑒𝑎 =𝜋∗d2
4
𝑉 =𝐹𝑙𝑜𝑤𝑅𝑎𝑡𝑒
𝐴𝑟𝑒𝑎
Re =ρ∗V ∗d
ν
𝜈(𝑰𝑷) = 7.222𝐸−9 ∗ 𝑇4 − 4.632𝐸−6 ∗𝑇3 + 1.138𝐸−3 ∗ 𝑇2 − 0.1344 ∗ 𝑇 +7.588 [lb/ft/hr]
𝜈 𝑺𝑰 = 0.413379 ∗ 𝜈 𝑰𝑷 [mPa s]
𝑓 =0.25
(logε
3.7∗d+5.
74
Re0.9)2
ℎ𝐿 = 𝑓 ∗𝐿
𝑑∗𝑉2
2𝑔
Commercial Pipe,
New Condition
𝞮 (rms)
(ft) (m)
Steel 1.8 x 10⁻⁴ 5.5 x 10⁻⁵
Plastic 6.0 x 10⁻⁶ 1.8 x 10⁻⁵
“Pipe roughness values shall be either actual
measurements or approximations based on
handbook values.”
137
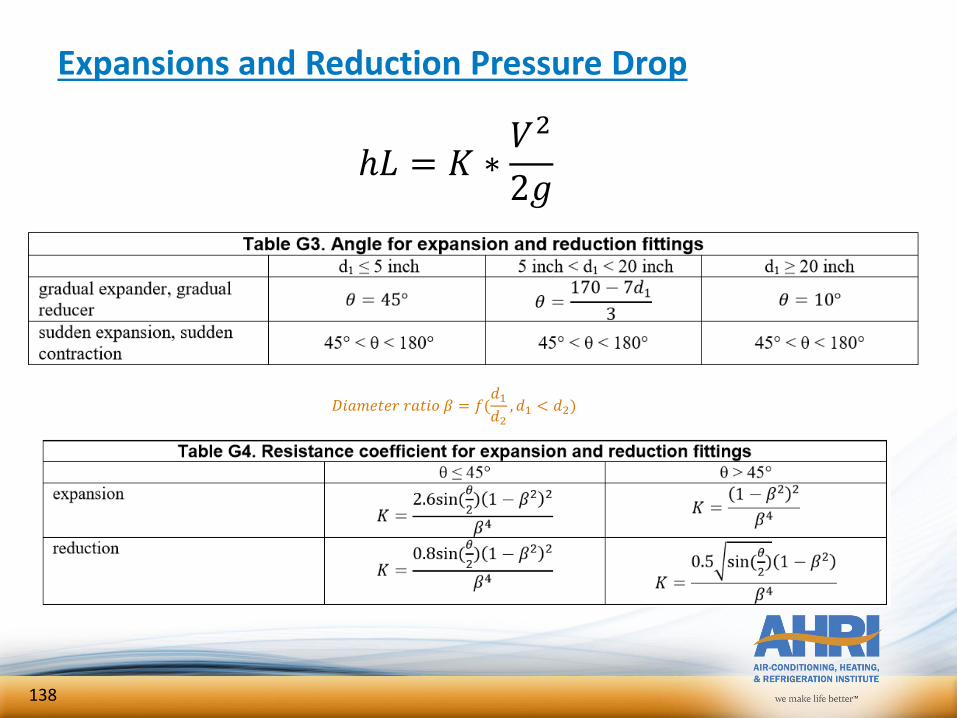
Expansions and Reduction Pressure Drop
ℎ𝐿 = 𝐾 ∗𝑉2
2𝑔
𝐷𝑖𝑎𝑚𝑒𝑡𝑒𝑟 𝑟𝑎𝑡𝑖𝑜 𝛽 = 𝑓(𝑑1𝑑2
, 𝑑1 < 𝑑2)
138
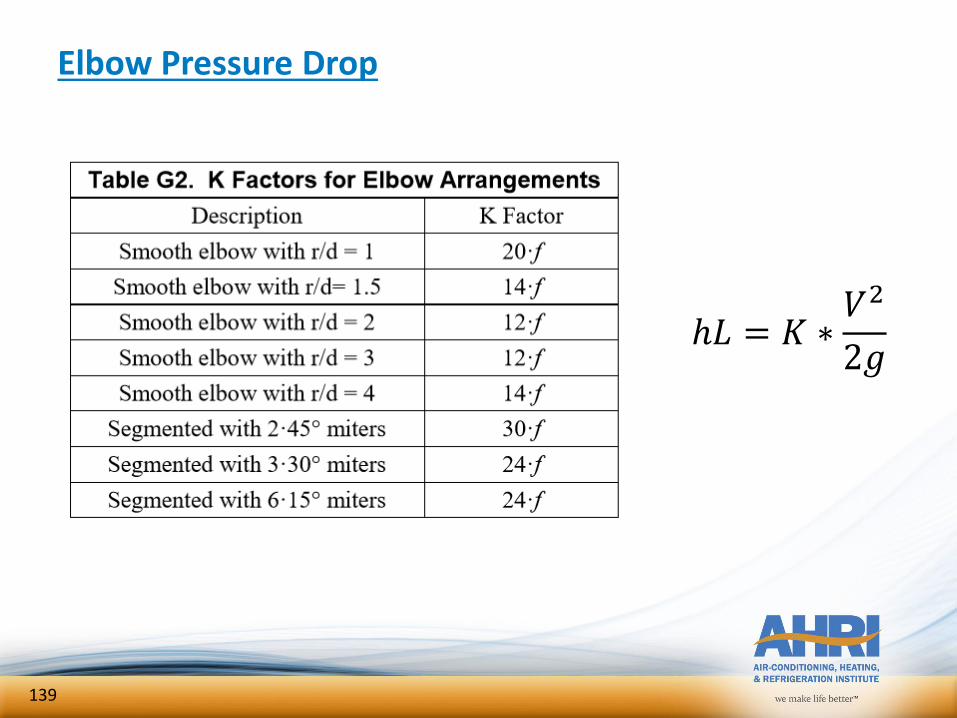
Elbow Pressure Drop
ℎ𝐿 = 𝐾 ∗𝑉2
2𝑔
139
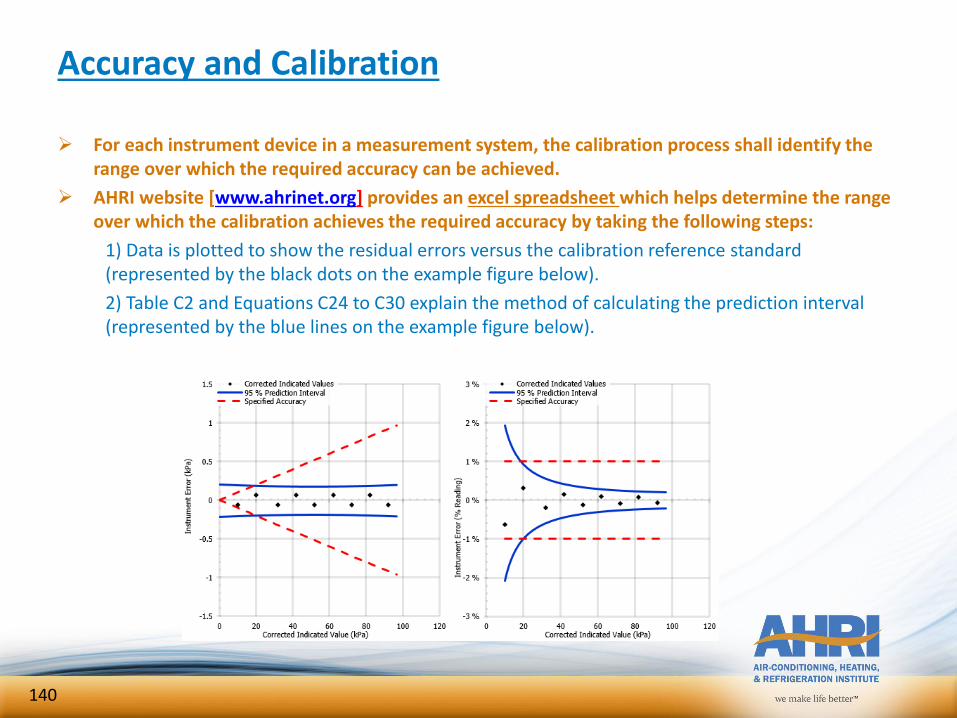
Accuracy and Calibration
For each instrument device in a measurement system, the calibration process shall identify the range over which the required accuracy can be achieved.
AHRI website [www.ahrinet.org] provides an excel spreadsheet which helps determine the range over which the calibration achieves the required accuracy by taking the following steps:
1) Data is plotted to show the residual errors versus the calibration reference standard (represented by the black dots on the example figure below).
2) Table C2 and Equations C24 to C30 explain the method of calculating the prediction interval (represented by the blue lines on the example figure below).
140

Appendix H, Heating Capacity Test Procedure
141
Appendix H, Heating Capacity Test Procedure –Normative
PurposeTo prescribe measurement methods for water-side heating capacity for Air Source Heat Pump Water-heating Packages
GeneralNet Heating Capacity will be determined by water-side measurements– Redundant instrumentation is to be used to check for erroneous
measurements– Heat rejection flow rate shall remain constant– Heat rejection flow rate shall be at cooling mode test conditions
derived from Table 1 or Table 2 of AHRI Standard 550/590– All ice or melt must be captured and removed by drain provisions for
the duration of the test
142
Appendix H, Heating Capacity Test Procedure –Normative
One of two methods of testing heating capacity shall be used to evaluate heating performance
– The “T” test procedure described in Section H3 should be used if test conditions are conducive to frost accumulation
– The “S” test procedure described in Section H2 may be tried first
• If the “S” test requirements cannot be achieved, heating capacity test shall be conducted using the “T” test procedure
143
Appendix H, Heating Capacity Test Procedure –Normative Overriding automatic defrost controls is prohibited
– Defeating time-adaptive defrost controls shall be done during the official data collection interval. A defrost cycle shall be manually induced
– Defrost cycles shall always be terminated by the heat pump’s defrost controls.• Defrost initiation is defined as occurring when the controls alter normal heating
operation to eliminate possible accumulations of frost.• Defrost termination is defined as occurring when the controls actuate the first
change in converting from defrost operation to normal heating operation.
“S” Test Procedure– Data to be collected throughout preconditioning and data collection
periods• Sampled at equal one minute intervals
– Dry-bulb Temperature– Water Vapor content of outdoor side entering air.
• Applicable Table 11 non-frosting parameters used to evaluate equilibrium sampled at equal 5 minute intervals
– All data collected, except parameters sampled between a defrost initiation and 10 minutes after defrost termination, shall be used to determine compliance as specified in Table 11
144
Appendix H, Heating Capacity Test Procedure –Normative
“S” Test Procedure– Test Room reconditioning apparatus and equipment under test shall
be operated a minimum of 1 hour to attain equilibrium, even if equilibrium is achieved in less than 1 hour.
– Ending the preconditioning period with a defrost cycle is recommended for heating capacity tests at low temperatures
• If defrost cycle occurs heat pump shall operate for at least 10 minutes after defrost cycle before resuming or initiating data collection.
– When preconditioning is completed, data shall be sampled at equal intervals spanning 5 minutes or less.
• Net Heating Capacity (Qcd) shall be evaluated at equal 5 minute intervals
• Capacity evaluated at the start of the data collection period (Qcd(τ=0)) shall be saved.
145
Appendix H, Heating Capacity Test Procedure –Normative “S” Test Procedure
– If preconditioning period ends with a defrost cycle• Suspend data collection immediately prior to completing 30 minute
interval where Table 11 tolerances are satisfied if;– Heat pump undergoes a defrost cycle– Or indoor-side water temperature delta degradation ratio exceeds 0.050– Or one or more Table 11 non-frosting tolerances are exceeded.
• If “S” test procedure is suspended due to a defrost cycle, the “T” test procedure shall be used
• If “S” test procedure is suspended due to degradation ratio exceeding 0.050, the “T” test procedure shall be used.
• If one or more Table 11 tolerances is exceeded, another attempt at using the “S” test procedure shall be made as soon as steady state performance is achieved.
• If the “S” test procedure is not suspended then sampling shall be terminated after 30 minutes of data collection.
– The average of the seven (τ=0,1,2,3,4,5,6) samples of the reported Net Heating Capacity applies.
146
Appendix H, Heating Capacity Test Procedure –Normative
“S” Test Procedure– If preconditioning period does not end with a defrost cycle
• Suspend data collection immediately prior to completing 30 minute interval where Table 11 tolerances are satisfied if;– Heat pump undergoes a defrost cycle– Or indoor-side water temperature delta degradation ratio exceeds 0.050– Or one or more Table 11 non-frosting tolerances are exceeded.
• If “S” test procedure is suspended due to a defrost cycle, then another attempt shall be made beginning 10 minutes after termination of the defrost cycle.
• If “S” test procedure is suspended due to degradation ratio exceeding 0.050, a defrost cycle should be manually initiated, if possible, and the test reinitiated 10 minutes after the defrost cycle.
• If one or more Table 11 tolerances is exceeded, another attempt at using the “S” test procedure shall be made as soon as steady state performance is achieved.
• If the “S” test procedure is not suspended then sampling shall be terminated after 30 minutes of data collection.– The average of the seven (τ=0,1,2,3,4,5,6) samples of the reported Net
Heating Capacity applies.
147

Accompanying Tools
148
Kadj Efficiency Correction Tool
In ASHRAE 90.1 section 6.4.1.2.1 there is a procedure for adjusting minimum efficiency requirements for full and part load for non-standard rating conditions
The procedure is only applicable for water cooled centrifugal chillers
It allows for equipment not designed to operate at AHRI standard ratings conditions to be tested to verify compliance with minimum efficiency requirements
This is not a requirement for AHRI ratings and certification, but is a procedure that is applicable to chillers and customer ratings and regulation compliance
The procedure is complicated and the tool provide a user friendly way to calculate the adjusted minimum efficiency requirements.
The tool allows for calculation of kadj for the 2004, 2007, 2010, 2013 and 2016 standards for both SI and IP ratings
Note that the applicable standard revision that should be used will depend on the version of ASHRAE 90.1 or IECC that has been adopted by the local building efficiency standard
149
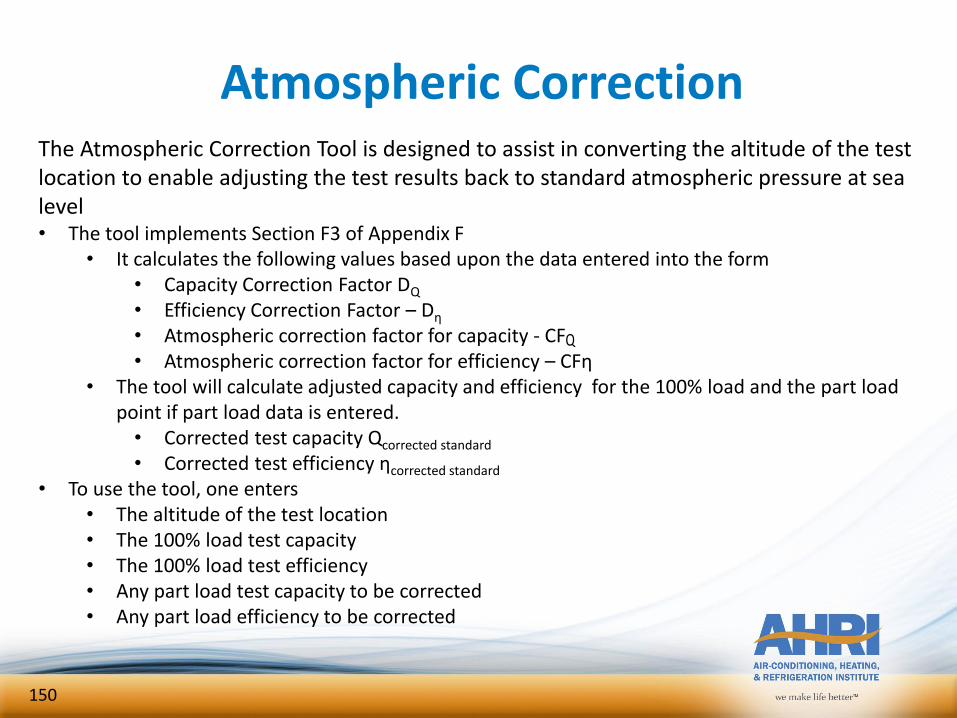
Atmospheric Correction
150
The Atmospheric Correction Tool is designed to assist in converting the altitude of the test location to enable adjusting the test results back to standard atmospheric pressure at sea level• The tool implements Section F3 of Appendix F
• It calculates the following values based upon the data entered into the form• Capacity Correction Factor DQ
• Efficiency Correction Factor – Dƞ
• Atmospheric correction factor for capacity - CF• Atmospheric correction factor for efficiency – CFƞ
• The tool will calculate adjusted capacity and efficiency for the 100% load and the part load point if part load data is entered.• Corrected test capacity Qcorrected standard
• Corrected test efficiency ηcorrected standard
• To use the tool, one enters• The altitude of the test location• The 100% load test capacity• The 100% load test efficiency• Any part load test capacity to be corrected• Any part load efficiency to be corrected
Recommended