Agronomic Value ofAgronomic Value ofNutrients in BiosolidsNutrients in Biosolids
Randall WardenRandall Warden
A & L Great Lakes LaboratoriesA & L Great Lakes Laboratories
Fort Wayne, INFort Wayne, IN
Quality Analyses for Informed Decisions

Presentation OutlinePresentation Outline
Assessment of nutrient levelsAssessment of nutrient levels Soil testingSoil testing Biosolids analysisBiosolids analysis
Crop nutrient requirements and Crop nutrient requirements and responsivenessresponsiveness
Process to determine nutrient value ($)Process to determine nutrient value ($)

Assessing Nutrient Levels - Assessing Nutrient Levels - What is a Soil Test?What is a Soil Test?
Analysis of a soil sample to determine Analysis of a soil sample to determine nutrient availability to plantsnutrient availability to plants
Extract all or Extract all or proportionalproportional part of plant- part of plant-available nutrients from soilavailable nutrients from soil
Goal – prescription fertilizer applicationGoal – prescription fertilizer application
SampleSampleIDID
pHpH PP(ppm)(ppm)
KK(ppm)(ppm)
ZnZn(ppm)(ppm)
Mn Mn (ppm)(ppm)
1 5.6 9 VL 61 L 1.7 L 60 VH
2 4.6 6 VL 17 VL 1.7 L 3 VL
3 6.2 47 H 155 H 3.1 M 62 VH
4 7.6 12 L 149 M 6.1 H 18 M
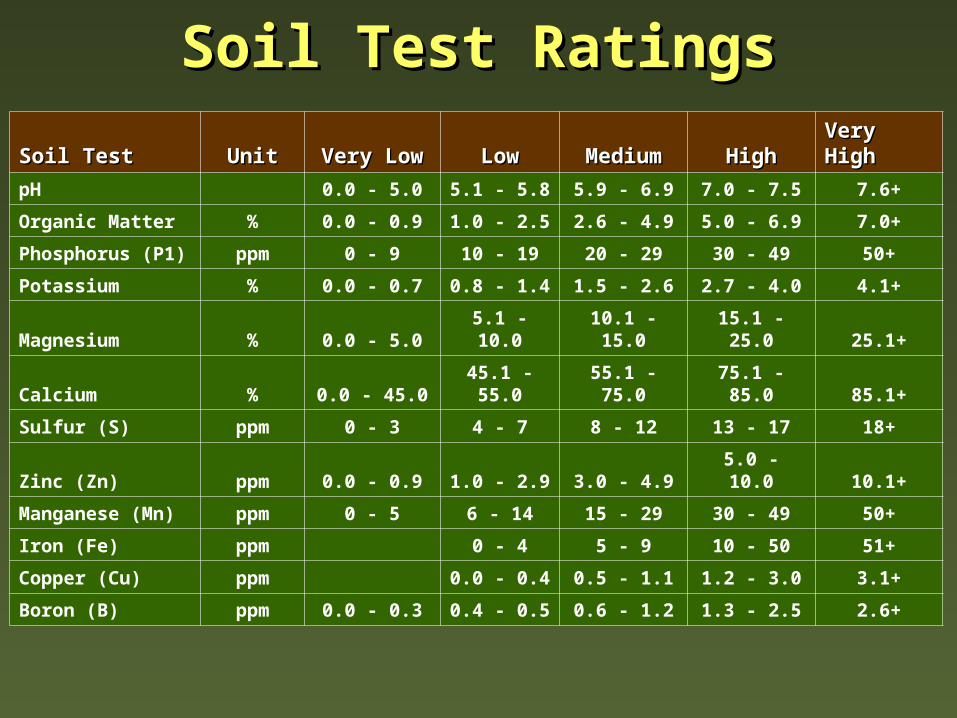
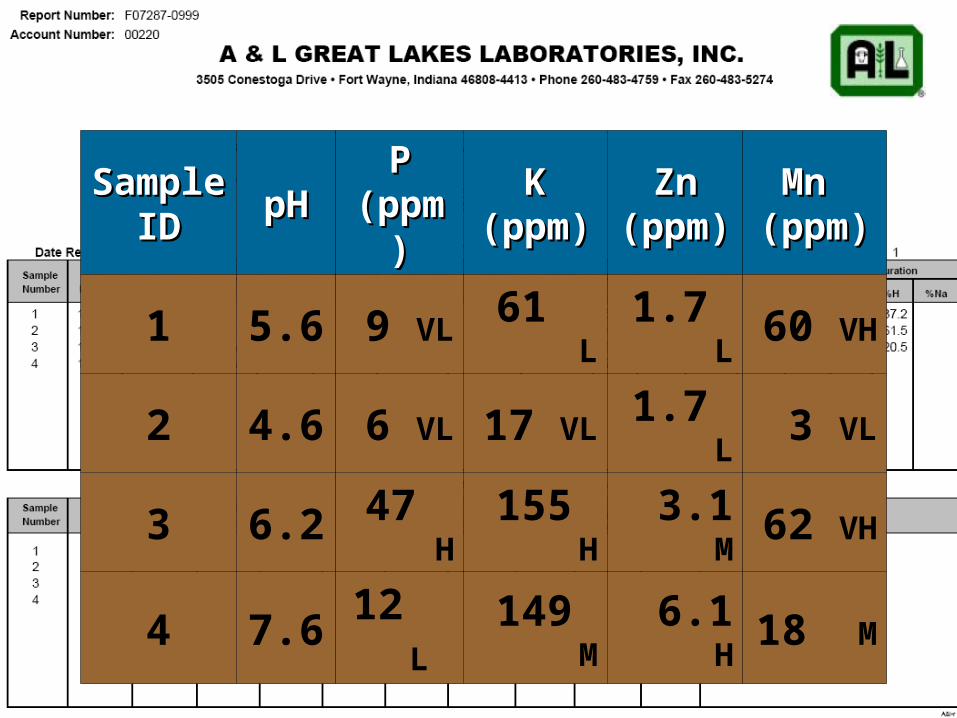
Soil TestSoil Test UnitUnit Very LowVery Low LowLow MediumMedium HighHigh Very HighVery High
pH 0.0 - 5.0 5.1 - 5.8 5.9 - 6.9 7.0 - 7.5 7.6+
Organic Matter % 0.0 - 0.9 1.0 - 2.5 2.6 - 4.9 5.0 - 6.9 7.0+
Phosphorus (P1) ppm 0 - 9 10 - 19 20 - 29 30 - 49 50+
Potassium % 0.0 - 0.7 0.8 - 1.4 1.5 - 2.6 2.7 - 4.0 4.1+
Magnesium % 0.0 - 5.0 5.1 - 10.0 10.1 - 15.0 15.1 - 25.0 25.1+
Calcium % 0.0 - 45.0 45.1 - 55.0 55.1 - 75.0 75.1 - 85.0 85.1+
Sulfur (S) ppm 0 - 3 4 - 7 8 - 12 13 - 17 18+
Zinc (Zn) ppm 0.0 - 0.9 1.0 - 2.9 3.0 - 4.9 5.0 - 10.0 10.1+
Manganese (Mn) ppm 0 - 5 6 - 14 15 - 29 30 - 49 50+
Iron (Fe) ppm 0 - 4 5 - 9 10 - 50 51+
Copper (Cu) ppm 0.0 - 0.4 0.5 - 1.1 1.2 - 3.0 3.1+
Boron (B) ppm 0.0 - 0.3 0.4 - 0.5 0.6 - 1.2 1.3 - 2.5 2.6+
Soil Test RatingsSoil Test Ratings

Soil Test RatingSoil Test Rating Probability of Economic Response Probability of Economic Response to Fertilizer Applicationto Fertilizer Application
Very Low (VL) Very High
Low (L) High
Medium (M) Medium
High (H) Low
Very High (VH) None
Soil Test Ratings & EconomicsSoil Test Ratings & Economics

Soil Test Ratings & EconomicsSoil Test Ratings & Economics
Soil Test Nutrient LevelVL VHM
Probability of Crop ResponseHigh LowMedium
ROI $
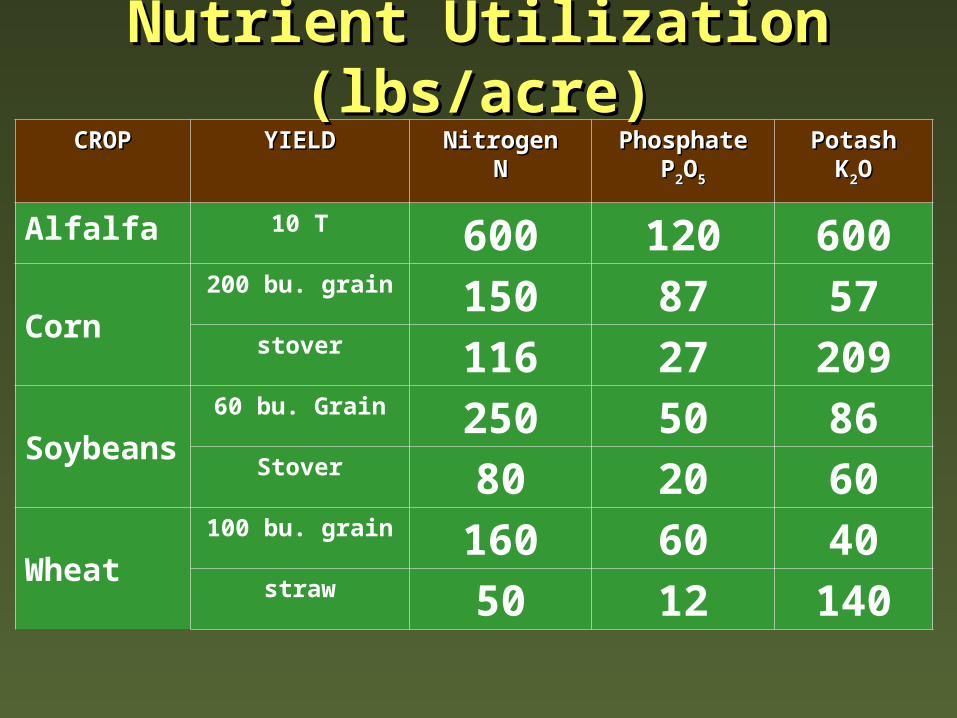
CROPCROP YIELDYIELD NitrogenNitrogenNN
PhosphatePhosphatePP22OO55
PotashPotashKK22OO
Alfalfa 10 T 600 120 600
Corn
200 bu. grain 150 87 57stover 116 27 209
Soybeans
60 bu. Grain 250 50 86Stover 80 20 60
Wheat
100 bu. grain 160 60 40straw 50 12 140
Nutrient Utilization (lbs/acre)Nutrient Utilization (lbs/acre)

CROP YIELD MagnesiumMg
CalciumCa
SulfurS
Alfalfa 10 T 53 280 51
Corn200 bu. grain 18 4 15
stover 47 38 18
Soybeans60 bu. Grain 17 12 12
Stover 10 90 14
Wheat100 bu. grain 15 5 8
straw 13 21 16
Nutrient Utilization (lbs/acre)Nutrient Utilization (lbs/acre)

CropCropPounds per AcrePounds per Acre
BB ZnZn MnMn FeFe CuCu
Alfalfa10 tons
0.70 0.65 1.10 1.50 0.18
Corn200 Bushels
0.19 0.57 1.35 1.40 0.15
Soybeans60 bushels
0.22 0.30 0.75 1.05 0.14
Wheat80 bushels
0.08 0.34 0.55 0.70 0.09
Crop Nutrient RemovalCrop Nutrient Removal
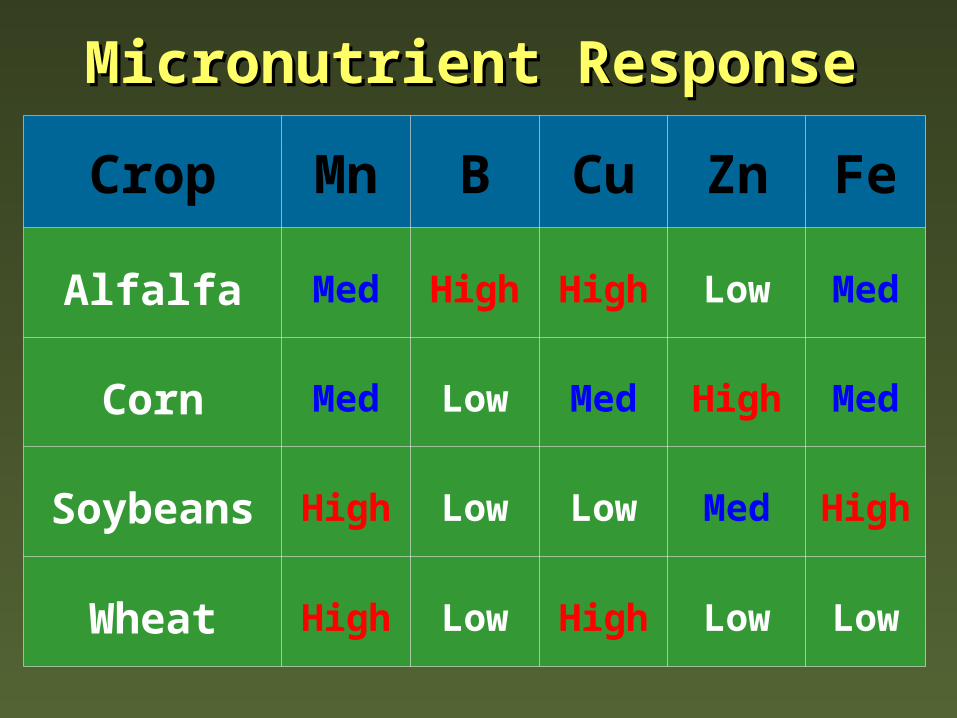
Crop Mn B Cu Zn Fe
Alfalfa Med High High Low Med
Corn Med Low Med High Med
Soybeans High Low Low Med High
Wheat High Low High Low Low
Micronutrient ResponseMicronutrient Response

Fertilizer Prices ChangeFertilizer Prices ChangeNutrientNutrient UnitUnit 20042004 20082008
Nitrogen lb $0.35 $0.65
Phosphate (P2O5) lb $0.19 $0.58
Potash (K2O) lb $0.18 $0.33
Sulfur (S) lb $0.39
Zinc (Zn) lb $1.34
Manganese (Mn) lb $0.80
Copper (Cu) lb $1.68
Boron (B) lb $0.75
Lime ton $25.00 $30.00

Current Crop Production CostsCurrent Crop Production Costs
Corn – 180 bu/A – medium soil tests
Nitrogen (210 lb x $0.65/lb = $136.50) Phosphate (50 lb x $0.58/lb = $29.00) Potash (200 lb x $0.33/lb = $66.00)
Per acre fertilizer cost = $231.50
Cost per 80 acres = $18,520.00
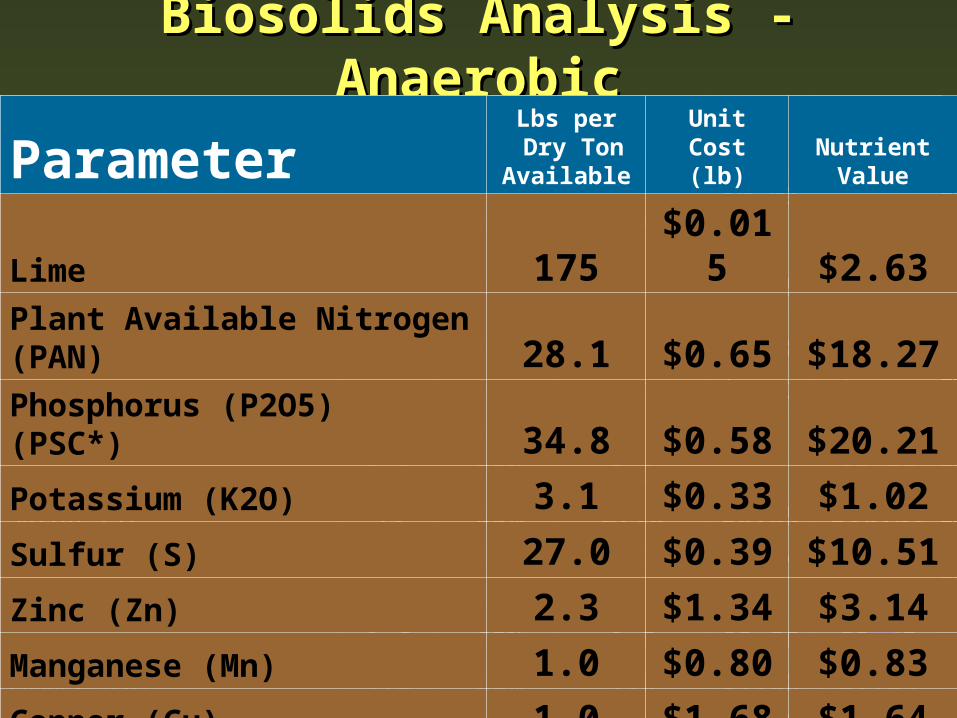
Biosolids Analysis - AnaerobicBiosolids Analysis - AnaerobicParameter
Lbs perDry Ton
% Available
Lbs per DryTon Available
UnitCost (lb)
NutrientValue
Lime 175 100% 175 $0.015 $2.63
Plant Available Nitrogen (PAN) 28.1 100% 28.1 $0.65 $18.27
Phosphorus (P2O5) (PSC*) 87.1 40% 34.8 $0.58 $20.21
Potassium (K2O) 3.1 100% 3.1 $0.33 $1.02
Calcium (Ca) 87.5 55% 48.1 $0.00
Magnesium (Mg) 9.3 55% 5.1 $0.00
Sulfur (S) 49 55% 27.0 $0.39 $10.51
Zinc (Zn) 3.6 65% 2.3 $1.34 $3.14
Iron (Fe) 58.3 65% 37.9 $0.00
Manganese (Mn) 1.6 65% 1.0 $0.80 $0.83
Copper (Cu) 1.5 65% 1.0 $1.68 $1.64
Boron (B) BDL 65% 0.0 $0.75 $0.00
““Maximum” Nutrient ValueMaximum” Nutrient Value $58.25
ParameterLbs per Dry Ton Available
UnitCost (lb)
NutrientValue
Lime 175 $0.015 $2.63
Plant Available Nitrogen (PAN) 28.1 $0.65 $18.27
Phosphorus (P2O5) (PSC*) 34.8 $0.58 $20.21
Potassium (K2O) 3.1 $0.33 $1.02
Sulfur (S) 27.0 $0.39 $10.51
Zinc (Zn) 2.3 $1.34 $3.14
Manganese (Mn) 1.0 $0.80 $0.83
Copper (Cu) 1.0 $1.68 $1.64
Boron (B) 0.0 $0.75 $0.00
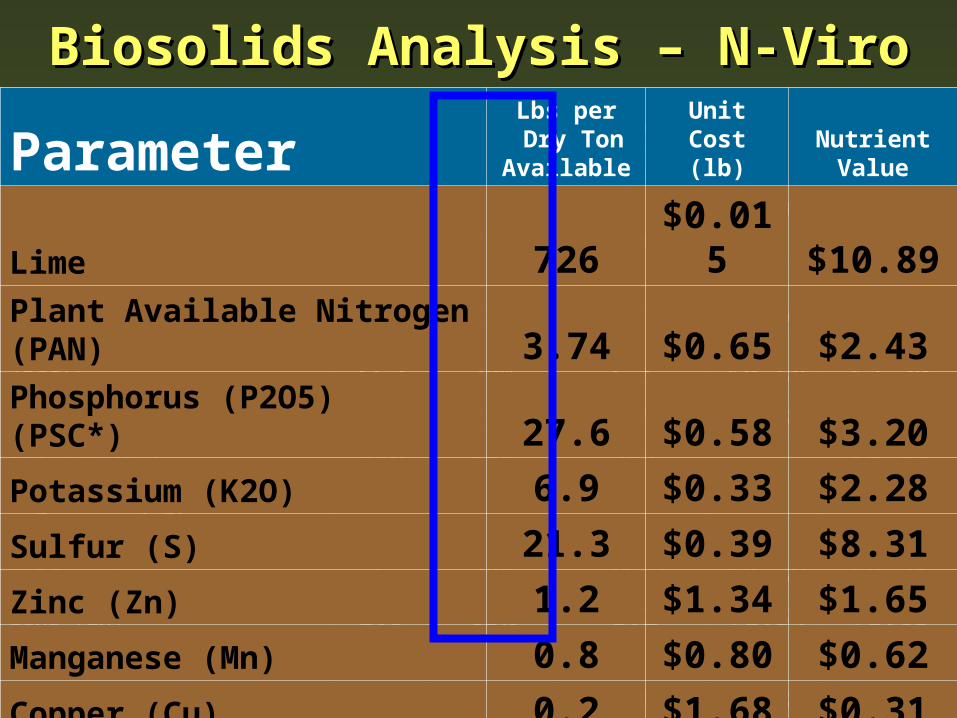
Biosolids Analysis – N-ViroBiosolids Analysis – N-ViroParameter
Lbs perDry Ton % Available
Lbs per DryTon Available
UnitCost (lb)
NutrientValue
Lime 726 100% 726 $0.015 $10.89
Plant Available Nitrogen (PAN) 3.744 100% 3.7 $0.65 $2.43
Phosphorus (P2O5) (PSC*) 27.6 20% 5.5 $0.58 $3.20
Potassium (K2O) 6.9 100% 6.9 $0.33 $2.28
Calcium (Ca) 449 55% 247 $0.00
Magnesium (Mg) 35.2 55% 19.4 $0.00
Sulfur (S) 106.6 20% 21.3 $0.39 $8.31
Zinc (Zn) 1.9 65% 1.2 $1.34 $1.65
Iron (Fe) 61.6 65% 40.0 $0.00
Manganese (Mn) 1.2 65% 0.8 $0.80 $0.62
Copper (Cu) 0.28 65% 0.2 $1.68 $0.31
Boron (B) 1.1 65% 1.0 $0.75 $0.00
““Maximum” Nutrient ValueMaximum” Nutrient Value $29.70
ParameterLbs per Dry Ton Available
UnitCost (lb)
NutrientValue
Lime 726 $0.015 $10.89
Plant Available Nitrogen (PAN) 3.74 $0.65 $2.43
Phosphorus (P2O5) (PSC*) 27.6 $0.58 $3.20
Potassium (K2O) 6.9 $0.33 $2.28
Sulfur (S) 21.3 $0.39 $8.31
Zinc (Zn) 1.2 $1.34 $1.65
Manganese (Mn) 0.8 $0.80 $0.62
Copper (Cu) 0.2 $1.68 $0.31
Boron (B) 1.0 $0.75 $0.75

Soil TestSoil Test
Percent of Soil Samples by Test Rating*Percent of Soil Samples by Test Rating*
V LowV Low LowLow MediumMedium HighHigh V HighV High
pHpH 1.71.7 10.310.3 49.449.4 23.223.2 15.515.5
PhosphorusPhosphorus 2.22.2 10.610.6 15.115.1 26.826.8 45.345.3
PotassiumPotassium 1.21.2 9.49.4 49.549.5 29.829.8 10.010.0
SulfurSulfur 1.21.2 40.140.1 41.241.2 17.517.5
ZincZinc 31.631.6 40.040.0 23.223.2 5.35.3
ManganeseManganese 4.04.0 9.89.8 14.614.6 62.462.4 9.39.3
CopperCopper 0.20.2 44.944.9 42.442.4 12.512.5
BoronBoron 31.331.3 27.027.0 35.135.1 5.85.8 0.80.8
2007 Michigan Soil Test Summary2007 Michigan Soil Test Summary
* > 50,000 samples
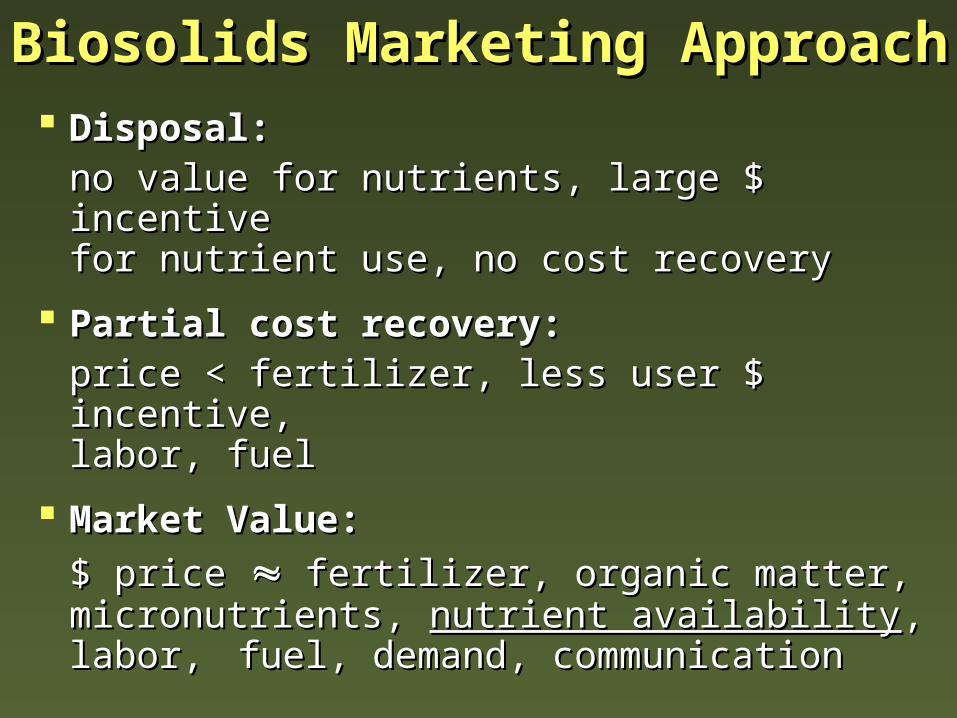
Biosolids Marketing Biosolids Marketing ApproachApproach
Disposal:Disposal: no value for nutrients, large $ incentiveno value for nutrients, large $ incentivefor nutrient use, no cost recoveryfor nutrient use, no cost recovery
Partial cost recovery:Partial cost recovery:price < fertilizer, less user $ incentive,price < fertilizer, less user $ incentive,labor, fuellabor, fuel
Market Value:Market Value:
$ price $ price fertilizer, organic matter, fertilizer, organic matter, micronutrients, micronutrients, nutrient availabilitynutrient availability, , labor, labor,
fuel, demand, communicationfuel, demand, communication

Opportunities and ChallengesOpportunities and Challenges
Increasing fertilizer costs ($/A) Fertilizer availability - timing Cost recovery
Fair valuation of biosolids nutrients (test) Nutrient need (test) Availability of nutrients (treatment process) Stewardship
Consistency of Communication

Time to Stop – Questions?Time to Stop – Questions?
Recommended