AGRICULTURE, FISHERIES
AND AQUACULTURE
SECTORS IN REVIEW
2002
Agriculture, Fisheries and Aquaculture

2�
AGRICULTURE, FISHERIES AND AQUACULTURE SECTORS IN REVIEW 2002
Table of Contents
Introduction ...................................................................................... 3
Agriculture and Agri-Food Sector ..................................................... 4
SECTOR OVERVIEW ..............................................................................................4
2002 HIGHLIGHTS ...............................................................................................5
Commercial Fisheries Sector ............................................................ 6
SECTOR OVERVIEW ...............................................................................................6
2002 HIGHLIGHTS ...............................................................................................7
Aquaculture Sector .......................................................................... 8
SECTOR OVERVIEW ...............................................................................................8
2002 HIGHLIGHTS ...............................................................................................9
N.B. total primary incomes from all the sectors in 2002
Finfish 3%
Salmon 24%
Herring 2%
Snow crab 8%
Lobster 11%
Eggs 2%
Livestock 7%
Poultry 5%Dairy
products 9%
Grain 1%
Vegetables, Fruits& Berries 3%
Greenhouse &Floriculture 6%
Potatoes 15%
Mussels, Oysters& Trout 1%
Other (agriculture)3%
Source: Statistics Canada
Sectors in review (2002)
Farm Cash Receipts $428.6 million
Commercial Fisheries landings $198.096 million
Aquaculture $202.574 million
Seafood Exports $884 million
Agri-Food Exports $433 million
Total Shipments $2.2 billion

3�
AGRICULTURE, FISHERIES AND AQUACULTURE SECTORS IN REVIEW 2002
As the Minister responsible for agriculture, fisheries, and aquaculture inNew Brunswick, I am especially proud to present to you the first editionof the Agriculture, Fisheries and Aquaculture Sectors in Review.
Although New Brunswick is geographically one of Canada’s smaller provinces, big thingsare happening here in agriculture, fisheries, and aquaculture. These three sectors are anintegral part of our province’s rural communities generating more than 2.2 billion dollars in2002. Exports play a vital role in the sectors prosperity with annual revenues of some 1.32billion dollars.
In addition, these three food production sectors contribute to the direct and indirectemployment of close to 30,000 New Brunswicker’s in the primary and value-added sectors.Thousands of other jobs in the service transportation, manufacturing and other sectors alsodepend on our food production economy.
I would like to confirm the government’s intention to continue to invest in the totaldevelopment of agriculture, commercial fisheries and aquaculture through the delivery ofprograms and services promoting development and innovation, allowing us to pursue astrategy of increasing primary production while fostering value-added opportunities in foodand bio-product production.
The New Brunswick government and the Department of Agriculture, Fisheries andAquaculture will work to promote the sustainable growth of these sectors through innovativepartnerships and targeted policies and programs resulting in greater prosperity for NewBrunswickers.
The agriculture, commercial fisheries and aquaculture sectors have been a vital part of thisprovince for many generations, and we intend to make sure that they continue to prosper formany generations to come.
David Alward
Minister of Agriculture, Fisheries and Aquaculture
4�
AGRICULTURE, FISHERIES AND AQUACULTURE SECTORS IN REVIEW 2002
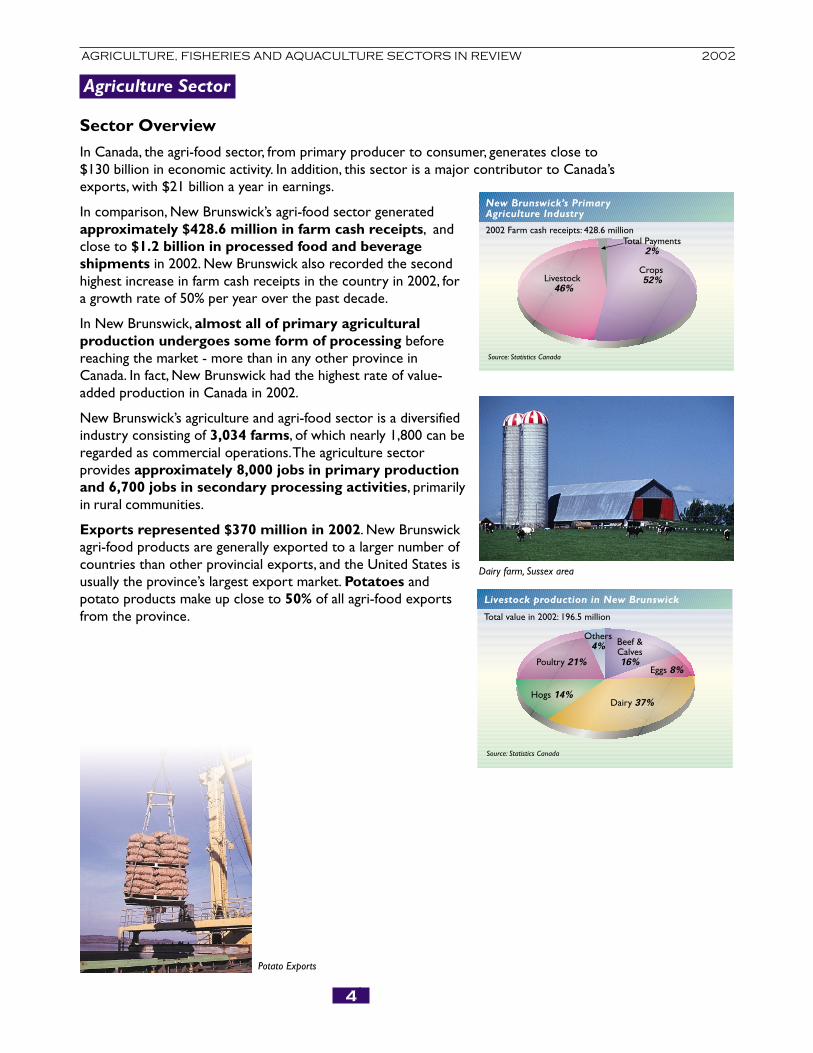
Source: Statistics Canada
New Brunswick’s PrimaryAgriculture Industry
2002 Farm cash receipts: 428.6 million
Livestock 46%
Crops 52%
Total Payments2%
Potato Exports
Agriculture Sector
Sector Overview
In Canada, the agri-food sector, from primary producer to consumer, generates close to$130 billion in economic activity. In addition, this sector is a major contributor to Canada’sexports, with $21 billion a year in earnings.
In comparison, New Brunswick’s agri-food sector generatedapproximately $428.6 million in farm cash receipts, andclose to $1.2 billion in processed food and beverageshipments in 2002. New Brunswick also recorded the secondhighest increase in farm cash receipts in the country in 2002, fora growth rate of 50% per year over the past decade.
In New Brunswick, almost all of primary agriculturalproduction undergoes some form of processing beforereaching the market - more than in any other province inCanada. In fact, New Brunswick had the highest rate of value-added production in Canada in 2002.
New Brunswick’s agriculture and agri-food sector is a diversifiedindustry consisting of 3,034 farms, of which nearly 1,800 can beregarded as commercial operations. The agriculture sectorprovides approximately 8,000 jobs in primary productionand 6,700 jobs in secondary processing activities, primarilyin rural communities.
Exports represented $370 million in 2002. New Brunswickagri-food products are generally exported to a larger number ofcountries than other provincial exports, and the United States isusually the province’s largest export market. Potatoes andpotato products make up close to 50% of all agri-food exportsfrom the province.
Source: Statistics Canada
Livestock production in New Brunswick
Total value in 2002: 196.5 million
Poultry 21%
Dairy 37%Hogs 14%
Eggs 8%
Beef &Calves16%
Others4%
Dairy farm, Sussex area

5�
AGRICULTURE, FISHERIES AND AQUACULTURE SECTORS IN REVIEW 2002
2002 Highlights
• New Brunswick’s processing rate is more than 300%, thehighest in Canada.
• The blueberry industry, with 9,716 hectares undercultivation, achieved a production level of 6.9 million kg,while the cranberry industry, with 121 hectares, achieved alevel of 1.9 million kg. These two crops are currently in astrong expansion phase, accounting for $11 million inexport revenues in 2002.
• Exports to more than 26 countries continue to grow at asteady pace, rising from $155 million in 1993 to $389million in 2002.
New Brunswick’s Agriculture and Agri-Food Industry (2002)
Number of farms 3,034
Farmland - total, hectares 383,560
Land in crops, hectares 147,159
Total Farm Capital $1.5 billion
Farm Cash Receipts $428.6 million
10-Year Growth Rate 52 %
Value of food and beverage shipments $1.2 billion
10-Year Growth Rate 20 %
Agri-food Exports $389 million
10-Year Growth Rate 94 %
Employment - farm 8,010
Employment - processing 6,680
Crops:
Potatoes $126 million
Greenhouse & Floriculture $53 million
Fruits & Berries $15 million
Vegetables $8 million
Grain $6 million
Others $17 million
Livestock:
Dairy products $74 million
Poultry $41 million
Hogs $28 million
Beef & Calves $31 million
Eggs $15 million
Others $7 million
Government Payments $8 million
Source: Statistics Canada and Department of Finance, New Brunswick
Source: Statistics Canada
Crops in New Brunswick
Total value in 2002 : 208 million
Potatoes 55%
Vegetables 4%
Fruits &Berries 7%
Grain 3%
Greenhouse& Floriculture
23%
Others8%
Boyce Farmer’s Market,Fredericton

6�
AGRICULTURE, FISHERIES AND AQUACULTURE SECTORS IN REVIEW 2002
Commercial Fisheries Sector
Sector Overview
Commercial fishing has been the backbone of more than 150New Brunswick coastal communities for generations. Thistradition lives on today thanks to a solid, organized industry thatcontinues to encourage the sustainable development of fishingthrough management that is sensitive to stock conservationissues. New Brunswick has two main fishing areas: the Gulf of St.Lawrence and the Bay of Fundy.
With landings of 122,225 tonnes in 2002 valued at over$194 million, the industry continues to thrive. New Brunswick’sfleet of approximately 2,770 inshore, midshore, and offshorevessels employs over 7,000 fishermen. With a few exceptions, thefleet is made up of vessels less than 30 metres in length.
Close to 7,120 workers in 2002 were employed in 137 plants. From frozen lobstermeat to smoked salmon, seafood lasagna and shrimp fettuccine, these workers process 140top-quality products to stringent international standards.
The main species by value caught by New Brunswick fishermen islobster, which alone accounts for more than 46% of thelanded value, followed by crab with over 34%. Otherimportant catches are herring, at almost 8% of landed value,shrimp with 4%, and scallops with 1.5%.
Fuelled by exports of fish and fish products reaching a value of$884 million in 2002, the New Brunswick commercial fisheriessector continues to be a key contributor to the provincialeconomy.
Source: Department of Fisheries and Oceans, Canada
Landings Value by Species
Total value in 2002: 194,345 million
Lobster 46%
Shrimp 4%
Herring 7.5%
Scallops 1.5%
Snow Crab 34%
Other 7%
Lobster Fishing
Wharf, Caraquet

7�
AGRICULTURE, FISHERIES AND AQUACULTURE SECTORS IN REVIEW 2002
2002 Highlights
• Landed value of snow crab increased by $27 million in 2002.
• With landings of 612 tonnes, the sea cucumber industry is undergoing rapidexpansion in the province. Exports of this species, highly prized on Hong Kong markets,are valued at about $1 million.
• In terms of volume, herring was the dominant catch in 2002, accounting foralmost 56% of the landed volume, followed by snow crab, lobster and shrimp.
• In 2002, the province was also involved in a complementary fishery for smelt, alewife,eel, and rock crab. This directed fishery contributes $4 million in revenue to theeconomy.
Commercial Landings
Species Volume (MT) Value ($ 000Can.)
2000 2001 2002 2000 2001 2002
Lobster 7,538 8,221 7,401 80,852 93,223 89,928
Snow Crab 8,482 7,193 11,948 56,029 38,065 65,840
Herring 78,413 73,714 68,730 14,029 15,930 14,551
Shrimp 5.333 6,993 6,679 7,338 8,208 7,502
Scallops 2,300 2,372 2,115 5,021 4,299 2,923
Sea Urchin 1,408 1,460 1,187 3,693 3,752 3,314
Groundfish 1,684 1,837 1,916 2,035 2,316 1,992
Other 8,430 10,127 22,249 7,186 8,814 8,295
Total 113,588 111,917 122,225 $176,183 $174,607 $194,345
Source: Department of Fisheries and Oceans, Canada
New Brunswick’s Commercial Fishing Industry - 2002
Number of Boats 2,772
Number of active processing plants 137
Total Boat Capital $55.9 million
Commercial Landings Value $198 million
10-Year Growth Rate 82 %
Value-Added $700 million
Total Seafood Shipments $1,128,000,000
Exports $884 million
12-Year Growth Rate (1990 = $257 million) 164 %
Employment - fishery 7,123
Employment - processing (FTEs) 5,020
Source: Department of Fisheries and Oceans, Canada and New Brunswick Department of Agriculture, Fisheries and Aquaculture
Crab Processing Plant

8�
AGRICULTURE, FISHERIES AND AQUACULTURE SECTORS IN REVIEW 2002
Aquaculture Sector
Sector Overview
Since its origins in the early 1940s for oysters and late 1970s forAtlantic salmon and mussels, aquaculture in New Brunswick has growndramatically over the years. In Canada, the aquaculture industry iscurrently worth around $1 billion.
Aquaculture is New Brunswick’s most rapidly growing resourceindustry. The salmon aquaculture industry, consisting of 41 companiesand 97 sites located mainly in the Bay of Fundy, produces about 10million fish per year in salmon cages covering 1,500 hectares.
New Brunswick’s aquaculture industry is currently the second largestin Canada. Worth approximately $1 million annually in the early 1980’s,the provincial salmon industry now boasts annual sales of nearly$240 million.
New Brunswick also has a well-established shellfish industry thatproduces mussels and oysters, among other species. Some 50commercial producers operate along the province’s east coast.Over the past two decades, aquaculture has become a significant contributor to and a vitalcomponent of the provincial economy, particularly in small coastal communities.
Aquaculture Products
Species Volume (MT) Value (000 $ Can.)
2000 2001 2002 2000 2001 2002
Mussels 750 750 637 825 825 801
Oysters 620 744 1,235 1,700 2,040 1,173
Salmon 29,100 33,900 38,900 223,000 180,010 194,500
Trout 550 550 550 6,100 6,100 6,100
Total 31,020 34,450 41,322 231,625 188,975 202,574
Source: Statistics Canada, and Fisheries and Oceans Canada
Source: Department of Agriculture, Fisheries and Aquaculture, New-Brunswick
Farm Gate Value by species
Salmon 96%
Mussels 1%
Oysters 1%
Trout 2%
Total value in 2002: 202,574 million
Salmon aquaculture,Bay of Fundy
1979 1984 1989 1994 1998 1999 20000
50000
100000
150000
200000
250000
Source: Statistics Canada
Salmon Industry production value
1979-2000, $ Thousands

9�
AGRICULTURE, FISHERIES AND AQUACULTURE SECTORS IN REVIEW 2002
2002 Highlights
• Salmon aquaculture sites are producing 38,900 tonnes of salmon in 2002, bringing in$223.6 million in export revenues. This industry provides one in four direct jobs inCharlotte County in southwestern New Brunswick.
• The most active mussel culture sites in New Brunswick are located in the Lamèque andShippagan areas, producing more than 600 tonnes valued over $800,000.
• Oyster farming on the province’s east coast is attracting a great deal of attention fromentrepreneurs. In 2002, more than 19 million oysters are seeded, and 100,000oyster bags are used for rearing purposes.
In 2002, 50 aquaculturists were very active, with 35 firms using suspended or rackculture techniques.
• In 2002, 54,000 young haddock are produced at the Aquarium and Marine Centre inShippagan, New Brunswick and they are shipped to private enterprises for grow-outtrials. Around 150,000 kg of fish are expected to be marketed in 2003.
New Brunswick’s Aquaculture Industry - 2002
Number of Salmon sites 97
Area leased to Salmon sites 1,500 hectares
Number of Shellfish sites 521
Area leased to Shellfish sites 2,582 hectares
Farm Gate Value
Salmon $194.5 million
Shellfish and Trout $8 million
5-Year Growth Rate (salmon) 83 %
Total Value-Added Sales
Salmon $282.3 million
5-Year Growth Rate (salmon) 85 %
Exports
Salmon $223.6 million
5-Year Growth Rate (salmon) 115 %
Employment (salmon) - farm, hatchery and other direct 1,289
Employment (salmon) - processing 560
Source: Department of Agriculture, Fisheries and Aquaculture, New Brunswick
Oyster floating bags forsuspended culture.

10�
AGRICULTURE, FISHERIES AND AQUACULTURE SECTORS IN REVIEW 2002
Mission of the Department of Agriculture, Fisheries and Aquaculture:
To promote sustainable growth of the Agriculture, Fisheriesand Aquaculture sectors through innovative partnerships,
targeted programs and policies resulting ingreater prosperity for New Brunswickers.
Department of Agriculture, Fisheries and Aquaculture
P.O. Box 6000Fredericton, NB E3B 5H1
Telephone: 506 453-2666 Fax: 506 453-7170
Web site: http://www.gnb.ca/AFA-APAe-mail: [email protected]
CNB 1709
Recommended