AgricultureAgriculture and and
First Nation Peoples First Nation Peoples
Tom Allen
Indigenous Land Management Institute
University of Saskatchewan
The TreatiesThe Treaties
“We want cattle, tools, agricultural implements, and assistance in everything when we come to settle--our country is no longer able to support us.”
--Chief Sweet Grass
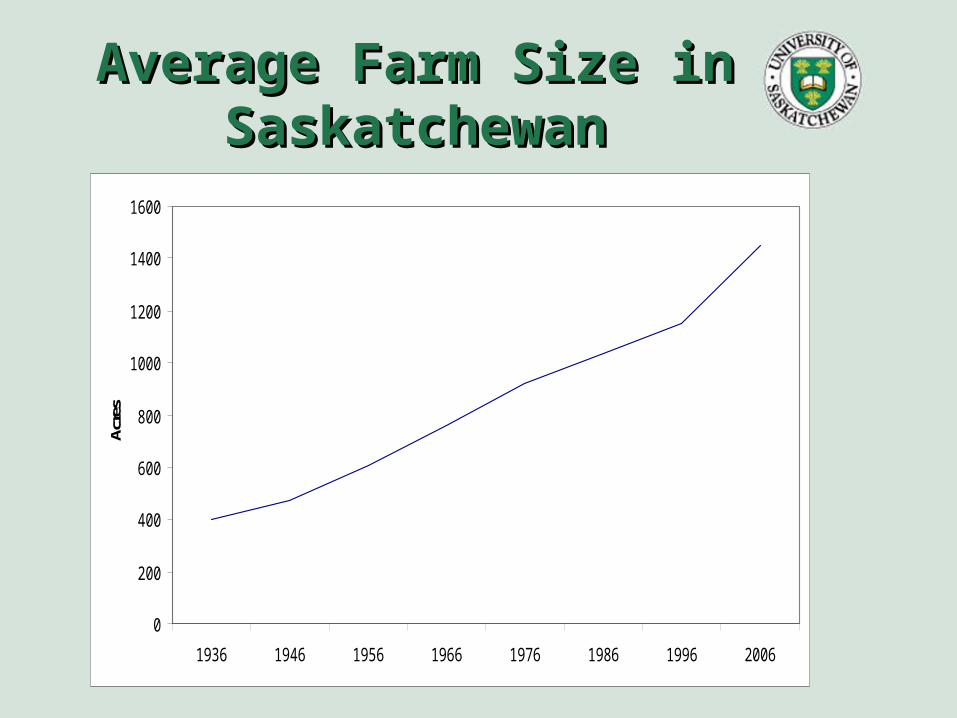
Average Farm Size in Average Farm Size in SaskatchewanSaskatchewan
0
200
400
600
800
1000
1200
1400
1600
1936 1946 1956 1966 1976 1986 1996 2006
Acre
s
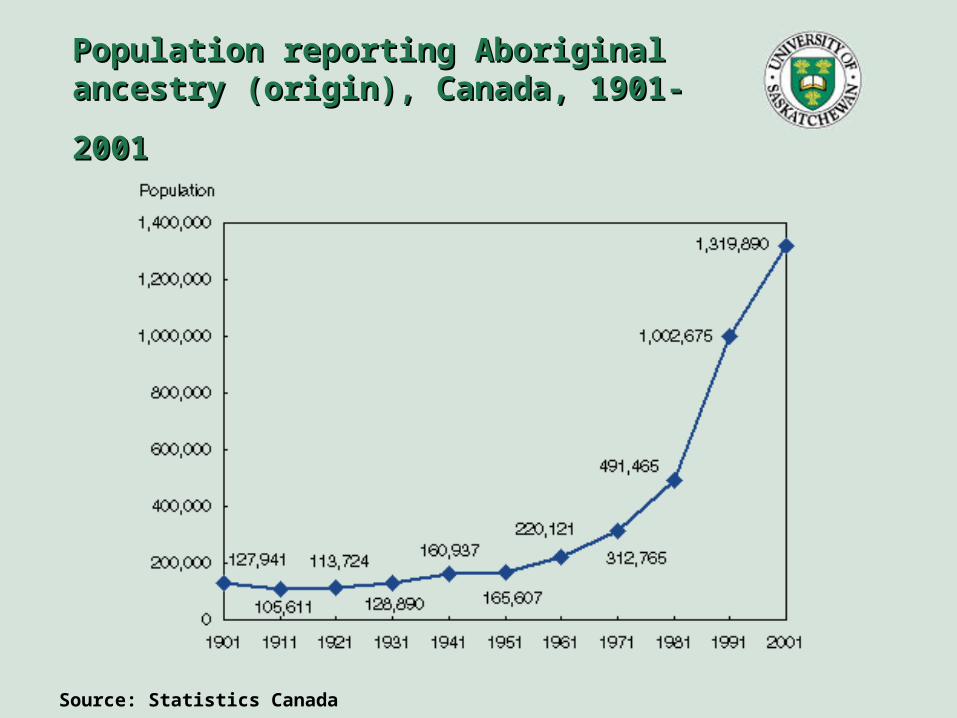
Population reporting Aboriginal ancestry Population reporting Aboriginal ancestry
(origin), Canada, 1901-2001(origin), Canada, 1901-2001
Source: Statistics Canada
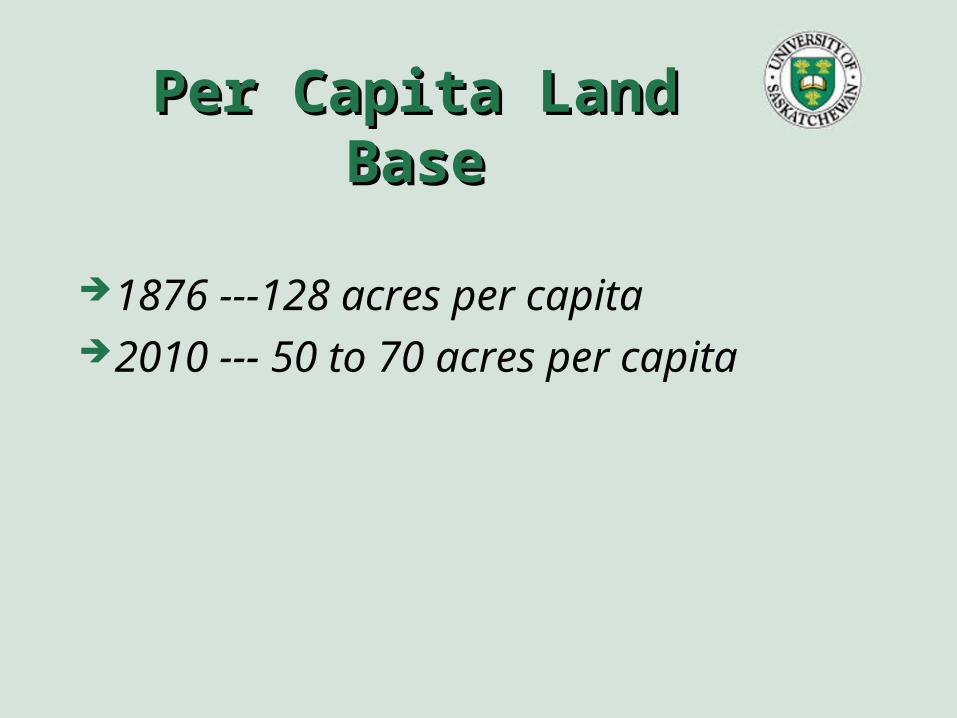
Per Capita Land BasePer Capita Land Base
1876 ---128 acres per capita2010 --- 50 to 70 acres per capita
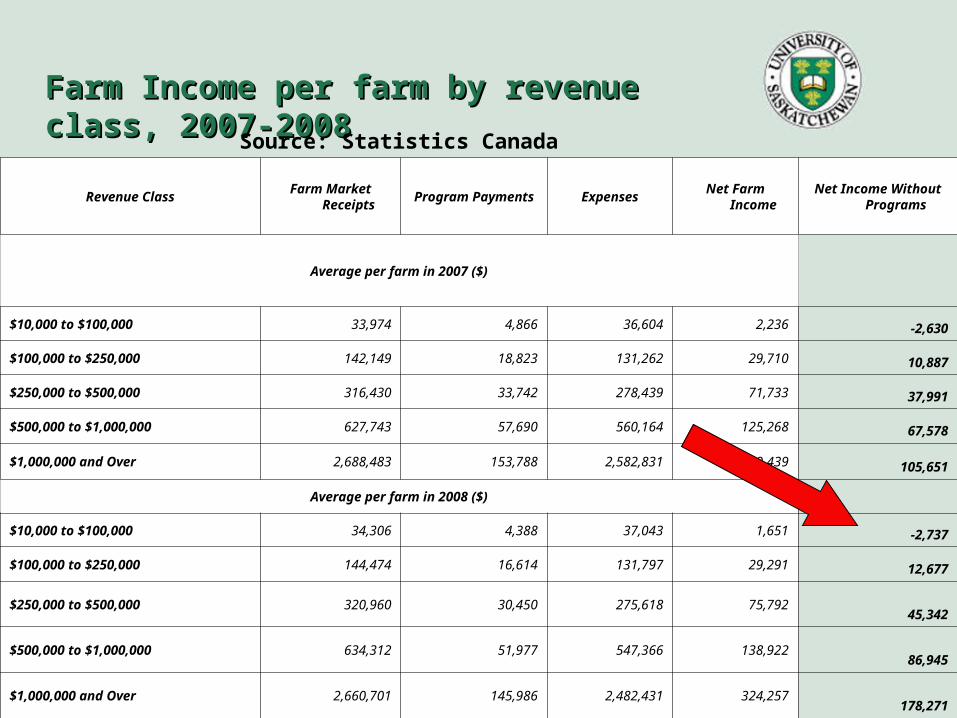
Farm Income per farm by revenue class, 2007-2008Farm Income per farm by revenue class, 2007-2008Source: Statistics Canada
Revenue ClassFarm Market
ReceiptsProgram
PaymentsExpenses
Net Farm Income
Net Income Without
Programs
Average per farm in 2007 ($)
$10,000 to $100,000 33,974 4,866 36,604 2,236 -2,630
$100,000 to $250,000 142,149 18,823 131,262 29,710 10,887
$250,000 to $500,000 316,430 33,742 278,439 71,733 37,991
$500,000 to $1,000,000 627,743 57,690 560,164 125,268 67,578
$1,000,000 and Over 2,688,483 153,788 2,582,831 259,439 105,651
Average per farm in 2008 ($)
$10,000 to $100,000 34,306 4,388 37,043 1,651 -2,737
$100,000 to $250,000 144,474 16,614 131,797 29,291 12,677
$250,000 to $500,000 320,960 30,450 275,618 75,79245,342
$500,000 to $1,000,000 634,312 51,977 547,366 138,92286,945
$1,000,000 and Over 2,660,701 145,986 2,482,431 324,257178,271
BSE and Government SupportBSE and Government Support
2003 discovery of BSE resulted in significant loss to livestock producers and the Canadian livestock industry
Government responded through the creation of several support programs
ParticipationParticipation
Less than 5% of First Nation cattle producers surveyed participated in support programs
Compare to over 80% participation by producers in total
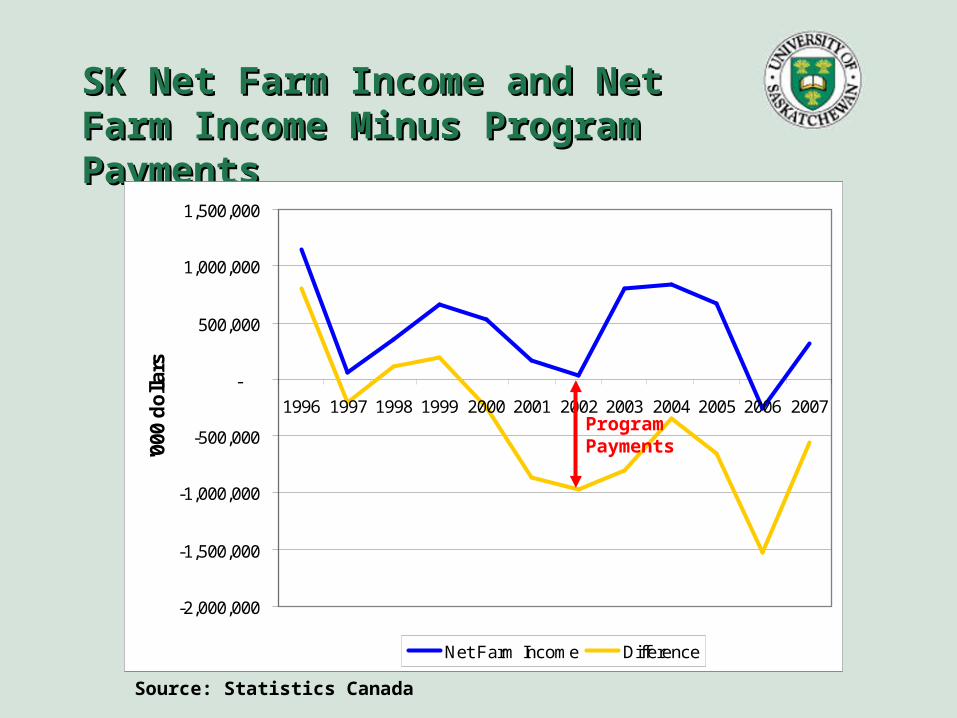
SK Net Farm Income and Net Farm SK Net Farm Income and Net Farm Income Minus Program PaymentsIncome Minus Program Payments
-2,000,000
-1,500,000
-1,000,000
-500,000
-
500,000
1,000,000
1,500,000
1996 1997 1998 1999 2000 2001 2002 2003 2004 2005 2006 2007
'000
do
llars
Net Farm Income Difference
Source: Statistics Canada
Program Payments
“The Obama administration announced a $760 million settlement Tuesday to resolve charges by thousands of Native American farmers and ranchers who say that for decades the Agriculture Department discriminated against them in loan programs.”
Oct. 2010

Opportunities/SolutionsOpportunities/Solutions
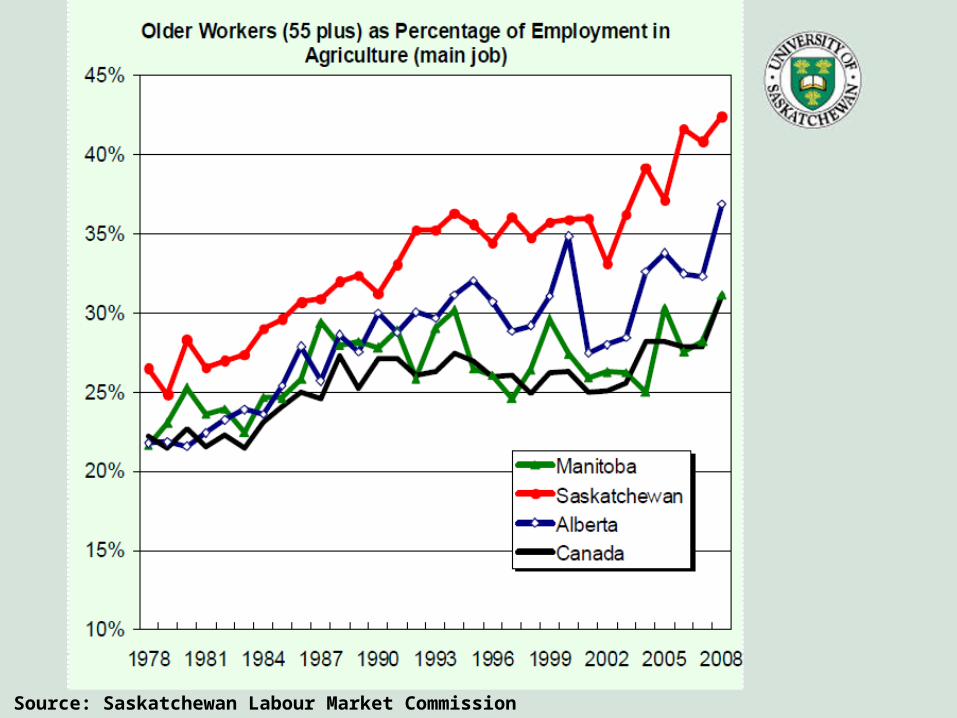
Source: Saskatchewan Labour Market Commission
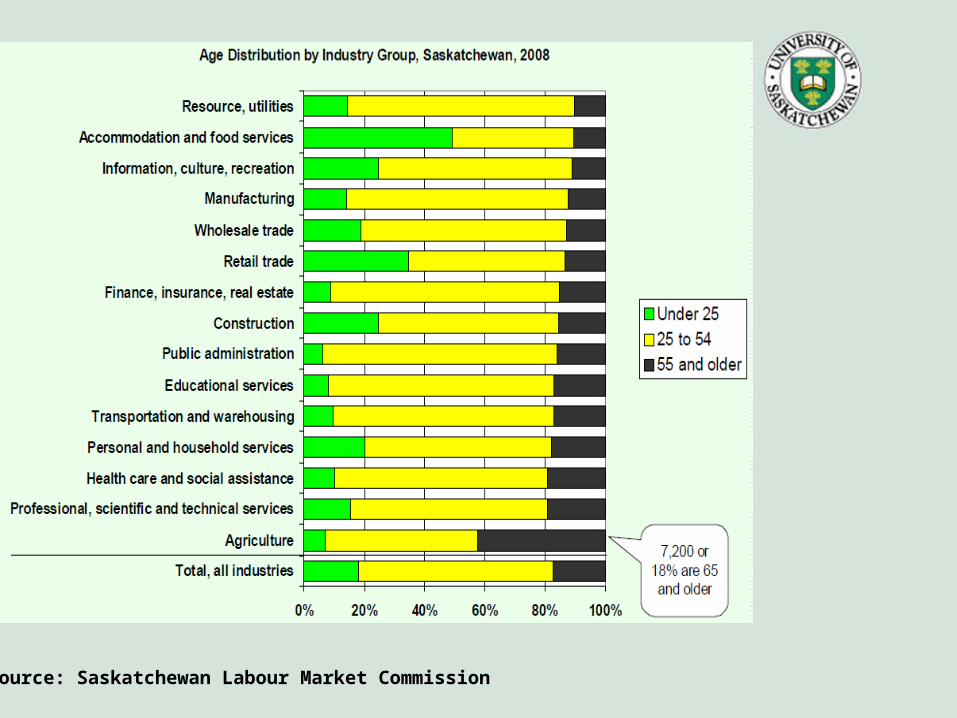
Source: Saskatchewan Labour Market Commission
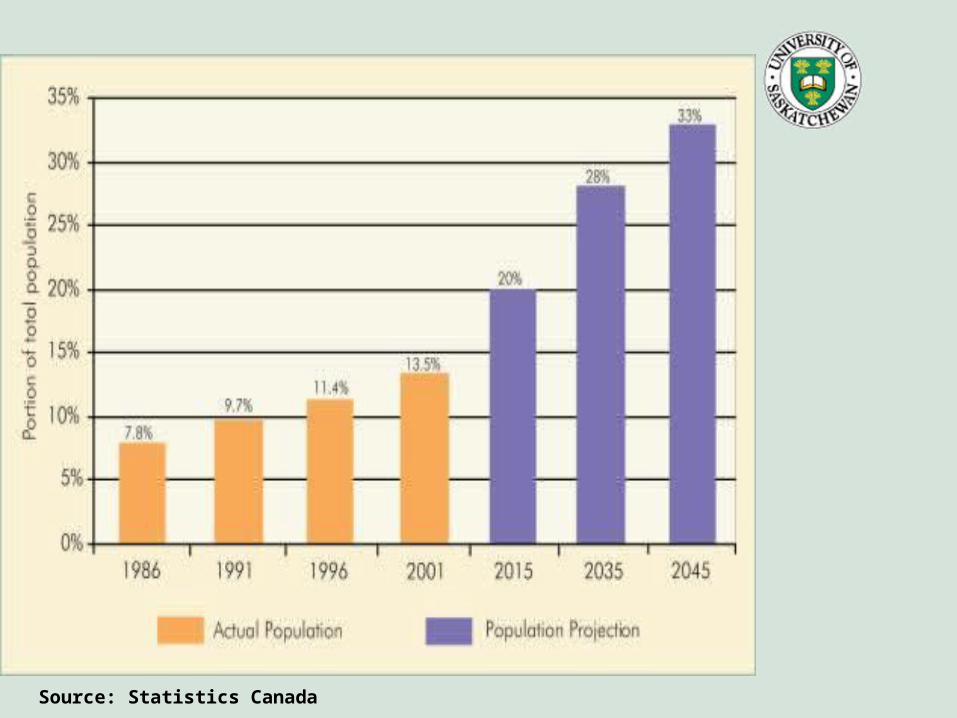
Source: Statistics Canada
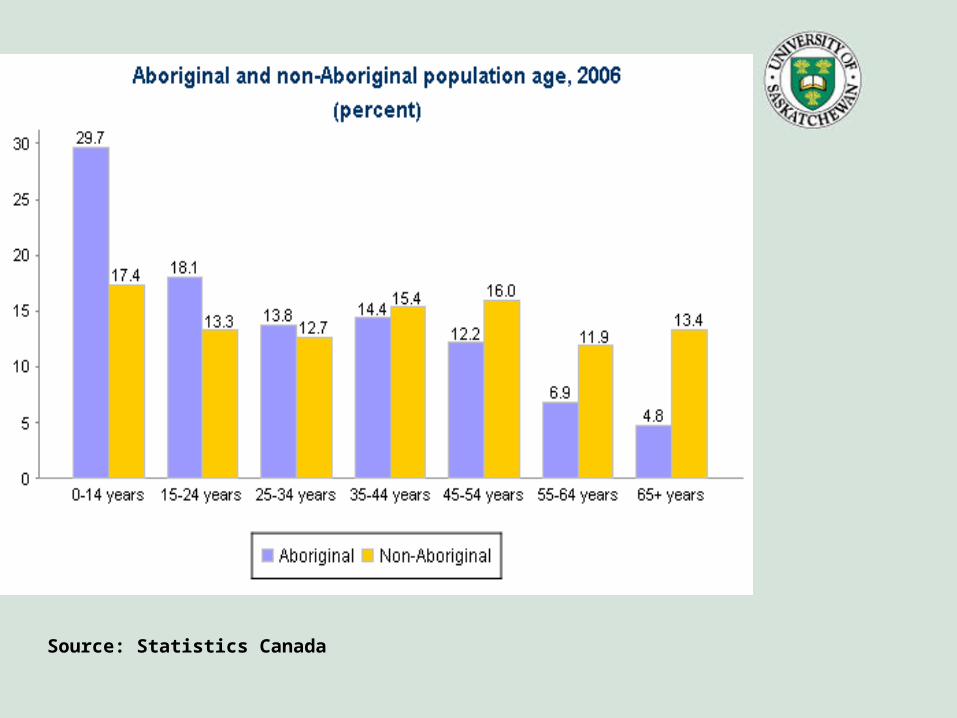
Source: Statistics Canada


““Food security in rural and Food security in rural and remote communities is a real remote communities is a real
issue.”issue.”
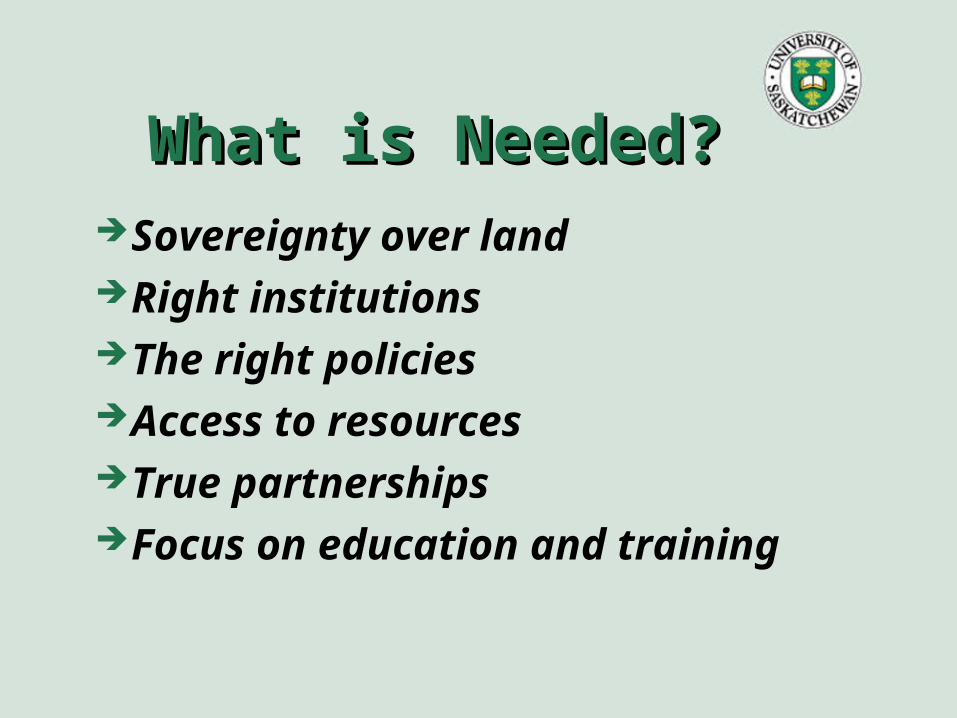
What is Needed?What is Needed?Sovereignty over landRight institutionsThe right policiesAccess to resources True partnershipsFocus on education and training
Recommended