Agricultural Engineering Department
Tamil NaduAgricultural Engineering Department
Tamil Nadu
Date : 12.09. 2012Date : 12.09. 2012
ZONAL CONFERENCE FOR RABI 2012-2013
Agricultural Mechanisation
Objectives:
To meet out the shortage of agricultural labourers
To ensure timeliness in carrying out farm operations
To economize the cost of cultivation and optimizing the
outputs
To increase the food production
To improve the agricultural growth
Agricultural Mechanisation
Schemes Implemented ;
Agricultural Mechanisation Programme under
Macro Management of Agriculture
Demonstration of Agricultural Machinery /
Implements in Farmers’ Fields
Training to Farmers
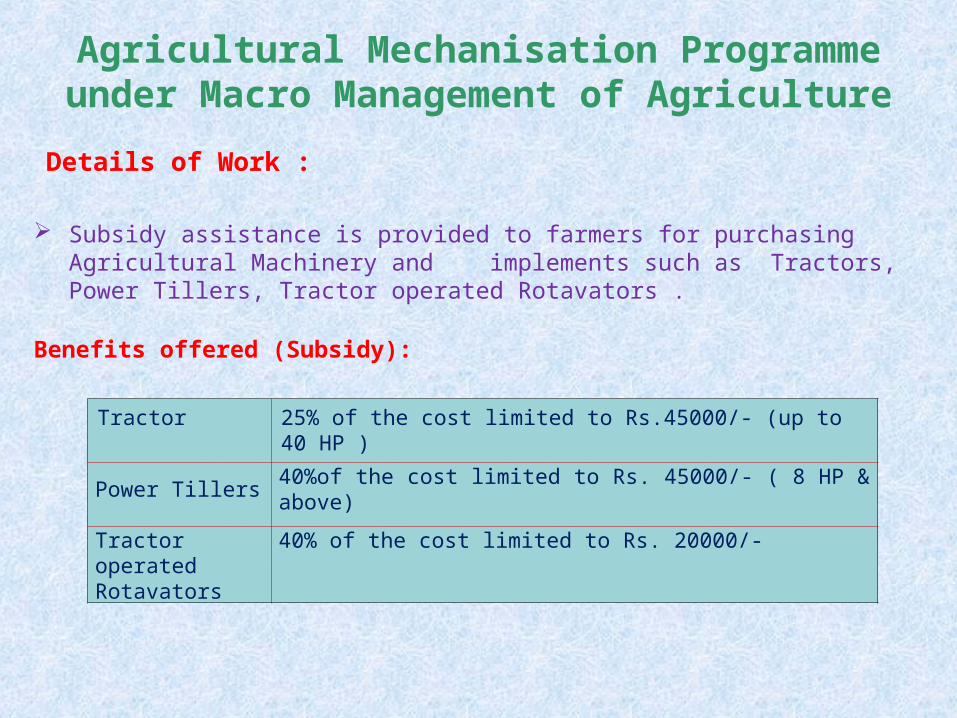
Agricultural Mechanisation Programme under Macro Management of Agriculture
Details of Work :
Subsidy assistance is provided to farmers for purchasing Agricultural Machinery and implements such as Tractors, Power Tillers, Tractor operated Rotavators .
Benefits offered (Subsidy):
Tractor 25% of the cost limited to Rs.45000/- (up to 40 HP )
Power Tillers40%of the cost limited to Rs. 45000/- ( 8 HP & above)
Tractor operated Rotavators
40% of the cost limited to Rs. 20000/-
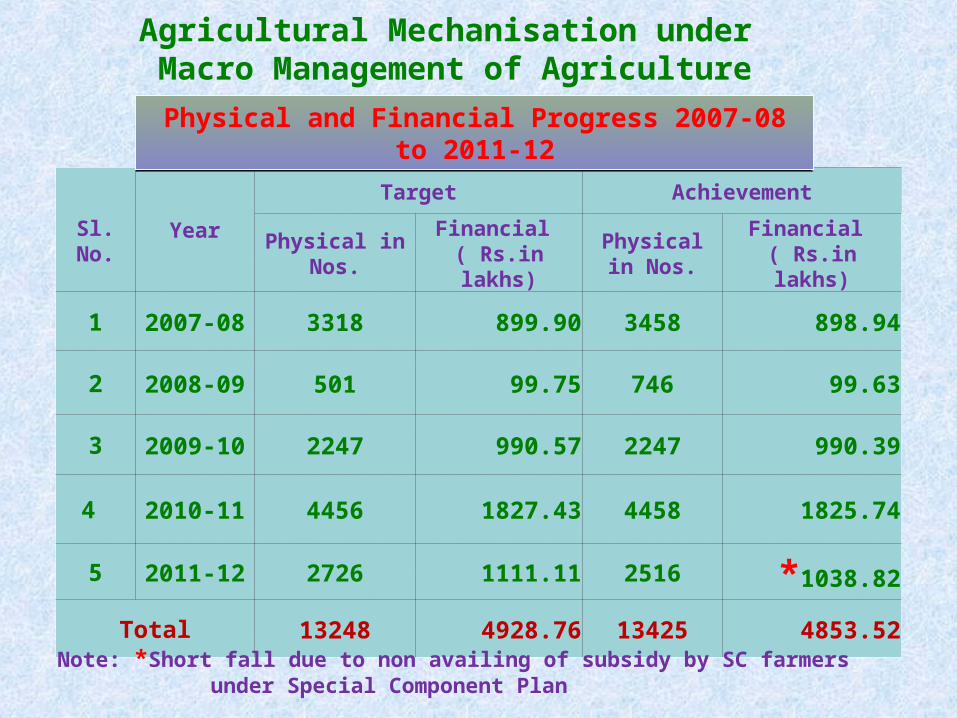
Agricultural Mechanisation under Macro Management of Agriculture
Sl. No.
Year
Target Achievement
Physical in Nos.
Financial ( Rs.in lakhs)
Physical in Nos.
Financial ( Rs.in lakhs)
1 2007-08 3318 899.90 3458 898.94
2 2008-09 501 99.75 746 99.63
3 2009-10 2247 990.57 2247 990.39
4 2010-11 4456 1827.43 4458 1825.74
5 2011-12 2726 1111.11 2516 *1038.82
Total 13248 4928.76 13425 4853.52
Physical and Financial Progress 2007-08 to 2011-12Physical and Financial Progress 2007-08 to 2011-12
Note: *Short fall due to non availing of subsidy by SC farmers under Special Component Plan
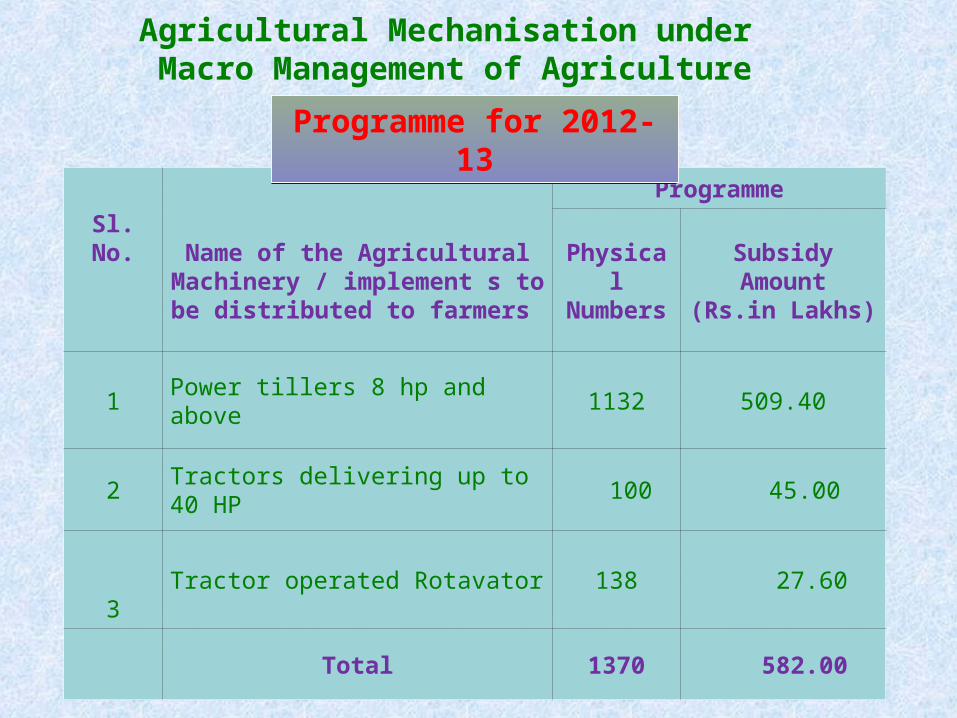
Agricultural Mechanisation under Macro Management of Agriculture
Sl. No. Name of the Agricultural Machinery / implement s to be
distributed to farmers
Programme
Physical Numbers
Subsidy Amount(Rs.in Lakhs)
1 Power tillers 8 hp and above 1132 509.40
2 Tractors delivering up to 40 HP 100 45.00
3Tractor operated Rotavator 138 27.60
Total 1370 582.00
Programme for 2012-13Programme for 2012-13
Demonstration of Agricultural Machinery / Implements in Farmers’ Fields
Objectives:
To Promote and strengthen the Agricultural Mechanisation through Demonstration
To demonstrate new and technologically advanced equipments at farmers field for induction of new technology in agricultural production system
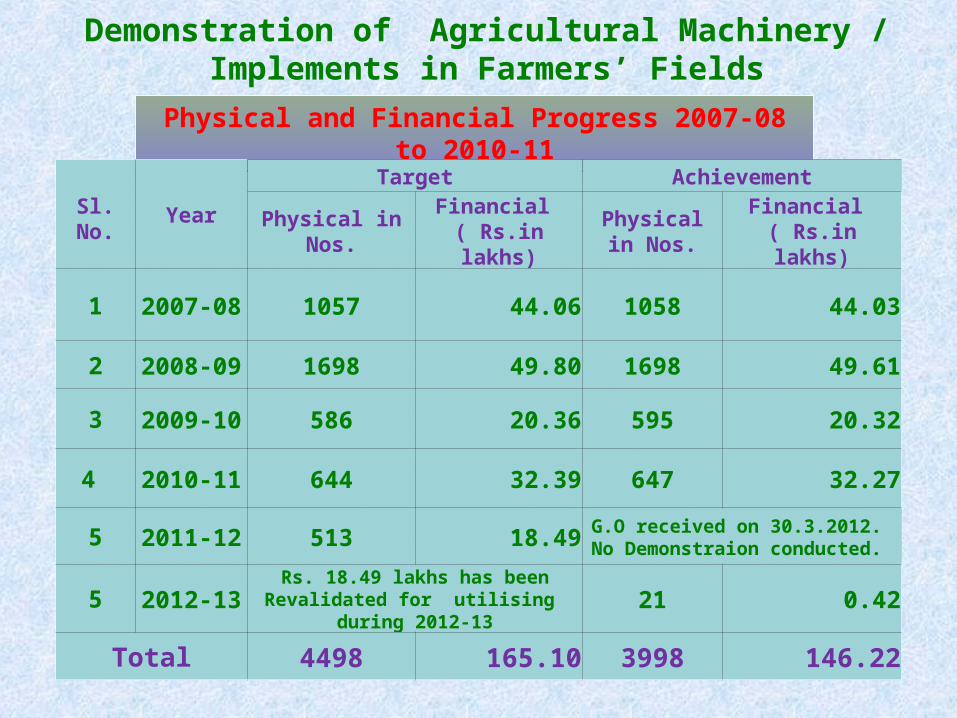
Demonstration of Agricultural Machinery / Implements in Farmers’ Fields
Physical and Financial Progress 2007-08 to 2010-11Physical and Financial Progress 2007-08 to 2010-11
Sl. No.
Year
Target Achievement
Physical in Nos.Financial
( Rs.in lakhs)Physical in
Nos.Financial
( Rs.in lakhs)
1 2007-08 1057 44.06 1058 44.03
2 2008-09 1698 49.80 1698 49.61
3 2009-10 586 20.36 595 20.32
4 2010-11 644 32.39 647 32.27
5 2011-12 513 18.49 G.O received on 30.3.2012. No Demonstraion conducted.
5 2012-13 Rs. 18.49 lakhs has been Revalidated for utilising during 2012-13 21 0.42
Total 4498 165.10 3998 146.22
Training to Farmers
Objectives:
To impart training to farmers in handling and
maintenance of agricultural machinery.
To improve the quality of manpower engaged
in the field of Agricultural Mechanisation
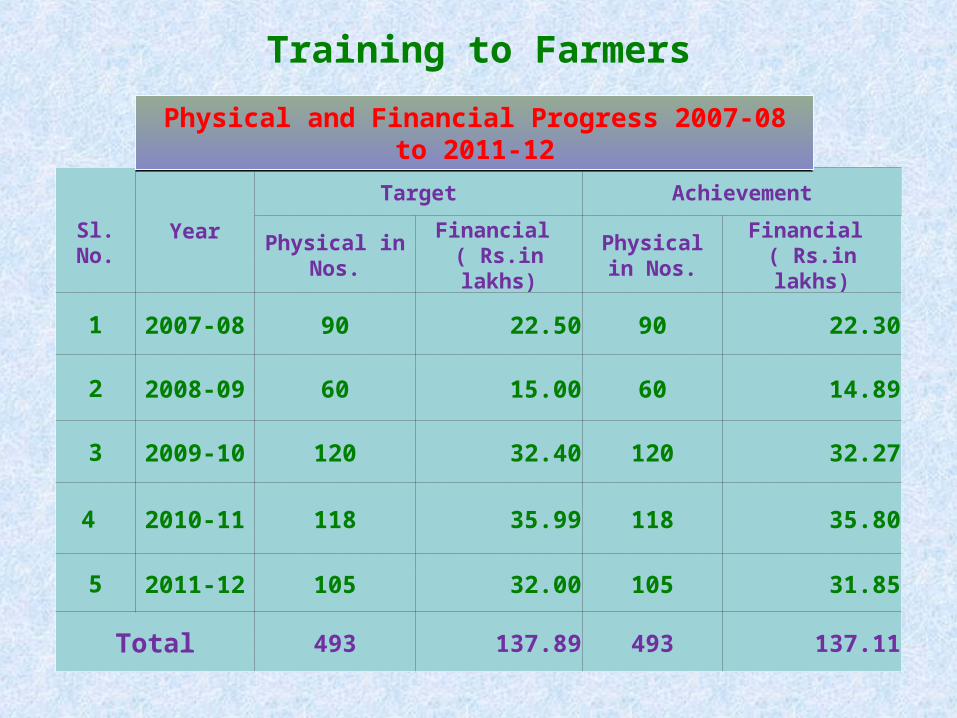
Training to Farmers
Sl. No.
Year
Target Achievement
Physical in Nos.
Financial ( Rs.in lakhs)
Physical in Nos.
Financial ( Rs.in lakhs)
1 2007-08 90 22.50 90 22.30
2 2008-09 60 15.00 60 14.89
3 2009-10 120 32.40 120 32.27
4 2010-11 118 35.99 118 35.80
5 2011-12 105 32.00 105 31.85
Total 493 137.89 493 137.11
Physical and Financial Progress 2007-08 to 2011-12Physical and Financial Progress 2007-08 to 2011-12
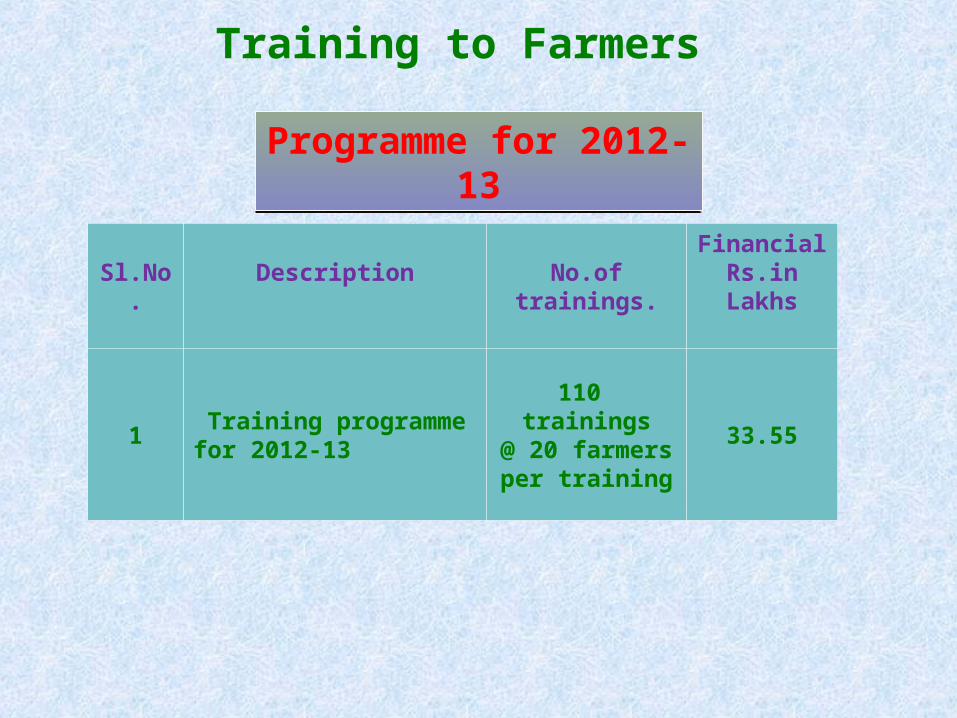
Sl.No.Description
No.of trainings.
Financial Rs.in Lakhs
1 Training programme for 2012-13
110 trainings@ 20 farmers per
training33.55
Programme for 2012-13Programme for 2012-13
Training to Farmers
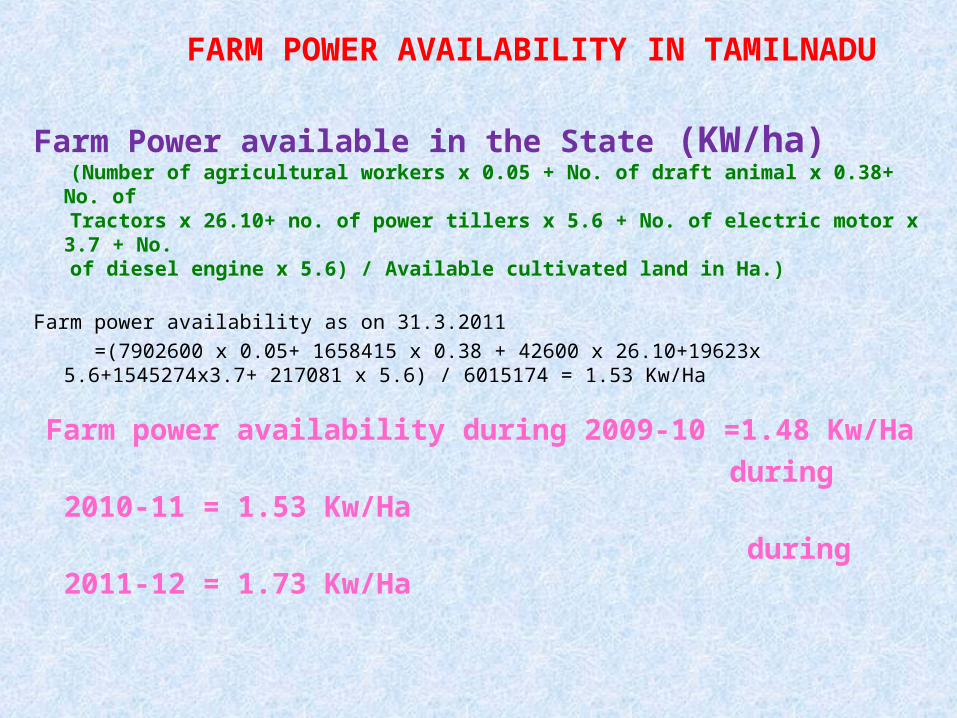
FARM POWER AVAILABILITY IN TAMILNADU
Farm Power available in the State (KW/ha) (Number of agricultural workers x 0.05 + No. of draft animal x 0.38+ No. of Tractors x 26.10+ no. of power tillers x 5.6 + No. of electric motor x 3.7 + No. of diesel engine x 5.6) / Available cultivated land in Ha.)
Farm power availability as on 31.3.2011
=(7902600 x 0.05+ 1658415 x 0.38 + 42600 x 26.10+19623x 5.6+1545274x3.7+ 217081 x 5.6) / 6015174 = 1.53 Kw/Ha
Farm power availability during 2009-10 =1.48 Kw/Ha
during 2010-11 = 1.53 Kw/Ha
during 2011-12 = 1.73 Kw/Ha
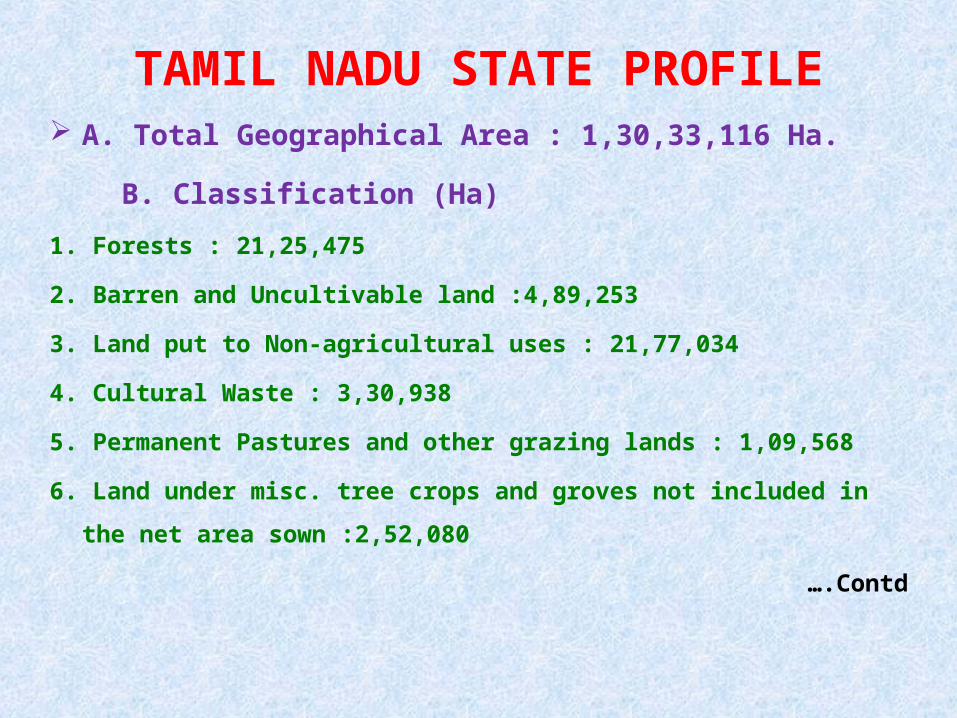
TAMIL NADU STATE PROFILE A. Total Geographical Area : 1,30,33,116 Ha.
B. Classification (Ha)
1. Forests : 21,25,475
2. Barren and Uncultivable land :4,89,253
3. Land put to Non-agricultural uses : 21,77,034
4. Cultural Waste : 3,30,938
5. Permanent Pastures and other grazing lands : 1,09,568
6. Land under misc. tree crops and groves not included in the net area
sown :2,52,080
….Contd
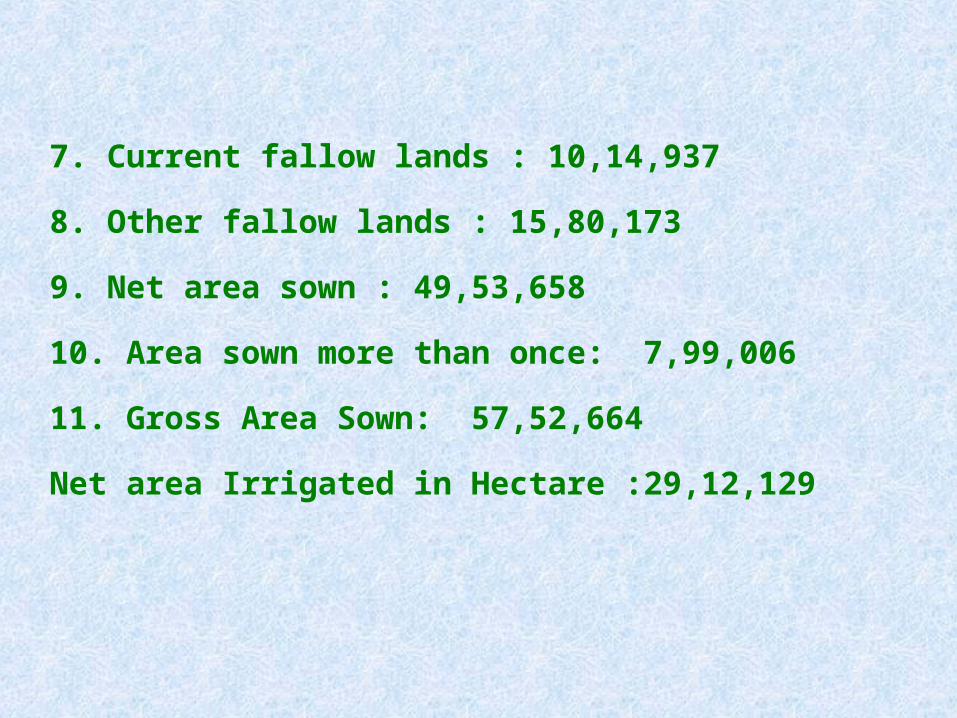
7. Current fallow lands : 10,14,937
8. Other fallow lands : 15,80,173
9. Net area sown : 49,53,658
10. Area sown more than once: 7,99,006
11. Gross Area Sown: 57,52,664
Net area Irrigated in Hectare :29,12,129
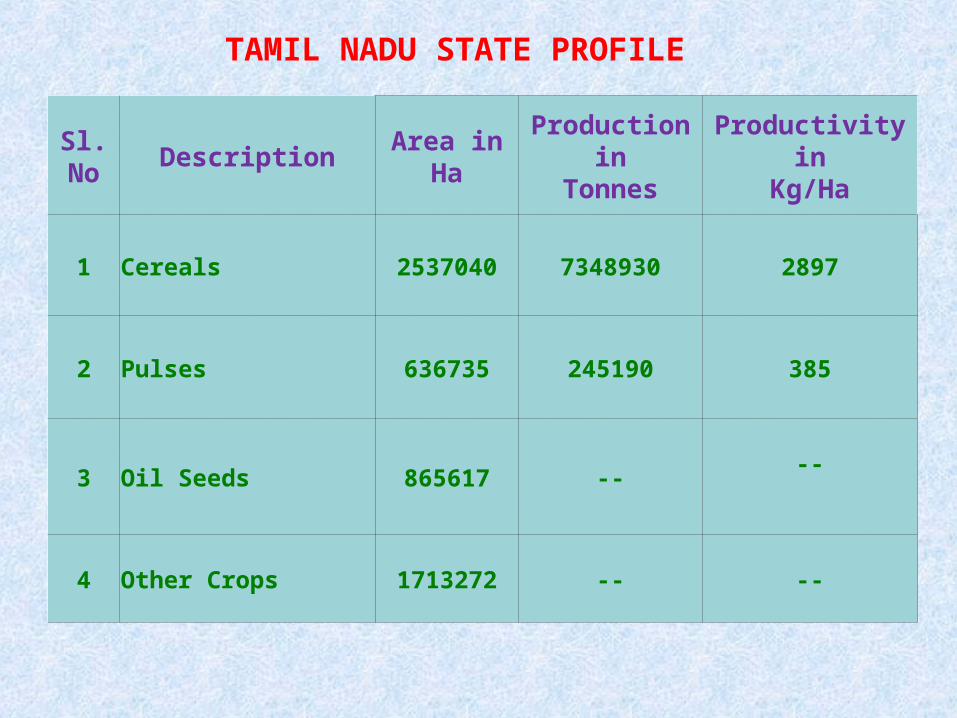
TAMIL NADU STATE PROFILE
Sl.No
Description Area in HaProduction in
TonnesProductivity in
Kg/Ha
1 Cereals 2537040 7348930 2897
2 Pulses 636735 245190 385
3 Oil Seeds 865617 ----
4 Other Crops 1713272 -- --
Recommended