1
LegrandGeneral Meeting of Shareholders
Wednesday, 7 June 2006
2
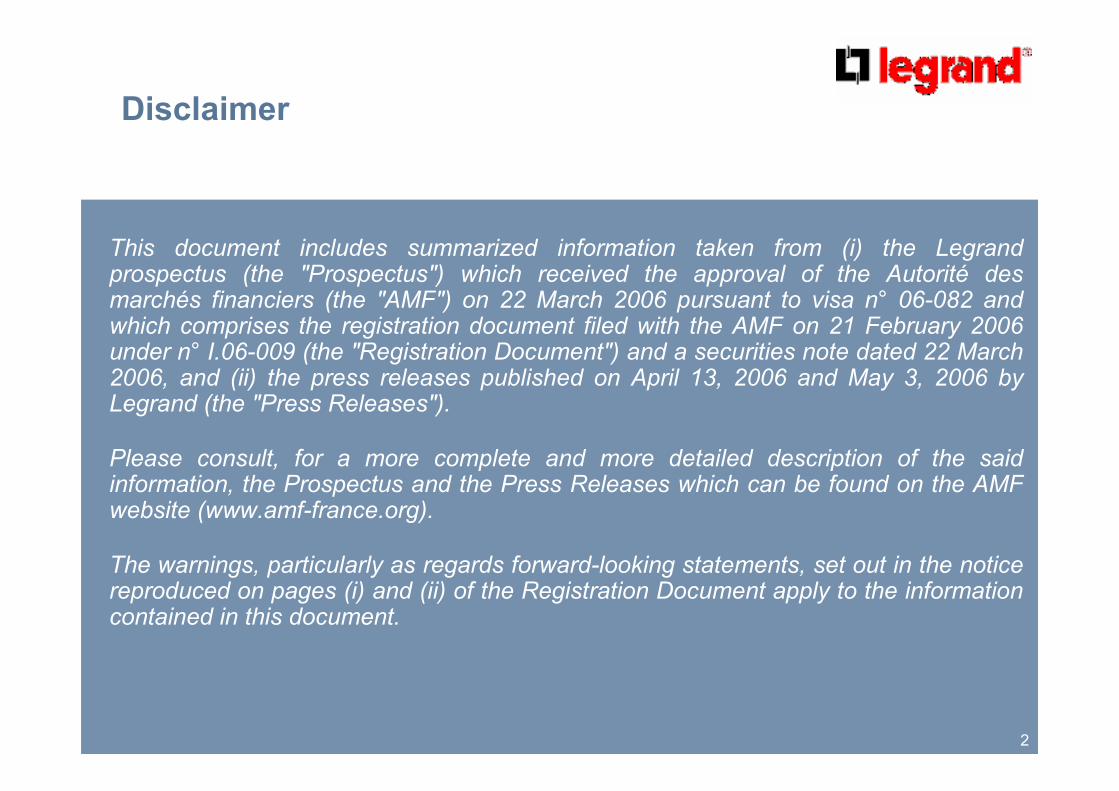
Disclaimer
This document includes summarized information taken from (i) the Legrand prospectus (the "Prospectus") which received the approval of the Autorité des marchés financiers (the "AMF") on 22 March 2006 pursuant to visa n° 06-082 and which comprises the registration document filed with the AMF on 21 February 2006 under n° I.06-009 (the "Registration Document") and a securities note dated 22 March 2006, and (ii) the press releases published on April 13, 2006 and May 3, 2006 by Legrand (the "Press Releases").
Please consult, for a more complete and more detailed description of the said information, the Prospectus and the Press Releases which can be found on the AMF website (www.amf-france.org).
The warnings, particularly as regards forward-looking statements, set out in the notice reproduced on pages (i) and (ii) of the Registration Document apply to the information contained in this document.
3
Agenda
� Legrand today
� Financial summary
� Shareholders, corporate governance and sustainable development
� Q&A session
� Presentation of resolutions and vote
4
Legrand today
5
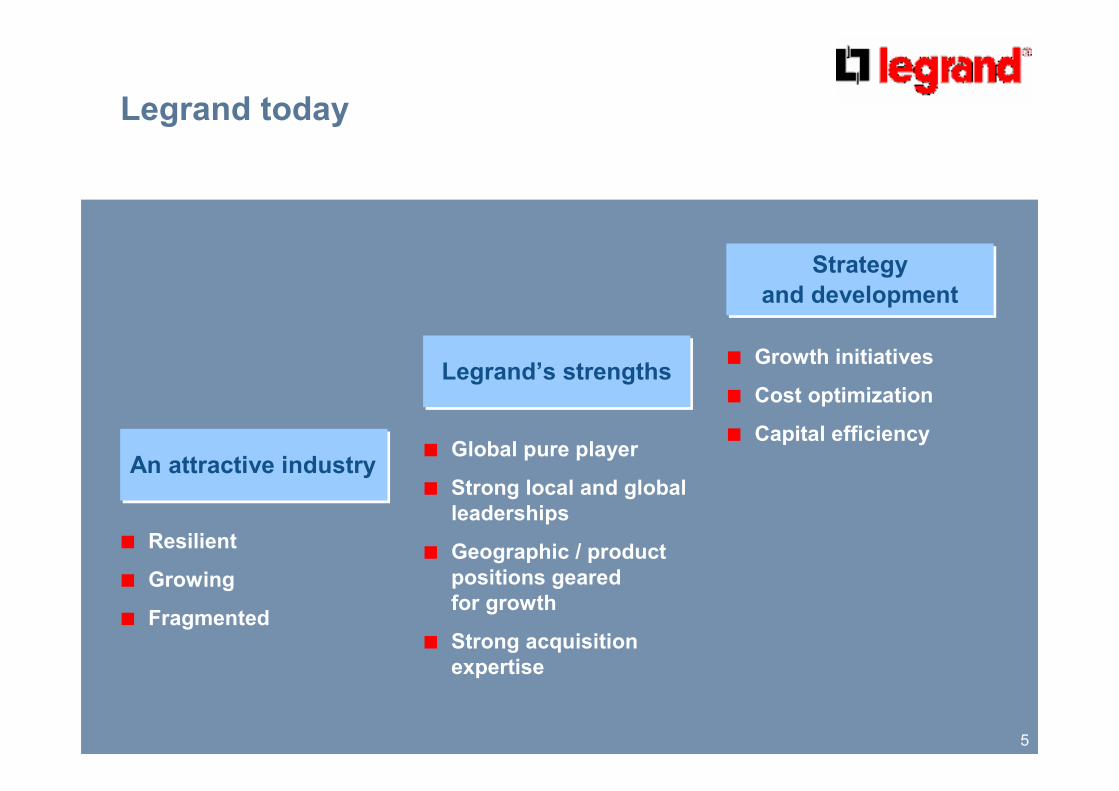
Legrand today
� Global pure player
� Strong local and global
leaderships
� Geographic / product
positions geared
for growth
� Strong acquisition
expertise
� Growth initiatives
� Cost optimization
� Capital efficiency
� Resilient
� Growing
� Fragmented
Legrand’s strengthsLegrand’s strengths
Strategy
and development
Strategy
and development
An attractive industryAn attractive industry
6
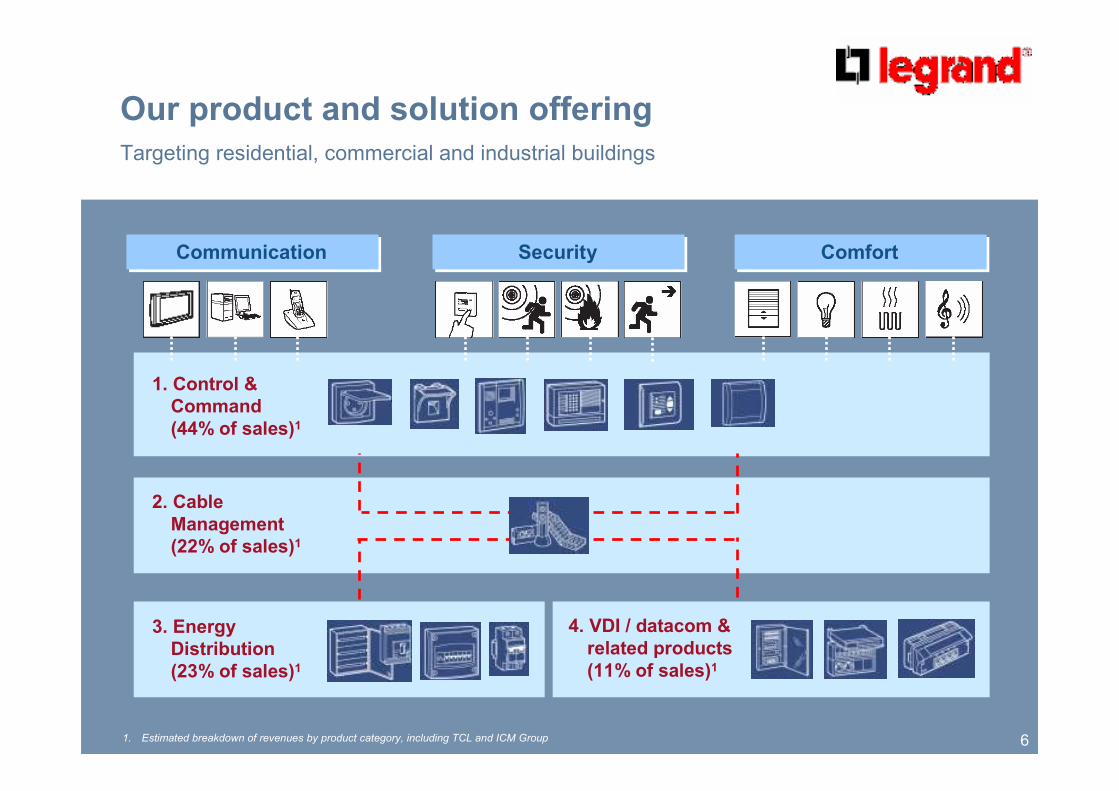
Our product and solution offering
1. Control &
Command
(44% of sales)1
ComfortComfortSecuritySecurityCommunicationCommunication
2. Cable
Management
(22% of sales)1
3. Energy
Distribution
(23% of sales)1
4. VDI / datacom &
related products
(11% of sales)1
Targeting residential, commercial and industrial buildings
1. Estimated breakdown of revenues by product category, including TCL and ICM Group
7
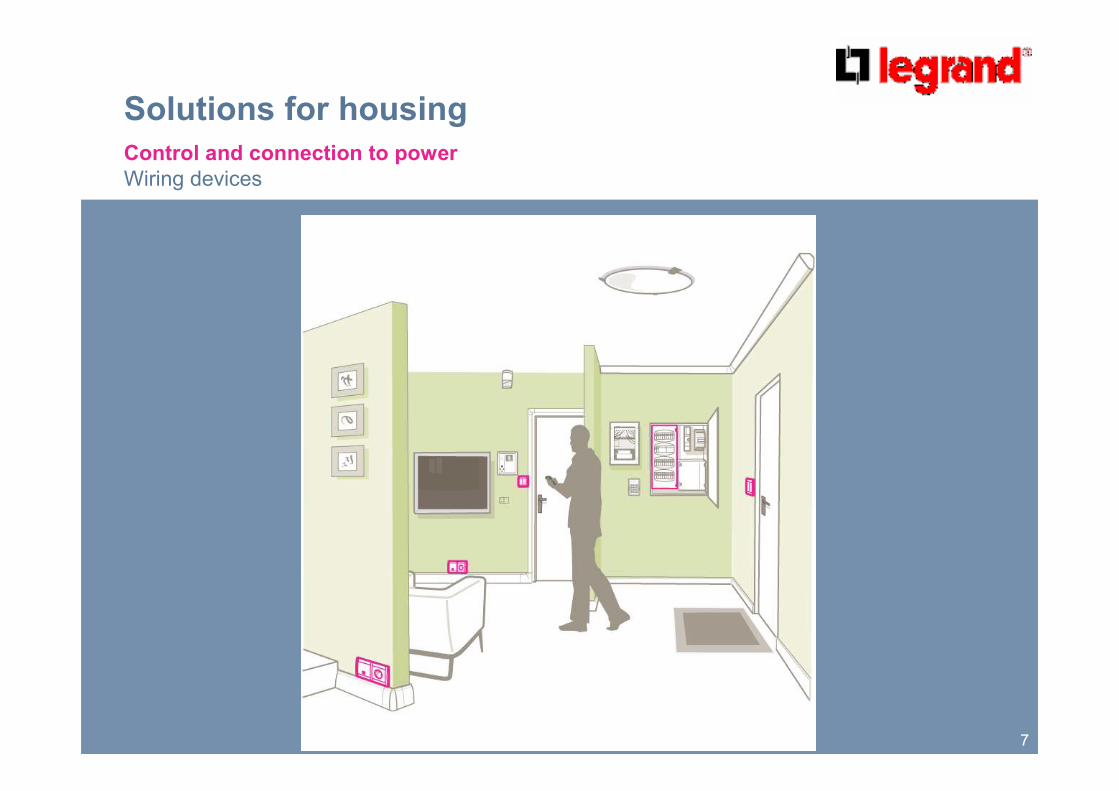
Solutions for housing
Control and connection to power
Wiring devices
8
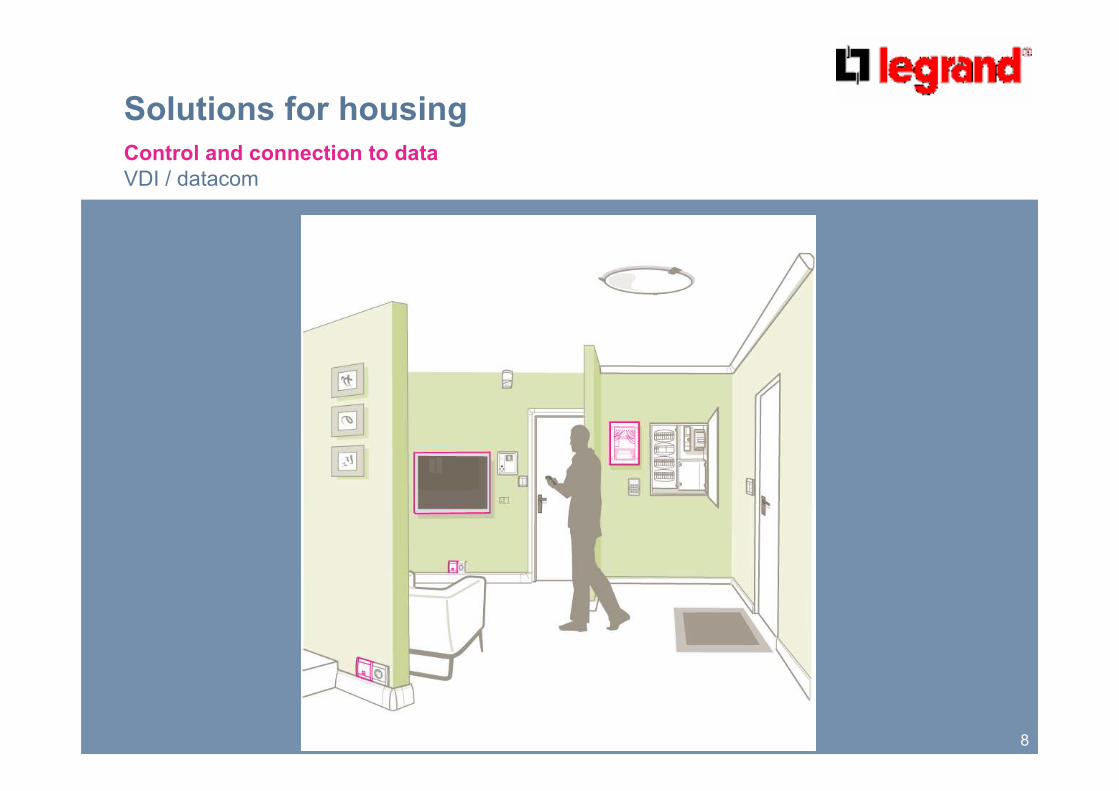
Solutions for housing
Control and connection to data
VDI / datacom
9
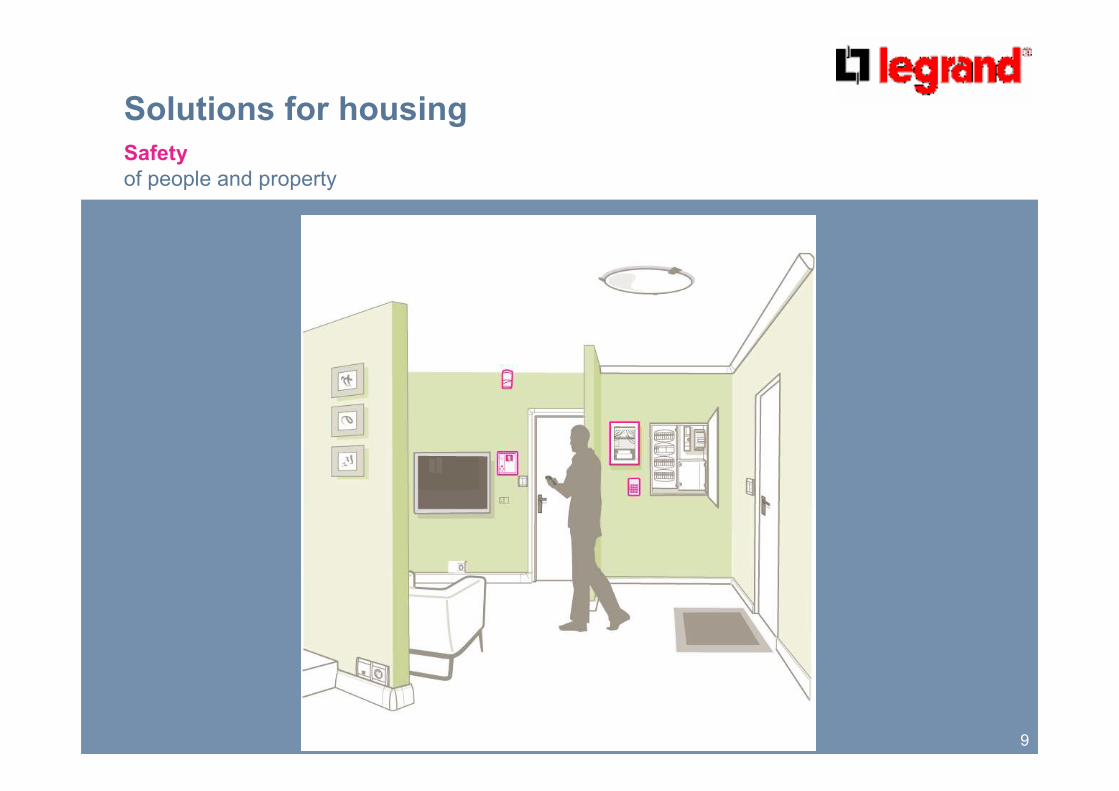
Solutions for housing
Safety
of people and property
10
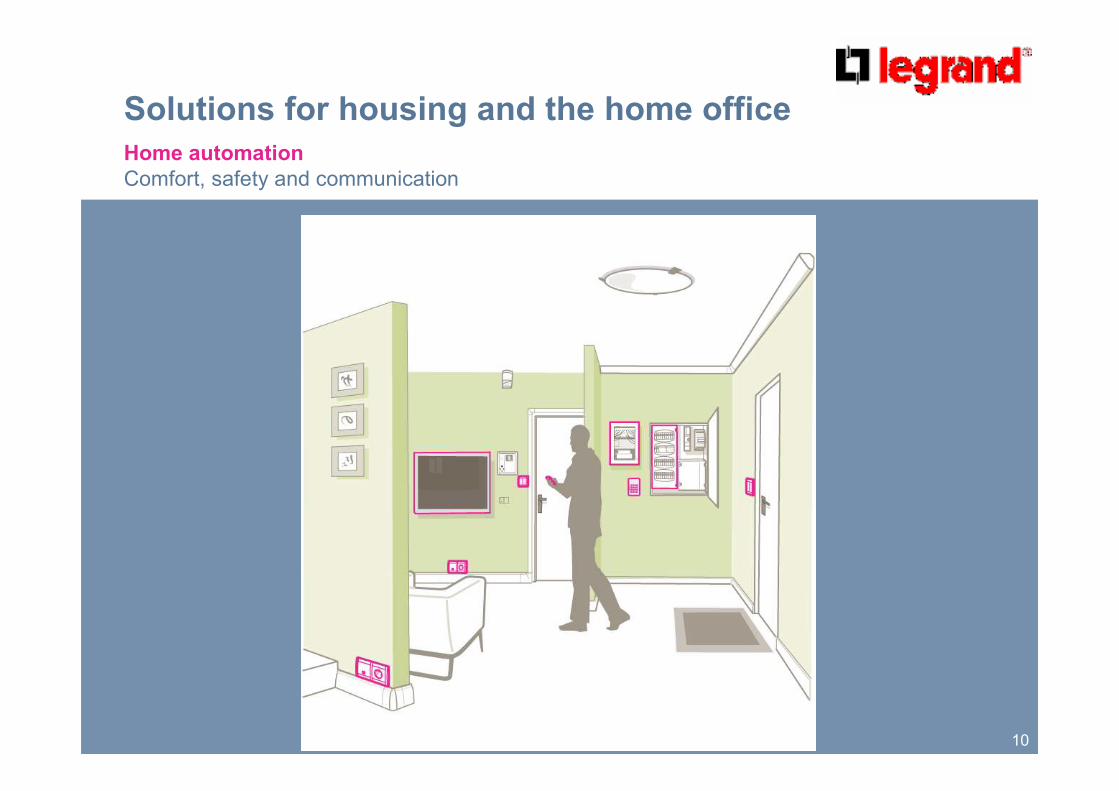
Solutions for housing and the home office
Home automation
Comfort, safety and communication
11
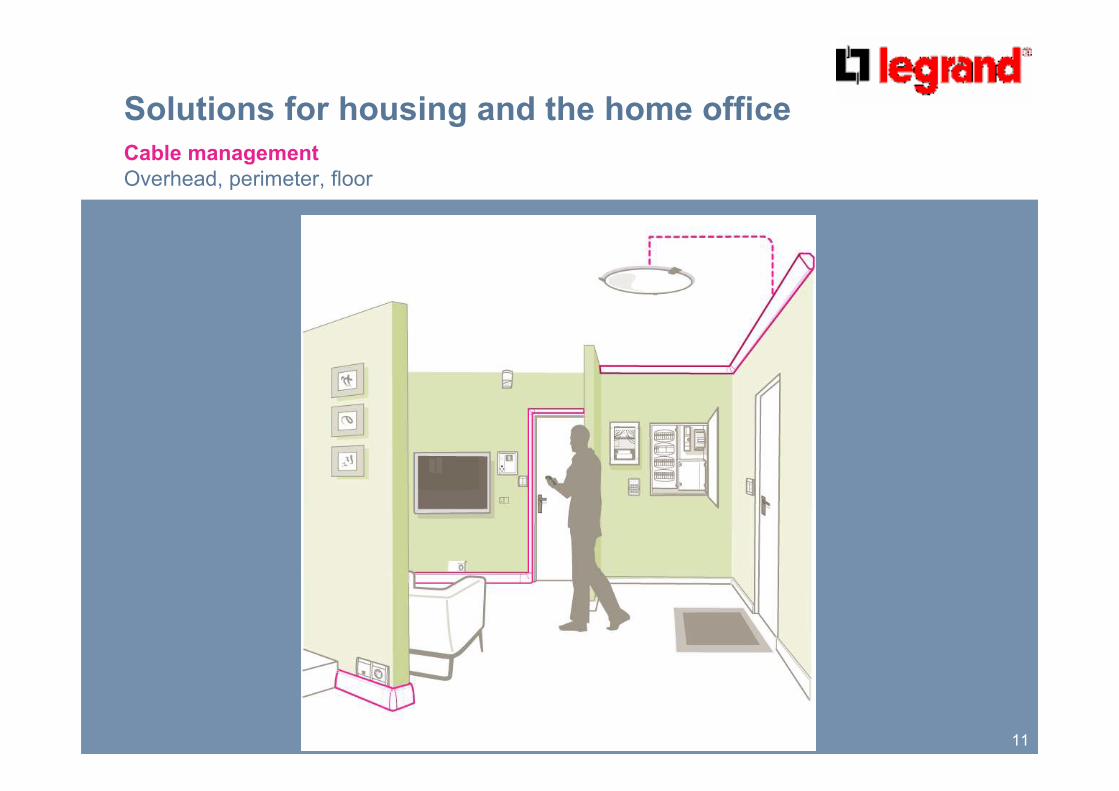
Solutions for housing and the home office
Cable management
Overhead, perimeter, floor
12
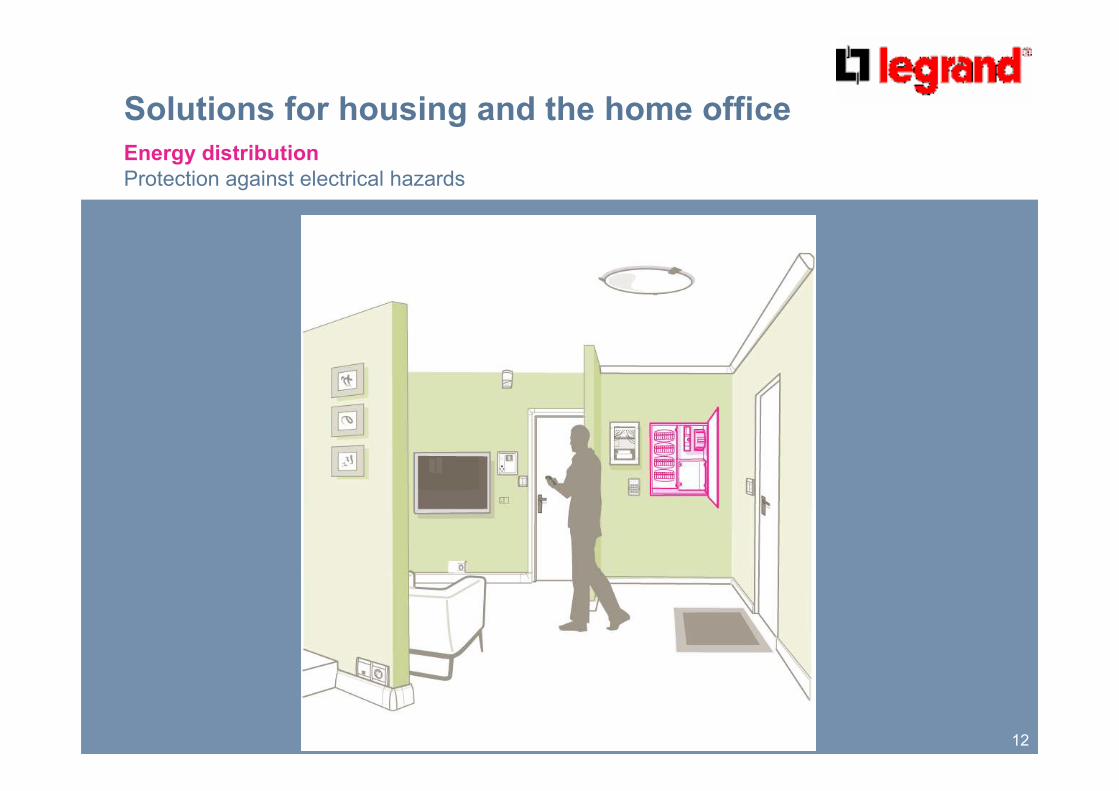
Solutions for housing and the home office
Energy distribution
Protection against electrical hazards
13
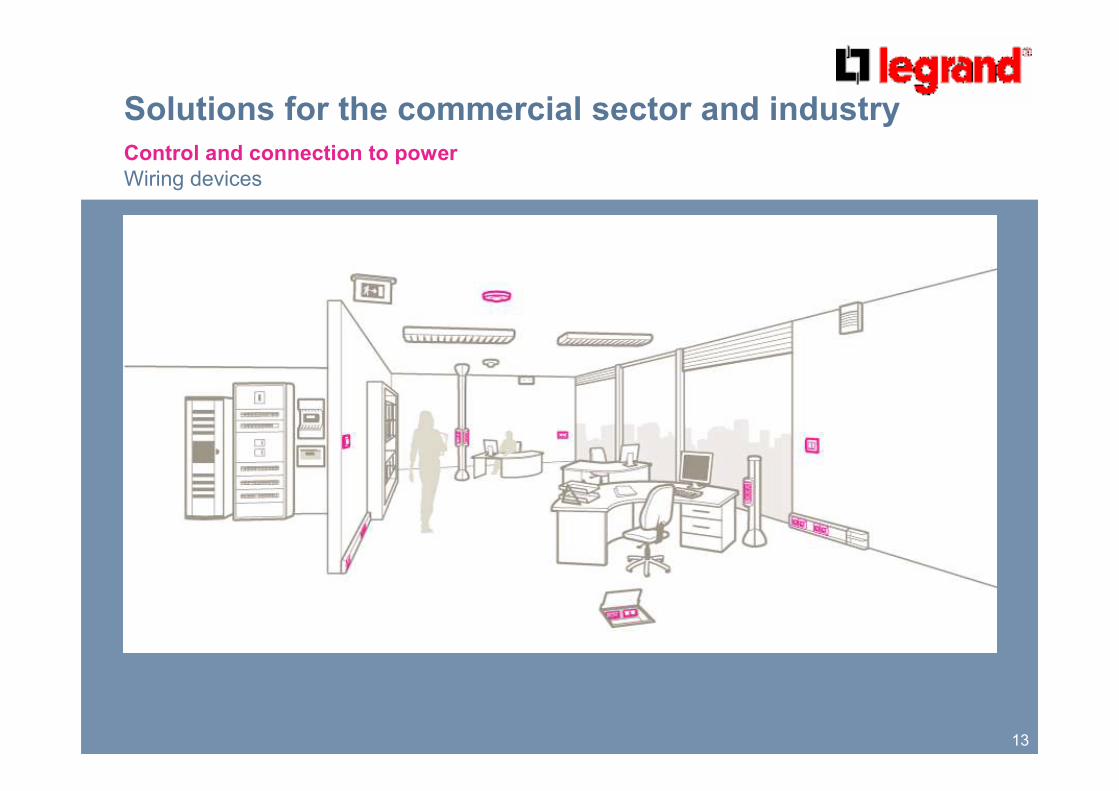
Solutions for the commercial sector and industry
Control and connection to power
Wiring devices
14
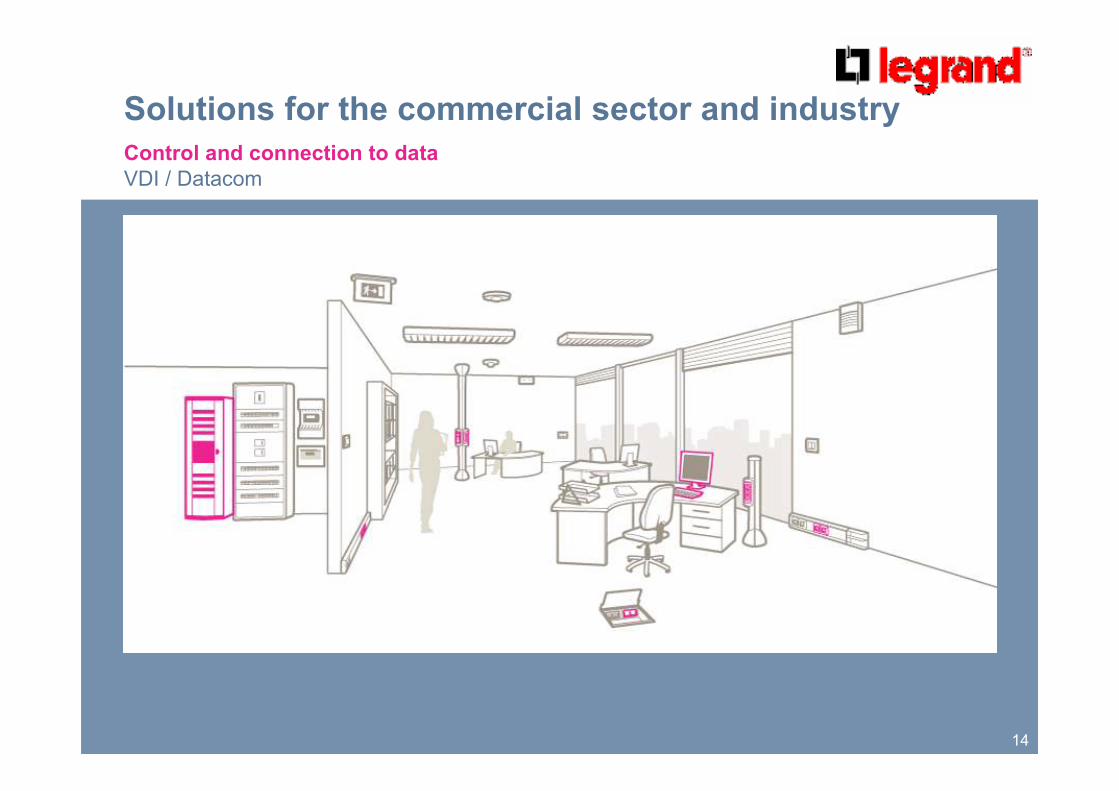
Solutions for the commercial sector and industry
Control and connection to data
VDI / Datacom
15
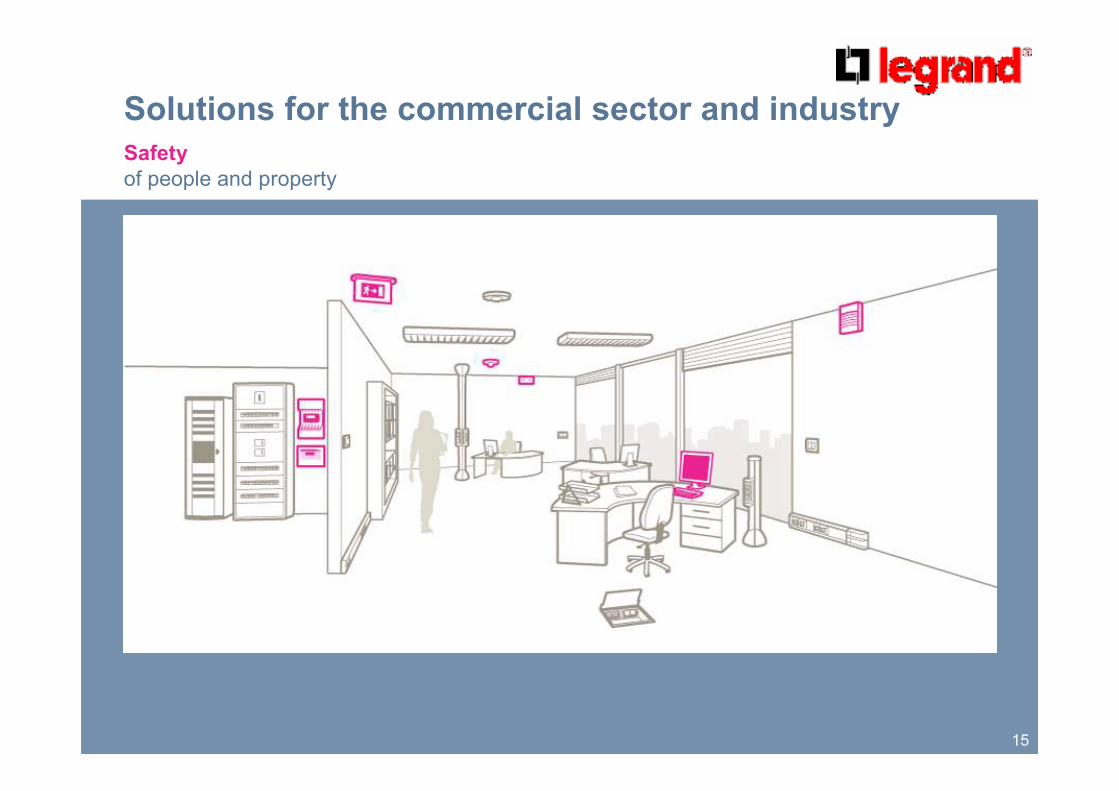
Solutions for the commercial sector and industry
Safety
of people and property
16
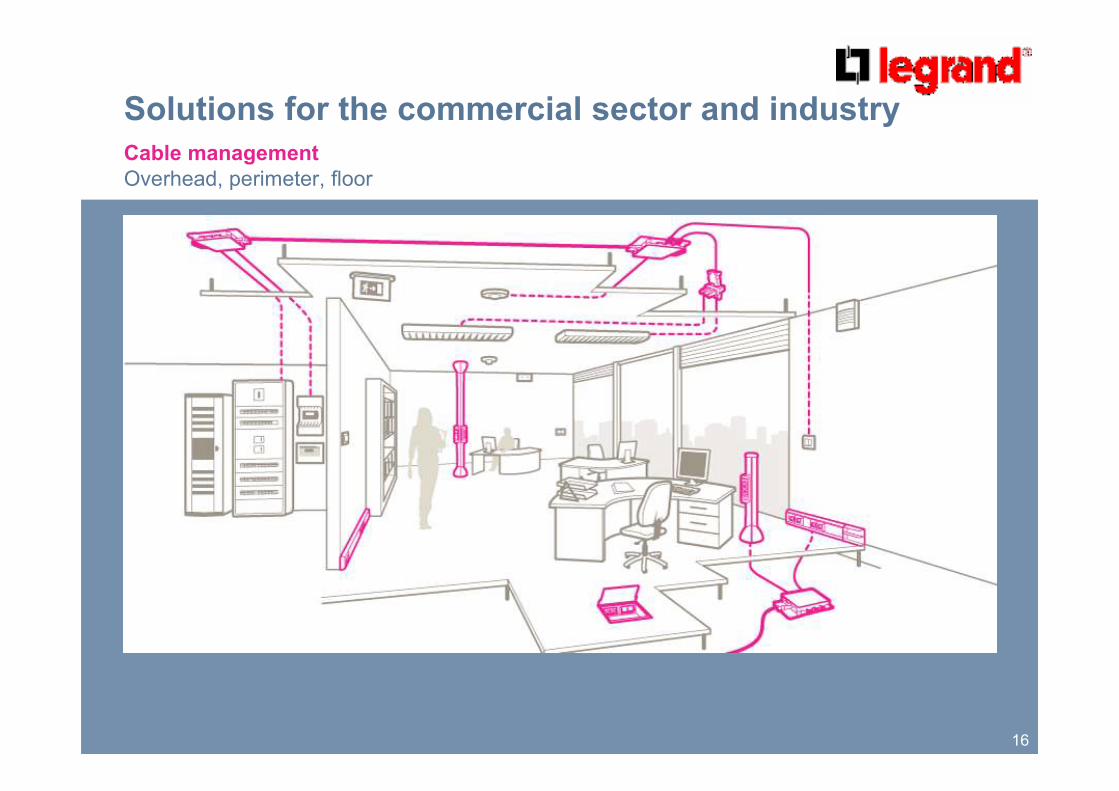
Solutions for the commercial sector and industry
Cable management
Overhead, perimeter, floor
17
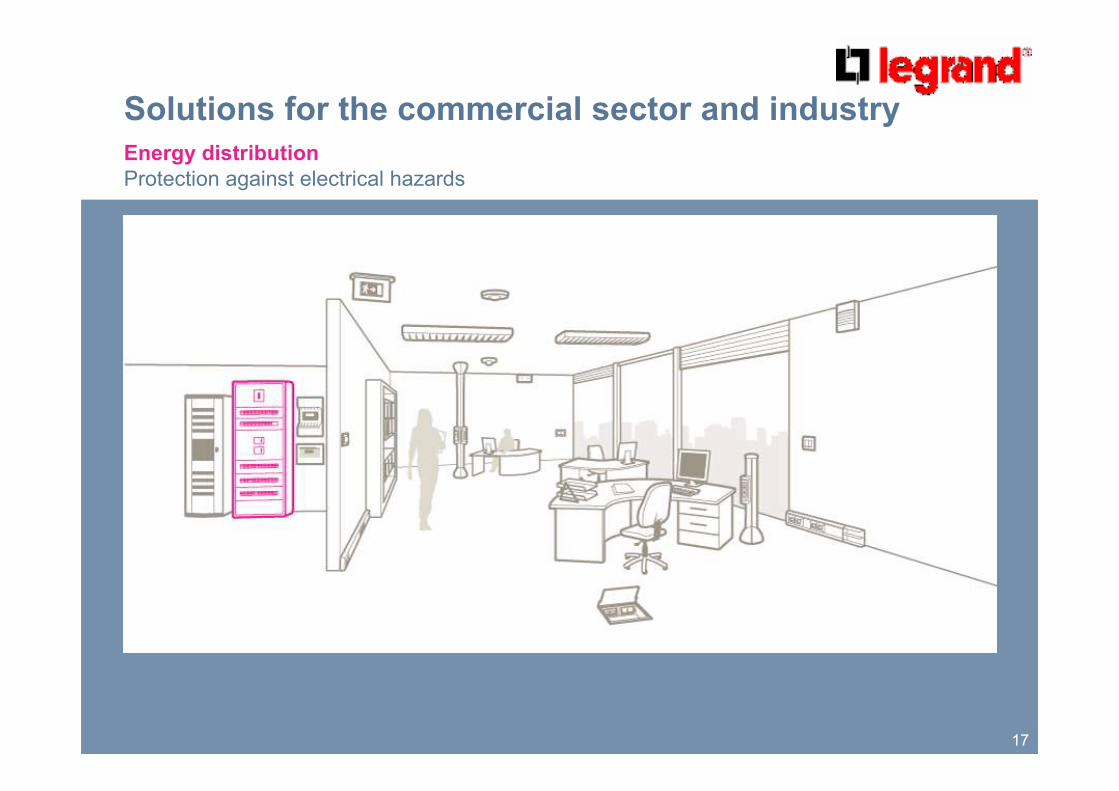
Solutions for the commercial sector and industry
Energy distribution
Protection against electrical hazards
18
An Attractive Industry Offering
Resilience and Growth
19
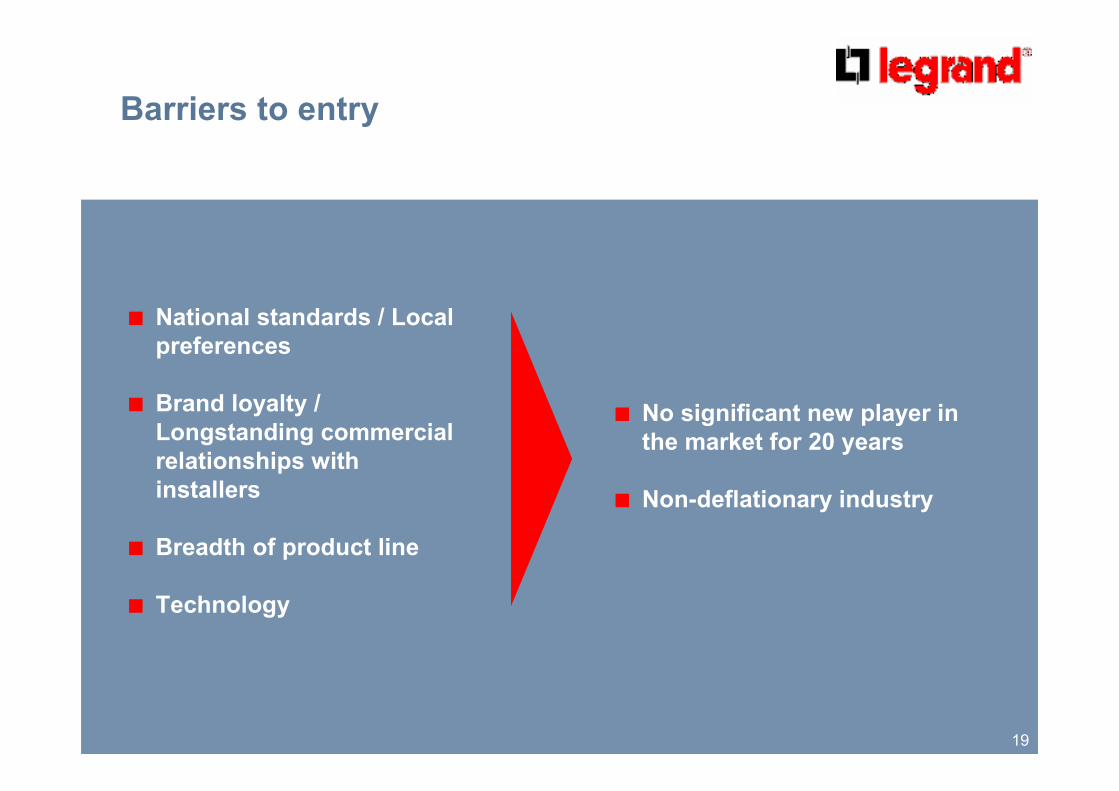
Barriers to entry
� National standards / Local
preferences
� Brand loyalty /
Longstanding commercial
relationships with
installers
� Breadth of product line
� Technology
� No significant new player in
the market for 20 years
� Non-deflationary industry
20
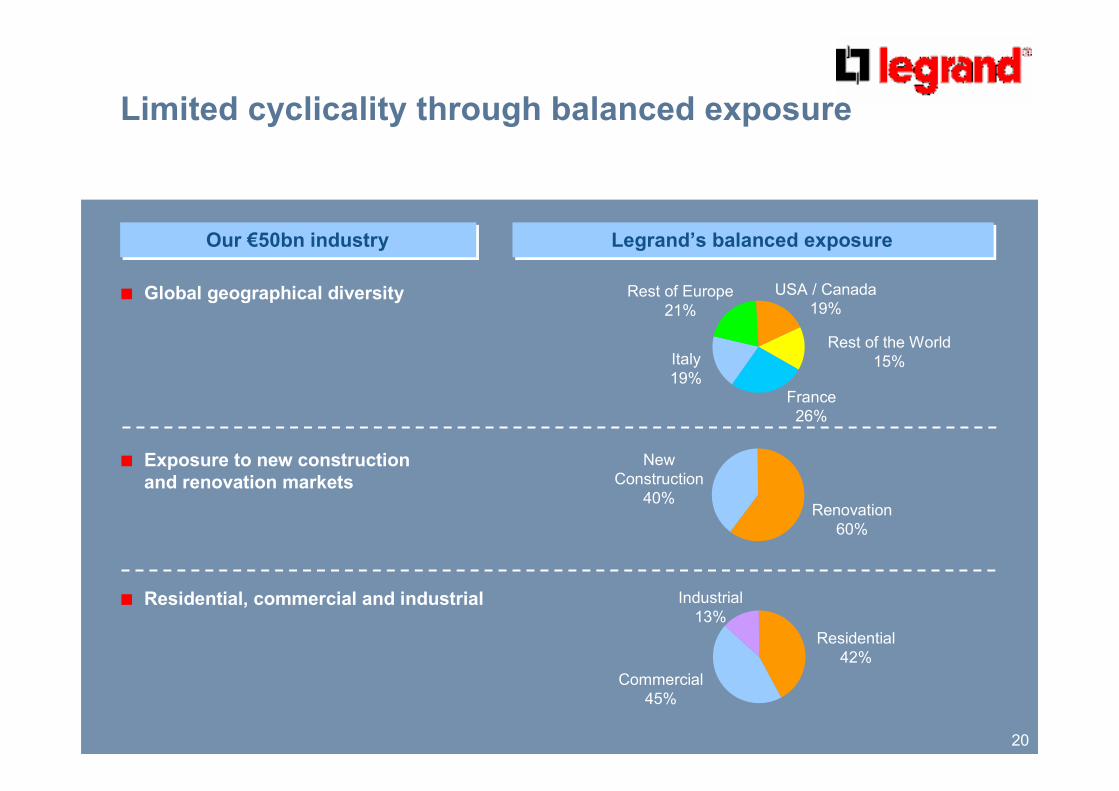
Legrand’s balanced exposureLegrand’s balanced exposureOur €50bn industry Our €50bn industry
� Global geographical diversity
� Exposure to new construction
and renovation markets
� Residential, commercial and industrial
New
Construction
40%Renovation
60%
Commercial
45%
Residential
42%
Industrial
13%
Limited cyclicality through balanced exposure
France
26%
Rest of Europe
21%
Rest of the World
15%Italy
19%
USA / Canada
19%
21
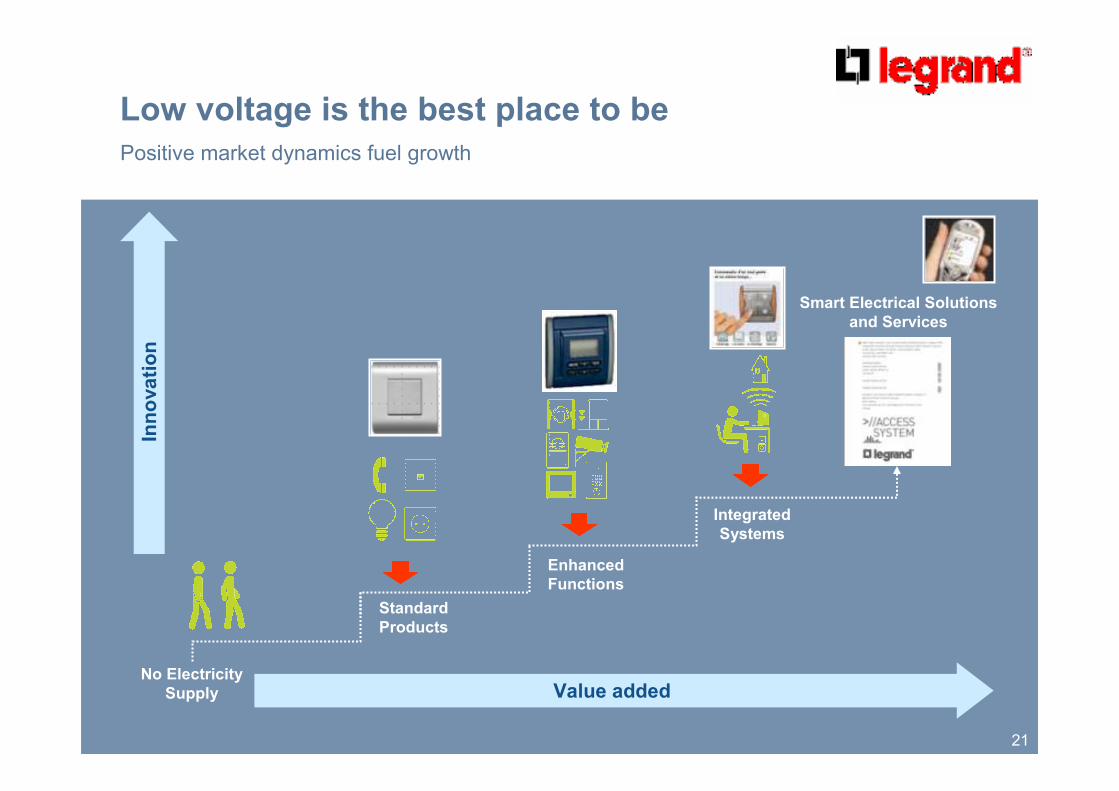
Low voltage is the best place to be
Value added
Innovation
No Electricity
Supply
Standard
Products
Enhanced
Functions
Integrated
Systems
Smart Electrical Solutions
and Services
Positive market dynamics fuel growth
22
Legrand’s Strengths
23
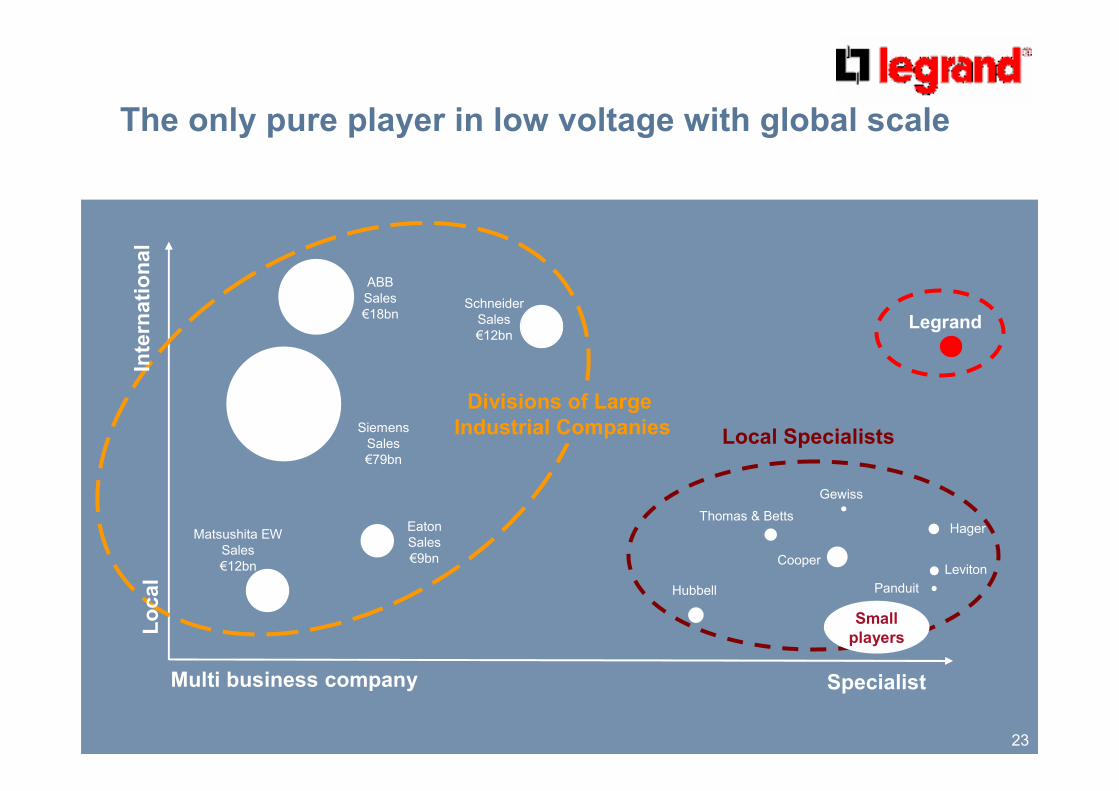
The only pure player in low voltage with global scale
SpecialistMulti business company
Cooper
Hubbell
Gewiss
Hager
Schneider
Sales
€12bn
ABB
Sales
€18bn
Matsushita EW
Sales
€12bn
Eaton
Sales
€9bn
Panduit
Local Specialists
Small
players
Thomas & Betts
Siemens
Sales
€79bn
Leviton
Legrand
Divisions of Large
Industrial Companies
International
Local
24
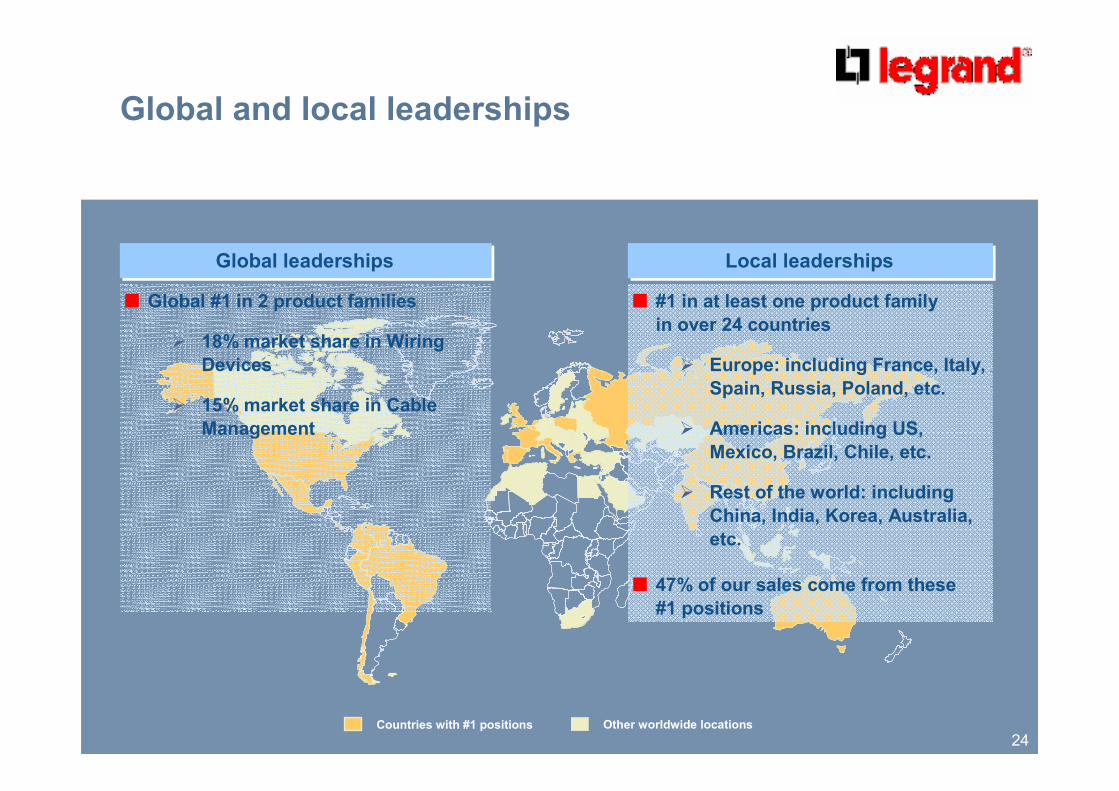
Global and local leaderships
Local leadershipsLocal leadershipsGlobal leadershipsGlobal leaderships
� Global #1 in 2 product families
� 18% market share in Wiring
Devices
� 15% market share in Cable
Management
� #1 in at least one product family
in over 24 countries
� Europe: including France, Italy,
Spain, Russia, Poland, etc.
� Americas: including US,
Mexico, Brazil, Chile, etc.
� Rest of the world: including
China, India, Korea, Australia,
etc.
� 47% of our sales come from these
#1 positions
Other worldwide locationsCountries with #1 positions
25
Acknowledged know-how in terms of acquisitions
� Historically, acquisitions have provided around 50% of our top line growth
� More than 100 acquisitions over the last 50 years
� In-depth knowledge of potential targets
� Proven ability to integrate successfully and realize synergies
� Strict financial criteria
Disciplined approach to self financed acquisitions and proven ability
to integrate successfully, realising cost and revenue synergies
26
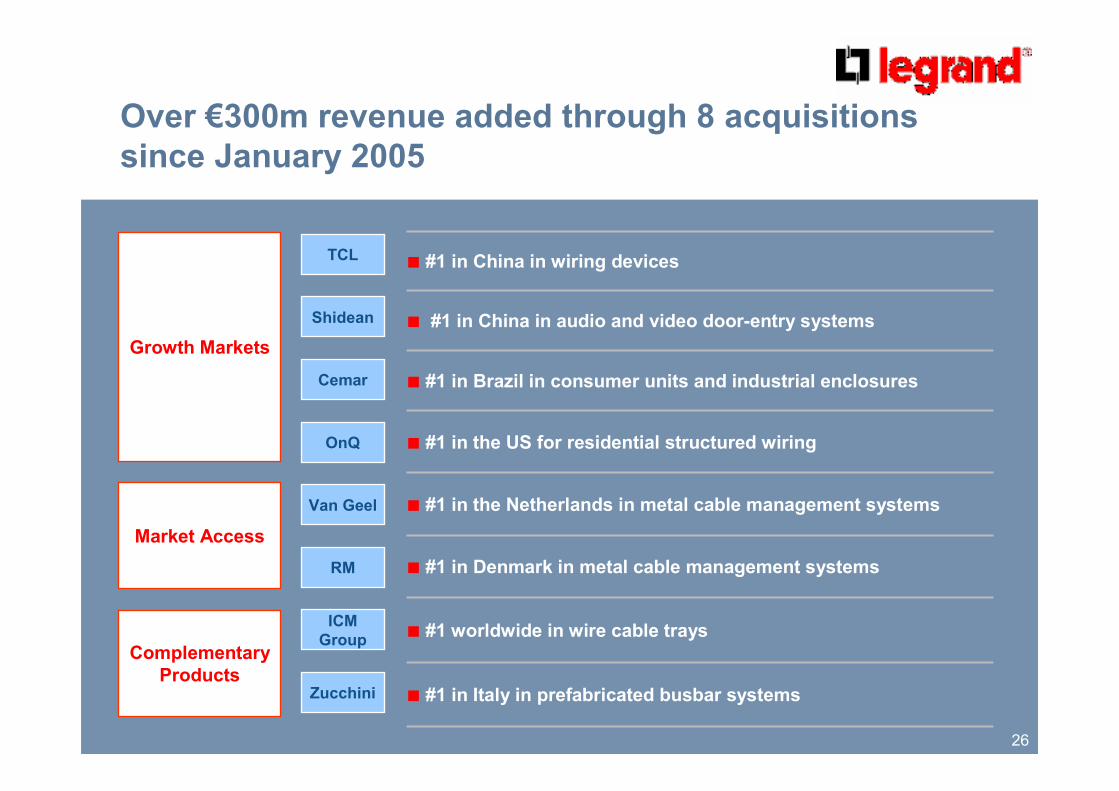
Over €300m revenue added through 8 acquisitions
since January 2005
� #1 in the Netherlands in metal cable management systems
� #1 in China in wiring devices
� #1 worldwide in wire cable trays
� #1 in Denmark in metal cable management systems
� #1 in the US for residential structured wiring
� #1 in Brazil in consumer units and industrial enclosures
� #1 in China in audio and video door-entry systems
� #1 in Italy in prefabricated busbar systems
Shidean
OnQ
TCL
Growth Markets
Van Geel
Zucchini
ICM
Group
Market Access
Complementary
Products
Cemar
RM
27
Strategy and Development
28
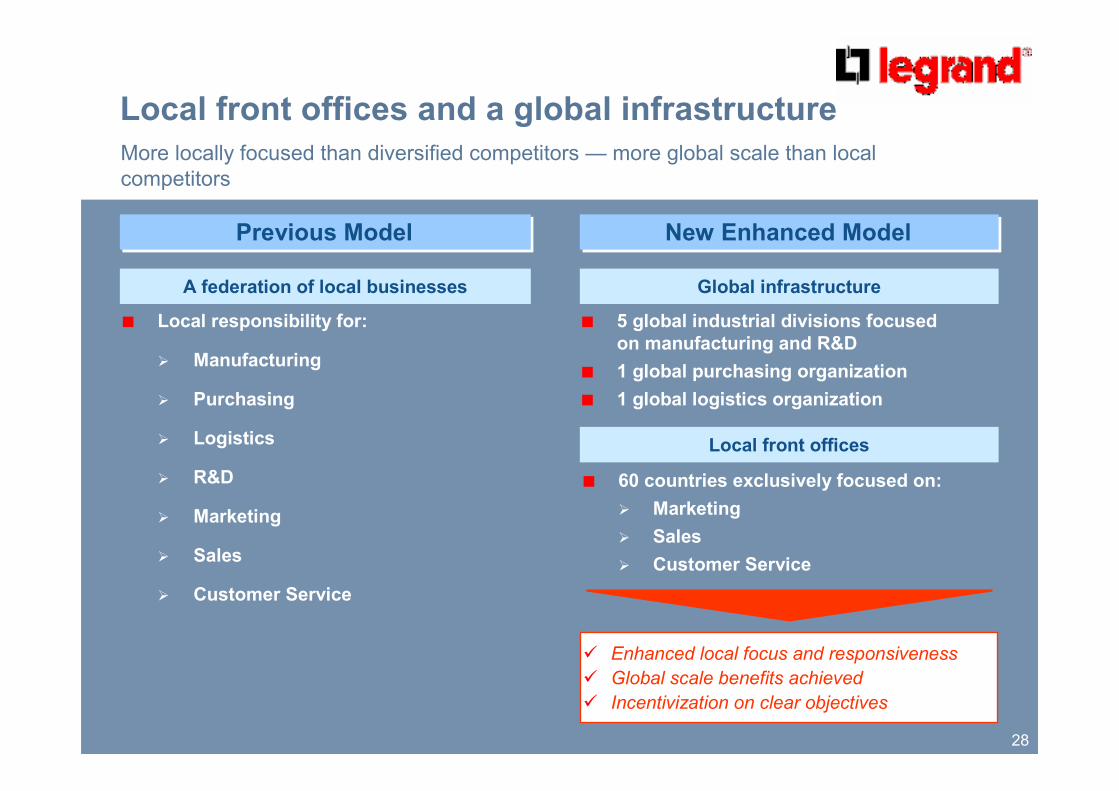
Local front offices and a global infrastructure
More locally focused than diversified competitors — more global scale than local
competitors
Previous ModelPrevious Model
A federation of local businesses Global infrastructure
New Enhanced ModelNew Enhanced Model
� Local responsibility for:
� Manufacturing
� Purchasing
� Logistics
� R&D
� Marketing
� Sales
� Customer Service
� 5 global industrial divisions focused
on manufacturing and R&D
� 1 global purchasing organization
� 1 global logistics organization
Local front offices
� 60 countries exclusively focused on:
� Marketing
� Sales
� Customer Service
� Enhanced local focus and responsiveness
� Global scale benefits achieved
� Incentivization on clear objectives
29
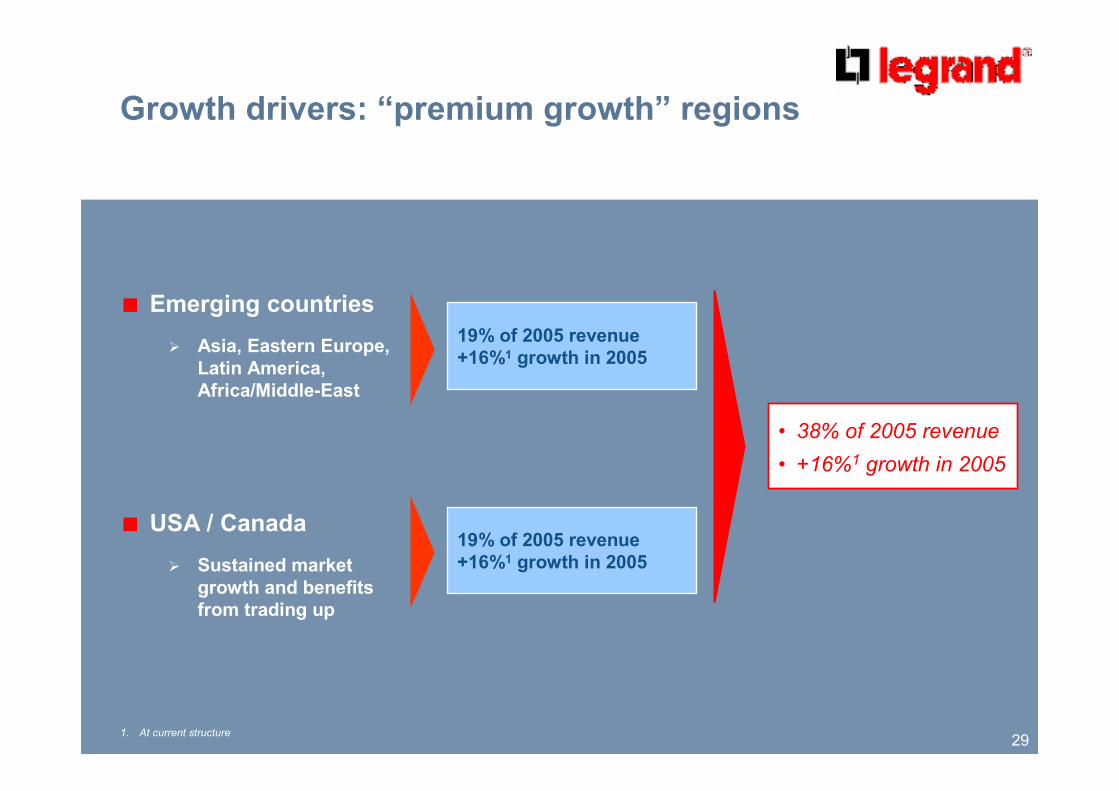
Growth drivers: “premium growth” regions
� Emerging countries
� Asia, Eastern Europe,
Latin America,
Africa/Middle-East
� USA / Canada
� Sustained market
growth and benefits
from trading up
19% of 2005 revenue
+16%1 growth in 2005
19% of 2005 revenue
+16%1 growth in 2005
• 38% of 2005 revenue
• +16%1 growth in 2005
1. At current structure
30
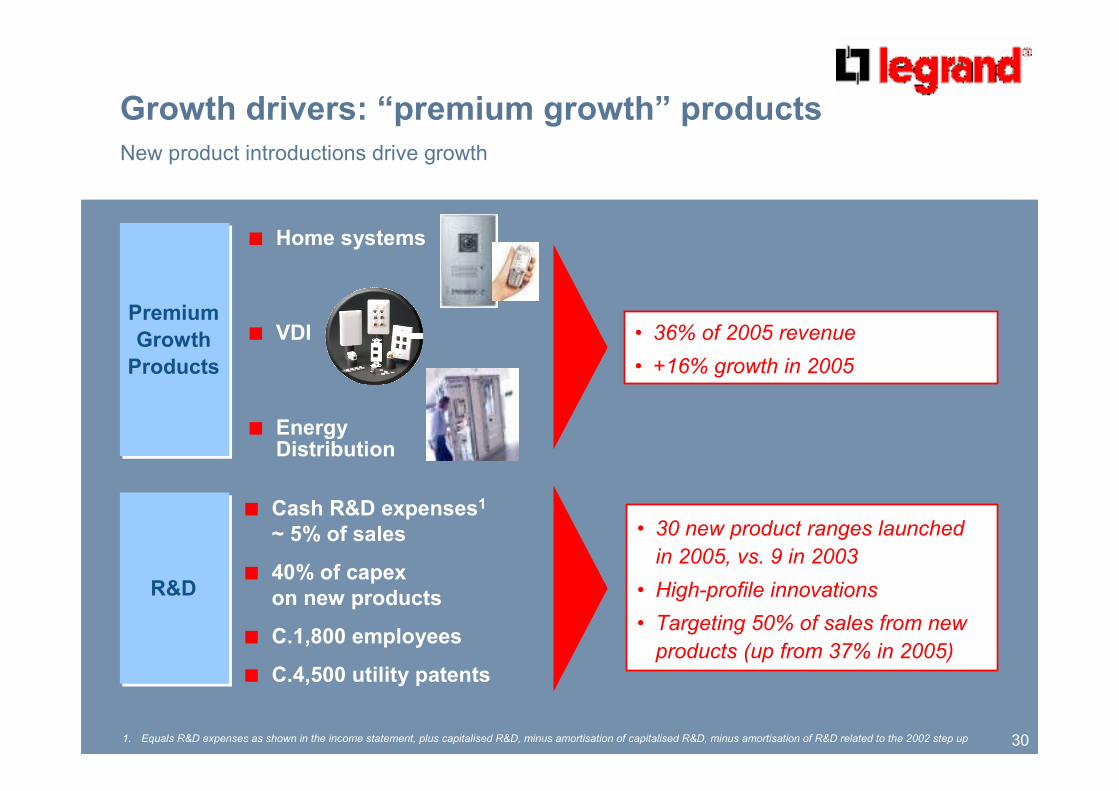
Growth drivers: “premium growth” products
Premium
Growth
Products
Premium
Growth
Products
� Home systems
� VDI
� Energy Distribution
• 36% of 2005 revenue
• +16% growth in 2005
• 30 new product ranges launched
in 2005, vs. 9 in 2003
• High-profile innovations
• Targeting 50% of sales from new
products (up from 37% in 2005)
1. Equals R&D expenses as shown in the income statement, plus capitalised R&D, minus amortisation of capitalised R&D, minus amortisation of R&D related to the 2002 step up
New product introductions drive growth
R&DR&D
� Cash R&D expenses1
~ 5% of sales
� 40% of capex
on new products
� C.1,800 employees
� C.4,500 utility patents
31
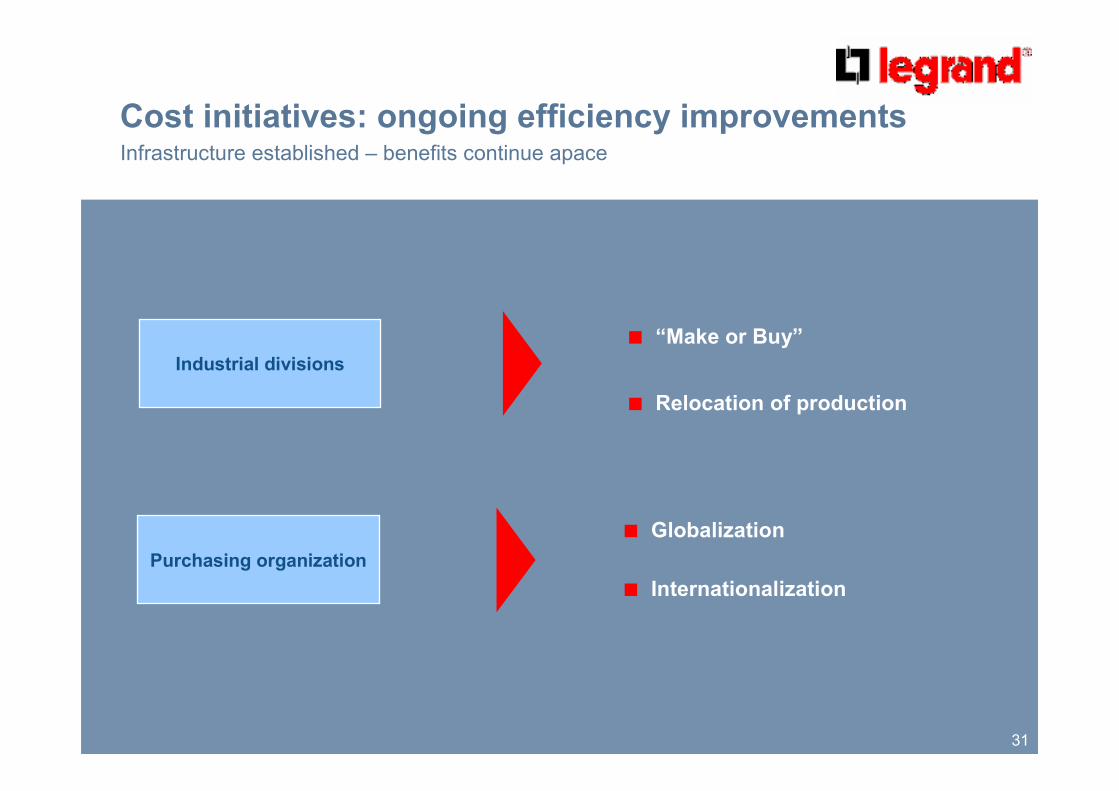
� “Make or Buy”
� Relocation of production
Purchasing organization
� Globalization
� Internationalization
Infrastructure established – benefits continue apace
Cost initiatives: ongoing efficiency improvements
Industrial divisions
32
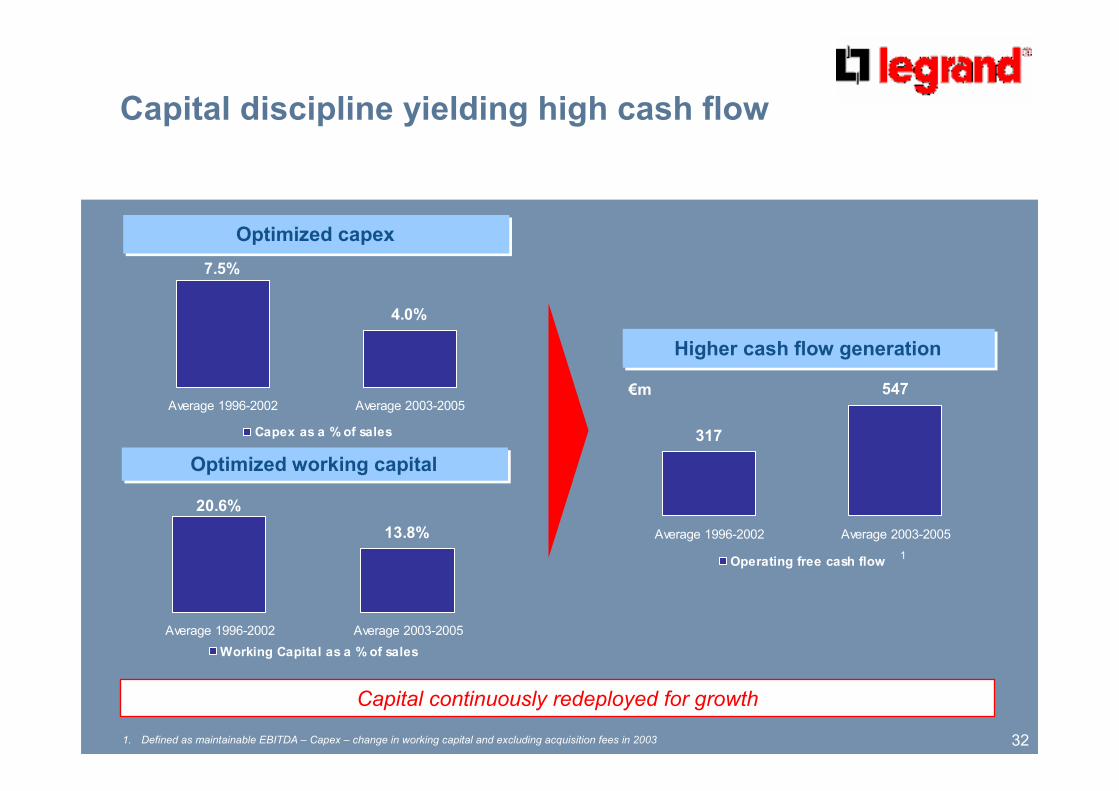
7.5%
4.0%
Average 1996-2002 Average 2003-2005
Capex as a % of sales
Capital discipline yielding high cash flow
Optimized capexOptimized capex
Optimized working capitalOptimized working capital
Higher cash flow generationHigher cash flow generation
20.6%
13.8%
Average 1996-2002 Average 2003-2005
Working Capital as a % of sales
317
547
Average 1996-2002 Average 2003-2005
Operating free cash flow
1. Defined as maintainable EBITDA – Capex – change in working capital and excluding acquisition fees in 2003
1
€m
Capital continuously redeployed for growth
33
Financial Summary
34
2005 Performance
35
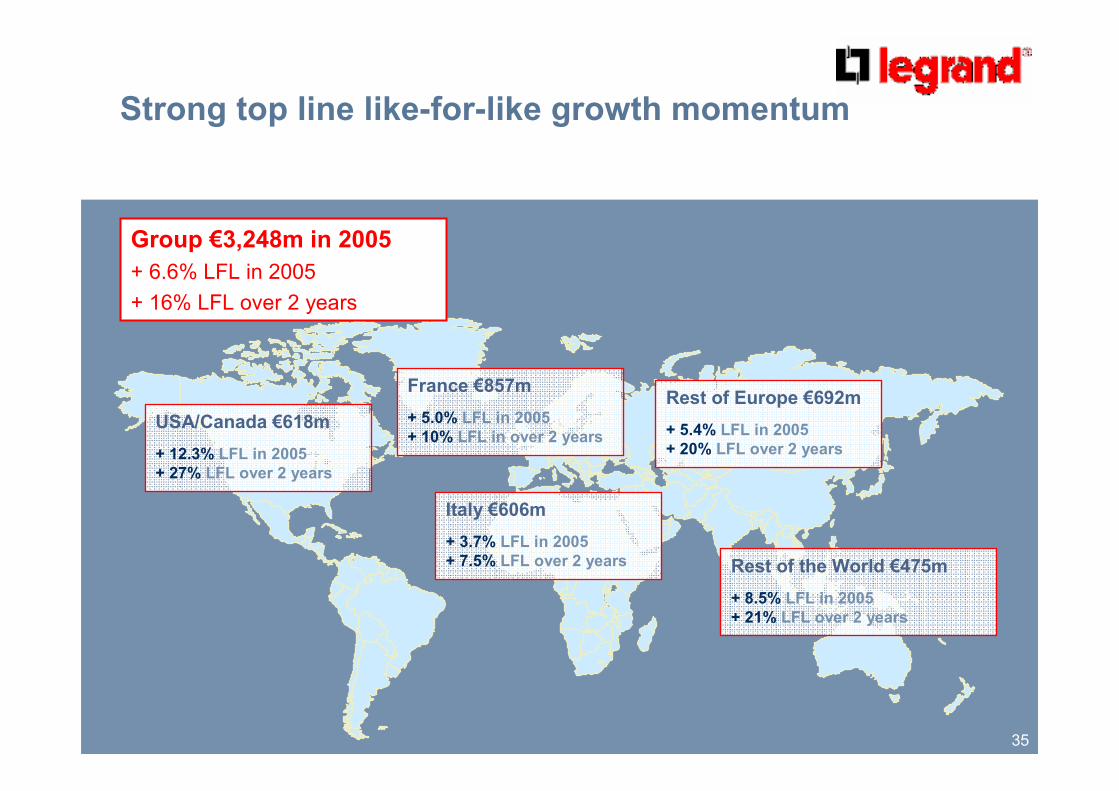
Strong top line like-for-like growth momentum
Group €3,248m in 2005
+ 6.6% LFL in 2005
+ 16% LFL over 2 years
France €857m
+ 5.0% LFL in 2005
+ 10% LFL in over 2 years
Italy €606m
+ 3.7% LFL in 2005
+ 7.5% LFL over 2 years Rest of the World €475m
+ 8.5% LFL in 2005
+ 21% LFL over 2 years
Rest of Europe €692m
+ 5.4% LFL in 2005
+ 20% LFL over 2 years
USA/Canada €618m
+ 12.3% LFL in 2005
+ 27% LFL over 2 years
36
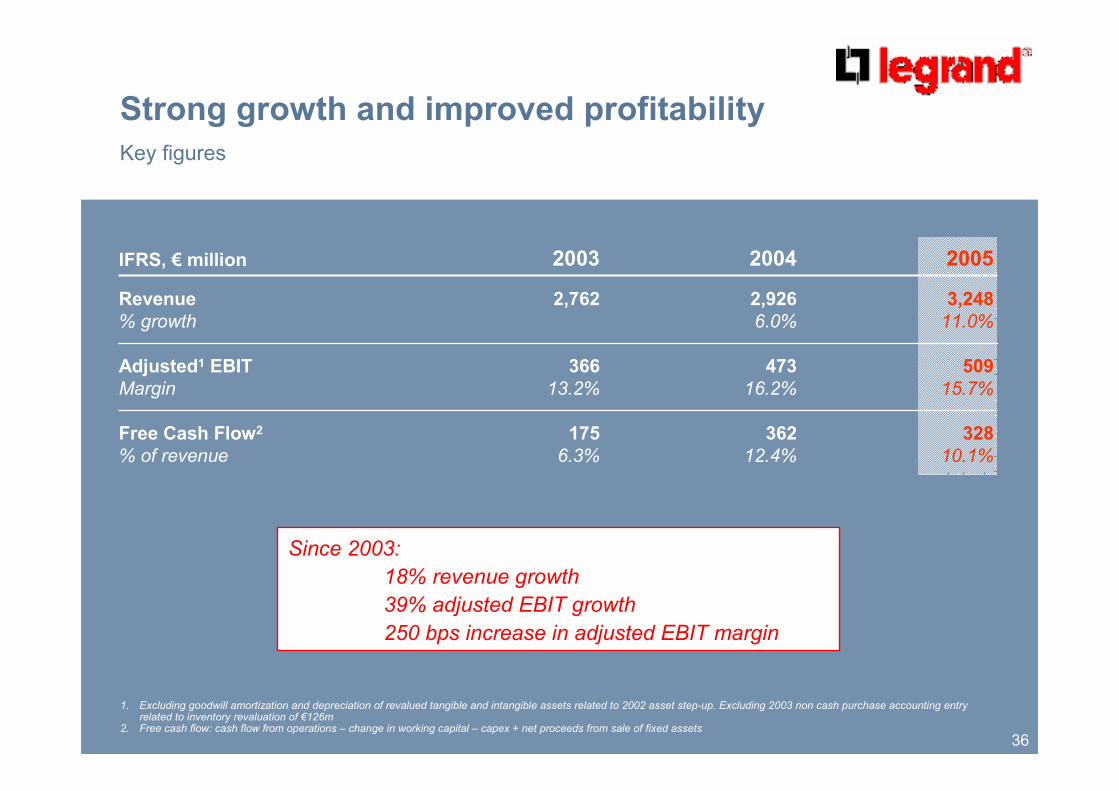
Strong growth and improved profitability
Key figures
1. Excluding goodwill amortization and depreciation of revalued tangible and intangible assets related to 2002 asset step-up. Excluding 2003 non cash purchase accounting entry related to inventory revaluation of €126m
2. Free cash flow: cash flow from operations – change in working capital – capex + net proceeds from sale of fixed assets
509
15.7%
473
16.2%
366
13.2%
Adjusted1 EBIT
Margin
3,248
11.0%
2,926
6.0%
2,762Revenue
% growth
200520042003IFRS, € million
328
10.1%
362
12.4%
175
6.3%
Free Cash Flow2
% of revenue
Since 2003:
18% revenue growth
39% adjusted EBIT growth
250 bps increase in adjusted EBIT margin
37
2006 First Quarter Performance
38
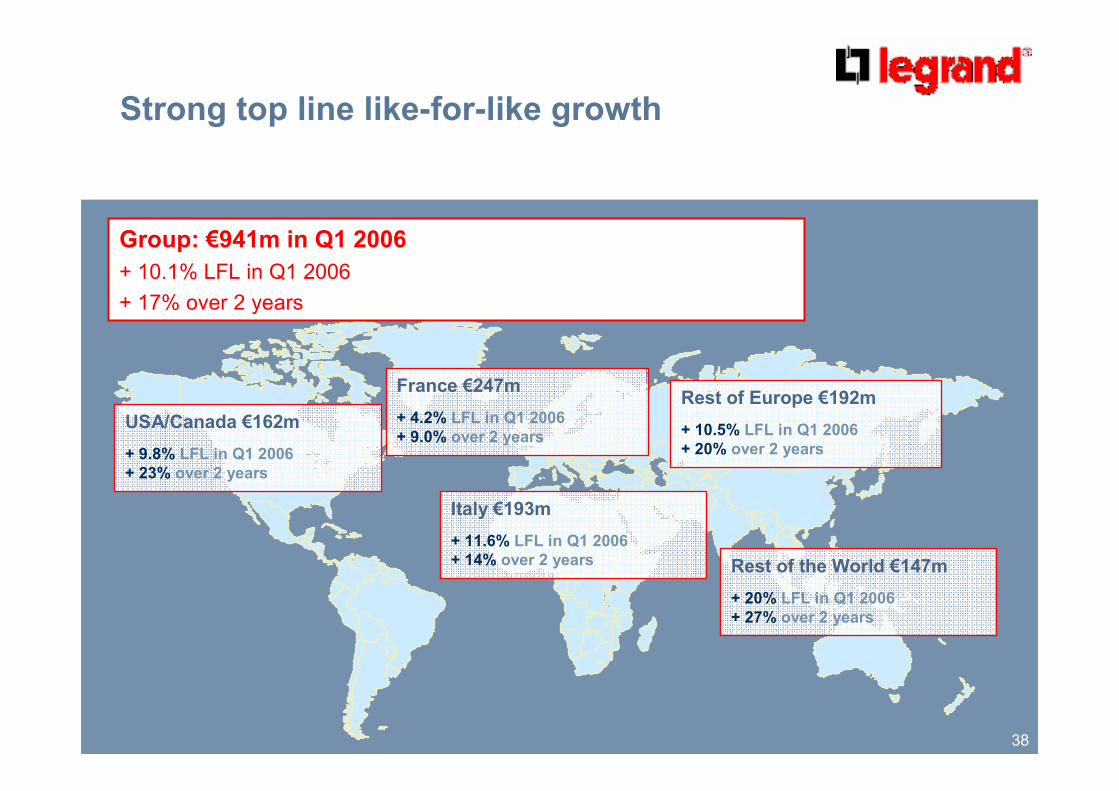
Strong top line like-for-like growth
Group: €941m in Q1 2006
+ 10.1% LFL in Q1 2006
+ 17% over 2 years
France €247m
+ 4.2% LFL in Q1 2006
+ 9.0% over 2 years
Italy €193m
+ 11.6% LFL in Q1 2006
+ 14% over 2 years Rest of the World €147m
+ 20% LFL in Q1 2006
+ 27% over 2 years
Rest of Europe €192m
+ 10.5% LFL in Q1 2006
+ 20% over 2 years
USA/Canada €162m
+ 9.8% LFL in Q1 2006
+ 23% over 2 years
39
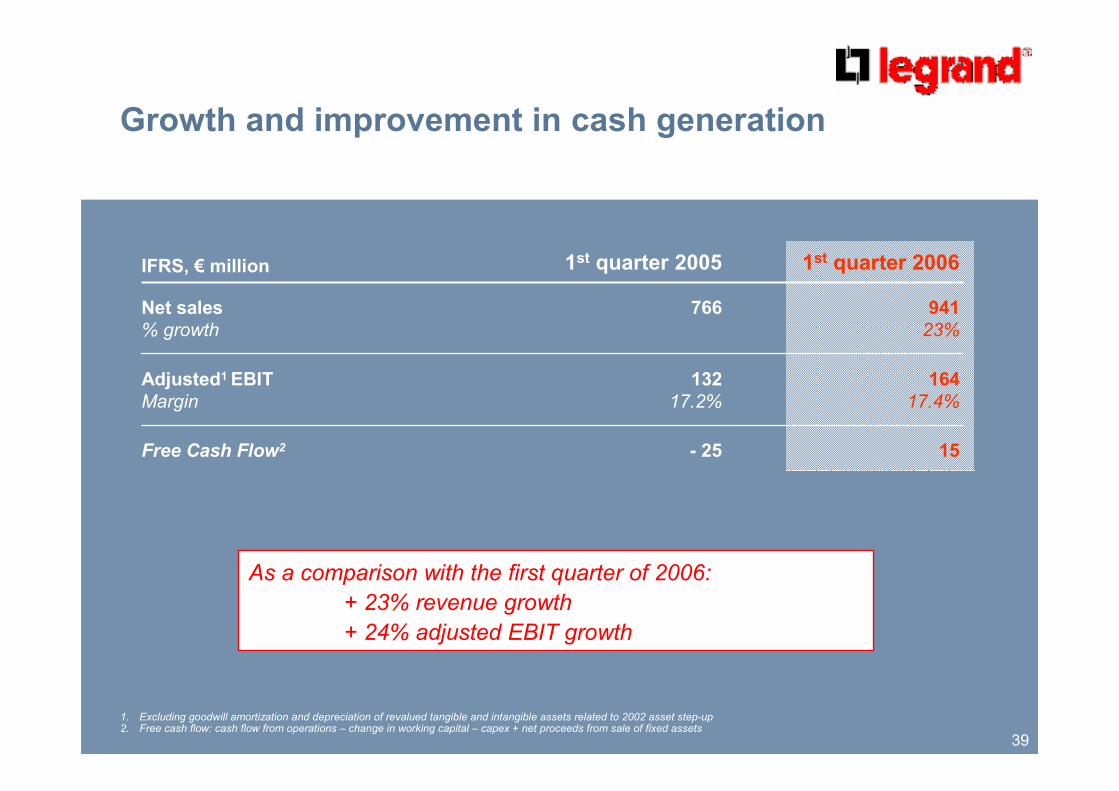
Growth and improvement in cash generation
164
17.4%
132
17.2%
Adjusted1 EBIT
Margin
941
23%
766Net sales
% growth
1st quarter 20061st quarter 2005IFRS, € million
15- 25Free Cash Flow2
1. Excluding goodwill amortization and depreciation of revalued tangible and intangible assets related to 2002 asset step-up2. Free cash flow: cash flow from operations – change in working capital – capex + net proceeds from sale of fixed assets
As a comparison with the first quarter of 2006:
+ 23% revenue growth
+ 24% adjusted EBIT growth
40
� An optimum capital structure
� Value creation opportunity through leverage
� Investment grade rating
� High free cash flow to finance growth and pay dividends
Attractive capital structure to create shareholder value
41
Shareholders,
Corporate Governance
and Sustainable Development
42
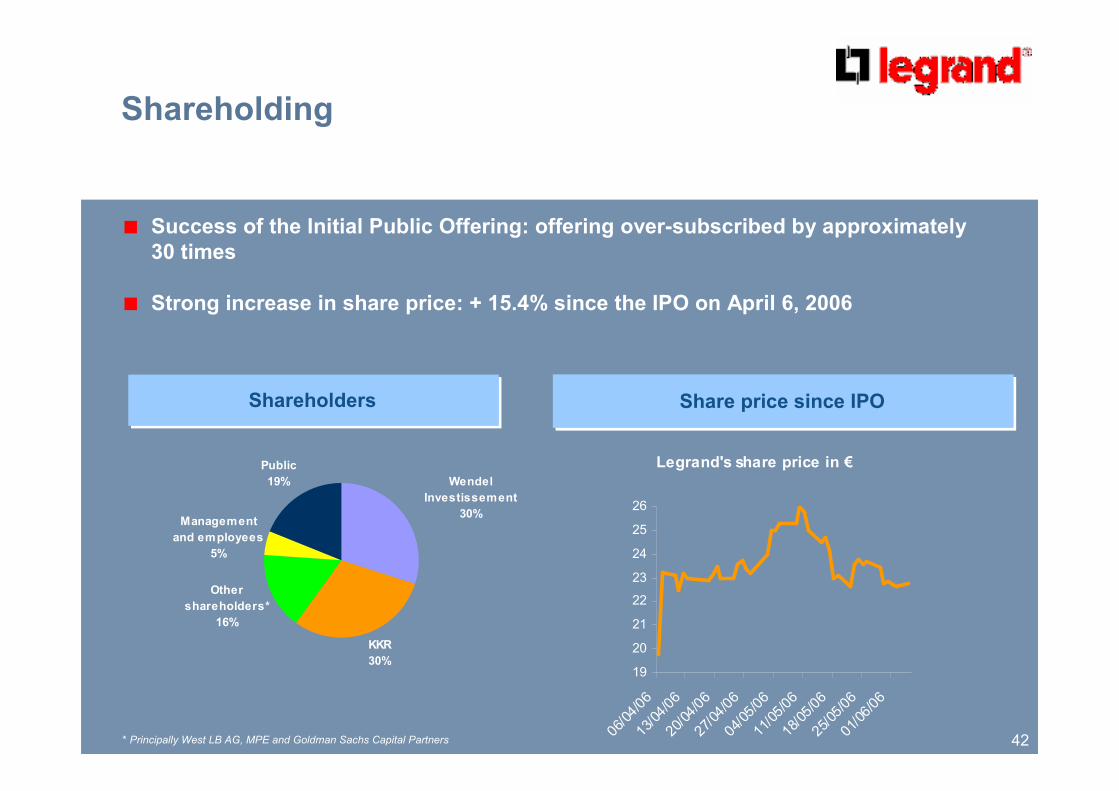
Shareholding
� Success of the Initial Public Offering: offering over-subscribed by approximately
30 times
� Strong increase in share price: + 15.4% since the IPO on April 6, 2006
ShareholdersShareholders Share price since IPOShare price since IPO
* Principally West LB AG, MPE and Goldman Sachs Capital Partners
KKR
30%
Other
shareholders*
16%
Management
and employees
5%
Public
19% Wendel
Investissement
30%
Legrand's share price in €
19
20
21
22
23
24
25
2606
/04/
0613
/04/
0620
/04/
0627/
04/0
604
/05/
0611
/05/
0618
/05/
0625
/05/
0601
/06/
06
43
Corporate Governance
� Board of directors
� 11 members
� including 2 independent directors
� 3 committees
� Audit committee
� Nominating and compensation committee
� Strategy committee
� Internal control complies with the most demanding international
standards
� External control: 2 statutory auditors
44
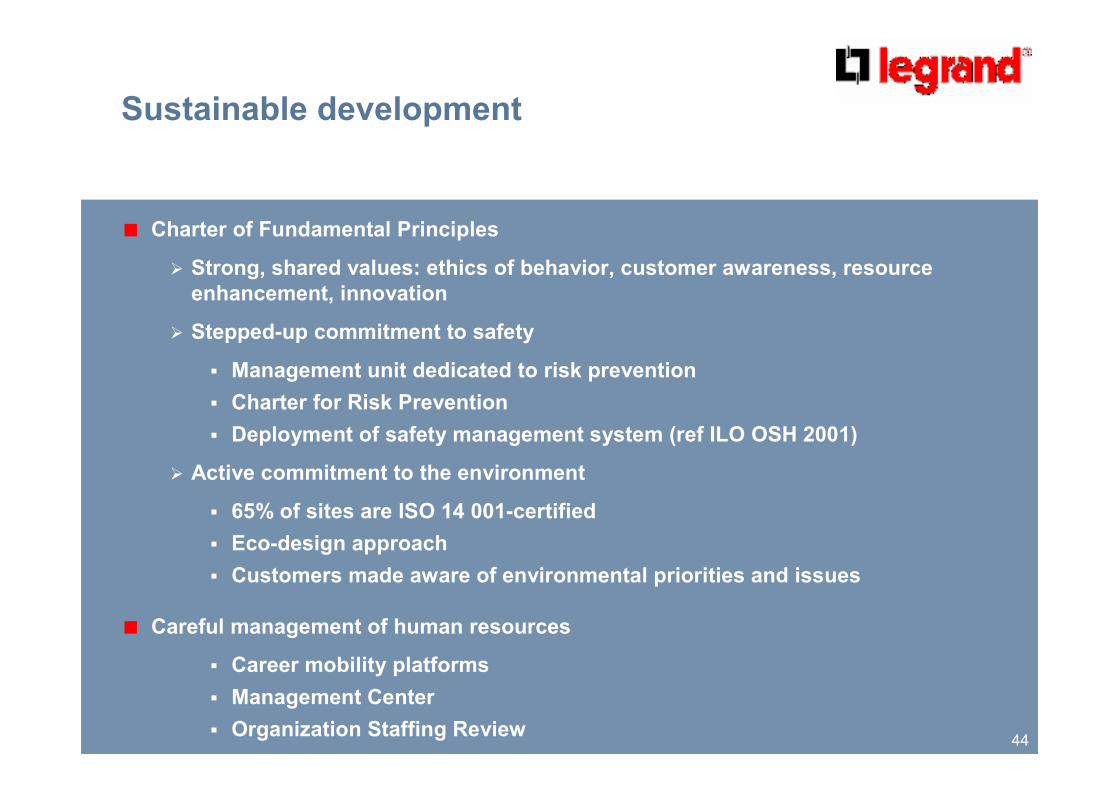
Sustainable development
� Charter of Fundamental Principles
� Strong, shared values: ethics of behavior, customer awareness, resource
enhancement, innovation
� Stepped-up commitment to safety
� Management unit dedicated to risk prevention
� Charter for Risk Prevention
� Deployment of safety management system (ref ILO OSH 2001)
� Active commitment to the environment
� 65% of sites are ISO 14 001-certified
� Eco-design approach
� Customers made aware of environmental priorities and issues
� Careful management of human resources
� Career mobility platforms
� Management Center
� Organization Staffing Review

45
Questions & Answers
46
Presentation of Resolutions
and Vote
47
Resolution #1
Exceptional distribution of €0.41 per share for each
of 269,693,376 shares making up Legrand share capital
for a total €110,574,284.16. This amount will be taken
from “retained earnings”.
48
Resolution #2
Granting of powers to accomplish formalities
49
Legrand
Recommended