Advocating for Equitable Heat Solutions in the
Phoenix Climate Action Plan
June 22, 2021


• Mayor Kate Gallego affirmed Phoenix commitment to the Paris Climate Accord – reduce GHG emissions by 2050
• Phoenix joined C40 Cities in Feb. 2020
• C40-compliant Climate Action Plan by Dec 2021
• Deadline 2020 – 67% Reduction in GHG Emissions by 2030.

2009
First City Operations
Greenhouse Gas
Emissions Inventory
City Operations
Climate Action Plan
2012
First Community-
Wide Greenhouse
Gas Emissions Inventory
2016
2050 Sustainability
Goals
2018
City Operations & Community-
Wide Greenhouse
Gas Inventories
2020-2021
Climate Action
Planning
Community-Wide
Climate Action Plan
by December 2021
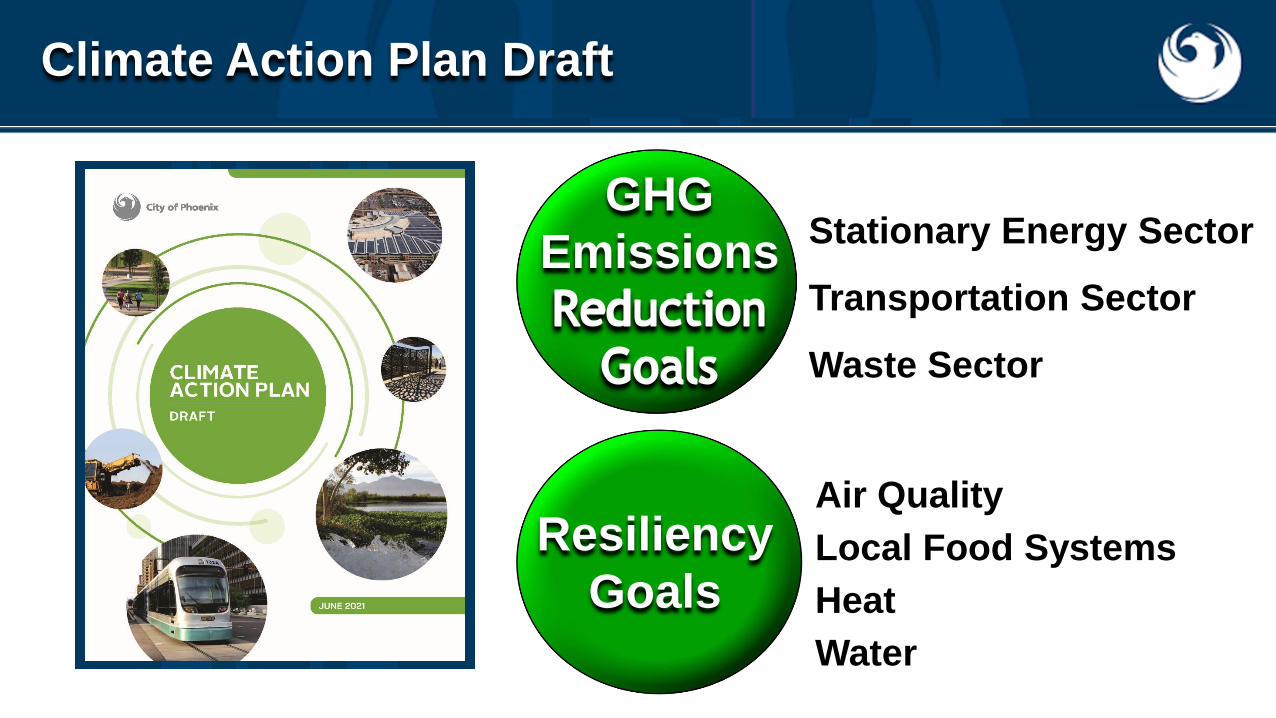
Climate Action Plan Draft
GHG
Emissions
Resiliency
Goals
Stationary Energy Sector
Transportation Sector
Waste Sector
Air Quality
Local Food Systems
Heat
Water

Climate Action Plan Draft 2050 Goals
GHG
Emissions
Resiliency
Goals
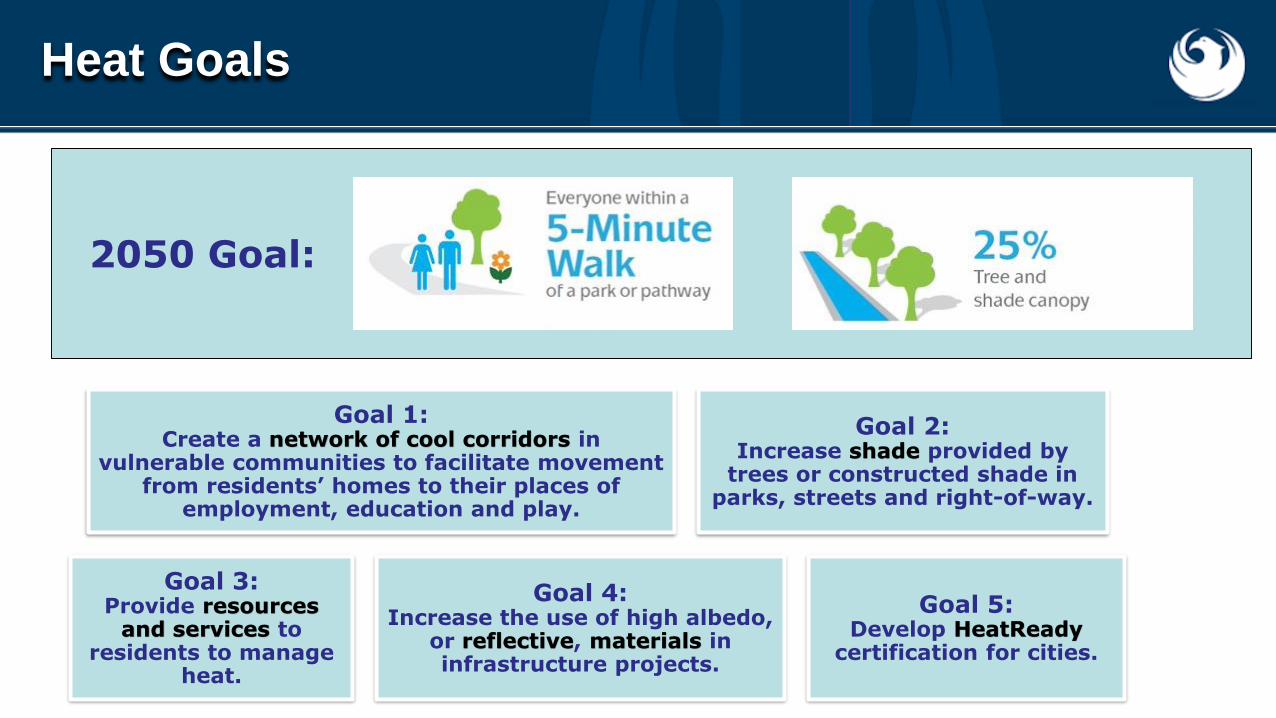
Goal 1: Create a network of cool corridors in
vulnerable communities to facilitate movement from residents’ homes to their places of
employment, education and play.
Goal 2: Increase shade provided by
trees or constructed shade in parks, streets and right-of-way.
Goal 3: Provide resources
and services to residents to manage
heat.
Goal 4: Increase the use of high albedo,
or reflective, materials in infrastructure projects.
Goal 5: Develop HeatReady
certification for cities.
2050 Goal:
Heat Goals

Next Steps
June 2021
June 2021
Fall 2021
Public EngagementVirtual Workshops & Survey
Draft Plan Public Comment Period
Final Plan to City Council

Climate Page, Survey, Future
Workshop Information
www.phoenix.gov/climate
Submit questions to
@phxenvironment
10

AP/John Locher

Harlan, Declet-Barreto et al. (2013)
Inequitable distribution of Urban Heat Island health risks

Environmental Injustices in Phoenix were created by urban development & racism
Barry M. Goldwater Historic Photograph Collection. Arizona Collection, Arizona State University Libraries.
Oberle & Arreola (2008).
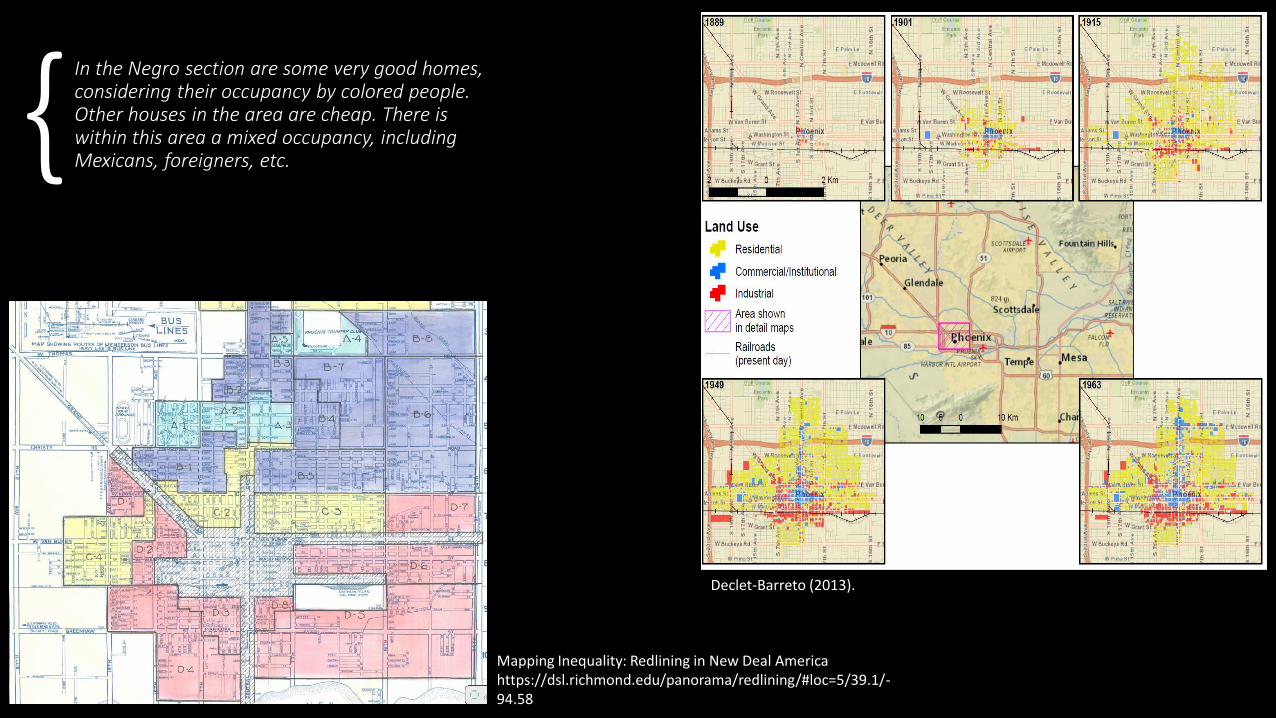
Mapping Inequality: Redlining in New Deal America https://dsl.richmond.edu/panorama/redlining/#loc=5/39.1/-94.58
Declet-Barreto (2013).
In the Negro section are some very good homes, considering their occupancy by colored people. Other houses in the area are cheap. There is within this area a mixed occupancy, including Mexicans, foreigners, etc.{
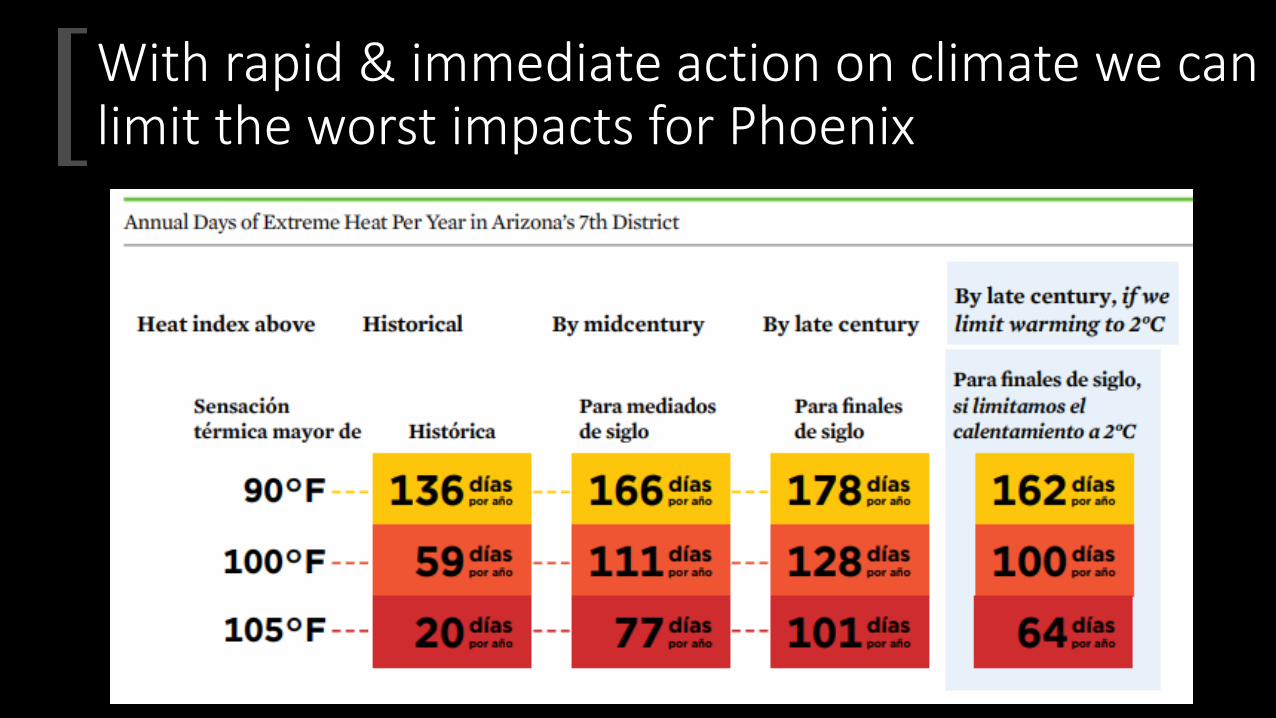
With rapid & immediate action on climate we can limit the worst impacts for Phoenix

THE HEAT IS ON IN MARICOPA COUNTY:
HERE’S WHAT PUBLIC HEALTH IS DOING ABOUT IT
Vjollca Berisha, Sr. Epidemiologist, Office of Epidemiology
City of Phoenix and Union of Concerned Scientists
June 22, 2021
Climate and Health Program
Office of Epidemiology
Maricopa County Department of Public Health

NEWS AND INFORMATION FOR COUNTY EMPLOYEES
Heat is on!
Use the App to Track Air quality
COVID-19 Community Impact Survey
Featured Video: Helping the Homeless
Let’s work together to save lives this summer!

To prevent heat-related illness &
death, public health provides
education and recommends visiting
community cooling centers for heat
relief
heataz.org

Maricopa County had 1,814 heat-associated deaths from 2006 - 2020
85
51 4974 82
106 110
7561
84
154179 182
199
323
2006 2007 2008 2009 2010 2011 2012 2013 2014 2015 2016 2017 2018 2019 2020
2,465 hospital visits
12 Excessive Heat Events=48 days with Excessive heat Warning

1%3%
7%
48%
33%
6%1%
April May June July August September October
Eighty-seven percent of all heat associated deaths occurred in the months of July, August, and September (N=323).
86%
8%5%
Maricopa County Resident Non-Maricopa County Arizona Resident†
Non-Arizona Resident‡
Maricopa County residents accounted for 86% of all heat-associated deaths among cases with known county of residence.
68% 75% 65% 64% 59% 54% 57% 56% 54% 54%57% 50%
65% 69%
66%
32%25% 35%
36% 41%46% 43%
44% 46%46%
43%50%
35%31%
34%
2006 2007 2008 2009 2010 2011 2012 2013 2014 2015 2016 2017 2018 2019 2020
Sixty-one percent of heat-associated deaths since 2006 have been classified as heat caused.
Heat-Caused Heat Related
0.0 0.2
5.1
13.8
22.1
12.4
17.8
0.70.0 0.6
2.5
4.7
2.8
9.7
0-4 5-19 20-34 35-49 50-64 65-74 75+
For males, the heat-associated death rate was highest in the 50-64 age group. For females, the heat-associated death rate was highest in the 75+ year age group.
Male

Some community members are at higher risk of heat-associated death
6 in 10were at least
50 years old
~30% of all
heat deaths
occurred indoors
76% of all heat
deaths occurred
among men
had lived in
Arizona for 20
years or more
63%Certain races were
disproportionately affected
Heat-Associated Death Rates
Native American 5.8
African American 3.1
All Races 2.4
Heat Deaths by ZIP Code – Heat Story Map

HEATMAP OF
INDOOR DEATHS BY
POVERTY RATE
(2006-2018)

Why Are People Dying in Indoor Environments?
80%
Died in Overheated
Indoor Environments
20%AC Status Unknown
88%
12%11% NO
electricity
28% AC Off
61% AC Not working

THE NUMBER OF HEAT ASSOCIATED DEATHS AMONG THE HOMELESS POPULATION
MORE THAN DOUBLED FROM 2019 TO 2020
326 *
21 22 20 20 20 7 854 57 61 66 172
53
4546
53 60 86 90 5554 76
100 122 121 133
116
2006 2007 2008 2009 2010 2011 2012 2013 2014 2015 2016 2017 2018 2019 2020
Homeless Non-Homeless

Reducing health related illness and death requires a collaborative approach!!
Annual Meeting of Bridging Climate Change and Public Health
Coalition (2016-Present)
PROJECTS:
Raising Awareness about Extreme
Heat, Safety Tips, and Available
Community Resources Among
Communities Living in Mobile
Homes (ASU and CBO)
Energy Insecurity and Public
Health:
Going Further through Cross-Sector
Collaboration (RWJF)
MC Celebrating Success
and Champions

▪ Aaron Gettel, Epidemiologist
Phone: 602-3722612
▪ Vjollca Berisha, Sr. Epidemiologist
Phone: 602-372-2611
Contact Information
Story Map About Heat: The Silent Killerhttp://bit.ly/HeatStoryMaricopa
http://bit.ly/climatehealthmaricopaBridging Climate and Public Health
ACTIONS TO CHANGE CULTURE OF HEALTH AMONG VULNERABLE COMMUNITIES
Academic collaboration: supporting and evaluating urban heat solutions
Draft Climate Action Plan Workshop Series | Extreme Heat
David Hondula, ASU Urban Climate Research Center

Design Aspirations: ASU research
has purpose and impact and the
university connects with communities
through mutually beneficial partnerships

entrepreneurial
15+ academic units and
major initiatives
supporting urban heat
research

36% Phoenix respondents reporting symptoms of heat illness
(Hayden et al. 2011)
27%Maricopa County households reporting that they “sometimes”
feel too hot inside their homes in the summer (MCDPH CASPER)

31Jenerette, G. D., Harlan, S. L., Buyantuev, A., Stefanov, W. L., Declet-Barreto, J., Ruddell, B. L., ... & Li, X.
(2016). Micro-scale urban surface temperatures are related to land-cover features and residential heat related
health impacts in Phoenix, AZ USA. Landscape Ecology, 31(4), 745-760.
Hotter neighborhoods
More
heat
illness

Community-driven heat action planning

Mapping Hot & Cool Spots
33
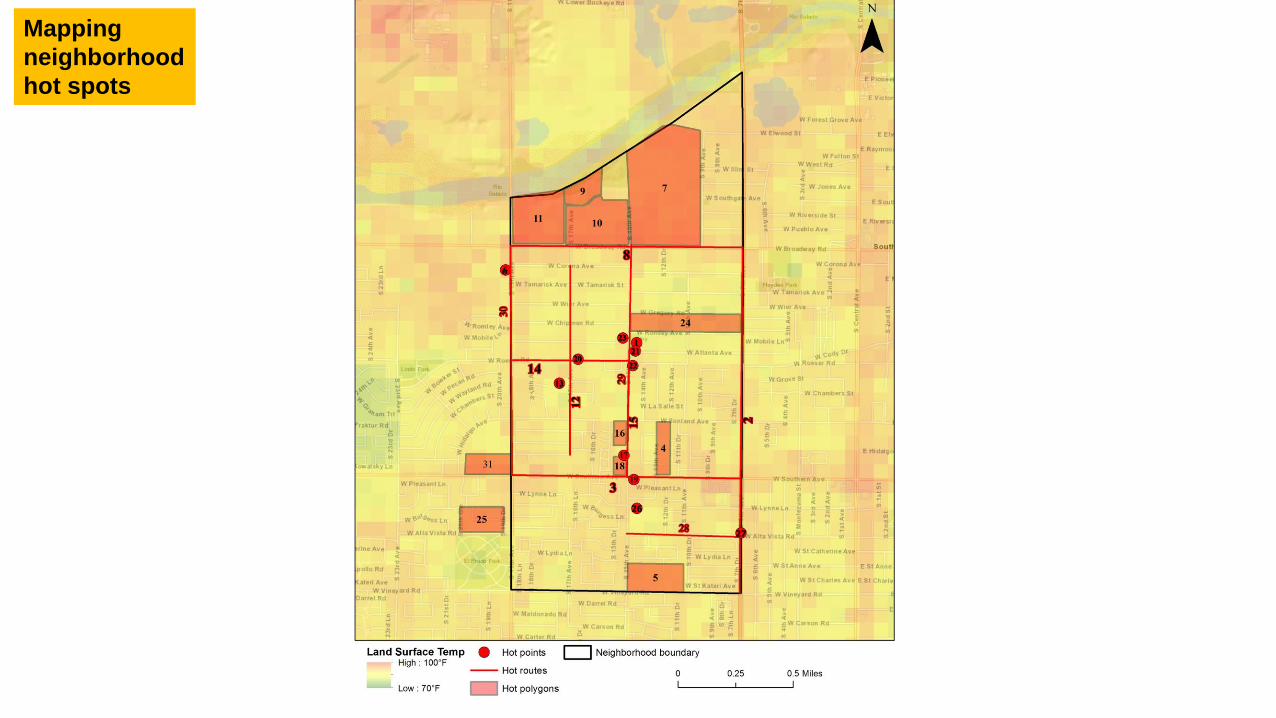
Mapping
neighborhood
hot spots

RCP8.5 = “high emissions”RCP4.5 = “low emissions”
Mitigation Potential

RCP8.5 = “high emissions”RCP4.5 = “low emissions”
Mitigation Potential
Possible air temperature reductions from effective urban heat mitigation

Evaluating Heat Mitigation Strategies – Cool Pavement Pilot Project

Supporting Cool Corridor Prioritization & Implementation

25 best examples of
cool corridors
(PRELIMINARY)

“Current cool corridor” example
District 8 32nd Street, Broadway-Southern
(PRELIMINARY)

Academic collaboration: supporting and evaluating urban heat solutions
Draft Climate Action Plan Workshop Series | Extreme Heat
David Hondula, ASU Urban Climate Research Center
E-mail: [email protected]
Twitter: @ASUHondula

Community Input for Heat Readiness & Tree and Shade Initiatives in the City of Phoenix
Presentation for the City of Phoenix Climate Action Plan Heat Workshop
By Ginger Sykes Torres

Heat Readiness at the Community and City Level
With temperatures rising it is more important than ever to address heat issues in our city and enhance shade for pedestrians and those in the most heat vulnerable areas.
Phoenix is exploring ways to address the impacts of rising heat and add more trees throughout the city via projects like cool corridors and through creative partnerships with NGOs and community organizations.
In the past few years, community input via citizen led advisory committees (EQSC and UHITS) has been integral to facilitating City adoption of policies and initiatives that aim to make our communities and environment more resilient to extreme heat and expand shade cover.

Planning for Trees in Phoenix: 2010 Tree and Shade Master PlanPlan adopted a 25% tree and shade canopy goal by 2030
2021: Phoenix is "short of what is needed to reach 25 percent canopy" and meeting the goal will require about 10,000 new trees be planted each year —more than double the current rate. (For reference, in 2019, Phoenix planted 4,509 trees and lost about 1,200, so the city’s tree inventory only grew by 3,309.)
→ In 2019, UHITS/EQSC provided Recommendations on Implementation of the 2010 Tree and Shade Master Plan to Phoenix City Council.

Phoenix City Budget Funding for Trees & Heat Resilience Programs
The approved 2021-2022 City budget includes $2.8M for Climate Change and Heat Readiness initiatives to boost Phoenix's response to climate change, with a new Office of Heat Response and Mitigation created as part of the package. The new office will oversee tree and shade distribution in the city. Budget also funds planting 1,800 trees in cool corridors in heat vulnerable areas. Also funds additional Parks staff and a citywide tree inventory and database that will help to accomplish the city’s 2010 Tree and Shade Master Plan goals.
→ In 2021, UHITS/EQSC provided a business case for the Urban Forest Infrastructure Manager Position to City Council and the City Manager’s office.
City of Phoenix Tree Equity MOU with American Forests (2021)
Through this MOU, American Forests and the City of Phoenix will work together to achieve “tree equity” by 2030. The two will work with neighborhood groups, nonprofits, businesses and researchers to identify inequities and attract funding to preserve existing trees and plant new ones. The MOU allows the two entities to focus on growing urban forests in heat vulnerable communities.
-->This MOU was supported by EQSC.

Zoning Code: Approved Landscape Maintenance Text Amendment (June 2021)
Strengthens the existing zoning ordinance and codifies best practices by embracing 3 core concepts: trees are infrastructure, trees provide benefits when appropriately planted, & trees should be kept in place in a healthy and living condition.
Applies to commercial, industrial, & multifamily/single family subdivisions, NOT individual homeowners. Details that site inspection and certificate of occupancy are tied to the fact that the landscape that was said would be put in is actually in, that the approved landscape plan on file is the valid document guiding landscaping on the site, provides clarity and consistency on design guidelines, addresses the concept of “right tree right place” with regard to plant materials, & tree protection zone to preserve existing trees, landscape removal standards, installation and maintenance plans, and salvage and tree protection plans.
→ Final Landscape Text Amendment Approved by EQSC with additional TPZ language recommended.
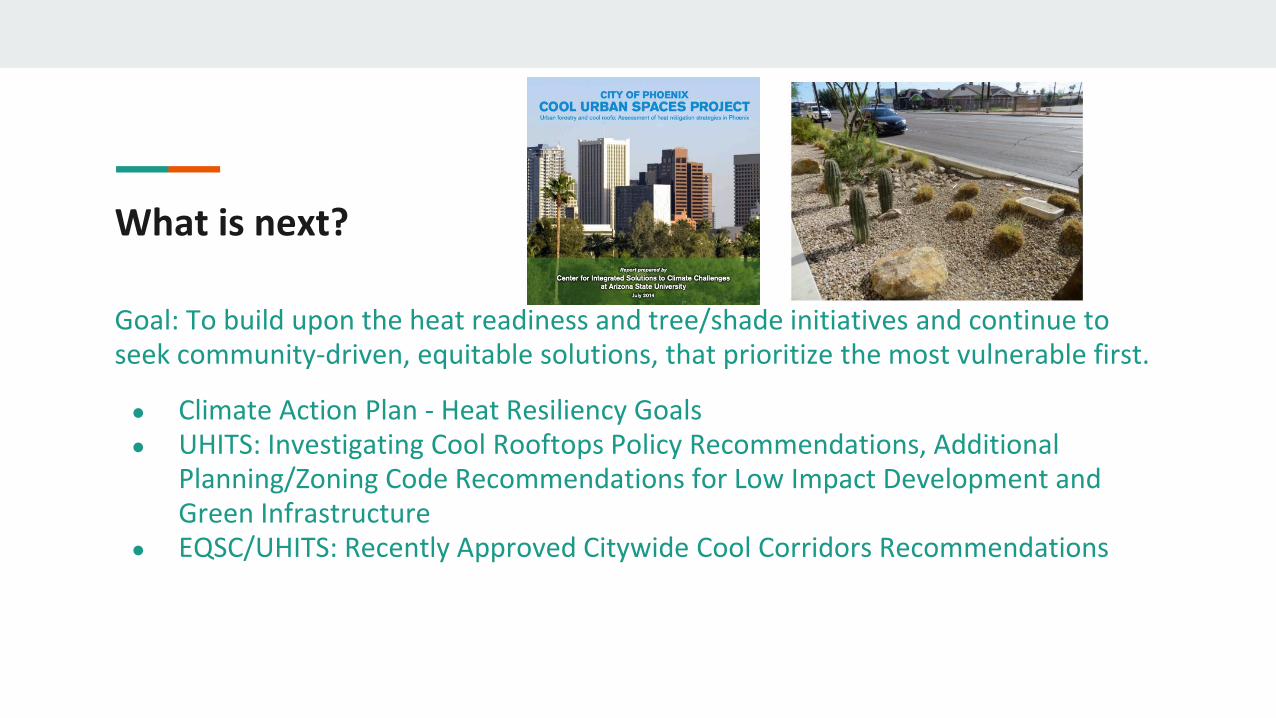
What is next?
Goal: To build upon the heat readiness and tree/shade initiatives and continue to seek community-driven, equitable solutions, that prioritize the most vulnerable first.
● Climate Action Plan - Heat Resiliency Goals● UHITS: Investigating Cool Rooftops Policy Recommendations, Additional
Planning/Zoning Code Recommendations for Low Impact Development and Green Infrastructure
● EQSC/UHITS: Recently Approved Citywide Cool Corridors Recommendations

Citywide Cool Corridors Policy Vision
● A citywide Cool Corridors Program would support existing city goals related to sustainability, public
health, and alternative modes of transportation.
● Cool corridors directly address heat/health/equity concerns
● Continued demonstration of national and international heat leadership by City of Phoenix
● Existing programs can and should be leveraged to assist in implementing the Cool Corridors vision
→ Recommendations for the development of a citywide Cool Corridors Program were unanimously approved by the UHITS Subcommittee on April 6th, 2021 and by EQSC on June 10th, 2021.

Citywide Cool Corridors Key
Recommendations
1. Clear definition of cool corridors, identify “best” examples
2. Prioritize heat vulnerable communities and high pedestrian
activity/need street segments
3. Robust and broad stakeholder engagement: residents, staff,
researchers, advocacy groups
4. Evaluation and accountability

Citywide Cool Corridors Definition
1. Mile-long walkway, pathway, or trail serving residents who walk, bike, and
use transit
2. Offers residents of all ages and abilities relief from hot weather through
shade provisioning and other resources
3. At least 30% shade coverage
4. Connect residents to critical services
5. Align with other plans/goals/frameworks/initiatives
6. Include displays and signage about heat services/resilience

2021 Draft Climate Action Plan: Heat Resilience
Significant Climate Actions related to heat:
● Become a top tier Heat-Ready City by 2025—implementing the Tree and Shade Master Plan by 2030 and building a network of 200 “cool corridors” by 2050.
● Create an inclusive and equitable city, prioritizing investments in previously underserved communities, proactively seeking community input on all major climate policy and related budget decisions and embedding equity in all climate actions.
2050 Resiliency Goal
● Heat: Reduce urban heat-island effect through green infrastructure as well as doubling the current tree and shade canopy to 25 percent. Have all residents within a five-minute walk from a park or open space by adding new parks or open space in underserved areas, adding 150 miles of paths, greenways, and bikeways throughout the city, and transforming an additional 150 miles of canals into vibrant public space.

Panel Discussion
Please feel free to ask your questions in the chat.

Climate Page, Survey, Future
Workshop Information
www.phoenix.gov/climate
Submit questions to
@phxenvironment

Meet with other Union of Concerned Science Members and make our collective voices heard.
June 24 – 5:00 pm MST Register Here
https://us02web.zoom.us/meeting/register/tZMpf-
CpqTsuH9NwzkVNpkTpN9KzlYenAtXR
Join us for a follow up discussion about how we come together to makeour voices heard loud and strong. At this Zoom meeting we will discussstrategy to mobilize a united effort for Phoenix and our state. We needto coordinate our effort across the state as well as push for the federaljobs, infrastructure package to give the cities the resources to take theaggressive action needed.

eat nde
o e
eat nde
o e
eat nde
o e
eat nde
utdoor or ers ecome
more suscepti le to heat
related illness
Children elderly adults
pregnant omen and
people ith underlying
conditions are at
heightened ris o heat
related illness
nyone could e at ris
o heat related illness or
e en death as a result o
prolonged e posure
ndetermined any le el
o e posure is presumed
e tremely dangerous
or all people and li ely
to result in heat related
illness or e en death

Late century: Unprecedented heat

Taking action now would limit expansion of heat

Resources
•Curated Phoenix timeline http://tommybleasdale.com/timeline/timeline.html•Oberle, A. P. and D. D. Arreola (2008). Resurgent Mexican Phoenix. Geographical Review 98(2),•171–196.
Recommended