TRAINEE WORKBOOK
Atlas 5.0 for Microsoft Dynamics AX
Advanced reporting system.

i
Table of Contents 1 Introduction .......................................................................................................................................... 4
1.1 Welcome .......................................................................................................................................................................... 4
1.2 About this course .......................................................................................................................................................... 4
1.2.1 Course description ................................................................................................................................................................. 4
1.2.2 Audience .................................................................................................................................................................................. 4
1.2.3 Objectives ................................................................................................................................................................................ 4
1.2.4 Pre-requisites .......................................................................................................................................................................... 5
1.3 Classroom Training ....................................................................................................................................................... 5
1.4 Training Materials .......................................................................................................................................................... 5
2 Managing data sources ..................................................................................................................... 8
2.1 Outline .............................................................................................................................................................................. 8
2.2 Objectives ........................................................................................................................................................................ 8
2.3 Assigning default Saved Queries to data sources ............................................................................................... 9
2.3.1 Outline ..................................................................................................................................................................................... 9
2.3.2 Walk-through – Customer transactions ............................................................................................................................ 9
2.3.3 Lab. Exercises ........................................................................................................................................................................ 13
2.4 Joining tables for reporting ...................................................................................................................................... 15
2.4.1 Outline ....................................................................................................................................................................................15
2.4.2 Using extended data type relations (the green plus) .....................................................................................................15
2.4.3 Manual single field join to another table .........................................................................................................................15
2.4.4 Using table relations ........................................................................................................................................................... 16
2.4.5 Using AOT Views ................................................................................................................................................................. 16
2.4.6 Walk-through – joining tables using available options ................................................................................................ 18
2.4.7 Lab. Exercises ........................................................................................................................................................................ 23
2.5 Key points ..................................................................................................................................................................... 26
2.6 Quick interaction ........................................................................................................................................................ 27
3 Free-format functions ..................................................................................................................... 28
3.1 Outline ........................................................................................................................................................................... 28
3.2 Objectives ..................................................................................................................................................................... 28
3.3 Top 10 and ranking functions ................................................................................................................................. 29
3.3.1 Outline ................................................................................................................................................................................... 29
3.3.2 Uses ........................................................................................................................................................................................ 29
3.3.3 Walk-through: Ranking sales ............................................................................................................................................ 30
3.3.4 Lab. Exercises ........................................................................................................................................................................ 35
3.4 Cache function ............................................................................................................................................................ 42
3.4.1 Outline ................................................................................................................................................................................... 42
3.4.2 Uses ........................................................................................................................................................................................ 42
3.4.3 Walk-through: Year-to-date sales .................................................................................................................................... 43
3.4.4 Lab. Exercises ........................................................................................................................................................................ 48
Introduction
ii
3.5 Label function ............................................................................................................................................................... 51
3.5.1 Outline ....................................................................................................................................................................................51
3.5.2 Uses .........................................................................................................................................................................................51
3.5.3 Walk-through: Multi-lingual documents ......................................................................................................................... 52
3.6 Key points ..................................................................................................................................................................... 54
3.7 Quick interaction ........................................................................................................................................................ 55
4 Structured reporting functions ..................................................................................................... 56
4.1 Outline ........................................................................................................................................................................... 56
4.2 Objectives ..................................................................................................................................................................... 56
4.3 Managed columns ..................................................................................................................................................... 57
4.3.1 Outline ................................................................................................................................................................................... 57
4.3.2 Uses ........................................................................................................................................................................................ 57
4.3.3 Walk-through: Invoice list with paid amounts ............................................................................................................... 58
4.3.4 Lab. Exercises ........................................................................................................................................................................ 62
4.4 Limiting reports to give Top 10 and last 5 .......................................................................................................... 65
4.4.1 Outline ................................................................................................................................................................................... 65
4.4.2 Uses ........................................................................................................................................................................................ 65
4.4.3 Walk-through: Last 5 sales ................................................................................................................................................ 66
4.4.4 Lab. Exercises ........................................................................................................................................................................ 68
4.5 Grouping and sub-total features ............................................................................................................................ 71
4.5.1 Outline ....................................................................................................................................................................................71
4.5.2 Uses .........................................................................................................................................................................................71
4.5.3 Walk-through: Invoices by customer ............................................................................................................................... 72
4.5.4 Lab. Exercises ........................................................................................................................................................................ 76
4.6 Format options ............................................................................................................................................................ 79
4.6.1 Outline ................................................................................................................................................................................... 79
4.6.2 Uses ........................................................................................................................................................................................ 79
4.6.3 Walk-through: Format options ......................................................................................................................................... 80
4.6.4 Lab. Exercises ........................................................................................................................................................................ 84
4.7 Key points ..................................................................................................................................................................... 86
4.8 Quick interaction ........................................................................................................................................................ 87
5 Pivot tables ........................................................................................................................................ 88
5.1 Outline ........................................................................................................................................................................... 88
5.2 Objectives ..................................................................................................................................................................... 88
5.3 Building pivot table report using Atlas ................................................................................................................. 89
5.3.1 Outline ................................................................................................................................................................................... 89
5.3.2 Uses for the pivot table function ....................................................................................................................................... 89
5.3.3 Walk-through: Pivot table report ...................................................................................................................................... 90
5.3.4 Lab Exercises ......................................................................................................................................................................... 97
5.4 Key points ..................................................................................................................................................................... 99
5.5 Quick interaction ....................................................................................................................................................... 100
Introduction
iii
6 Context information and drill-down .......................................................................................... 101
6.1 Outline .......................................................................................................................................................................... 101
6.2 Objectives .................................................................................................................................................................... 101
6.3 Context drill-out ......................................................................................................................................................... 102
6.3.1 Outline ................................................................................................................................................................................. 102
6.3.2 Uses ...................................................................................................................................................................................... 102
6.3.3 Walk-through: Customer sales analysis with item summary context ..................................................................... 103
6.3.4 Lab. Exercises ...................................................................................................................................................................... 107
6.4 Alternative drill-paths ............................................................................................................................................... 110
6.4.1 Outline ................................................................................................................................................................................. 110
6.4.2 Uses ...................................................................................................................................................................................... 110
6.4.3 Walk-through: Invoice lines .............................................................................................................................................. 111
6.5 Extended drill-down ................................................................................................................................................. 114
6.5.1 Outline ..................................................................................................................................................................................114
6.5.2 Uses .......................................................................................................................................................................................114
6.5.3 Walk-through: Voucher drill-down ................................................................................................................................. 115
6.5.4 Lab. Exercises ...................................................................................................................................................................... 119
6.6 Key points .................................................................................................................................................................... 122
6.7 Quick interaction ....................................................................................................................................................... 123
4
1 Introduction
1.1 Welcome
Training is a vital component of retaining the value of your Atlas investment. Our training keeps you
up-to-date on your solution and helps you develop the skills necessary for you to fully maximize the
value of your investment. Whether you choose to undertake Classroom Training, or download our
Training Materials, there’s a type of training to meet your needs.
1.2 About this course
This course provides you with an introduction to the advanced features of the Atlas reporting
system. This introduction includes:
1.2.1 Course description
This tutor-led course provides students with the knowledge to use the advanced reporting functions
of the Atlas reporting system. The course focuses on the advanced features of the Free-format,
Structured and drill-down functions. The course also includes how to use the Pivot table functions.
This is the second course in the Atlas 5 curriculum and will serve as an advanced level for students
wishing to undertake certification.
1.2.2 Audience
This course is intended for all students who wish to learn about the standard and advanced features
of the Atlas reporting system and how they can be applied. It is expected that students have
completed the introductory course for the Atlas reporting system and that they have a good
understanding of Microsoft Excel and its basic features.
1.2.3 Objectives
The objective of this course is to provide you with the ability to:
Understand the Report ranking function and how to apply it
Understand the Cache function and how to apply it as a means of speeding up large, free-
format function based reports
Understand the label function
Understand and how to use advanced features of the structured reporting functions:
o Limiting record-sets and how that can be used in List and Summary functions
o Grouping
o Managed columns
o Format options and techniques
Understand Pivot tables and how to apply it
Understand advanced drill-down and drill-out features of:
o Context drill-out
o Alternative drill-down
o Extended drill-down
Introduction
5
1.2.4 Pre-requisites
Students must have completed the general introduction to the Atlas reporting system. In addition,
students must be familiar with Microsoft Dynamics AX in particular they must know how to use the
Find and Filter command syntax. They must also have a good knowledge of the basic features of
Microsoft Excel.
1.3 Classroom Training
Classroom Training provides serious, in-depth learning through hands-on interaction. From
demonstrations to presentations to classroom activities, you’ll receive hands-on experience with
instruction from our experts.
1.4 Training Materials
Training Materials allow you to learn at your own pace, on your own time with information-packed
training manuals. We offer a variety of training manuals and user guides, each rich with tips, tricks,
and insights you can refer to again and again:
Atlas Training Workbooks are very detailed training manuals, designed from a training perspective.
These manuals include advanced topics as well as training objectives, exercises and interactions.
Look for a complete list of manuals available from your partner or via the website:
www.atlas4synamicsAX.com.au.
Before you begin please check that you have the following:
You must have a copy of Dynamics AX 2012 installed and working on the CEU company. Or,
A copy of Microsoft Dynamics AX 2012 installed in a VPC with the demonstration company CEU
installed. Or,
Atlas 5.0 installed with connections to the appropriate Microsoft Dynamics AX installation. (If
you are using the VPC with an Atlas differential installed, then this should already be working)
An Atlas client icon on the desktop, configured to point to the training system
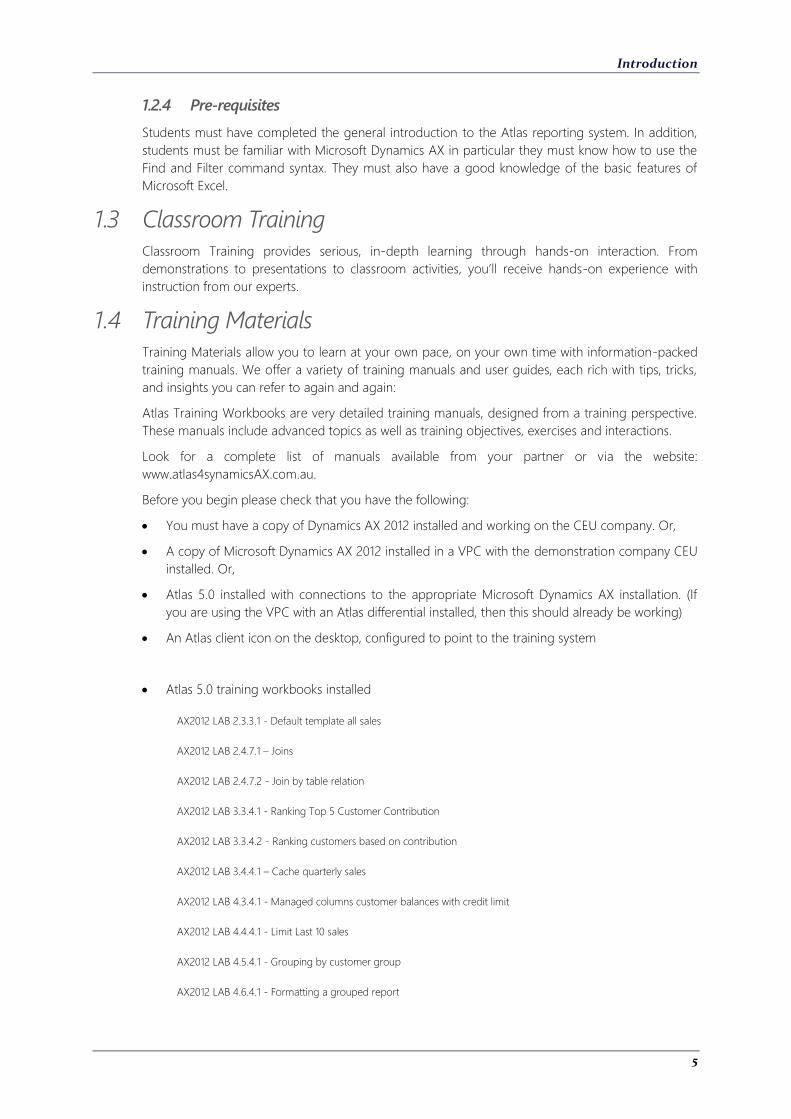
Atlas 5.0 training workbooks installed
AX2012 LAB 2.3.3.1 - Default template all sales
AX2012 LAB 2.4.7.1 – Joins
AX2012 LAB 2.4.7.2 - Join by table relation
AX2012 LAB 3.3.4.1 - Ranking Top 5 Customer Contribution
AX2012 LAB 3.3.4.2 - Ranking customers based on contribution
AX2012 LAB 3.4.4.1 – Cache quarterly sales
AX2012 LAB 4.3.4.1 - Managed columns customer balances with credit limit
AX2012 LAB 4.4.4.1 - Limit Last 10 sales
AX2012 LAB 4.5.4.1 - Grouping by customer group
AX2012 LAB 4.6.4.1 - Formatting a grouped report
Introduction
6
AX2012 LAB 5.3.4.1 – Pivot table sales by day
AX2012 LAB 6.3.4.1 – Drill out on item sales to invoices
AX2012 LAB 6.5.4.1 - Extended drill-down
Atlas 5 completed training workbooks:
AX2012 COMPLETE LAB 2.3.3.1 - Default template all sales
AX2012 COMPLETE LAB 2.4.7.1 – Joins
AX2012 COMPLETE LAB 2.4.7.2 - Join by table relation
AX2012 COMPLETE LAB 3.3.4.1 - Ranking Top 5 Customer Contribution
AX2012 COMPLETE LAB 3.3.4.2 - Ranking customers based on contribution
AX2012 COMPLETE LAB 3.4.4.1 – Cache quarterly sales
AX2012 COMPLETE LAB 4.3.4.1 - Managed columns customer balances with credit limit
AX2012 COMPLETE LAB 4.4.4.1 - Limit Last 10 sales
AX2012 COMPLETE LAB 4.5.4.1 - Grouping by customer group
AX2012 COMPLETE LAB 4.6.4.1 - Formatting a grouped report
AX2012 COMPLETE LAB 5.3.4.1 – Pivot table sales by day
AX2012 COMPLETE LAB 6.3.4.1 – Drill out on item sales to invoices
AX2012 COMPLETE LAB 6.5.4.1 - Extended drill-down
Atlas 5.0 instructor walkthrough workbooks:
AX2012 WALKTHROUGH 2.3.3 - Default saved query
AX2012 WALKTHROUGH 2.4.3 - Joins with customer table
AX2012 WALKTHROUGH 3.3.3 - Top 5 Invoiced sales orders
AX2012 WALKTHROUGH 3.4.3 – Cache
AX2012 WALKTHROUGH 3.5.3 – Labels
AX2012 WALKTHROUGH 4.3.3 - Managed column
AX2012 WALKTHROUGH 4.4.3 - Limit last 5 invoices
AX2012 WALKTHROUGH 4.5.3 - Grouping invoices by customer
AX2012 WALKTHROUGH 4.6.3 - Format weekly sales
AX2012 WALKTHROUGH 5.3.3 - Pivot table customer group sales by period

Introduction
7
AX2012 WALKTHROUGH 6.3.3 - Drill out customer sales
AX2012 WALKTHROUGH 6.4.3 - Alternate drill down customer sales
AX2012 WALKTHROUGH 6.5.3 - Extended drill-down
Upload data source file and templates:
AX2012 Training Reporting.AtlasDataSources
AX2012 Sample Cust.AtlasDataSources
8
2 Managing data sources
2.1 Outline
Atlas can make use of AOT Tables, AOT Views and AOT Queries (via a View) to meet the demands
of your reporting. Atlas provides a number of ways in which you can link tables together, these
include joins through an extended data type associated with a table field, through table relations,
through a user defined single field join and through a virtual table known as a view. The latter
appears in the data source list as a table in its own right.
In addition to flexible linking of data sources for reporting, you can also use features within the data
source list that allow you to associate atlas Functions to pre-set shared, saved queries. This feature is
particularly useful for assigning default drill-down queries to data sources where the AX2012 data
model fragments fields you might want to see together.
2.2 Objectives
At the end of this chapter, you will be able to:
Understand the various methods by which data sources can be joined
Understand when to use these join methods
Understand what is meant by a View or AOT View and its limitations
Understand Default templates in a data source list
Understand when to apply Default templates
Managing data sources
9
2.3 Assigning default Saved Queries to data sources
2.3.1 Outline
Atlas 5 has made it easier to build your reports quickly. A feature that assists you with this is the
default query option. This allows you to associate a table with a default shared saved query by Atlas
function. This means that when you choose an Atlas reporting function if there are any saved
queries associated with your chosen data source, then this will be used as a default basis for your
report.
You can associate a shared saved query to all the free-format and structured reporting functions as
well as to the drill-down function for that table.
Define these associations using the Data source designer. These associations persist for the
selected data source.
2.3.2 Walk-through – Customer transactions
2.3.2.1 Outline
In your organization, you always want to include the following columns in any list report from the
Customer transactions table: Customer account, Name, Group, Payment method, Voucher, Date,
Description, Amount, Currency, transaction currency amount and settled amount currency.
Normally, you would adjust each list report to suit, but using this technique, you can make you
changes once and re-use the settings whenever you need a new report. In this exercise you will:
Build a saved query for the Customer transactions table
Associate the saved query with the reporting function
Test the association by running a report
Use AX2012 WALKTHROUGH 2.3.3 – Default saved query.xlsx
2.3.2.2 Build the customer transactions list
The list of invoice lines is built using the Query menu and the List function therein.1 The list report
will show each line item on the invoice and will include the item, description, quantity, and amount
in default currency.
1. From the Ribbon bar, on the Atlas tab, in the Reporting group click the Query drop down
menu
2. Select List from the menu shown
3. Tick to select the Customer transactions in the data source list
4. Select Filters tab
5. Click to select the Customer account row
6. Right-click and select =AccountNum into the criteria box
7. Open Style : List tab
8. Click to select the Report Columns (Customer transactions) node
9. Click the Add/Remove fields button
10. Click to expand the Available fields node
1 The difference between a function on the Query menu and that of the main ribbon is that the ribbon inserts the reporting function into the
current document, where the menu allows you to save the definition, only.
Managing data sources
10
11. Navigate the list and tick to select the field Amount
12. Navigate the list and tick to select the field Method of payment
13. Click Apply
14. Click to select the green plus adjacent to the Customer account entry
15. Click to expand the Available fields node beneath the Customers entry
16. Tick to select the Customer group in the list of fields
17. Click Apply to copy your selections into the list task pane
18. Click to select the green plus adjacent to the Name entry
19. Click to expand the Available fields node beneath the Address book entry
20. Tick to select the Name in the list of fields
21. Click OK to copy your selections into the list task pane
22. Using the green up and down arrows, arrange the field list accordingly: Customer account,
Name, Group, Payment method, Voucher, Date, Description, Amount, Currency,
transaction currency amount and settled amount currency.
23. Click Save As…
24. In the file name type 2.3.1 Customer transactions
25. Tick to select Shared
26. Click OK
You now need to associate query with the default template settings in the data source designer.
2.3.2.3 Assigning this query as a default for this table
Now that you have the query you want to use whenever you select a List function for the Customer
transactions table, you need to tell the system of this association. To do this you need to use the
Data source Designer:
1. Select any reporting function from the Atlas ribbon
2. Open the Data source tab
3. Click to select the Tables menu option
4. Choose the Designer… menu option
Managing data sources
11
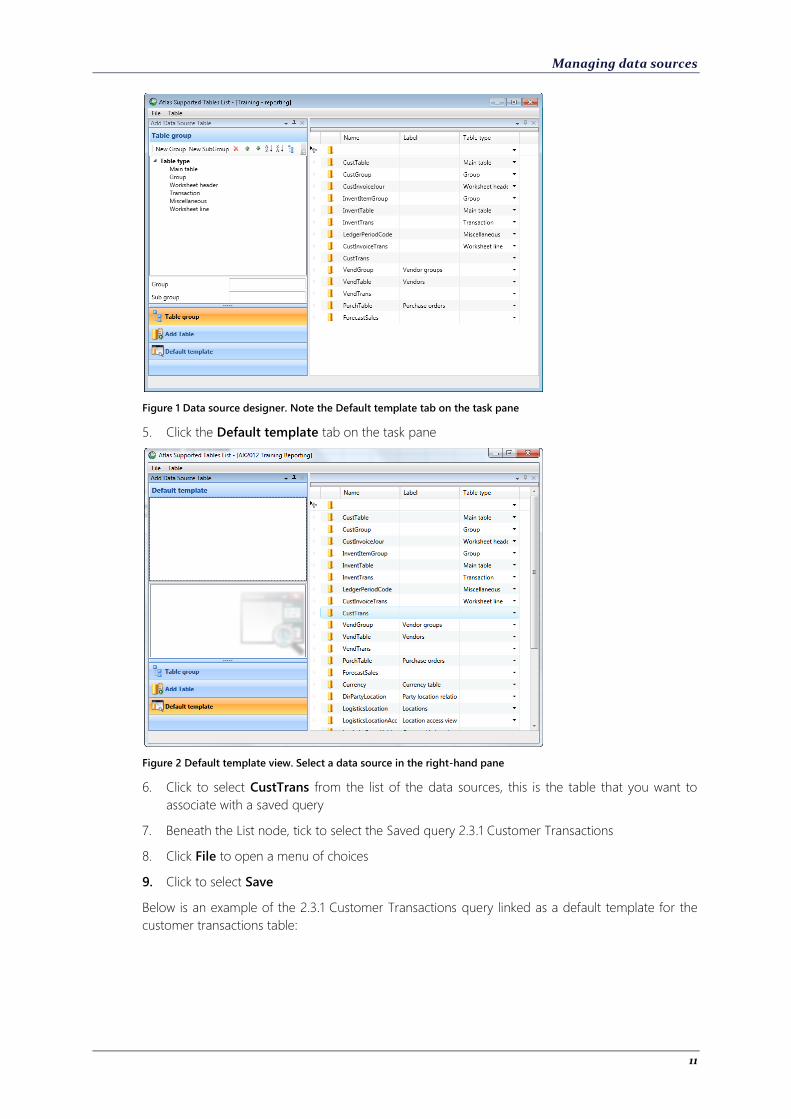
Figure 1 Data source designer. Note the Default template tab on the task pane
5. Click the Default template tab on the task pane
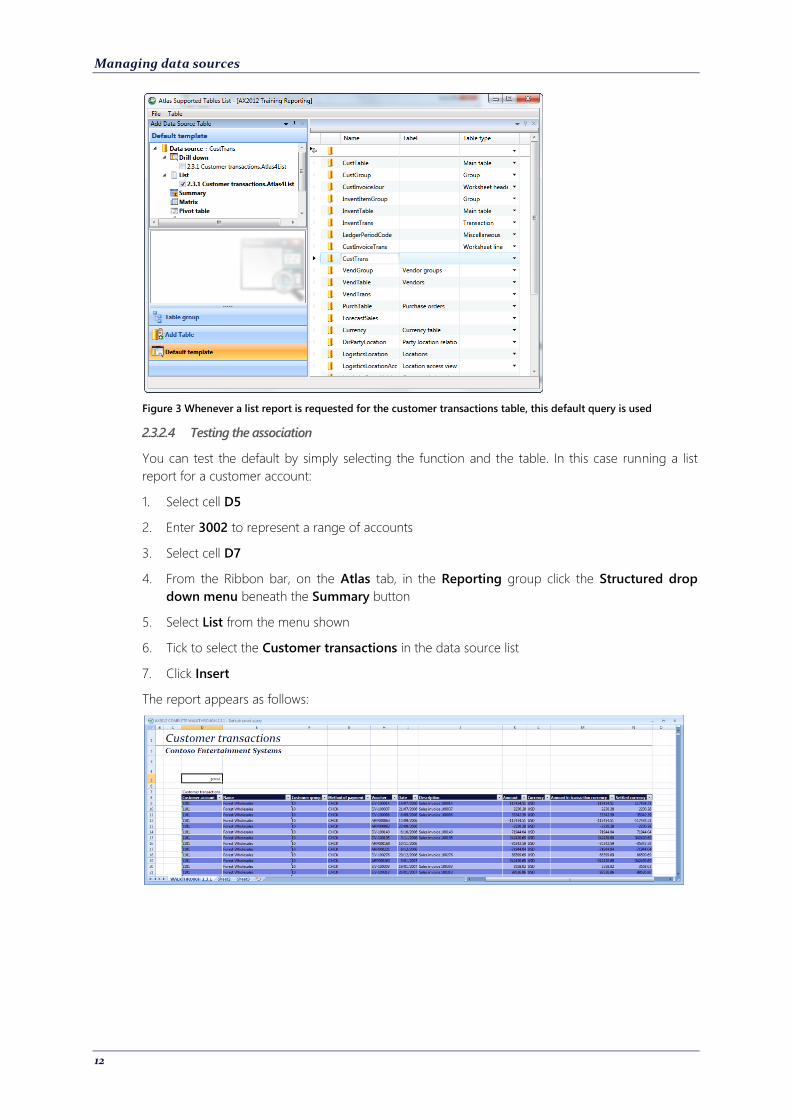
Figure 2 Default template view. Select a data source in the right-hand pane
6. Click to select CustTrans from the list of the data sources, this is the table that you want to
associate with a saved query
7. Beneath the List node, tick to select the Saved query 2.3.1 Customer Transactions
8. Click File to open a menu of choices
9. Click to select Save
Below is an example of the 2.3.1 Customer Transactions query linked as a default template for the
customer transactions table:
Managing data sources
12
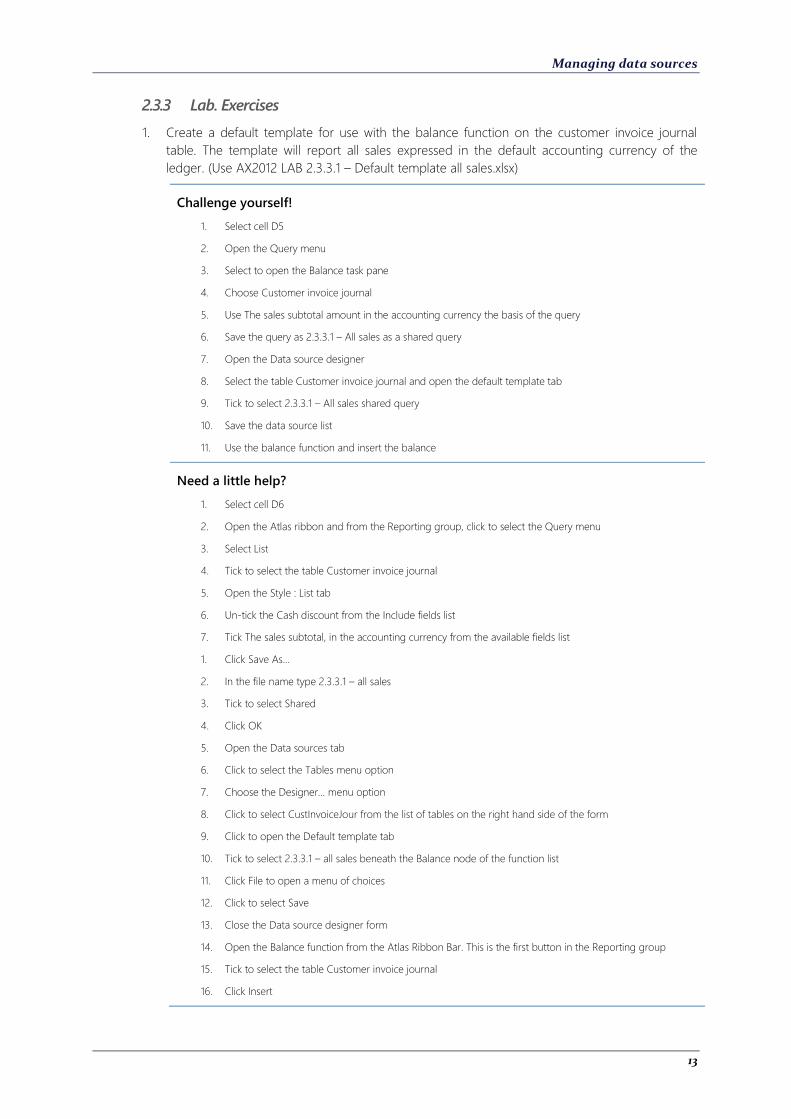
Figure 3 Whenever a list report is requested for the customer transactions table, this default query is used
2.3.2.4 Testing the association
You can test the default by simply selecting the function and the table. In this case running a list
report for a customer account:
1. Select cell D5
2. Enter 3002 to represent a range of accounts
3. Select cell D7
4. From the Ribbon bar, on the Atlas tab, in the Reporting group click the Structured drop
down menu beneath the Summary button
5. Select List from the menu shown
6. Tick to select the Customer transactions in the data source list
7. Click Insert
The report appears as follows:
Managing data sources
13
2.3.3 Lab. Exercises
1. Create a default template for use with the balance function on the customer invoice journal
table. The template will report all sales expressed in the default accounting currency of the
ledger. (Use AX2012 LAB 2.3.3.1 – Default template all sales.xlsx)
Challenge yourself!
1. Select cell D5
2. Open the Query menu
3. Select to open the Balance task pane
4. Choose Customer invoice journal
5. Use The sales subtotal amount in the accounting currency the basis of the query
6. Save the query as 2.3.3.1 – All sales as a shared query
7. Open the Data source designer
8. Select the table Customer invoice journal and open the default template tab
9. Tick to select 2.3.3.1 – All sales shared query
10. Save the data source list
11. Use the balance function and insert the balance
Need a little help?
1. Select cell D6
2. Open the Atlas ribbon and from the Reporting group, click to select the Query menu
3. Select List
4. Tick to select the table Customer invoice journal
5. Open the Style : List tab
6. Un-tick the Cash discount from the Include fields list
7. Tick The sales subtotal, in the accounting currency from the available fields list
1. Click Save As…
2. In the file name type 2.3.3.1 – all sales
3. Tick to select Shared
4. Click OK
5. Open the Data sources tab
6. Click to select the Tables menu option
7. Choose the Designer… menu option
8. Click to select CustInvoiceJour from the list of tables on the right hand side of the form
9. Click to open the Default template tab
10. Tick to select 2.3.3.1 – all sales beneath the Balance node of the function list
11. Click File to open a menu of choices
12. Click to select Save
13. Close the Data source designer form
14. Open the Balance function from the Atlas Ribbon Bar. This is the first button in the Reporting group
15. Tick to select the table Customer invoice journal
16. Click Insert
Managing data sources
14
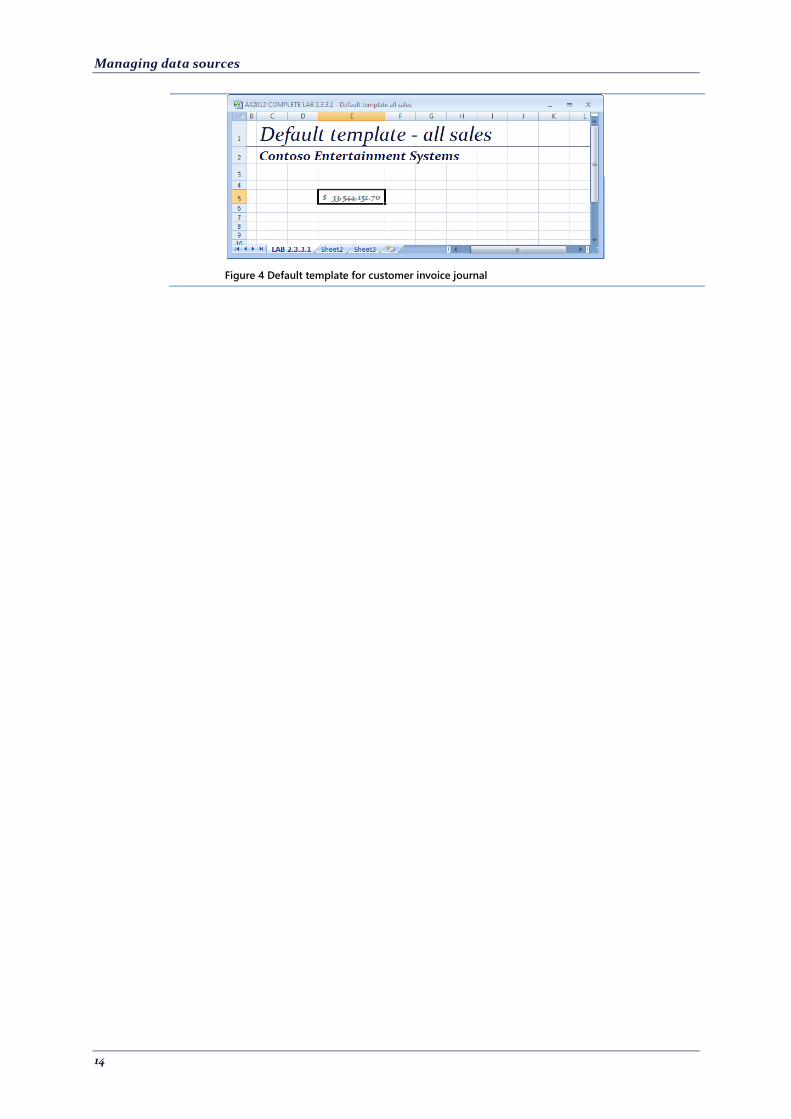
Figure 4 Default template for customer invoice journal
Managing data sources
15
2.4 Joining tables for reporting
2.4.1 Outline
Atlas 5 provides several ways in which tables can be joined for reporting purposes. These are as
follows:
Field level, green plus extended data type
Manual single field relation between two tables
Table relations
AOT Views
This section describes each.
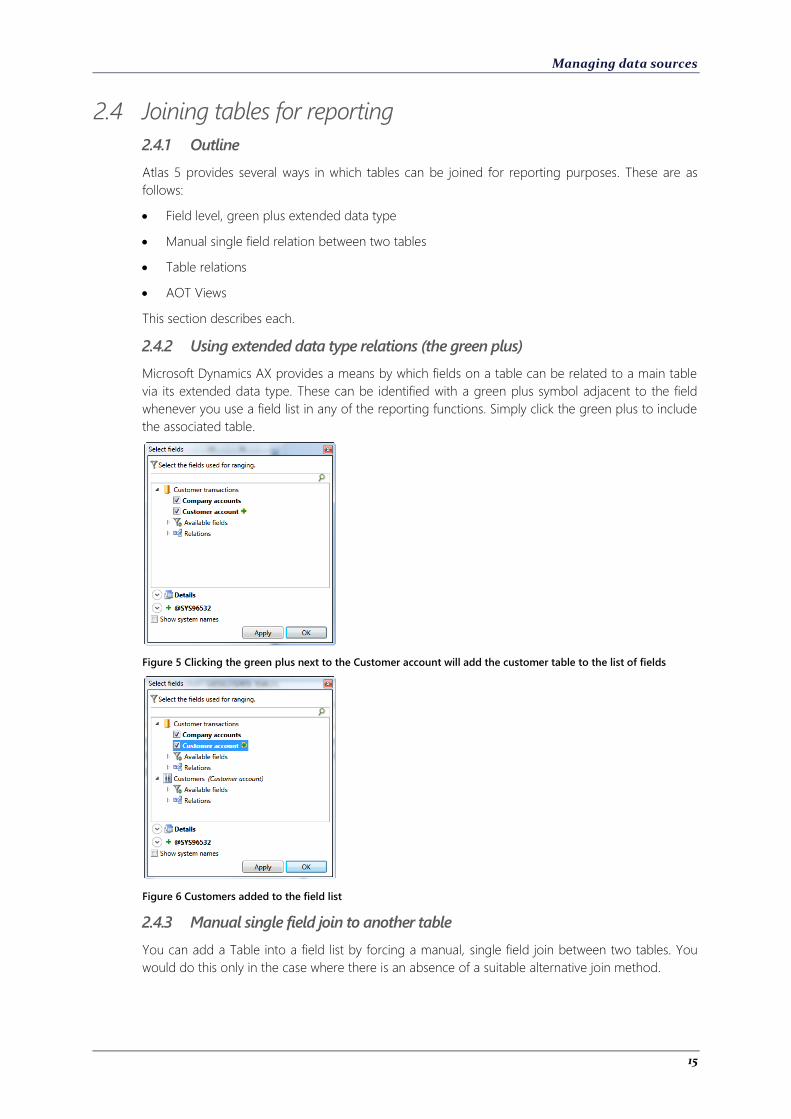
2.4.2 Using extended data type relations (the green plus)
Microsoft Dynamics AX provides a means by which fields on a table can be related to a main table
via its extended data type. These can be identified with a green plus symbol adjacent to the field
whenever you use a field list in any of the reporting functions. Simply click the green plus to include
the associated table.
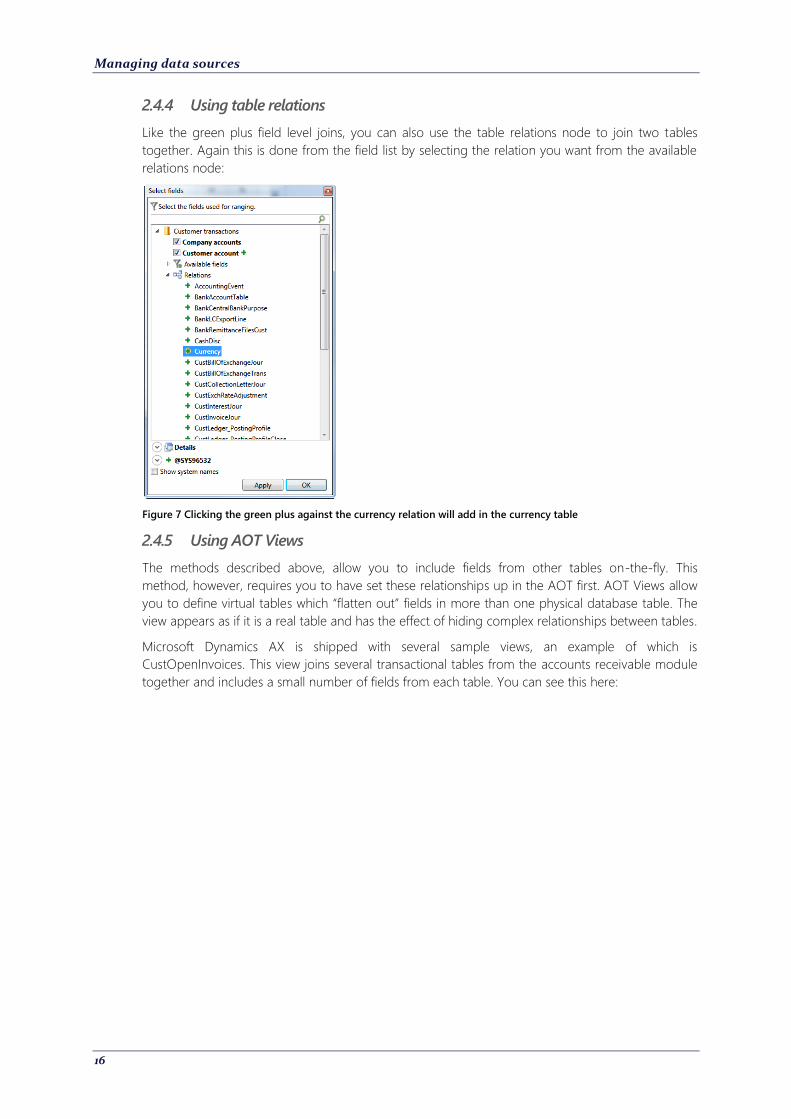
Figure 5 Clicking the green plus next to the Customer account will add the customer table to the list of fields
Figure 6 Customers added to the field list
2.4.3 Manual single field join to another table
You can add a Table into a field list by forcing a manual, single field join between two tables. You
would do this only in the case where there is an absence of a suitable alternative join method.
Managing data sources
16
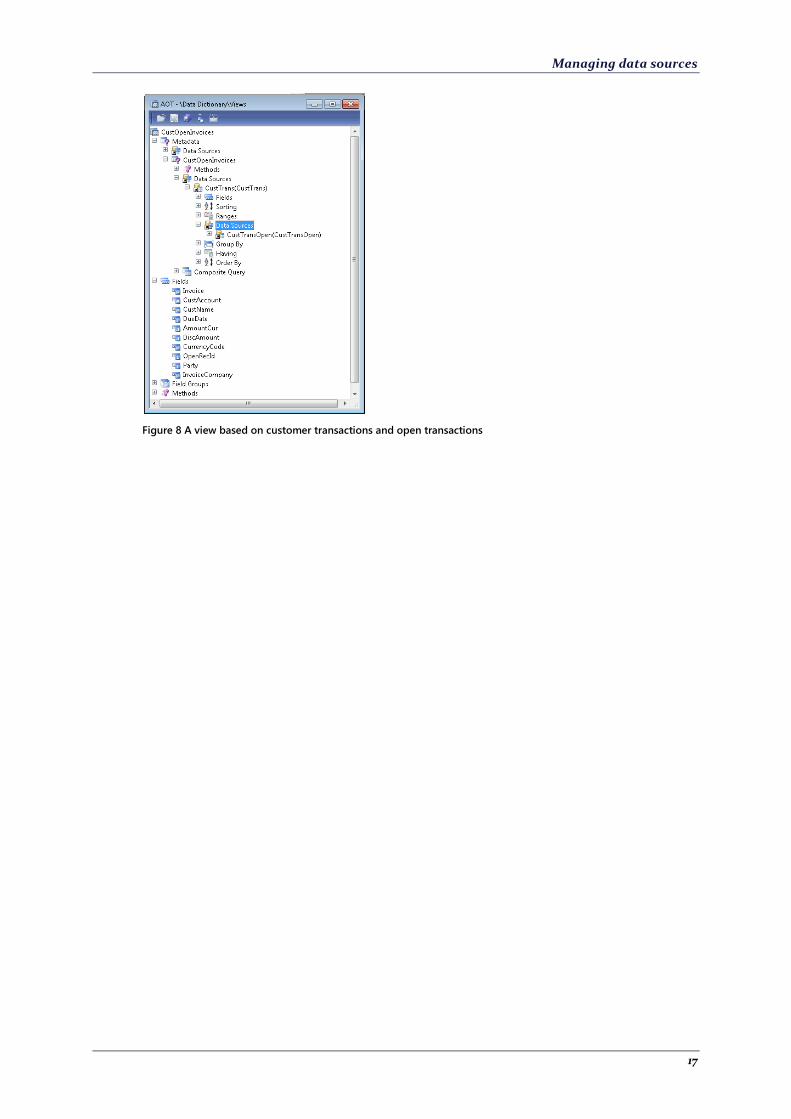
2.4.4 Using table relations
Like the green plus field level joins, you can also use the table relations node to join two tables
together. Again this is done from the field list by selecting the relation you want from the available
relations node:
Figure 7 Clicking the green plus against the currency relation will add in the currency table
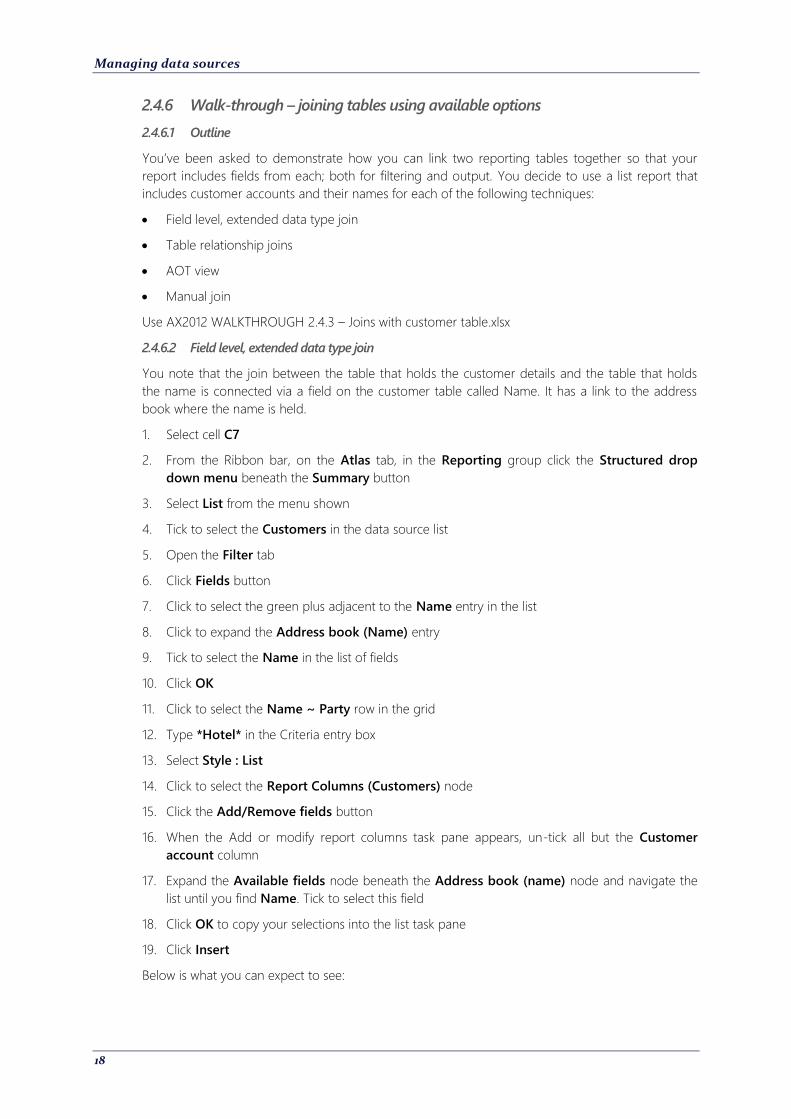
2.4.5 Using AOT Views
The methods described above, allow you to include fields from other tables on-the-fly. This
method, however, requires you to have set these relationships up in the AOT first. AOT Views allow
you to define virtual tables which “flatten out” fields in more than one physical database table. The
view appears as if it is a real table and has the effect of hiding complex relationships between tables.
Microsoft Dynamics AX is shipped with several sample views, an example of which is
CustOpenInvoices. This view joins several transactional tables from the accounts receivable module
together and includes a small number of fields from each table. You can see this here:
Managing data sources
17
Figure 8 A view based on customer transactions and open transactions
Managing data sources
18
2.4.6 Walk-through – joining tables using available options
2.4.6.1 Outline
You’ve been asked to demonstrate how you can link two reporting tables together so that your
report includes fields from each; both for filtering and output. You decide to use a list report that
includes customer accounts and their names for each of the following techniques:
Field level, extended data type join
Table relationship joins
AOT view
Manual join
Use AX2012 WALKTHROUGH 2.4.3 – Joins with customer table.xlsx
2.4.6.2 Field level, extended data type join
You note that the join between the table that holds the customer details and the table that holds
the name is connected via a field on the customer table called Name. It has a link to the address
book where the name is held.
1. Select cell C7
2. From the Ribbon bar, on the Atlas tab, in the Reporting group click the Structured drop
down menu beneath the Summary button
3. Select List from the menu shown
4. Tick to select the Customers in the data source list
5. Open the Filter tab
6. Click Fields button
7. Click to select the green plus adjacent to the Name entry in the list
8. Click to expand the Address book (Name) entry
9. Tick to select the Name in the list of fields
10. Click OK
11. Click to select the Name ~ Party row in the grid
12. Type *Hotel* in the Criteria entry box
13. Select Style : List
14. Click to select the Report Columns (Customers) node
15. Click the Add/Remove fields button
16. When the Add or modify report columns task pane appears, un-tick all but the Customer
account column
17. Expand the Available fields node beneath the Address book (name) node and navigate the
list until you find Name. Tick to select this field
18. Click OK to copy your selections into the list task pane
19. Click Insert
Below is what you can expect to see:

Managing data sources
19
Figure 9 Customers with the word Hotel in their name
2.4.6.3 Table relation joins
This method uses relations defined in the AOT at a table level. You can select these in the field list
by exploring the Relations node found there.
1. Select cell C7
2. From the Ribbon bar, on the Atlas tab, in the Reporting group click the Structured drop
down menu beneath the Summary button
3. Select List from the menu shown
4. Tick to select the Customers in the data source list
5. Open the Filter tab
6. Click Fields button
7. Click to expand the Relations node
8. Click to select the green plus adjacent to the DirPartyTable_FK entry in the list
9. Click to expand the Available fields under the Address book (DirPartyTable) node
10. Tick to select the Name in the list of fields
11. Click OK
12. Click to select the Name ~ DirPartyTable_Fk row in the grid
13. Type *Hotel* in the Criteria entry box
14. Select Style : List
15. Click to select the Report Columns (Customers) node
16. Click the Add/Remove fields button
17. When the Add or modify report columns task pane appears, un-tick all but the Customer
account column
18. Expand the Available fields node beneath the Address book (name) node and navigate the
list until you find Name. Tick to select this field
19. Click OK to copy your selections into the list task pane
20. Click Insert
Below is what you can expect to see:
Managing data sources
20
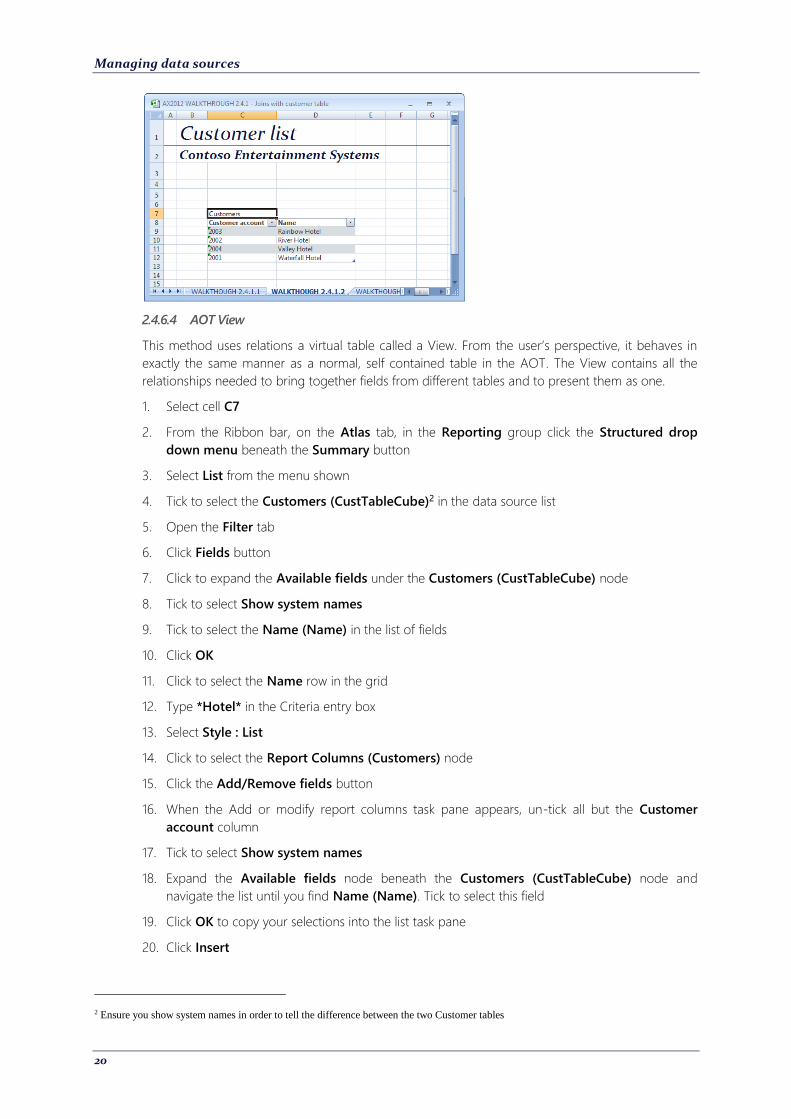
2.4.6.4 AOT View
This method uses relations a virtual table called a View. From the user’s perspective, it behaves in
exactly the same manner as a normal, self contained table in the AOT. The View contains all the
relationships needed to bring together fields from different tables and to present them as one.
1. Select cell C7
2. From the Ribbon bar, on the Atlas tab, in the Reporting group click the Structured drop
down menu beneath the Summary button
3. Select List from the menu shown
4. Tick to select the Customers (CustTableCube)2 in the data source list
5. Open the Filter tab
6. Click Fields button
7. Click to expand the Available fields under the Customers (CustTableCube) node
8. Tick to select Show system names
9. Tick to select the Name (Name) in the list of fields
10. Click OK
11. Click to select the Name row in the grid
12. Type *Hotel* in the Criteria entry box
13. Select Style : List
14. Click to select the Report Columns (Customers) node
15. Click the Add/Remove fields button
16. When the Add or modify report columns task pane appears, un-tick all but the Customer
account column
17. Tick to select Show system names
18. Expand the Available fields node beneath the Customers (CustTableCube) node and
navigate the list until you find Name (Name). Tick to select this field
19. Click OK to copy your selections into the list task pane
20. Click Insert
2 Ensure you show system names in order to tell the difference between the two Customer tables

Managing data sources
21
Here is an example of the report:
2.4.6.5 Including fields from different tables using manual joins
You can force a join between tables whenever you do have any other means of establishing a link.
(That is, when there is no field level green plus, table relation or AOT view available). Normally, this
method would be used when the other methods are not available. You should note, the following
demonstrates the principle and is not example where this kind of join is required.
1. Select cell C7
2. From the Ribbon bar, on the Atlas tab, in the Reporting group click the Structured drop
down menu beneath the Summary button
3. Select List from the menu shown
4. Tick to select the Customers in the data source list
5. Open the Filter tab
6. Click Fields button
7. Click to select the Customer node at the top of the form
8. Click to expand the Add table button
9. Select Party from the Field name drop-down list
10. Select DirPartyTable from the Reference table name drop-down list
11. Select RecId from Reference field name drop-down list
12. Click to select Join
13. Click to expand the Available fields under the Address book node
14. Tick to select the Name in the list of fields
15. Click OK
16. Click to select the Name ~ Party row in the grid
17. Type *Hotel* in the Criteria entry box

Managing data sources
22
18. Select Style : List
19. Click to select the Report Columns (Customers) node
20. Click the Add/Remove fields button
21. When the Add or modify report columns task pane appears, un-tick all but the Customer
account column
22. Expand the Available fields node beneath the Address book (DirPartyTable) node and
navigate the list until you find Name. Tick to select this field
23. Click OK to copy your selections into the list task pane
24. Click Insert
The following is the resulting list:
Managing data sources
23
2.4.7 Lab. Exercises
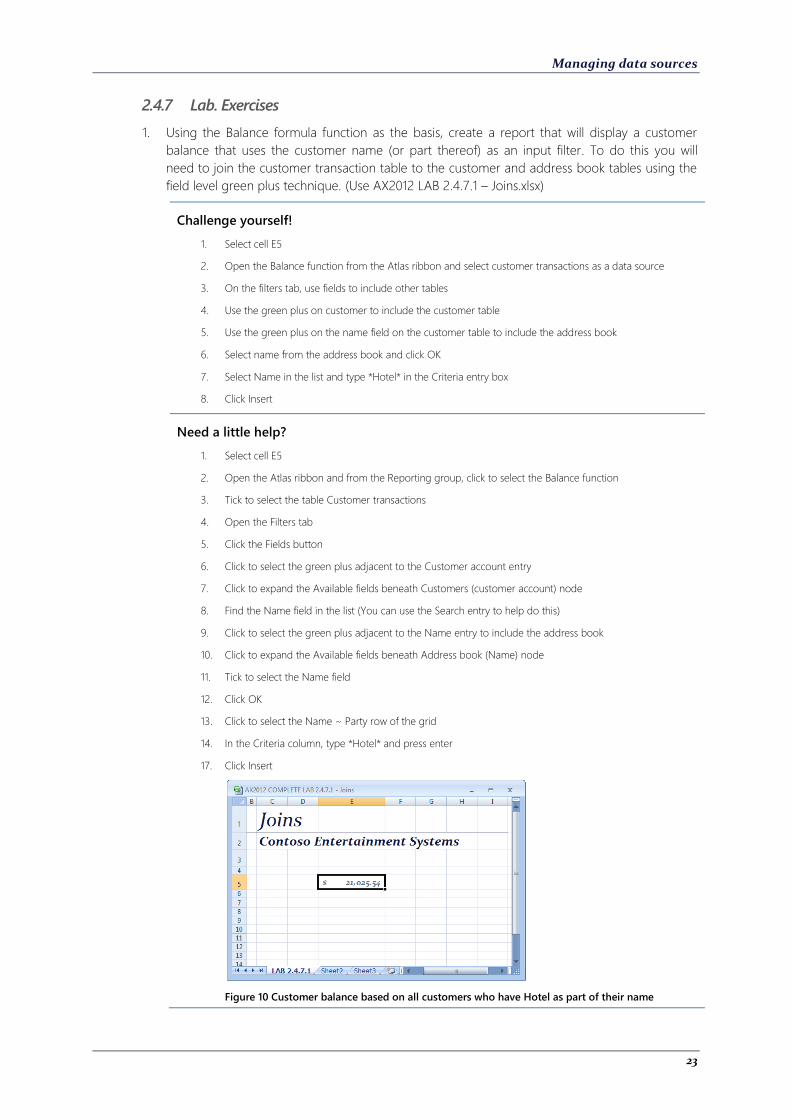
1. Using the Balance formula function as the basis, create a report that will display a customer
balance that uses the customer name (or part thereof) as an input filter. To do this you will
need to join the customer transaction table to the customer and address book tables using the
field level green plus technique. (Use AX2012 LAB 2.4.7.1 – Joins.xlsx)
Challenge yourself!
1. Select cell E5
2. Open the Balance function from the Atlas ribbon and select customer transactions as a data source
3. On the filters tab, use fields to include other tables
4. Use the green plus on customer to include the customer table
5. Use the green plus on the name field on the customer table to include the address book
6. Select name from the address book and click OK
7. Select Name in the list and type *Hotel* in the Criteria entry box
8. Click Insert
Need a little help?
1. Select cell E5
2. Open the Atlas ribbon and from the Reporting group, click to select the Balance function
3. Tick to select the table Customer transactions
4. Open the Filters tab
5. Click the Fields button
6. Click to select the green plus adjacent to the Customer account entry
7. Click to expand the Available fields beneath Customers (customer account) node
8. Find the Name field in the list (You can use the Search entry to help do this)
9. Click to select the green plus adjacent to the Name entry to include the address book
10. Click to expand the Available fields beneath Address book (Name) node
11. Tick to select the Name field
12. Click OK
13. Click to select the Name ~ Party row of the grid
14. In the Criteria column, type *Hotel* and press enter
17. Click Insert
Figure 10 Customer balance based on all customers who have Hotel as part of their name
Managing data sources
24
2. You also want to try the table relations method in a customer balance report, this time you
want to include the sales order number and the invoice amount on a list of open customer
transactions. To do this you will need to join the open customer transaction table to the
customer invoice journal table and use, as input, a customer code picked from the worksheet.
(Use AX2012 LAB 2.4.7.2 – Join by table relation.xlsx)
Challenge yourself!
1. Select cell D7
2. Open the List function from the Atlas ribbon
3. Select the open customer transaction table from the data source list
4. On the filters tab, click to select customer account
5. Use the right-click option and select =AccountNum as the criteria
6. On the Style : List tab click Add/Remove fields
7. Open the Available fields and include the Due date and the Amount fields. Click Apply
8. Open the Relations node and click to select the green plus adjacent to CustTrans
9. Open the Available fields and include the Description, Invoice and Amount settled. Click OK
10. Use the green arrow keys to adjust the field order accordingly: Customer account, Description, Invoice,
Date, Due date, Amount, Amount settled
11. Click Insert
Need a little help?
1. Select cell D7
2. Open the Atlas ribbon and from the Reporting group, click the drop-down beneath the Summary function
3. Click to select the List function
4. Tick to select the table Open customer transactions
5. Open the Filters tab
6. Click to select the Customer account row of the grid
7. Right-click to select =AccountNum from the menu
8. Select Style : List tab
9. Click the Add/Remove fields button
10. When the Add or modify report columns task pane appears, expand the Available fields node and
navigate the list and tick to select the Amount and the Due date fields
11. Click Apply
12. Click to expand the Relations node
13. Click to select the green plus adjacent to the CustTrans entry to include the Customer transactions table
14. Click to expand the Available fields beneath Customer transactions (CustTrans) node
15. Tick to select the Description, Invoice and Amount settled fields
16. Click OK
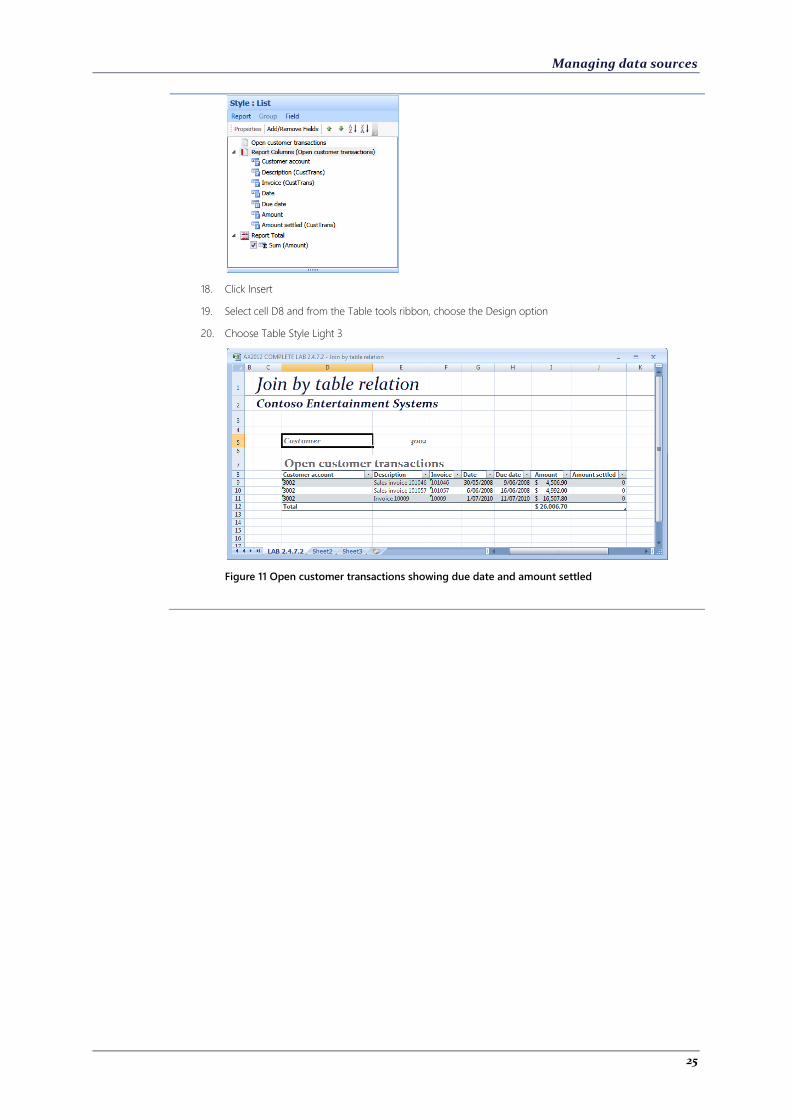
17. Use the green arrows to adjust the list to match the following order:
Managing data sources
25
18. Click Insert
19. Select cell D8 and from the Table tools ribbon, choose the Design option
20. Choose Table Style Light 3
Figure 11 Open customer transactions showing due date and amount settled
Managing data sources
26
2.5 Key points
This section introduced you to features that allow you manage your data sources:
Default templates per table and function
Methods of joining tables for the purpose of including reporting fields
Specifically we saw that:
Shared saved queries for a given table can be assigned to an Atlas function in a data source list.
You can do this from the data source Designer
Default templates mean you can simply select the data source and click insert. The assigned
query will automatically be run
Default templates are very useful for drill-down as they mask the underlying complexity of
joined tables
You can join tables for reporting purposes. You will do this when you want to include filter fields
and when you want to include fields in the output options for the reporting function
There are four ways in which you can join tables. These include:
o Field level green plus relationships
o Table relations
o AOT Views
o Manual joins based on a single related field between tables
Manual joins will should only be used when the other options for joining are not available and
when you can join exactly using one related field
You cannot join tables to AOT Views on-the-fly, you must include all tables and corresponding
fields into the AOT View
Table relations are defined in the AOT for a table in the data dictionary
Field relationships are defined using what Microsoft Dynamics AX calls Extended Data Types
(EDTs). Again defined in the AOT
AOT Views are defined in the AOT and can be based upon table relationships or AOT Queries
Managing data sources
27
2.6 Quick interaction
Take a moment to write down the three key points you have learned:
1.
2.
3.
28
3 Free-format functions
3.1 Outline
This section discusses the additional free-format reporting functions of Cache, Report ranking and
Label. Label operates like other free-format functions, but Cache and Report ranking return a result-
set that is consumed by other Atlas functions, like Balance and Column.
These functions behave like any other formula functions found in Microsoft Excel. Because of this,
they are refreshed automatically and/or whenever a parent, source cell changes.
3.2 Objectives
At the end of this chapter, you will be able to:
Identify the three extended free-format functions of:
o Report ranking
o Cache
o Label
Understand how each of these three free-format functions are built and used
Understand how to edit reports that use these functions
Understand how to use these functions with other Atlas functions

Free-format functions
29
3.3 Top 10 and ranking functions
3.3.1 Outline
The Report ranking function is a free-format function that is used to generate an in-memory result-
set of ranked items; the Balance and the Column functions consume this in-memory result-set and
present its contents into single cells of your report.
The ranking function can be configured to deliver ascending and ascending result-sets for top and
bottom analysis and can have more than one basis for ranking. For example, sales can be rankled
by customer and by state.
The balance and column functions can be used to return the basis or the ranked amounts in the
result-set or they can be used to return the rank itself. For example, you can provide as a filter, a
customer account, and it will determine how they are ranked in terms of revenue contribution.
Like all free-format functions, this function accepts filter input, which can be sourced from your
workbook or document.
3.3.2 Uses
The Report ranking function is not often used in isolation. It is always used in conjunction with other
Atlas functions; either Balance or Column to form a report. The ranking function generates the
ranked result-set and the other free-format functions consume its output as part of the report.
Typically you will use the Report ranking function in the following instances:
Where you want to generate the ranked SUM or ranked COUNT of a numeric attribute on a
table for use by other Atlas functions
Where you want to inspect the Top n items in a table. E.g. who are our best customers in terms
of revenue contribution?
Where you want to inspect the Bottom n items in a table. E.g. what were the least contributory
customers to revenue?
Where you want to return the ranking of an item in a table. E.g. how is customer 3001 ranked in
terms of revenue contribution?
Free-format functions
30
3.3.3 Walk-through: Ranking sales
3.3.3.1 Scenario
You’ve been asked to provide a report of the highest value invoiced sales orders for a given period.
You have decided to build a free-format report that uses the Report ranking, Balance and Column
functions. Additionally, you’ve included a date range which the user can adjust. The report will
automatically refresh and the values will reflect that of the new date range when adjustments to this
range are made. To do this you will:
Build a Report ranking function that generates a result-set of ranked, invoiced sales orders
Consume the Report ranking result-set with a Column function to return the sales order
number
Consume the Report ranking result-set with a Balance function to return the value invoiced
Use AX2012 WALKTHROUGH 3.3.3 - Top 5 Invoiced sales orders.xlsx.
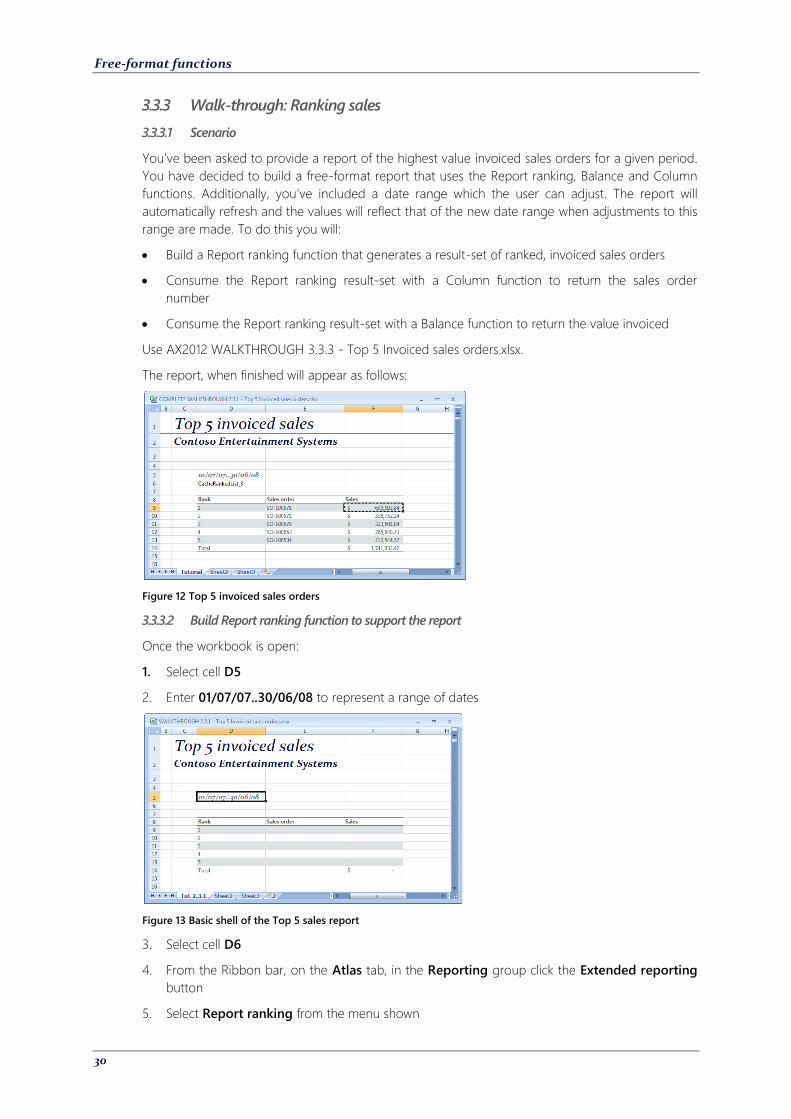
The report, when finished will appear as follows:
Figure 12 Top 5 invoiced sales orders
3.3.3.2 Build Report ranking function to support the report
Once the workbook is open:
1. Select cell D5
2. Enter 01/07/07..30/06/08 to represent a range of dates
Figure 13 Basic shell of the Top 5 sales report
3. Select cell D6
4. From the Ribbon bar, on the Atlas tab, in the Reporting group click the Extended reporting
button
5. Select Report ranking from the menu shown
Free-format functions
31
6. Tick to select the Customer invoice journal in the data source list
7. Select Filters and click to select the Date row in the grid
8. Use right-click and from the menu choose Pick
9. When the Date range selection box appears, navigate to cell D5 and click OK to select it
10. Select Style : Report ranking
11. Click to select the Report Columns (Customer invoice journal) node
12. Click the Add/Remove fields button
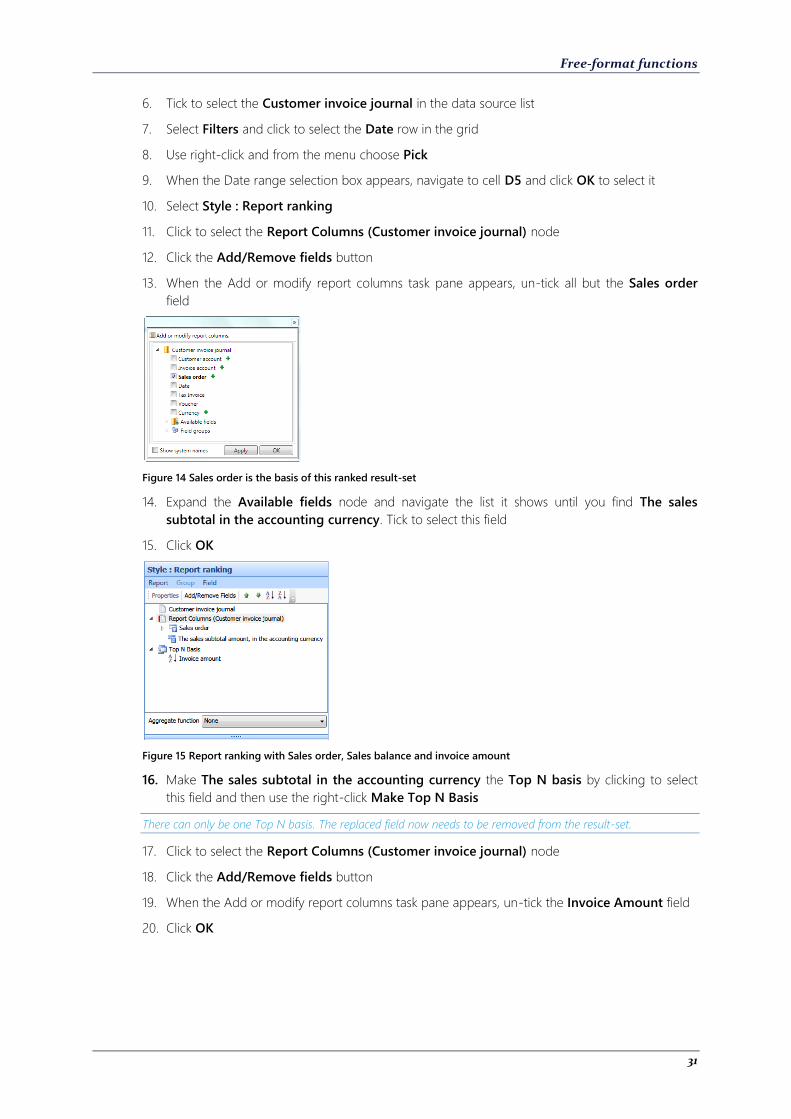
13. When the Add or modify report columns task pane appears, un-tick all but the Sales order
field
Figure 14 Sales order is the basis of this ranked result-set
14. Expand the Available fields node and navigate the list it shows until you find The sales
subtotal in the accounting currency. Tick to select this field
15. Click OK
Figure 15 Report ranking with Sales order, Sales balance and invoice amount
16. Make The sales subtotal in the accounting currency the Top N basis by clicking to select
this field and then use the right-click Make Top N Basis
There can only be one Top N basis. The replaced field now needs to be removed from the result-set.
17. Click to select the Report Columns (Customer invoice journal) node
18. Click the Add/Remove fields button
19. When the Add or modify report columns task pane appears, un-tick the Invoice Amount field
20. Click OK

Free-format functions
32
Figure 16 Sales order and sales balance are the basis of the result-set
21. Open the drop-down list of Aggregate functions and select Sum
22. Click to select The sales subtotal in the accounting currency field
23. Click to select the Descending order button
24. Click Insert
Report now appears as follows:
3.3.3.3 Use a Column function to get the Sales order number from the ranking function
The Column function can be used to consume the contents of a Report ranking function. Typically
use this function to get the non-numeric fields from the result-set:
1. Select cell E9
2. From the Ribbon bar, on the Atlas tab, in the Reporting group click the Free-format drop
down menu beneath the Balance button
3. Select Column from the list shown
4. Expand the Customer invoice journal node to reveal the available cached result-sets
5. Tick to select the CacheRankedSummary_1 (the number at the end varies according to the
number of times the function is refreshed)
6. Select Filters and click to select the Rank row of the grid
7. Use right-click and from the menu choose Pick
8. When the Sales order range selection box appears, navigate to cell D9 and click OK to select it
9. Change the reference from $D$9 to $D9
10. Select Output and use the erase button to remove the Rank as the output field
Free-format functions
33
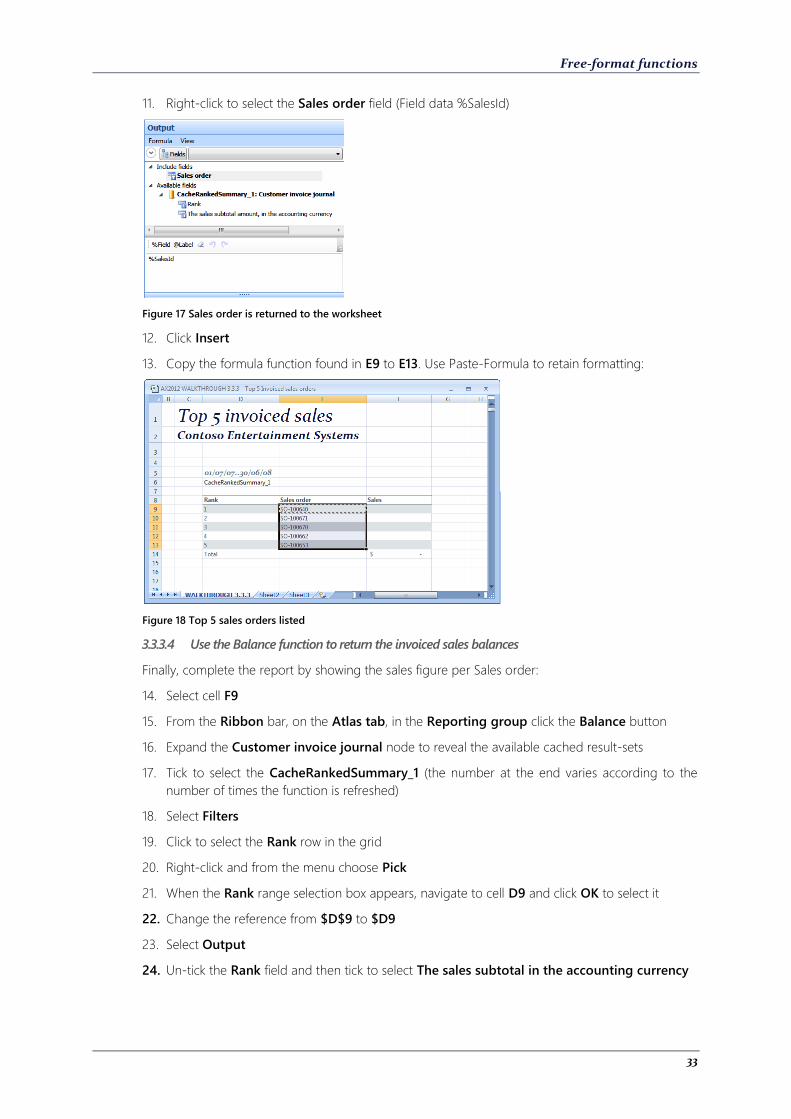
11. Right-click to select the Sales order field (Field data %SalesId)
Figure 17 Sales order is returned to the worksheet
12. Click Insert
13. Copy the formula function found in E9 to E13. Use Paste-Formula to retain formatting:
Figure 18 Top 5 sales orders listed
3.3.3.4 Use the Balance function to return the invoiced sales balances
Finally, complete the report by showing the sales figure per Sales order:
14. Select cell F9
15. From the Ribbon bar, on the Atlas tab, in the Reporting group click the Balance button
16. Expand the Customer invoice journal node to reveal the available cached result-sets
17. Tick to select the CacheRankedSummary_1 (the number at the end varies according to the
number of times the function is refreshed)
18. Select Filters
19. Click to select the Rank row in the grid
20. Right-click and from the menu choose Pick
21. When the Rank range selection box appears, navigate to cell D9 and click OK to select it
22. Change the reference from $D$9 to $D9
23. Select Output
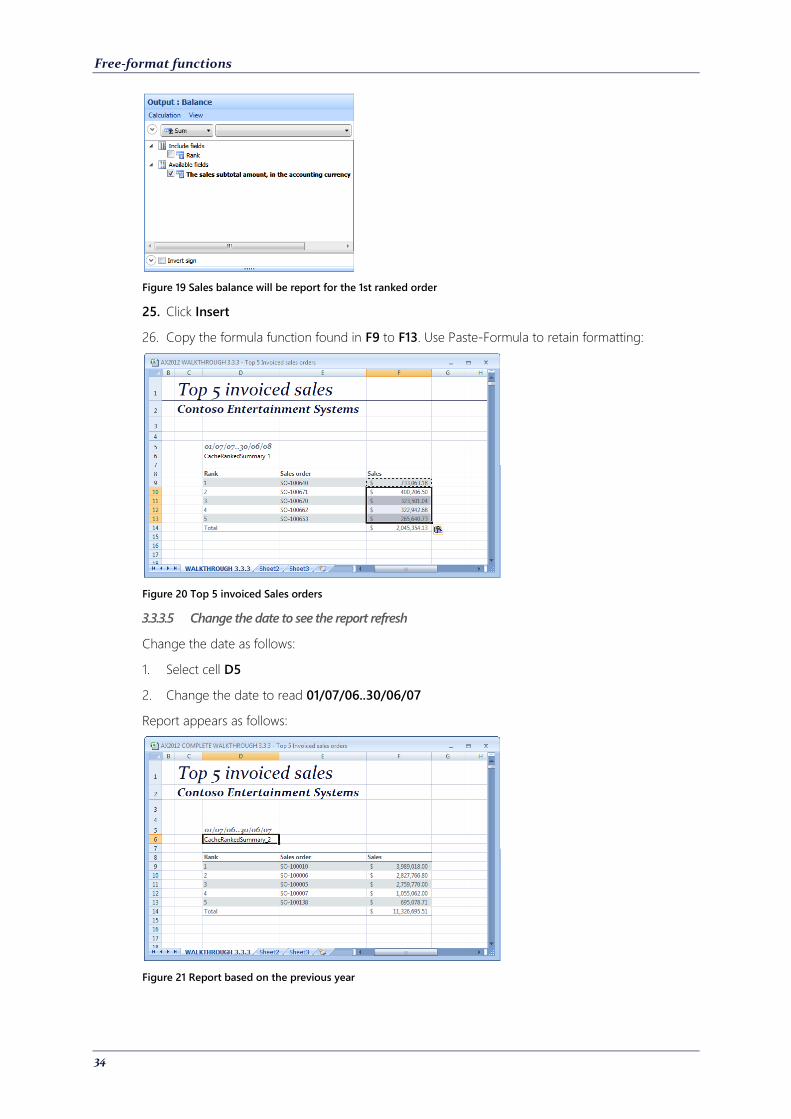
24. Un-tick the Rank field and then tick to select The sales subtotal in the accounting currency
Free-format functions
34
Figure 19 Sales balance will be report for the 1st ranked order
25. Click Insert
26. Copy the formula function found in F9 to F13. Use Paste-Formula to retain formatting:
Figure 20 Top 5 invoiced Sales orders
3.3.3.5 Change the date to see the report refresh
Change the date as follows:
1. Select cell D5
2. Change the date to read 01/07/06..30/06/07
Report appears as follows:
Figure 21 Report based on the previous year
Free-format functions
35
3.3.4 Lab. Exercises
1. You have been asked by your manager to provide a list of the top 5 customers for a given time
period. The basis of the ranking will be invoiced sales, expressed in the local currency. You
decide to use a combination of Atlas functions to do this, primarily, Report ranking, Column
and Balance. (Use AX2012 LAB 3.3.4.1 – Ranking Top 5 Customer contribution.xlsx)
Challenge yourself!
1. Select cell D6
2. Open the Report ranking task pane
3. Choose Customer invoice journal
4. Set the date filter
5. Choose customer account and The sales subtotal in the accounting currency as the ranking basis
6. Make The sales subtotal in the accounting currency the Top N basis and change its direction to
descending
7. Select cell E9
8. Open the Column task pane
9. Consume the ranking function and return the customer code
10. Copy the Column formula function down to E13
11. Select cell F9
12. Open the Balance task pane
13. Consume the ranking function and return the Sales subtotal amount in the accounting currency
14. Copy the Balance formula function down to F13
Need a little help?
1. Select cell D6
2. From the Ribbon bar, on the Atlas tab, in the Reporting group click the Extended reporting button
3. Select Report ranking from the menu shown
4. Tick to select the Customer invoice journal in the data source list
5. Select Filters and click to select the Date row in the grid
6. Use right-click and from the menu choose Pick
7. When the Date range selection box appears, navigate to cell D5 and click OK to select it
8. Select Style : Report ranking
9. Click to select the Report Columns (Customer invoice journal) node
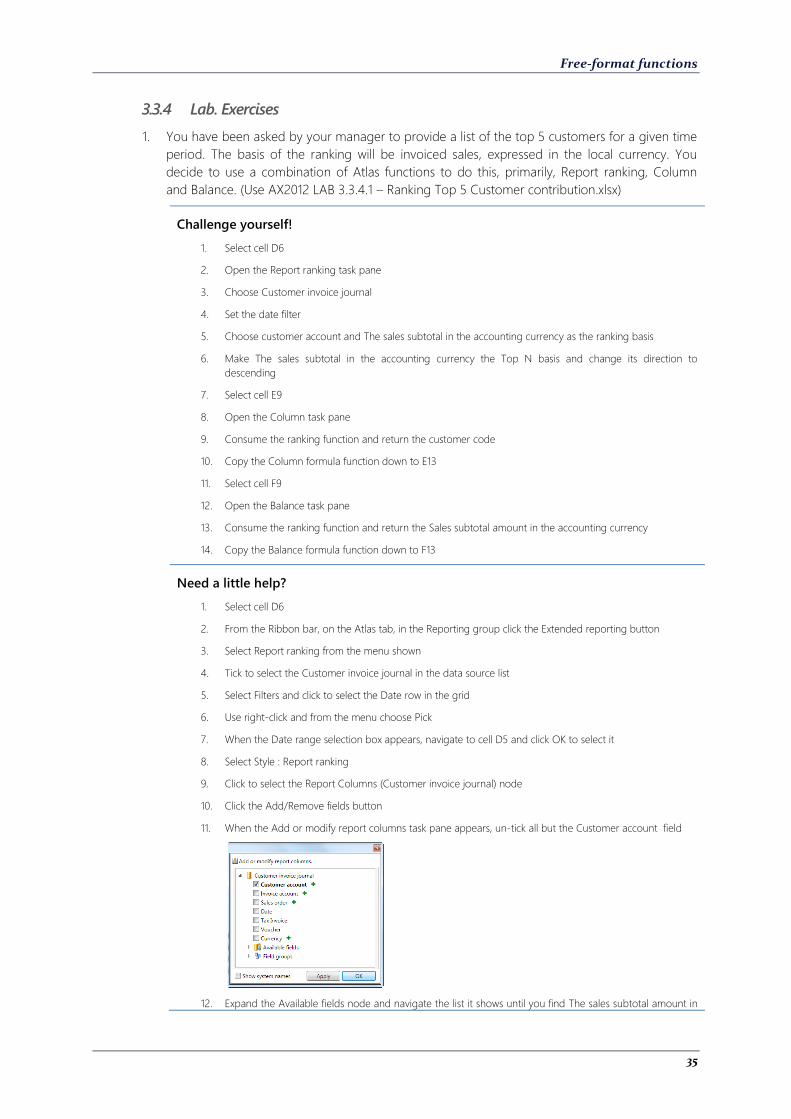
10. Click the Add/Remove fields button
11. When the Add or modify report columns task pane appears, un-tick all but the Customer account field
12. Expand the Available fields node and navigate the list it shows until you find The sales subtotal amount in
Free-format functions
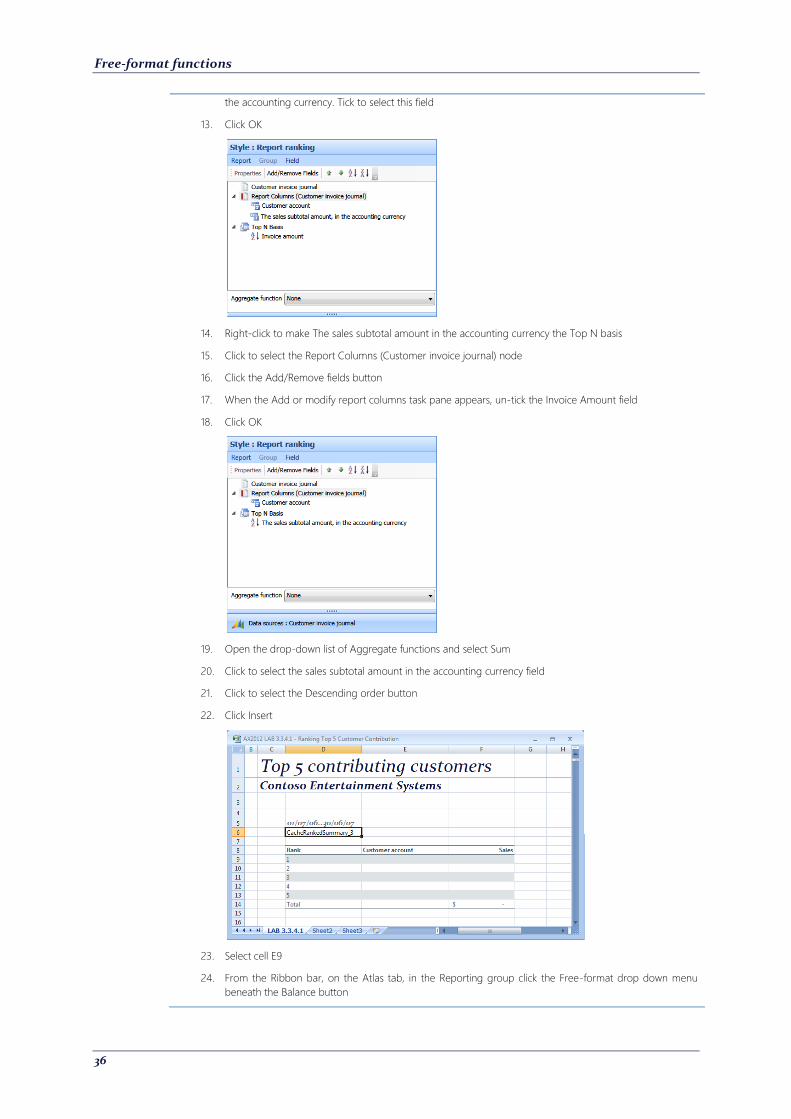
36
the accounting currency. Tick to select this field
13. Click OK
14. Right-click to make The sales subtotal amount in the accounting currency the Top N basis
15. Click to select the Report Columns (Customer invoice journal) node
16. Click the Add/Remove fields button
17. When the Add or modify report columns task pane appears, un-tick the Invoice Amount field
18. Click OK
19. Open the drop-down list of Aggregate functions and select Sum
20. Click to select the sales subtotal amount in the accounting currency field
21. Click to select the Descending order button
22. Click Insert
23. Select cell E9
24. From the Ribbon bar, on the Atlas tab, in the Reporting group click the Free-format drop down menu
beneath the Balance button
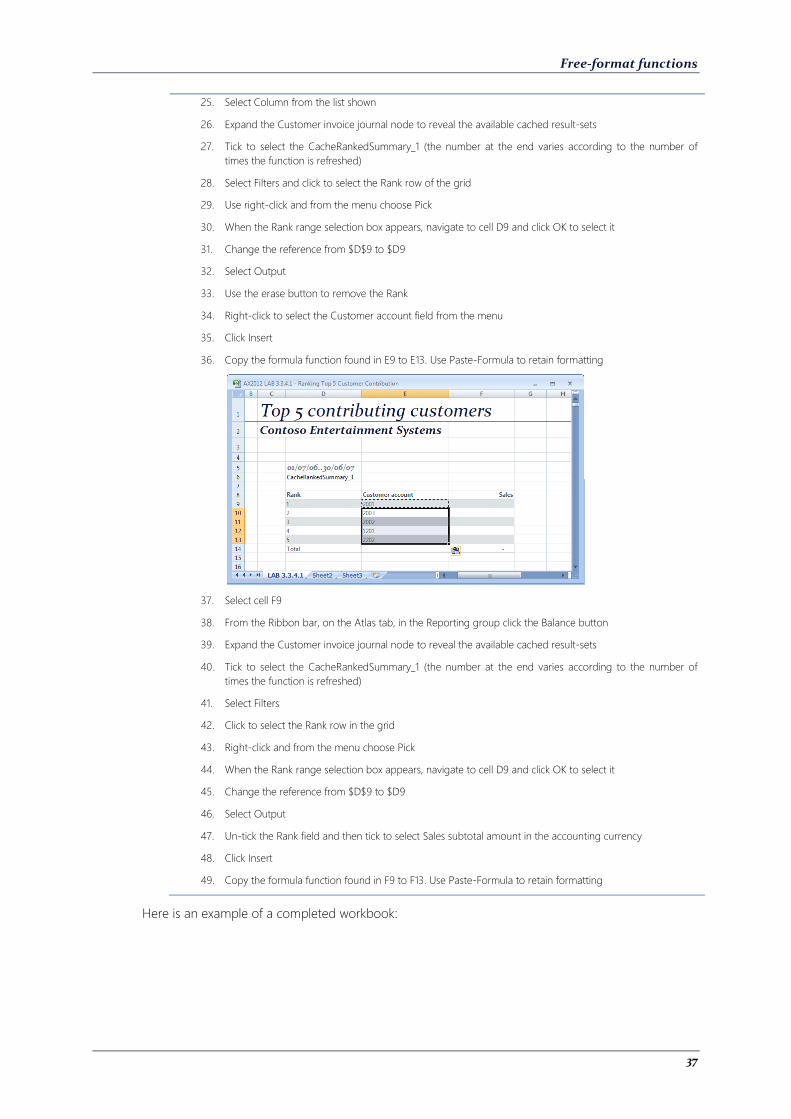
Free-format functions
37
25. Select Column from the list shown
26. Expand the Customer invoice journal node to reveal the available cached result-sets
27. Tick to select the CacheRankedSummary_1 (the number at the end varies according to the number of
times the function is refreshed)
28. Select Filters and click to select the Rank row of the grid
29. Use right-click and from the menu choose Pick
30. When the Rank range selection box appears, navigate to cell D9 and click OK to select it
31. Change the reference from $D$9 to $D9
32. Select Output
33. Use the erase button to remove the Rank
34. Right-click to select the Customer account field from the menu
35. Click Insert
36. Copy the formula function found in E9 to E13. Use Paste-Formula to retain formatting
37. Select cell F9
38. From the Ribbon bar, on the Atlas tab, in the Reporting group click the Balance button
39. Expand the Customer invoice journal node to reveal the available cached result-sets
40. Tick to select the CacheRankedSummary_1 (the number at the end varies according to the number of
times the function is refreshed)
41. Select Filters
42. Click to select the Rank row in the grid
43. Right-click and from the menu choose Pick
44. When the Rank range selection box appears, navigate to cell D9 and click OK to select it
45. Change the reference from $D$9 to $D9
46. Select Output
47. Un-tick the Rank field and then tick to select Sales subtotal amount in the accounting currency
48. Click Insert
49. Copy the formula function found in F9 to F13. Use Paste-Formula to retain formatting
Here is an example of a completed workbook:
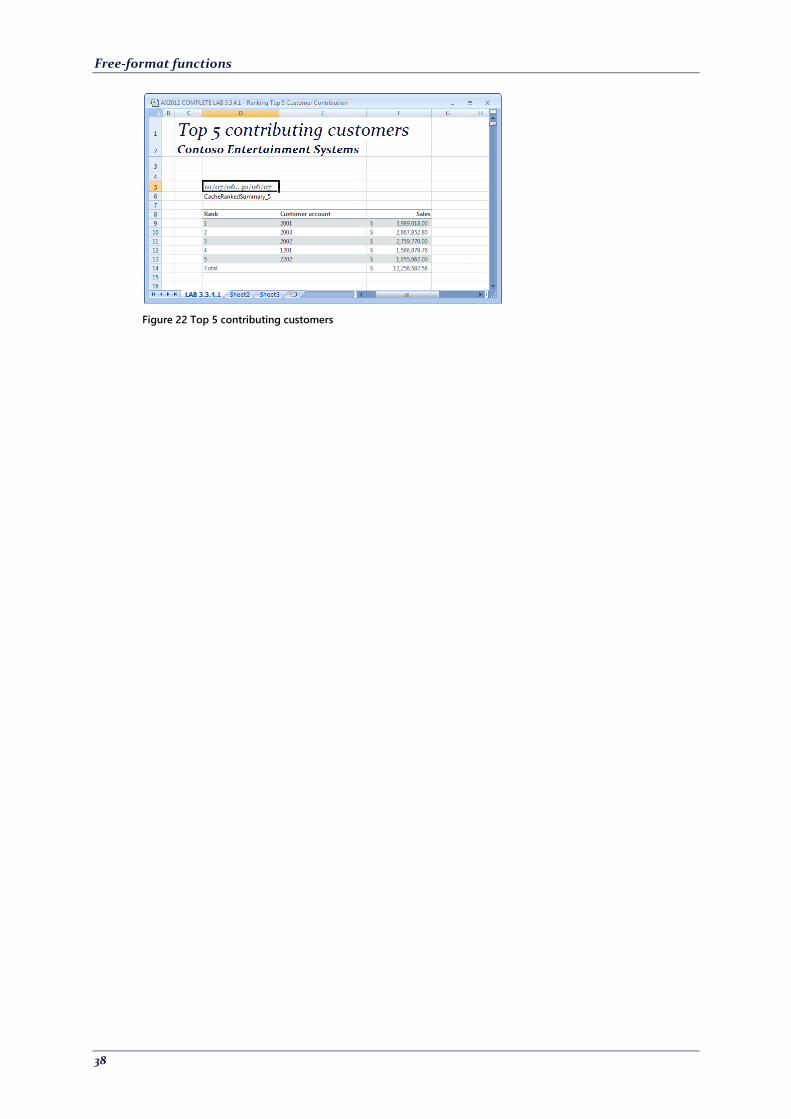
Free-format functions
38
Figure 22 Top 5 contributing customers
Free-format functions
39
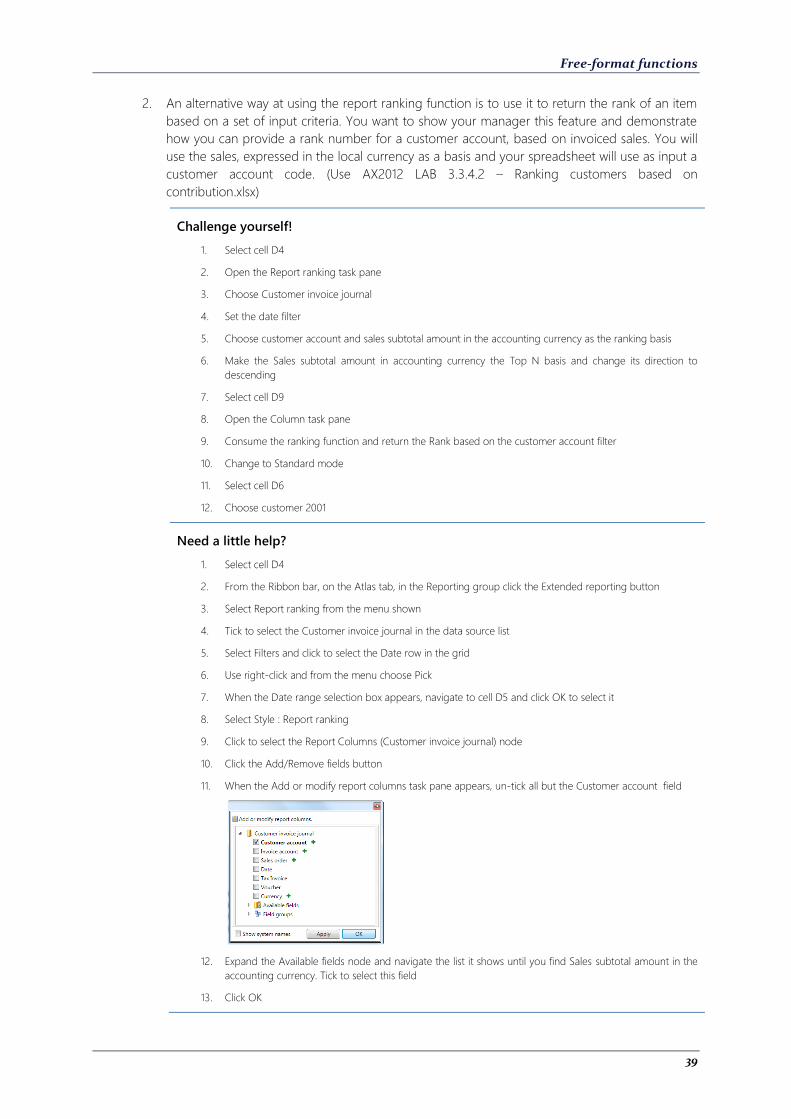
2. An alternative way at using the report ranking function is to use it to return the rank of an item
based on a set of input criteria. You want to show your manager this feature and demonstrate
how you can provide a rank number for a customer account, based on invoiced sales. You will
use the sales, expressed in the local currency as a basis and your spreadsheet will use as input a
customer account code. (Use AX2012 LAB 3.3.4.2 – Ranking customers based on
contribution.xlsx)
Challenge yourself!
1. Select cell D4
2. Open the Report ranking task pane
3. Choose Customer invoice journal
4. Set the date filter
5. Choose customer account and sales subtotal amount in the accounting currency as the ranking basis
6. Make the Sales subtotal amount in accounting currency the Top N basis and change its direction to
descending
7. Select cell D9
8. Open the Column task pane
9. Consume the ranking function and return the Rank based on the customer account filter
10. Change to Standard mode
11. Select cell D6
12. Choose customer 2001
Need a little help?
1. Select cell D4
2. From the Ribbon bar, on the Atlas tab, in the Reporting group click the Extended reporting button
3. Select Report ranking from the menu shown
4. Tick to select the Customer invoice journal in the data source list
5. Select Filters and click to select the Date row in the grid
6. Use right-click and from the menu choose Pick
7. When the Date range selection box appears, navigate to cell D5 and click OK to select it
8. Select Style : Report ranking
9. Click to select the Report Columns (Customer invoice journal) node
10. Click the Add/Remove fields button
11. When the Add or modify report columns task pane appears, un-tick all but the Customer account field
12. Expand the Available fields node and navigate the list it shows until you find Sales subtotal amount in the
accounting currency. Tick to select this field
13. Click OK
Free-format functions
40
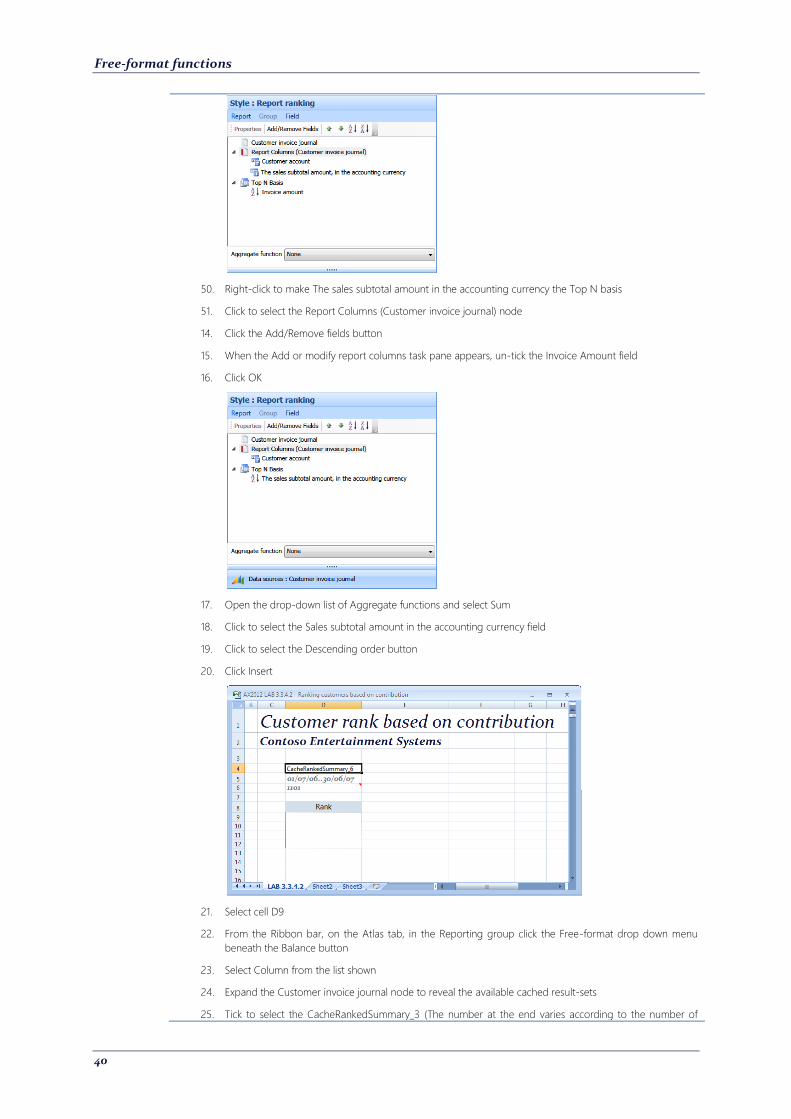
50. Right-click to make The sales subtotal amount in the accounting currency the Top N basis
51. Click to select the Report Columns (Customer invoice journal) node
14. Click the Add/Remove fields button
15. When the Add or modify report columns task pane appears, un-tick the Invoice Amount field
16. Click OK
17. Open the drop-down list of Aggregate functions and select Sum
18. Click to select the Sales subtotal amount in the accounting currency field
19. Click to select the Descending order button
20. Click Insert
21. Select cell D9
22. From the Ribbon bar, on the Atlas tab, in the Reporting group click the Free-format drop down menu
beneath the Balance button
23. Select Column from the list shown
24. Expand the Customer invoice journal node to reveal the available cached result-sets
25. Tick to select the CacheRankedSummary_3 (The number at the end varies according to the number of
Free-format functions
41
times the function is refreshed)
26. Select Filters and click to select the Customer account row of the grid
27. Use right-click and from the menu choose Pick
28. When the Customer account range selection box appears, navigate to cell D6 and click OK to select it
29. Select Output and tick to select the Rank field
30. Click Insert
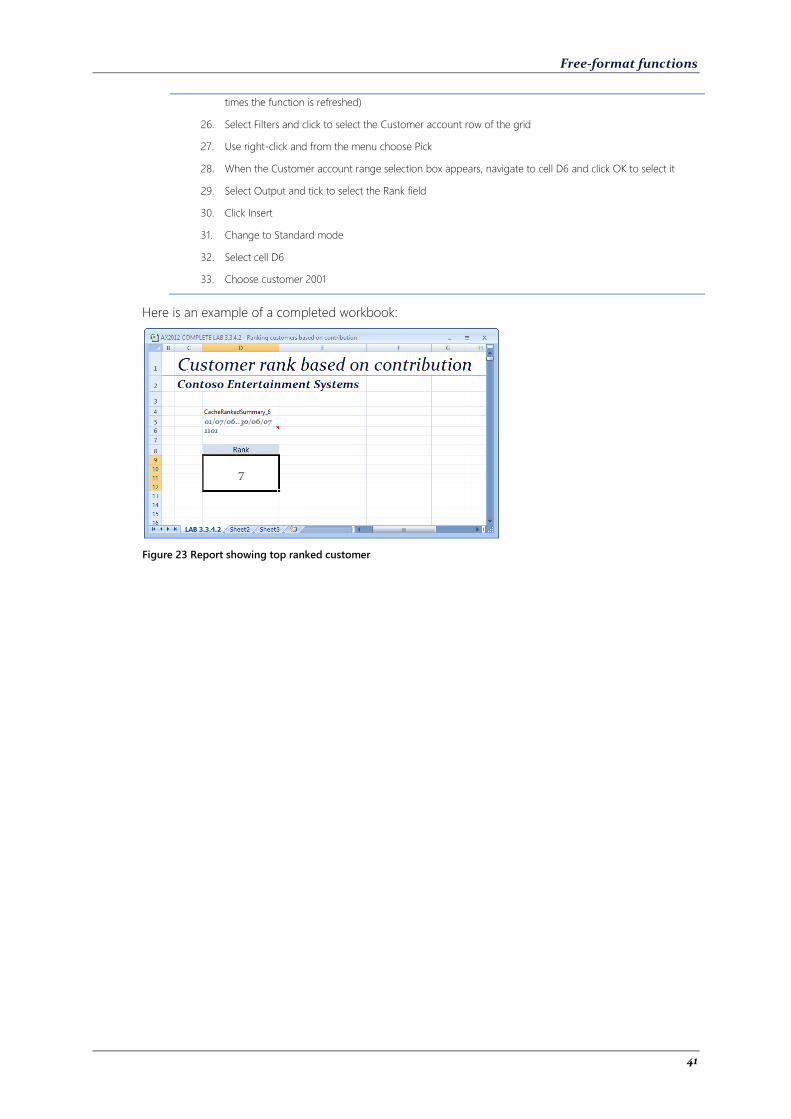
31. Change to Standard mode
32. Select cell D6
33. Choose customer 2001
Here is an example of a completed workbook:
Figure 23 Report showing top ranked customer
Free-format functions
42
3.4 Cache function
3.4.1 Outline
The Cache function is designed to reduce the number of times Atlas requests information from your
Microsoft Dynamics AX installation. In so doing, this reduces both the request stress on both
Microsoft SQL server and on your network traffic. The Cache function requests the data from your
Microsoft Dynamics AX installation each time the formula is refreshed. The data is returned from the
request back to your workstation, from where it is consumed by other Atlas functions like; Balance
and Column.
The Cache function can be used whenever you have workbooks with large volumes of balance
formula functions and you want to reduce the number of requests on your Microsoft Dynamics AX
system and where you want to reduce network traffic accordingly.
3.4.2 Uses
The Report ranking function is not often used in isolation. It is always used in conjunction with other
Atlas functions; Balance, Column, List or Summary to form a report. The Cache function generates a
result-set and the other functions consume its output as part of the report. Typically you will use the
Cache function in the following instances:
Where you want to reduce network and database traffic when your report has many Balance
formula functions
Where you want to make use of the multi-threaded Balance function
Where you want to summarize data from multiple Microsoft Dynamics AX tables into a virtual,
reporting table held on your workstation
Free-format functions
43
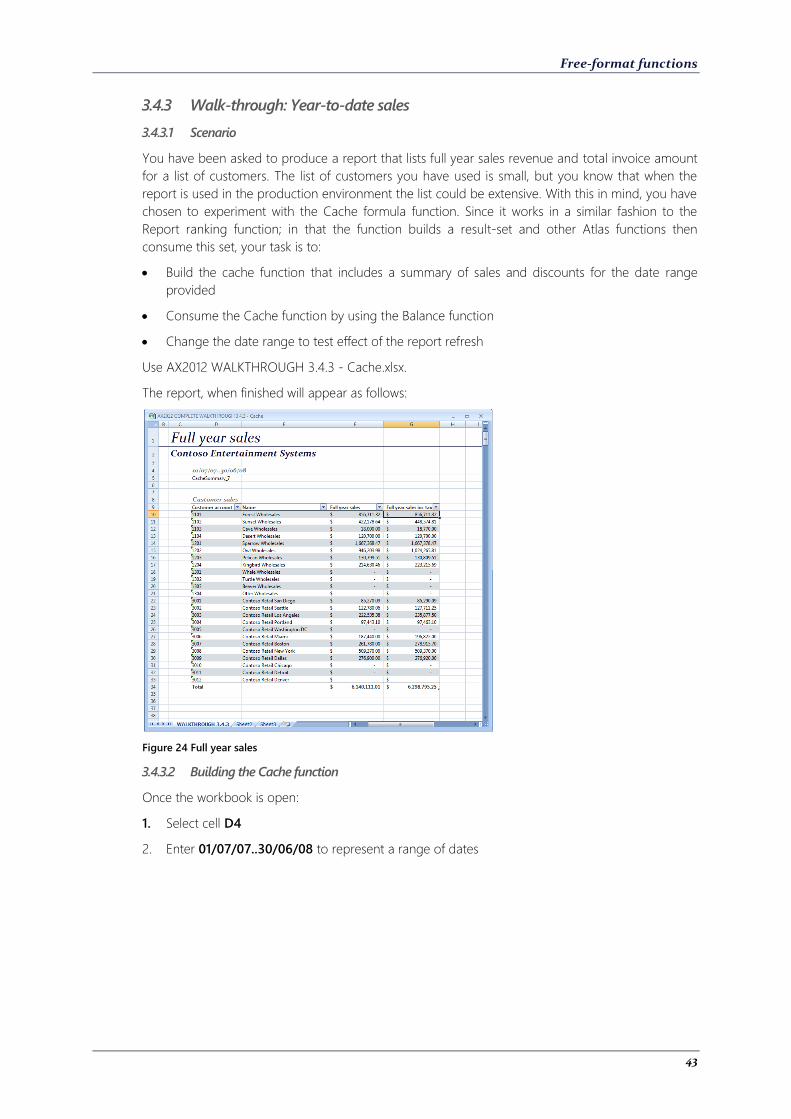
3.4.3 Walk-through: Year-to-date sales
3.4.3.1 Scenario
You have been asked to produce a report that lists full year sales revenue and total invoice amount
for a list of customers. The list of customers you have used is small, but you know that when the
report is used in the production environment the list could be extensive. With this in mind, you have
chosen to experiment with the Cache formula function. Since it works in a similar fashion to the
Report ranking function; in that the function builds a result-set and other Atlas functions then
consume this set, your task is to:
Build the cache function that includes a summary of sales and discounts for the date range
provided
Consume the Cache function by using the Balance function
Change the date range to test effect of the report refresh
Use AX2012 WALKTHROUGH 3.4.3 - Cache.xlsx.
The report, when finished will appear as follows:
Figure 24 Full year sales
3.4.3.2 Building the Cache function
Once the workbook is open:
1. Select cell D4
2. Enter 01/07/07..30/06/08 to represent a range of dates
Free-format functions
44
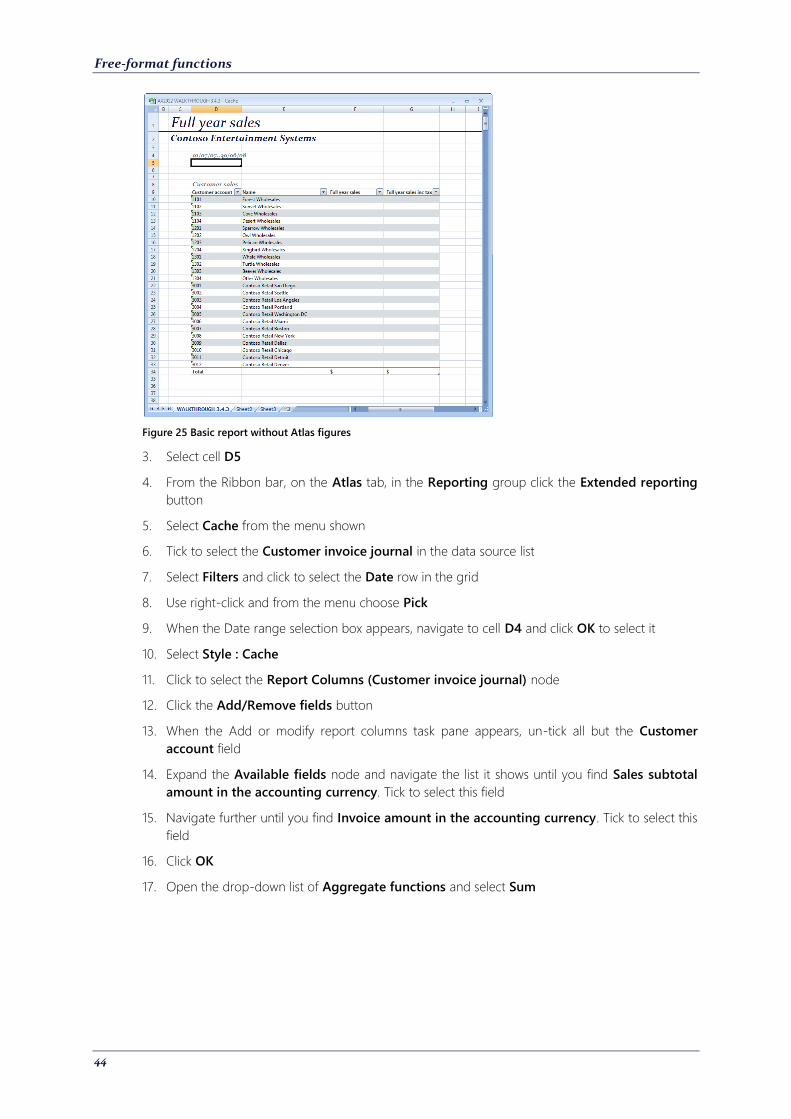
Figure 25 Basic report without Atlas figures
3. Select cell D5
4. From the Ribbon bar, on the Atlas tab, in the Reporting group click the Extended reporting
button
5. Select Cache from the menu shown
6. Tick to select the Customer invoice journal in the data source list
7. Select Filters and click to select the Date row in the grid
8. Use right-click and from the menu choose Pick
9. When the Date range selection box appears, navigate to cell D4 and click OK to select it
10. Select Style : Cache
11. Click to select the Report Columns (Customer invoice journal) node
12. Click the Add/Remove fields button
13. When the Add or modify report columns task pane appears, un-tick all but the Customer
account field
14. Expand the Available fields node and navigate the list it shows until you find Sales subtotal
amount in the accounting currency. Tick to select this field
15. Navigate further until you find Invoice amount in the accounting currency. Tick to select this
field
16. Click OK
17. Open the drop-down list of Aggregate functions and select Sum

Free-format functions
45
Figure 26 Cache output showing consolidation of amounts
18. Click Insert
Report now appears as follows:
Figure 27 CacheSummary_8 is the formula function that holds the result-set from Microsoft Dynamics AX
3.4.3.3 Consuming the Cache function using an Atlas balance function
Complete the report by showing the sales and invoiced figures for each customer:
1. Select cell F10
2. From the Ribbon bar, on the Atlas tab, in the Reporting group click the Balance button
3. Expand the Customer invoice journal node to reveal the available cached result-sets
4. Tick to select the CacheSummary_8 (The number at the end varies according to the number of
times the function is refreshed
5. Select Filters
6. Click to select the Customer account row in the grid
7. Right-click and from the menu choose Pick
8. When the Customer account range selection box appears, navigate to cell D10 and click OK
to select it
9. Change the reference from $D$10 to $D10
Free-format functions
46
10. Select Output
11. Tick to select Sales subtotal amount in the accounting currency
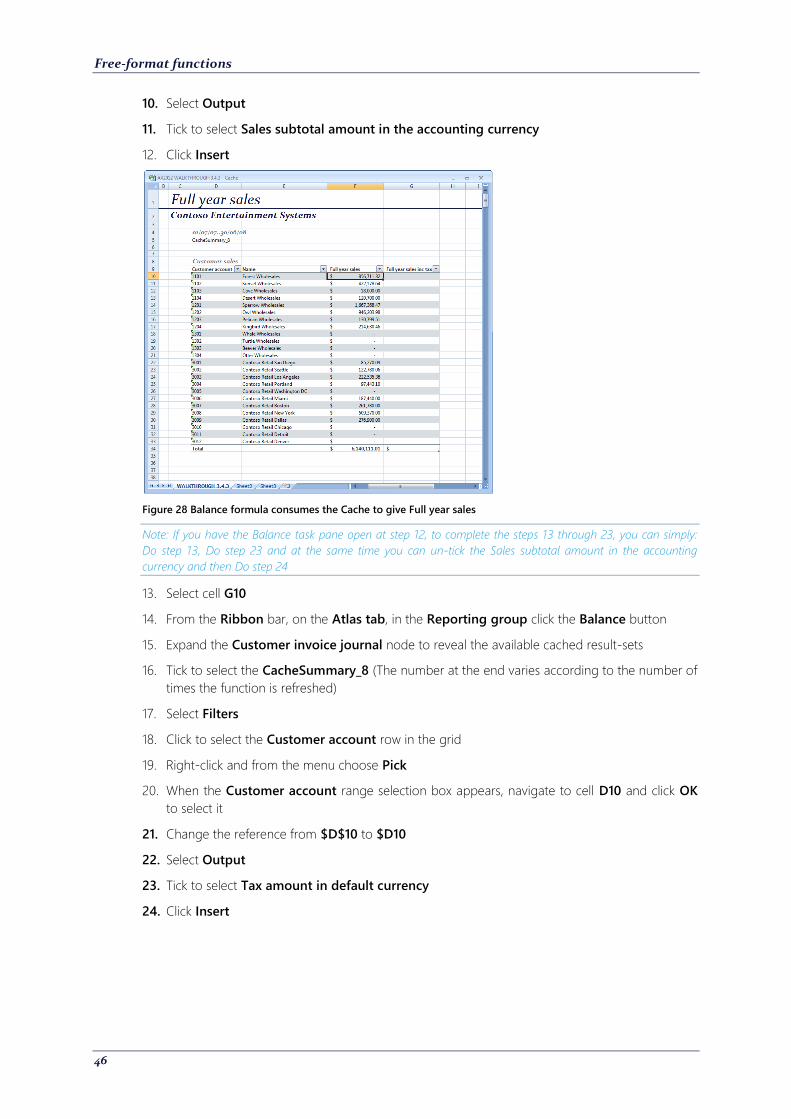
12. Click Insert
Figure 28 Balance formula consumes the Cache to give Full year sales
Note: If you have the Balance task pane open at step 12, to complete the steps 13 through 23, you can simply:
Do step 13, Do step 23 and at the same time you can un-tick the Sales subtotal amount in the accounting
currency and then Do step 24
13. Select cell G10
14. From the Ribbon bar, on the Atlas tab, in the Reporting group click the Balance button
15. Expand the Customer invoice journal node to reveal the available cached result-sets
16. Tick to select the CacheSummary_8 (The number at the end varies according to the number of
times the function is refreshed)
17. Select Filters
18. Click to select the Customer account row in the grid
19. Right-click and from the menu choose Pick
20. When the Customer account range selection box appears, navigate to cell D10 and click OK
to select it
21. Change the reference from $D$10 to $D10
22. Select Output
23. Tick to select Tax amount in default currency
24. Click Insert
Free-format functions
47
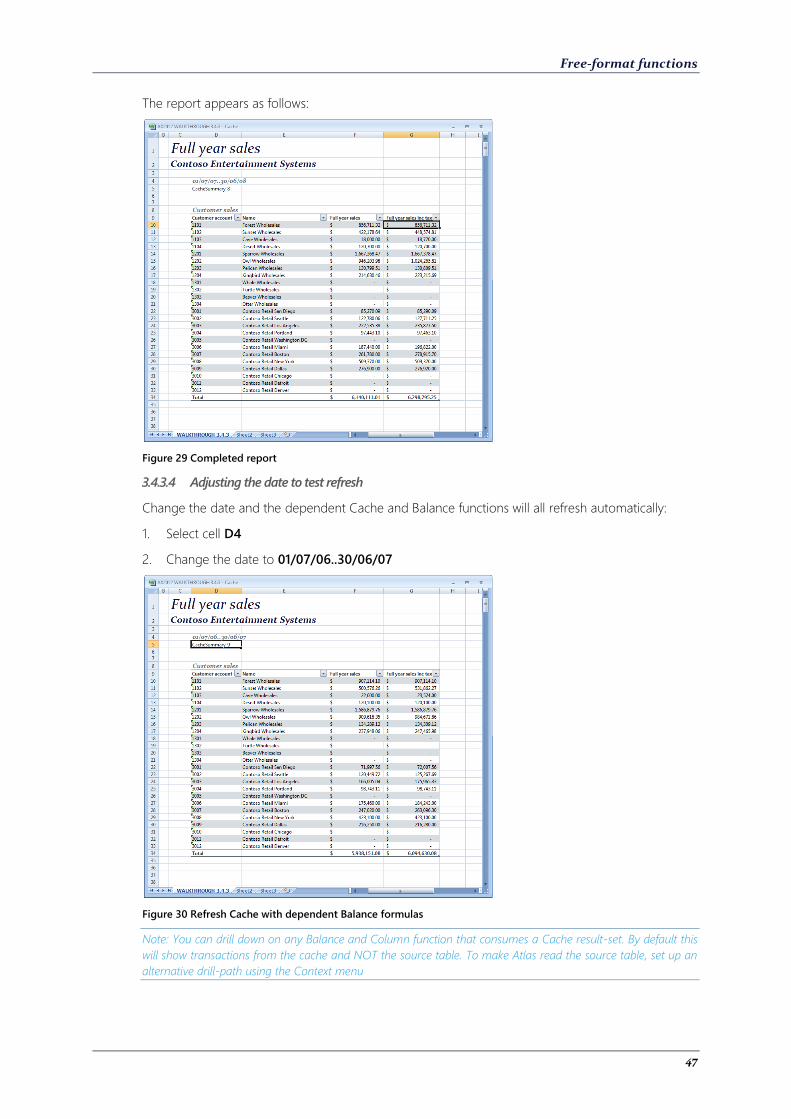
The report appears as follows:
Figure 29 Completed report
3.4.3.4 Adjusting the date to test refresh
Change the date and the dependent Cache and Balance functions will all refresh automatically:
1. Select cell D4
2. Change the date to 01/07/06..30/06/07
Figure 30 Refresh Cache with dependent Balance formulas
Note: You can drill down on any Balance and Column function that consumes a Cache result-set. By default this
will show transactions from the cache and NOT the source table. To make Atlas read the source table, set up an
alternative drill-path using the Context menu
Free-format functions
48
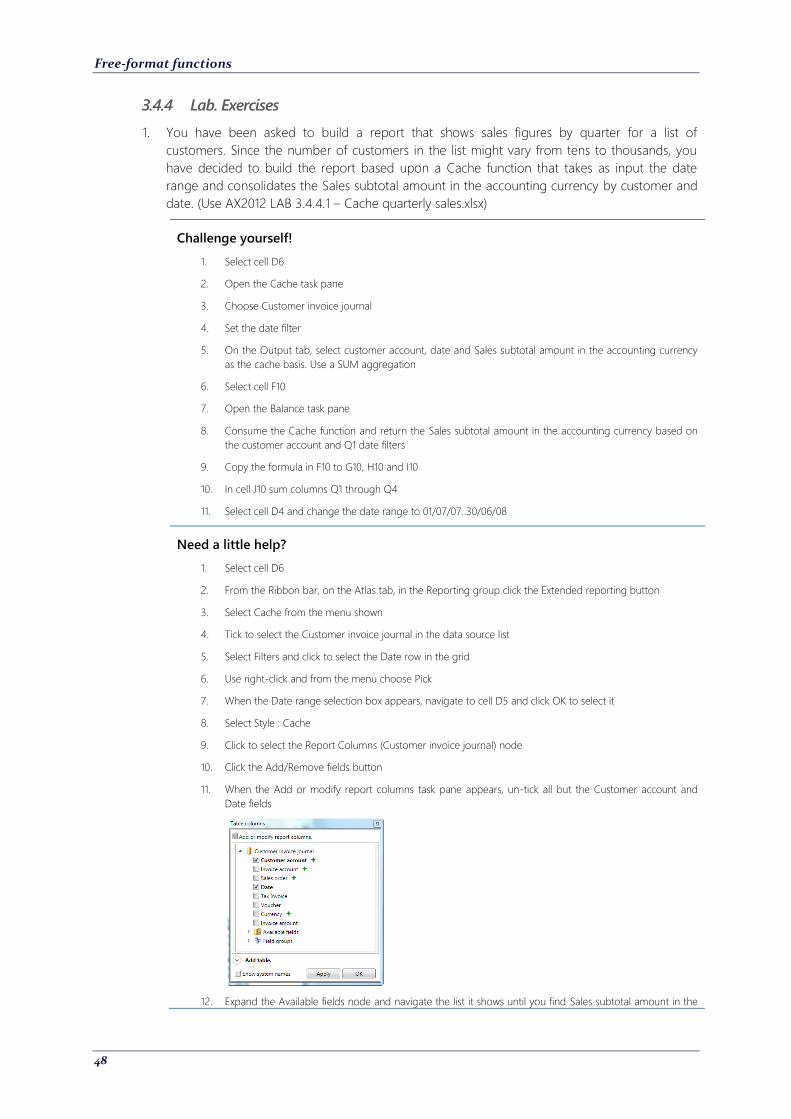
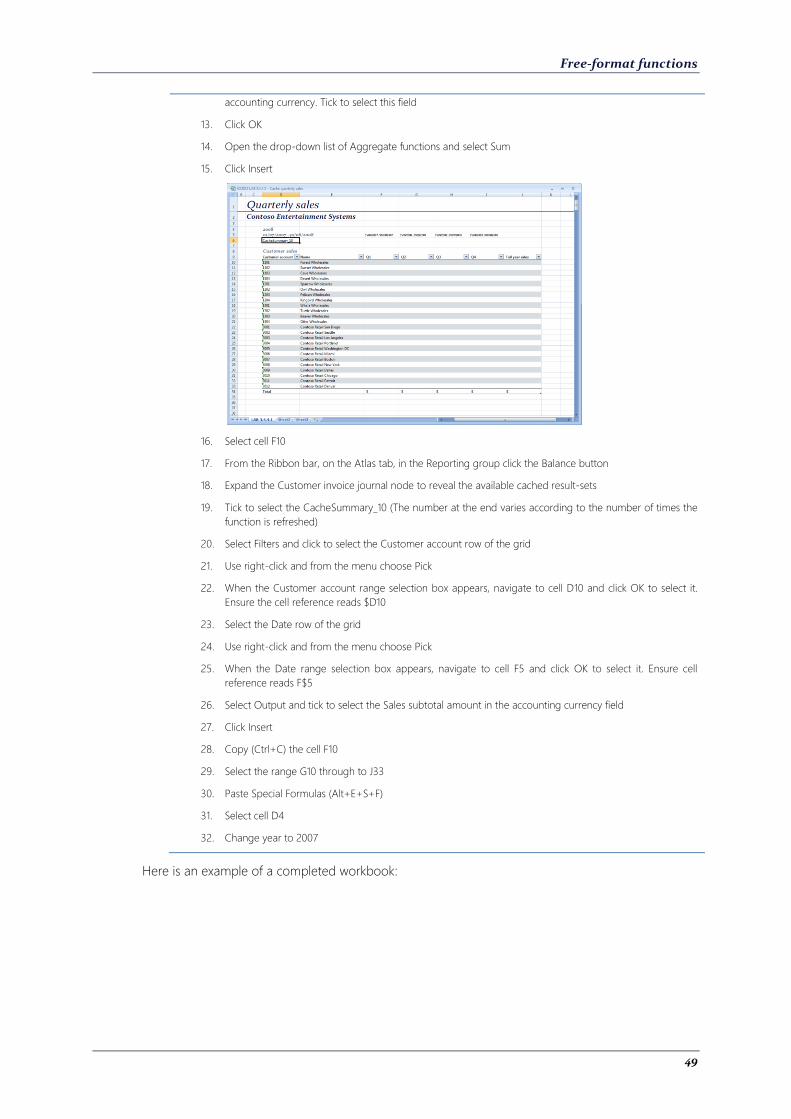
3.4.4 Lab. Exercises
1. You have been asked to build a report that shows sales figures by quarter for a list of
customers. Since the number of customers in the list might vary from tens to thousands, you
have decided to build the report based upon a Cache function that takes as input the date
range and consolidates the Sales subtotal amount in the accounting currency by customer and
date. (Use AX2012 LAB 3.4.4.1 – Cache quarterly sales.xlsx)
Challenge yourself!
1. Select cell D6
2. Open the Cache task pane
3. Choose Customer invoice journal
4. Set the date filter
5. On the Output tab, select customer account, date and Sales subtotal amount in the accounting currency
as the cache basis. Use a SUM aggregation
6. Select cell F10
7. Open the Balance task pane
8. Consume the Cache function and return the Sales subtotal amount in the accounting currency based on
the customer account and Q1 date filters
9. Copy the formula in F10 to G10, H10 and I10
10. In cell J10 sum columns Q1 through Q4
11. Select cell D4 and change the date range to 01/07/07..30/06/08
Need a little help?
1. Select cell D6
2. From the Ribbon bar, on the Atlas tab, in the Reporting group click the Extended reporting button
3. Select Cache from the menu shown
4. Tick to select the Customer invoice journal in the data source list
5. Select Filters and click to select the Date row in the grid
6. Use right-click and from the menu choose Pick
7. When the Date range selection box appears, navigate to cell D5 and click OK to select it
8. Select Style : Cache
9. Click to select the Report Columns (Customer invoice journal) node
10. Click the Add/Remove fields button
11. When the Add or modify report columns task pane appears, un-tick all but the Customer account and
Date fields
12. Expand the Available fields node and navigate the list it shows until you find Sales subtotal amount in the
Free-format functions
49
accounting currency. Tick to select this field
13. Click OK
14. Open the drop-down list of Aggregate functions and select Sum
15. Click Insert
16. Select cell F10
17. From the Ribbon bar, on the Atlas tab, in the Reporting group click the Balance button
18. Expand the Customer invoice journal node to reveal the available cached result-sets
19. Tick to select the CacheSummary_10 (The number at the end varies according to the number of times the
function is refreshed)
20. Select Filters and click to select the Customer account row of the grid
21. Use right-click and from the menu choose Pick
22. When the Customer account range selection box appears, navigate to cell D10 and click OK to select it.
Ensure the cell reference reads $D10
23. Select the Date row of the grid
24. Use right-click and from the menu choose Pick
25. When the Date range selection box appears, navigate to cell F5 and click OK to select it. Ensure cell
reference reads F$5
26. Select Output and tick to select the Sales subtotal amount in the accounting currency field
27. Click Insert
28. Copy (Ctrl+C) the cell F10
29. Select the range G10 through to J33
30. Paste Special Formulas (Alt+E+S+F)
31. Select cell D4
32. Change year to 2007
Here is an example of a completed workbook:
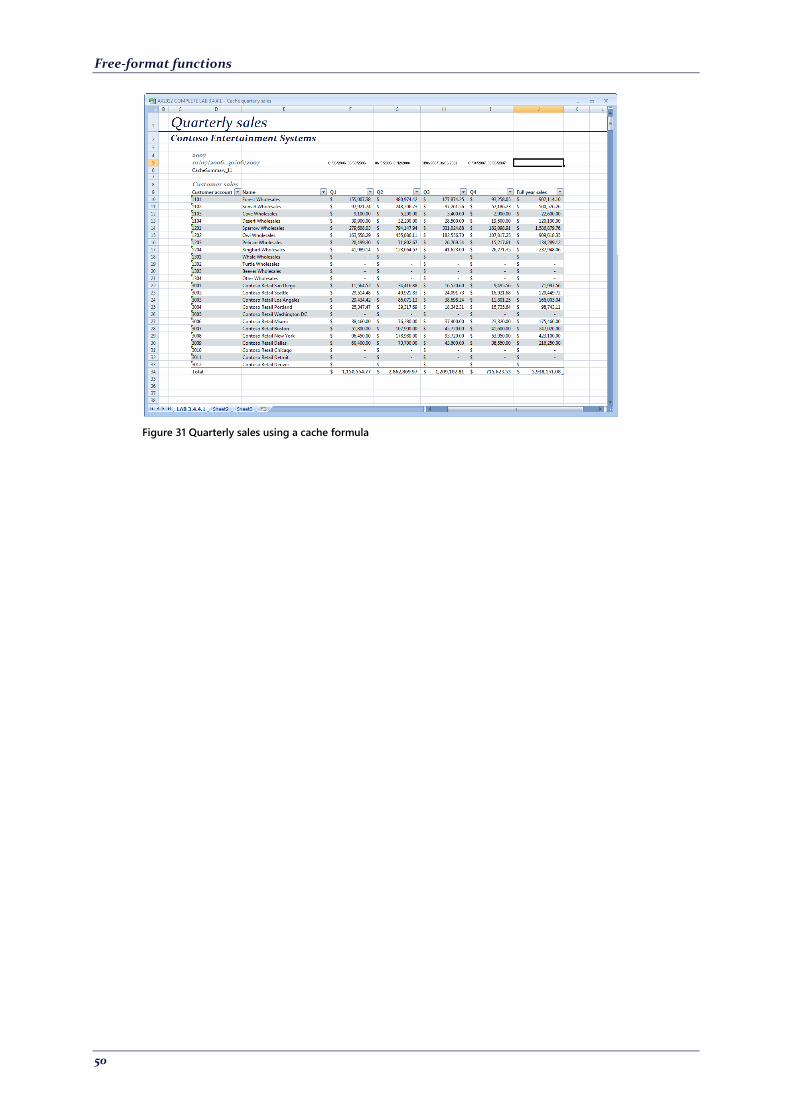
Free-format functions
50
Figure 31 Quarterly sales using a cache formula
Free-format functions
51
3.5 Label function
3.5.1 Outline
This function returns the label text into a cell of your workbook or other Office document. The label
is returned from the Microsoft Dynamics AX label system and is in either the language of you (the
logged in user) or in the language selected from a the document or hard coded in the report. This
function is particularly useful in installations that span countries or when where there is a need to
use the precise Microsoft Dynamics AX label text in a document.
The function allows for a text search of the label system so you can choose the label you need or
you can nominate the @ label id yourself.
3.5.2 Uses
Use this function to:
Make a report configurable by language
Make a report use the same labels as those used in Microsoft Dynamics AX.
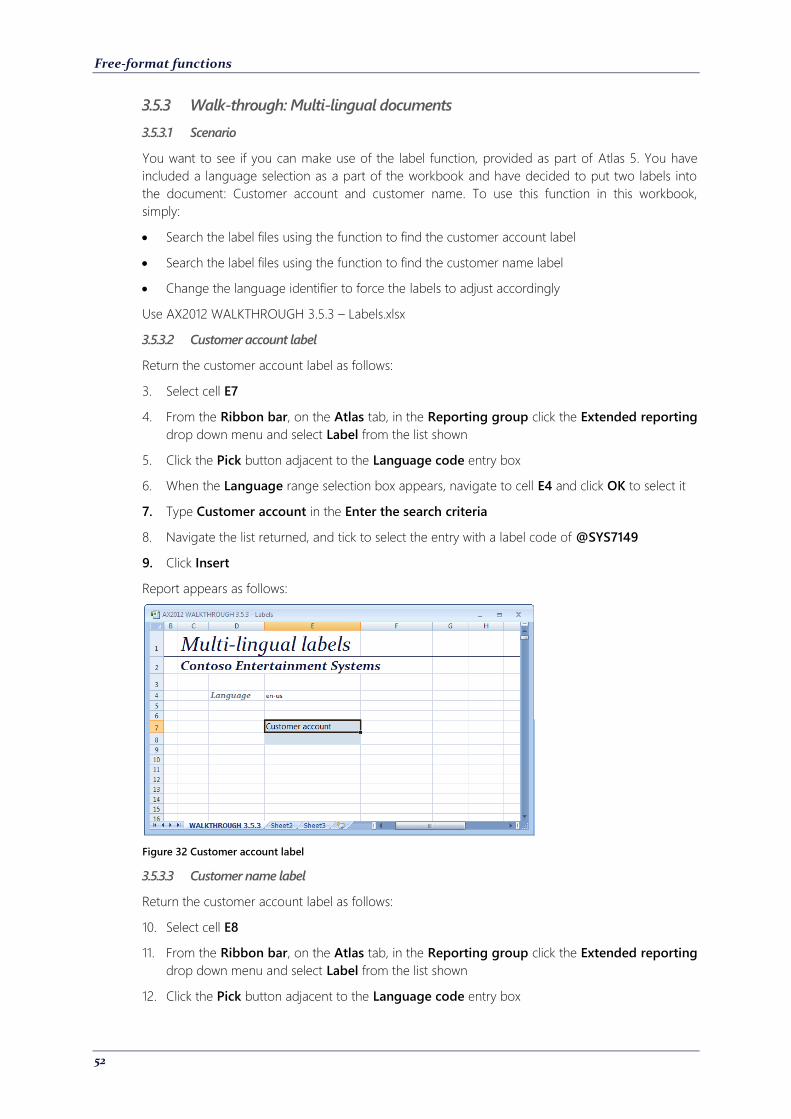
Free-format functions
52
3.5.3 Walk-through: Multi-lingual documents
3.5.3.1 Scenario
You want to see if you can make use of the label function, provided as part of Atlas 5. You have
included a language selection as a part of the workbook and have decided to put two labels into
the document: Customer account and customer name. To use this function in this workbook,
simply:
Search the label files using the function to find the customer account label
Search the label files using the function to find the customer name label
Change the language identifier to force the labels to adjust accordingly
Use AX2012 WALKTHROUGH 3.5.3 – Labels.xlsx
3.5.3.2 Customer account label
Return the customer account label as follows:
3. Select cell E7
4. From the Ribbon bar, on the Atlas tab, in the Reporting group click the Extended reporting
drop down menu and select Label from the list shown
5. Click the Pick button adjacent to the Language code entry box
6. When the Language range selection box appears, navigate to cell E4 and click OK to select it
7. Type Customer account in the Enter the search criteria
8. Navigate the list returned, and tick to select the entry with a label code of @SYS7149
9. Click Insert
Report appears as follows:
Figure 32 Customer account label
3.5.3.3 Customer name label
Return the customer account label as follows:
10. Select cell E8
11. From the Ribbon bar, on the Atlas tab, in the Reporting group click the Extended reporting
drop down menu and select Label from the list shown
12. Click the Pick button adjacent to the Language code entry box
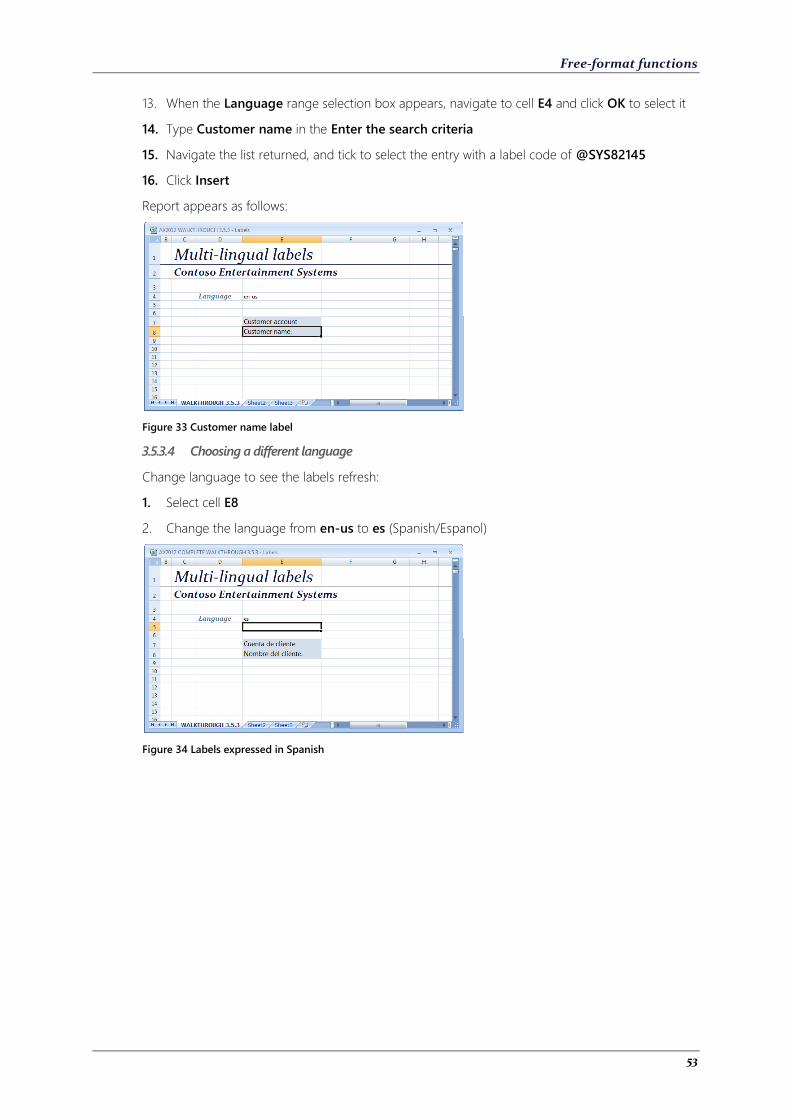
Free-format functions
53
13. When the Language range selection box appears, navigate to cell E4 and click OK to select it
14. Type Customer name in the Enter the search criteria
15. Navigate the list returned, and tick to select the entry with a label code of @SYS82145
16. Click Insert
Report appears as follows:
Figure 33 Customer name label
3.5.3.4 Choosing a different language
Change language to see the labels refresh:
1. Select cell E8
2. Change the language from en-us to es (Spanish/Espanol)
Figure 34 Labels expressed in Spanish
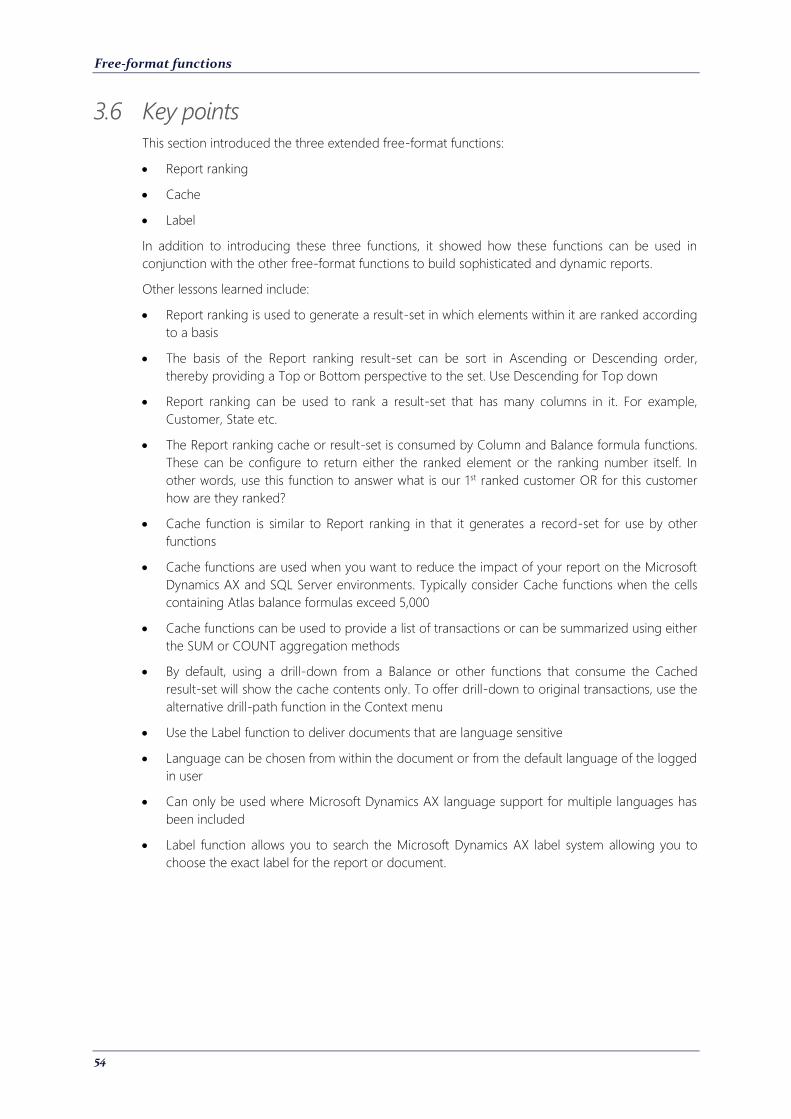
Free-format functions
54
3.6 Key points
This section introduced the three extended free-format functions:
Report ranking
Cache
Label
In addition to introducing these three functions, it showed how these functions can be used in
conjunction with the other free-format functions to build sophisticated and dynamic reports.
Other lessons learned include:
Report ranking is used to generate a result-set in which elements within it are ranked according
to a basis
The basis of the Report ranking result-set can be sort in Ascending or Descending order,
thereby providing a Top or Bottom perspective to the set. Use Descending for Top down
Report ranking can be used to rank a result-set that has many columns in it. For example,
Customer, State etc.
The Report ranking cache or result-set is consumed by Column and Balance formula functions.
These can be configure to return either the ranked element or the ranking number itself. In
other words, use this function to answer what is our 1st ranked customer OR for this customer
how are they ranked?
Cache function is similar to Report ranking in that it generates a record-set for use by other
functions
Cache functions are used when you want to reduce the impact of your report on the Microsoft
Dynamics AX and SQL Server environments. Typically consider Cache functions when the cells
containing Atlas balance formulas exceed 5,000
Cache functions can be used to provide a list of transactions or can be summarized using either
the SUM or COUNT aggregation methods
By default, using a drill-down from a Balance or other functions that consume the Cached
result-set will show the cache contents only. To offer drill-down to original transactions, use the
alternative drill-path function in the Context menu
Use the Label function to deliver documents that are language sensitive
Language can be chosen from within the document or from the default language of the logged
in user
Can only be used where Microsoft Dynamics AX language support for multiple languages has
been included
Label function allows you to search the Microsoft Dynamics AX label system allowing you to
choose the exact label for the report or document.
Free-format functions
55
3.7 Quick interaction
Take a moment to write down the three key points you have learned:
1.
2.
3.
Structured reporting functions
56
4 Structured reporting functions
4.1 Outline
Structured reporting functions are used when you want to present lists, summaries or cross
tabulated (matrix) information from Microsoft Dynamics AX. These functions use the Microsoft
Office table object as the presentation container, and as such, will inherit and respect the formatting
capabilities it has to offer.
You can combine these functions with other Atlas functions to build sophisticated reports.
Structured reports can be refreshed dynamically; assuming that one or more of the report’s filters is
linked to the contents of a cell or they can be refreshed from the Atlas ribbon bar on demand.
Summary and matrix style functions off drill-down capabilities by default, List style reports do not
unless a specific drill-down source is included in the context information.
Structured reporting functions also make use of the managed column feature. This allows you to
incorporate other Atlas (such as Balance or Column) or Excel functions into the report. When the
report is refreshed then these managed columns, including their contents, are treated as if they
were part of the Structured report definition itself.
4.2 Objectives
At the end of this chapter, you will be able to:
Understand how to build a basic List, Summary or Matrix report
Understand how to apply formatting and styles
Understand the refresh options available to the Structured reporting functions
Understand how you can combine the Structured reporting functions with other functions to
build sophisticated reports using managed columns
Understand how to include columns from other, linked tables
Understand how to edit reports that use these functions

Structured reporting functions
57
4.3 Managed columns
4.3.1 Outline
Managed columns are like normal columns of the report except that they can contain a standard
excel function or an Atlas free-format function, such as Column or Balance. As the report is
refreshed it will expand and contract in length as the data and filters dictate. Atlas manages these,
additional, managed columns as if they were a natural part of the result-set itself. It ensures that the
contents are copied down to the extent of the report.
Managed columns allow you to host other Atlas queries; these will typically, that take input from
elements on the report row itself and return other, related values. You can also use managed
columns to host Excel formula functions that perform calculations on values in the report row.
4.3.2 Uses
Use managed columns when you want to:
Host other the Atlas free-format function of Balance and Column as a natural part of the
structured report itself
Host other the standard Microsoft Excel formula functions as a natural part of the structured
report itself
Use figures and information from other modules in Microsoft Dynamics AX which would
otherwise be too complex to join in a structured query
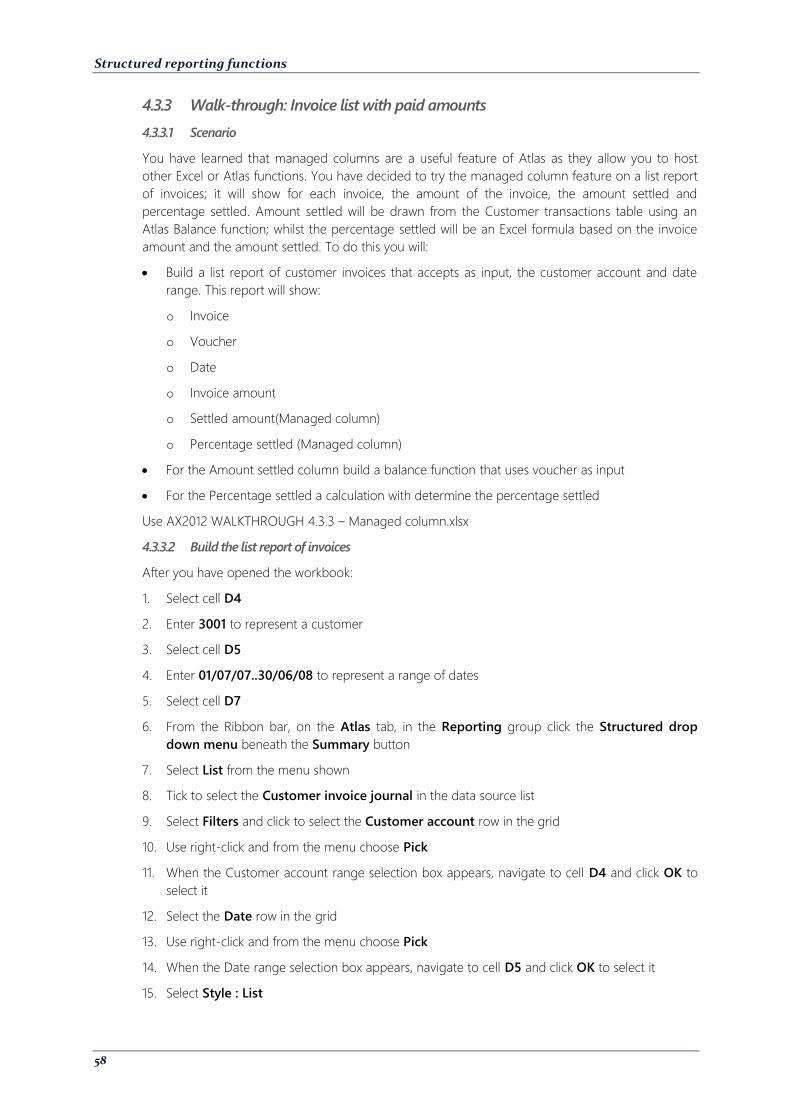
Structured reporting functions
58
4.3.3 Walk-through: Invoice list with paid amounts
4.3.3.1 Scenario
You have learned that managed columns are a useful feature of Atlas as they allow you to host
other Excel or Atlas functions. You have decided to try the managed column feature on a list report
of invoices; it will show for each invoice, the amount of the invoice, the amount settled and
percentage settled. Amount settled will be drawn from the Customer transactions table using an
Atlas Balance function; whilst the percentage settled will be an Excel formula based on the invoice
amount and the amount settled. To do this you will:
Build a list report of customer invoices that accepts as input, the customer account and date
range. This report will show:
o Invoice
o Voucher
o Date
o Invoice amount
o Settled amount(Managed column)
o Percentage settled (Managed column)
For the Amount settled column build a balance function that uses voucher as input
For the Percentage settled a calculation with determine the percentage settled
Use AX2012 WALKTHROUGH 4.3.3 – Managed column.xlsx
4.3.3.2 Build the list report of invoices
After you have opened the workbook:
1. Select cell D4
2. Enter 3001 to represent a customer
3. Select cell D5
4. Enter 01/07/07..30/06/08 to represent a range of dates
5. Select cell D7
6. From the Ribbon bar, on the Atlas tab, in the Reporting group click the Structured drop
down menu beneath the Summary button
7. Select List from the menu shown
8. Tick to select the Customer invoice journal in the data source list
9. Select Filters and click to select the Customer account row in the grid
10. Use right-click and from the menu choose Pick
11. When the Customer account range selection box appears, navigate to cell D4 and click OK to
select it
12. Select the Date row in the grid
13. Use right-click and from the menu choose Pick
14. When the Date range selection box appears, navigate to cell D5 and click OK to select it
15. Select Style : List
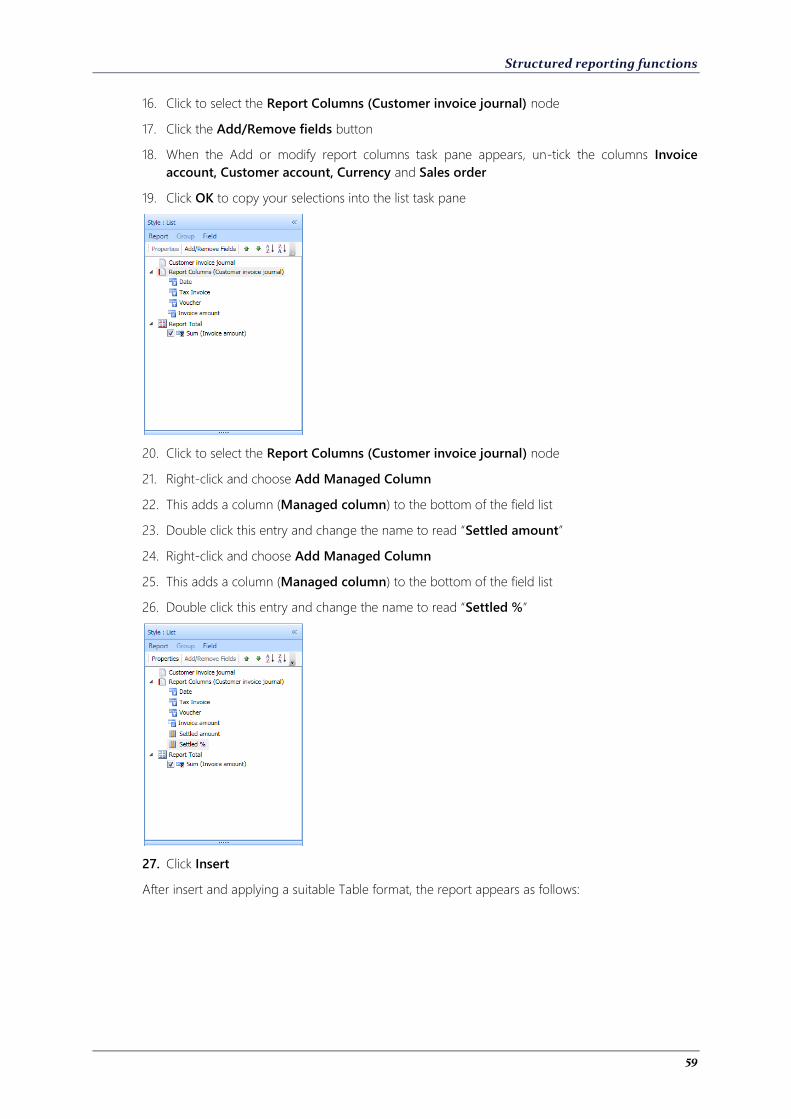
Structured reporting functions
59
16. Click to select the Report Columns (Customer invoice journal) node
17. Click the Add/Remove fields button
18. When the Add or modify report columns task pane appears, un-tick the columns Invoice
account, Customer account, Currency and Sales order
19. Click OK to copy your selections into the list task pane
20. Click to select the Report Columns (Customer invoice journal) node
21. Right-click and choose Add Managed Column
22. This adds a column (Managed column) to the bottom of the field list
23. Double click this entry and change the name to read “Settled amount”
24. Right-click and choose Add Managed Column
25. This adds a column (Managed column) to the bottom of the field list
26. Double click this entry and change the name to read “Settled %”
27. Click Insert
After insert and applying a suitable Table format, the report appears as follows:
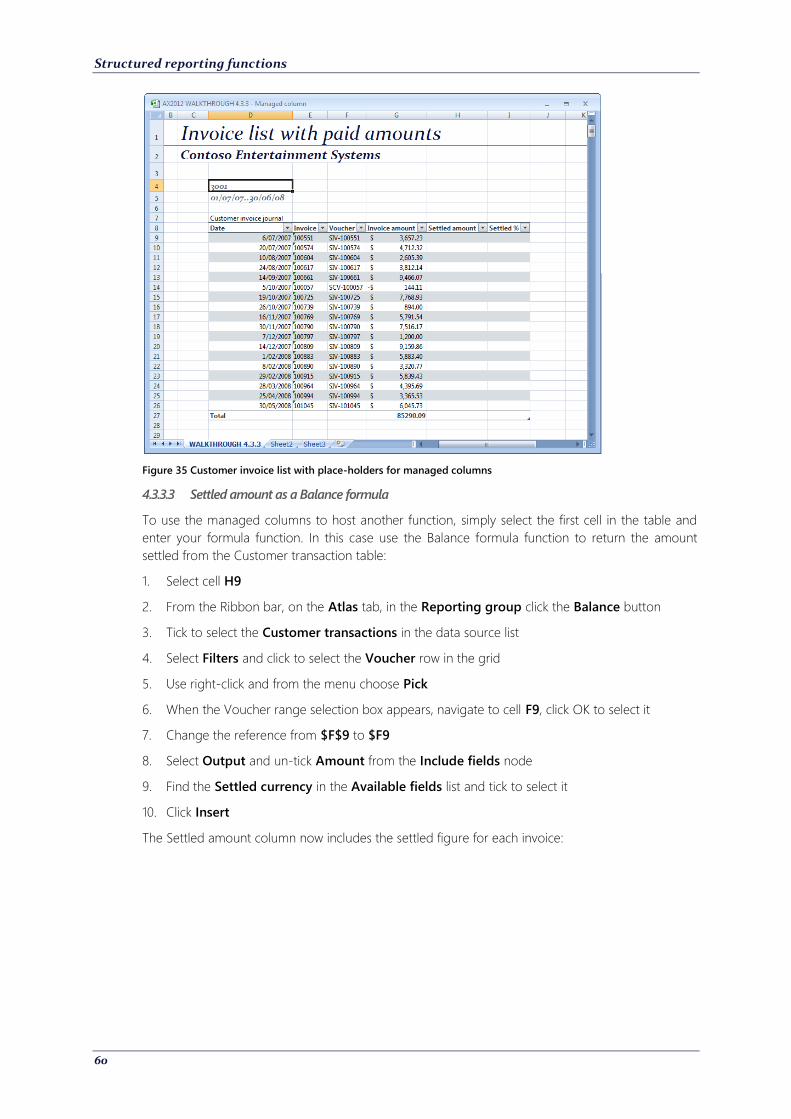
Structured reporting functions
60
Figure 35 Customer invoice list with place-holders for managed columns
4.3.3.3 Settled amount as a Balance formula
To use the managed columns to host another function, simply select the first cell in the table and
enter your formula function. In this case use the Balance formula function to return the amount
settled from the Customer transaction table:
1. Select cell H9
2. From the Ribbon bar, on the Atlas tab, in the Reporting group click the Balance button
3. Tick to select the Customer transactions in the data source list
4. Select Filters and click to select the Voucher row in the grid
5. Use right-click and from the menu choose Pick
6. When the Voucher range selection box appears, navigate to cell F9, click OK to select it
7. Change the reference from $F$9 to $F9
8. Select Output and un-tick Amount from the Include fields node
9. Find the Settled currency in the Available fields list and tick to select it
10. Click Insert
The Settled amount column now includes the settled figure for each invoice:

Structured reporting functions
61
Figure 36 Report now has the managed column (Settled currency amount) hosting a Balance function
4.3.3.4 Percent settled as an Excel formula function
To calculate the Settled %, simply:
1. Select cell I9
2. Type the formula =if(H9=0,0,H9/G9)
1. Format the column as a percentage
Here is how it will appear:
Figure 37 Completed report with managed columns
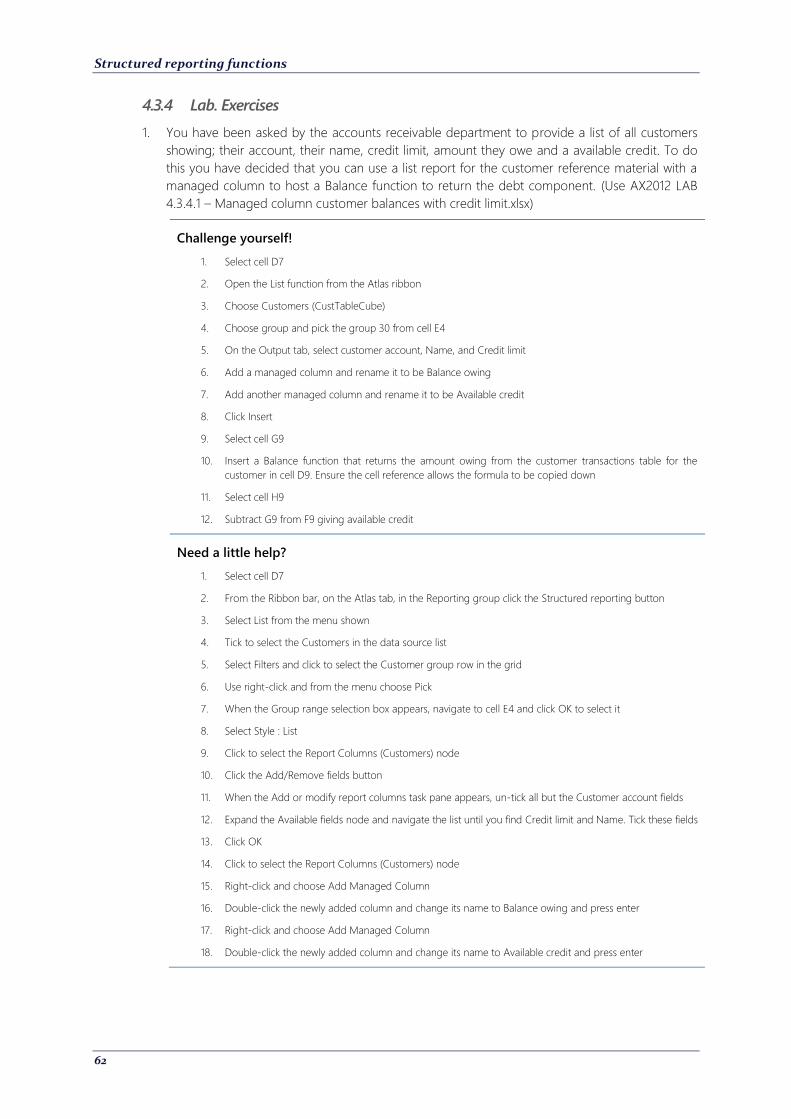
Structured reporting functions
62
4.3.4 Lab. Exercises
1. You have been asked by the accounts receivable department to provide a list of all customers
showing; their account, their name, credit limit, amount they owe and a available credit. To do
this you have decided that you can use a list report for the customer reference material with a
managed column to host a Balance function to return the debt component. (Use AX2012 LAB
4.3.4.1 – Managed column customer balances with credit limit.xlsx)
Challenge yourself!
1. Select cell D7
2. Open the List function from the Atlas ribbon
3. Choose Customers (CustTableCube)
4. Choose group and pick the group 30 from cell E4
5. On the Output tab, select customer account, Name, and Credit limit
6. Add a managed column and rename it to be Balance owing
7. Add another managed column and rename it to be Available credit
8. Click Insert
9. Select cell G9
10. Insert a Balance function that returns the amount owing from the customer transactions table for the
customer in cell D9. Ensure the cell reference allows the formula to be copied down
11. Select cell H9
12. Subtract G9 from F9 giving available credit
Need a little help?
1. Select cell D7
2. From the Ribbon bar, on the Atlas tab, in the Reporting group click the Structured reporting button
3. Select List from the menu shown
4. Tick to select the Customers in the data source list
5. Select Filters and click to select the Customer group row in the grid
6. Use right-click and from the menu choose Pick
7. When the Group range selection box appears, navigate to cell E4 and click OK to select it
8. Select Style : List
9. Click to select the Report Columns (Customers) node
10. Click the Add/Remove fields button
11. When the Add or modify report columns task pane appears, un-tick all but the Customer account fields
12. Expand the Available fields node and navigate the list until you find Credit limit and Name. Tick these fields
13. Click OK
14. Click to select the Report Columns (Customers) node
15. Right-click and choose Add Managed Column
16. Double-click the newly added column and change its name to Balance owing and press enter
17. Right-click and choose Add Managed Column
18. Double-click the newly added column and change its name to Available credit and press enter
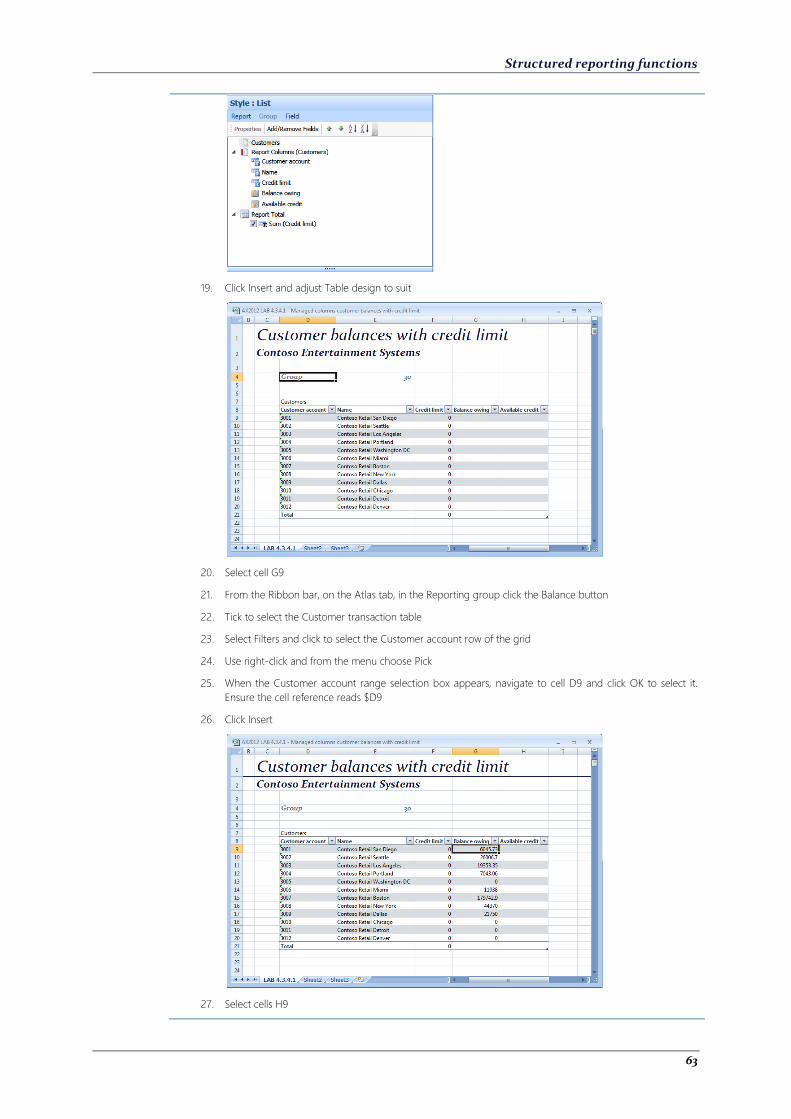
Structured reporting functions
63
19. Click Insert and adjust Table design to suit
20. Select cell G9
21. From the Ribbon bar, on the Atlas tab, in the Reporting group click the Balance button
22. Tick to select the Customer transaction table
23. Select Filters and click to select the Customer account row of the grid
24. Use right-click and from the menu choose Pick
25. When the Customer account range selection box appears, navigate to cell D9 and click OK to select it.
Ensure the cell reference reads $D9
26. Click Insert
27. Select cells H9
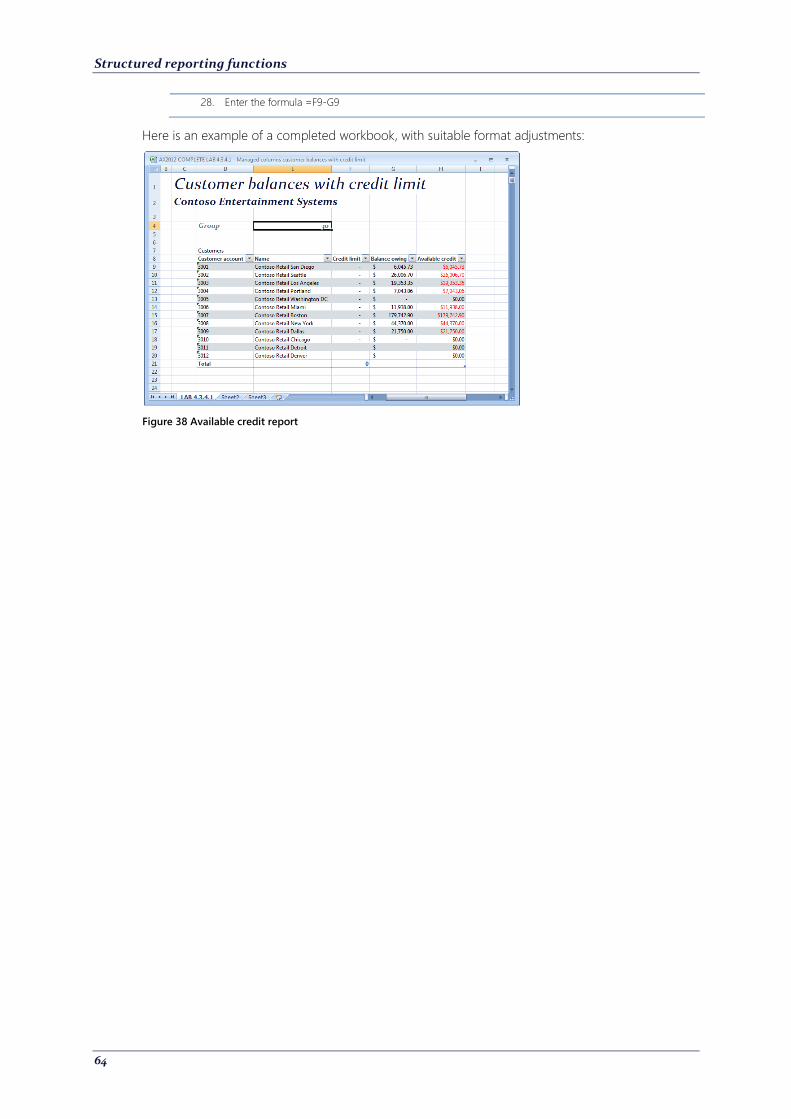
Structured reporting functions
64
28. Enter the formula =F9-G9
Here is an example of a completed workbook, with suitable format adjustments:
Figure 38 Available credit report
Structured reporting functions
65
4.4 Limiting reports to give Top 10 and last 5
4.4.1 Outline
You can use the List report to build a report based of the first n or the last n records. In addition, by
using the Summary report you can return the Top n or the Bottom n records that meet a given
criteria. These functions are similar in nature to the Report ranking functions described earlier.
When using the list report function, you will sort by a field that will give you the order you need for
the report. Use the limit feature to restrict the number records returned. For example, if you sort by
date most recent to oldest, and limit the records returned to 10, you have a report that shows last
10.
When using the Summary report function, by sorting on a summarized amount column and limiting
the records returned is similar in nature to the Report ranking function except this function returns
the whole report row.
4.4.2 Uses
Use the limit feature when:
You want to produce a list of the first or last n records in a query
You want to rank the records in a data source by sorting a summary function on amount
You want to test a report without returning all the transactions or records
Structured reporting functions
66
4.4.3 Walk-through: Last 5 sales
4.4.3.1 Scenario
As part of a daily summary of selling activity, you want to include a snapshot of the last 5 invoiced
sales orders per day. Before you finalize the design of the more ambitious report, you want to test
out the limit feature to see if it can be applied to give you the results you want. Use AX2012
WALKTHROUGH 4.4.3 – Limit last 5 invoices.xlsx
4.4.3.2 Building the list report for daily sales
When the workbook is open:
1. Select cell E4
2. Enter 30/06/08 to represent a date
3. Select cell D7
4. From the Ribbon bar, on the Atlas tab, in the Reporting group click the Structured drop
down menu beneath the Summary button
5. Select List from the menu shown
6. Tick to select the Customer invoice journal in the data source list
7. Select the Date row in the grid
8. Use right-click and from the menu choose Pick
9. When the Date range selection box appears, navigate to cell E4 and click OK to select it
10. Select Style : List
11. Click to select the Report Columns (Customer invoice journal) node
12. Click the Add/Remove fields button
13. When the Add or modify report columns task pane appears, un-tick the columns Invoice
account, Voucher, Sales order
14. Click to expand the Available fields node
15. Navigate the list and tick to select the field Invoice in default currency
16. Click OK to copy your selections into the list task pane
17. Use the up and down arrow keys to order the fields accordingly: Tax invoice, Customer
account, Date, Currency, Invoice amount, Invoice amount in the accounting currency
18. Click to select the Tax invoice column
19. Right-click and select the Descending option
20. Click to select the Customer invoice journal node at the top of the form
21. Right-click and choose Properties
22. Un-tick Show all records
23. Enter 5 in the Number of records entry box
24. Click OK
25. Click Insert
Report appears as follows:
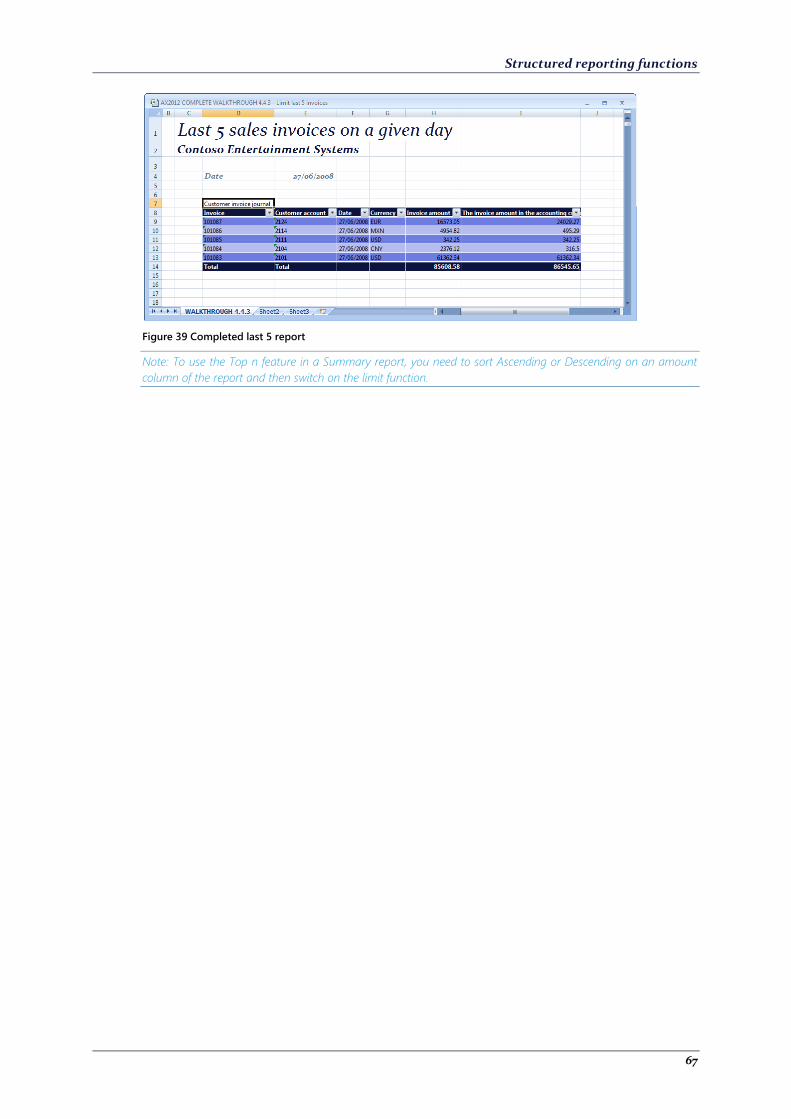
Structured reporting functions
67
Figure 39 Completed last 5 report
Note: To use the Top n feature in a Summary report, you need to sort Ascending or Descending on an amount
column of the report and then switch on the limit function.
Structured reporting functions
68
4.4.4 Lab. Exercises
1. You have been asked to provide a report that lists the last 10 invoices posted for a customer
group. The filter will need to include this group and there also needs to be a date filter too. You
should include Customer account, Customer name, Tax invoice, Date, Currency, Invoice amount
and Invoice amount in the accounting currency. (Use AX2012 LAB 4.4.4.1 – Last 10 invoices for a
group.xlsx)
Challenge yourself!
1. Select E4 and set the group
2. Select E5 and select the date range
3. Select cell D7
4. Create a list report that includes the required fields. Set a limit of 10 records and sort by Tax invoice
5. Change format of the table to style : Light 3
Need a little help?
1. Select cell E4
2. Enter a customer group code of 10
3. Select cell E5
4. Enter date range. E.g. 01/07/07..30/06/08
5. Select cell D7
6. Open the List function from the Atlas Ribbon Bar. This is opened from the drop-down menu that is
revealed when you click on Structured in the Reporting group
7. Tick to select the table Customer invoice journal
8. Open the Filter tab
9. Click to select the Date row
10. Use right-click and from the menu choose Pick
11. When the Date range selection box appears, navigate to cell E5 and click OK to select it
12. Click to the Fields button to open the filter fields list
13. Click to expand the Available fields
14. Navigate the list until you find Group, tick to select this field
15. Click OK
16. Click to select the Customer group row
17. Use right-click and from the menu choose Pick
18. When the Customer group range selection box appears, navigate to cell E4 and click OK to select it
19. Open the Style : List tab
20. Click the Report Columns (Customer invoice journal) node
21. Click Add/Remove Fields
22. Un-tick the Invoice account, Sales order and Voucher fields
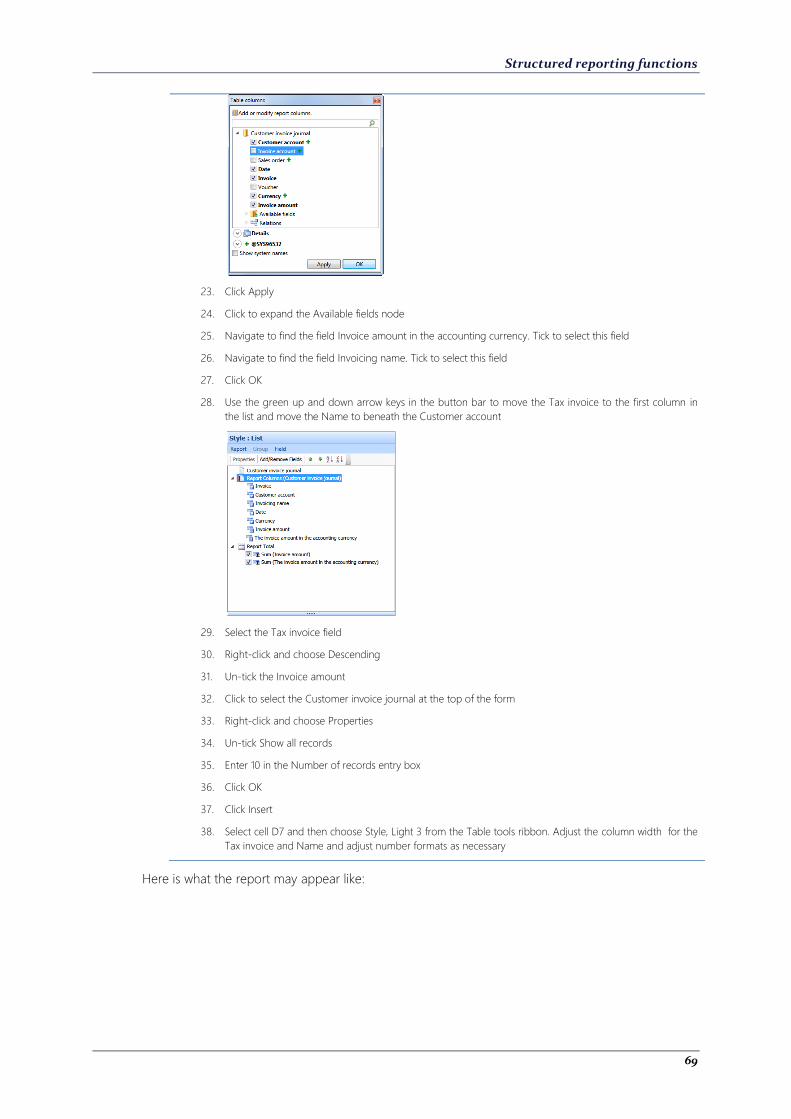
Structured reporting functions
69
23. Click Apply
24. Click to expand the Available fields node
25. Navigate to find the field Invoice amount in the accounting currency. Tick to select this field
26. Navigate to find the field Invoicing name. Tick to select this field
27. Click OK
28. Use the green up and down arrow keys in the button bar to move the Tax invoice to the first column in
the list and move the Name to beneath the Customer account
29. Select the Tax invoice field
30. Right-click and choose Descending
31. Un-tick the Invoice amount
32. Click to select the Customer invoice journal at the top of the form
33. Right-click and choose Properties
34. Un-tick Show all records
35. Enter 10 in the Number of records entry box
36. Click OK
37. Click Insert
38. Select cell D7 and then choose Style, Light 3 from the Table tools ribbon. Adjust the column width for the
Tax invoice and Name and adjust number formats as necessary
Here is what the report may appear like:
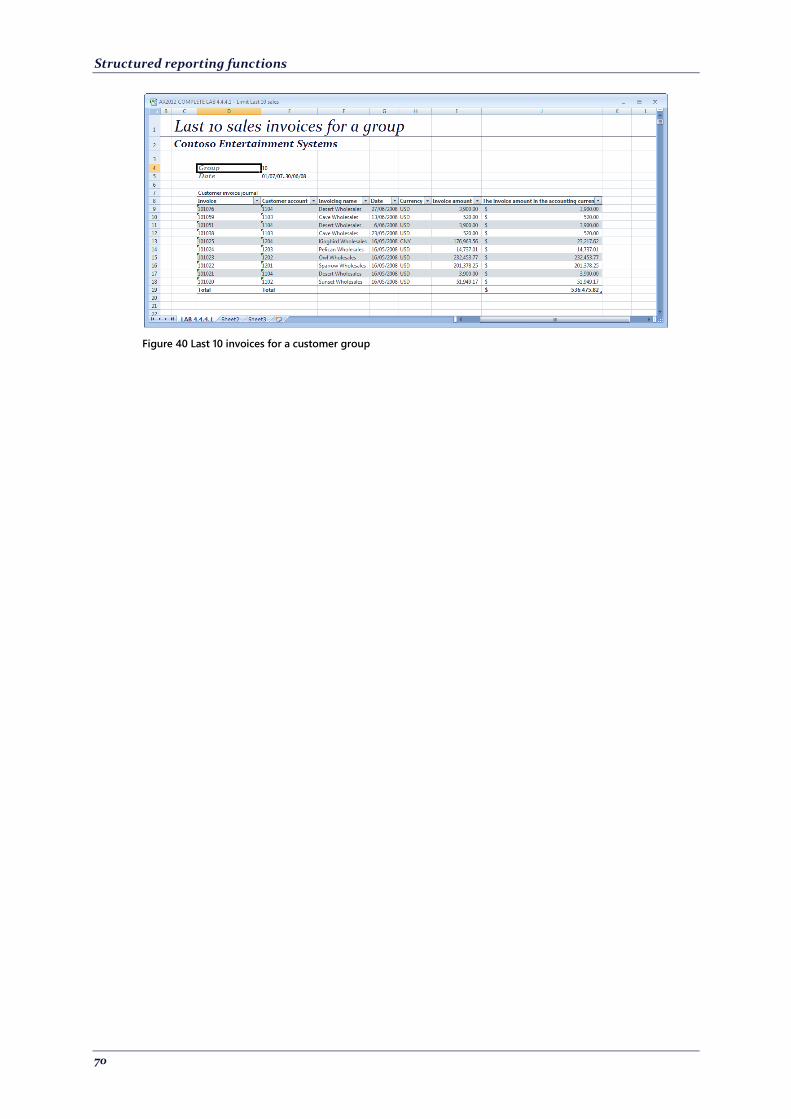
Structured reporting functions
70
Figure 40 Last 10 invoices for a customer group
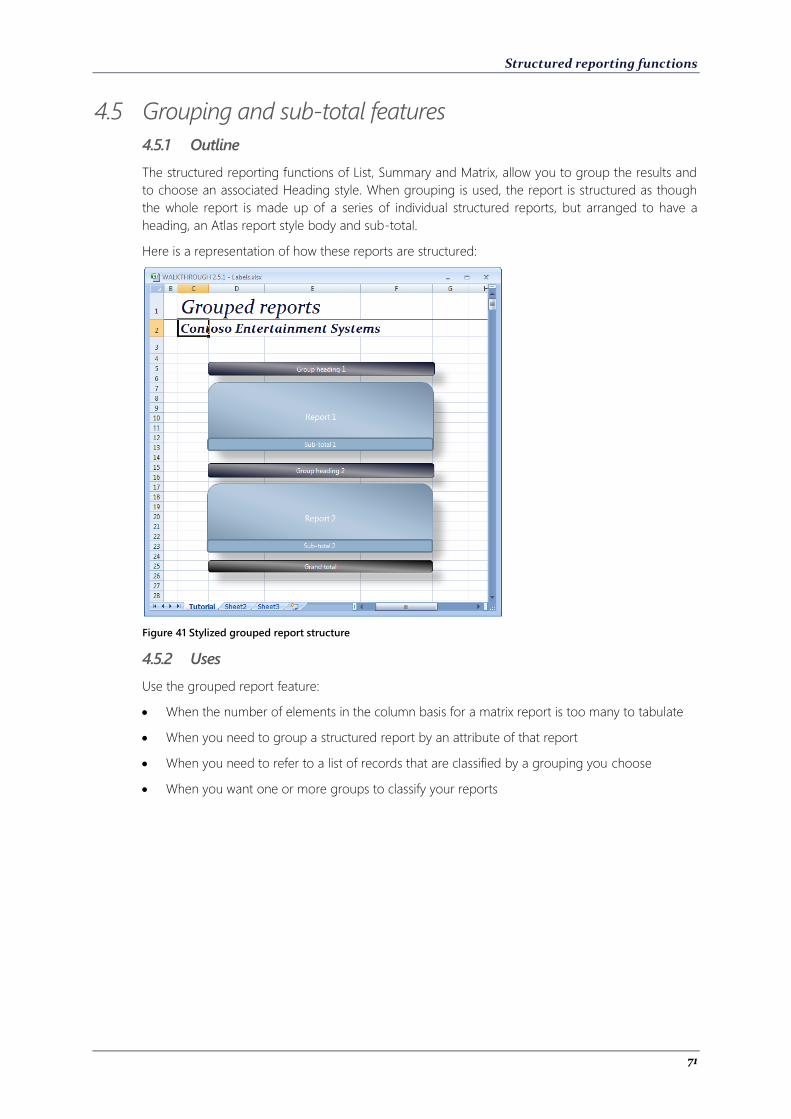
Structured reporting functions
71
4.5 Grouping and sub-total features
4.5.1 Outline
The structured reporting functions of List, Summary and Matrix, allow you to group the results and
to choose an associated Heading style. When grouping is used, the report is structured as though
the whole report is made up of a series of individual structured reports, but arranged to have a
heading, an Atlas report style body and sub-total.
Here is a representation of how these reports are structured:
Figure 41 Stylized grouped report structure
4.5.2 Uses
Use the grouped report feature:
When the number of elements in the column basis for a matrix report is too many to tabulate
When you need to group a structured report by an attribute of that report
When you need to refer to a list of records that are classified by a grouping you choose
When you want one or more groups to classify your reports
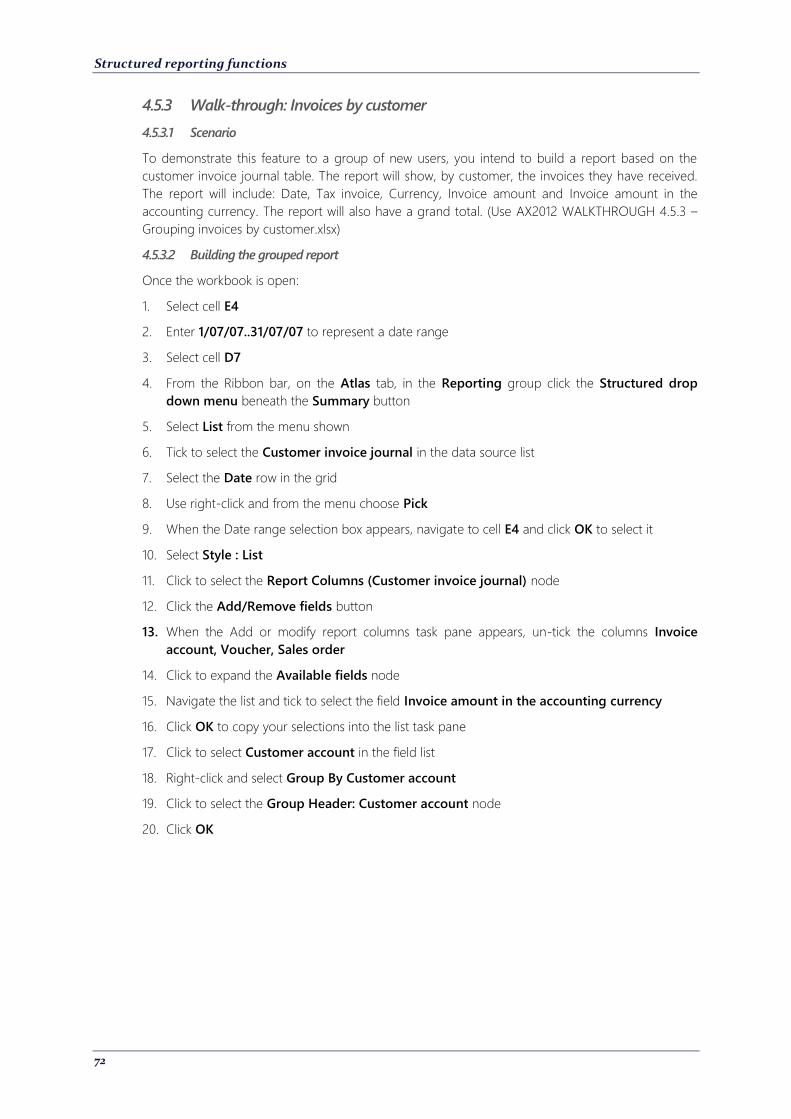
Structured reporting functions
72
4.5.3 Walk-through: Invoices by customer
4.5.3.1 Scenario
To demonstrate this feature to a group of new users, you intend to build a report based on the
customer invoice journal table. The report will show, by customer, the invoices they have received.
The report will include: Date, Tax invoice, Currency, Invoice amount and Invoice amount in the
accounting currency. The report will also have a grand total. (Use AX2012 WALKTHROUGH 4.5.3 –
Grouping invoices by customer.xlsx)
4.5.3.2 Building the grouped report
Once the workbook is open:
1. Select cell E4
2. Enter 1/07/07..31/07/07 to represent a date range
3. Select cell D7
4. From the Ribbon bar, on the Atlas tab, in the Reporting group click the Structured drop
down menu beneath the Summary button
5. Select List from the menu shown
6. Tick to select the Customer invoice journal in the data source list
7. Select the Date row in the grid
8. Use right-click and from the menu choose Pick
9. When the Date range selection box appears, navigate to cell E4 and click OK to select it
10. Select Style : List
11. Click to select the Report Columns (Customer invoice journal) node
12. Click the Add/Remove fields button
13. When the Add or modify report columns task pane appears, un-tick the columns Invoice
account, Voucher, Sales order
14. Click to expand the Available fields node
15. Navigate the list and tick to select the field Invoice amount in the accounting currency
16. Click OK to copy your selections into the list task pane
17. Click to select Customer account in the field list
18. Right-click and select Group By Customer account
19. Click to select the Group Header: Customer account node
20. Click OK
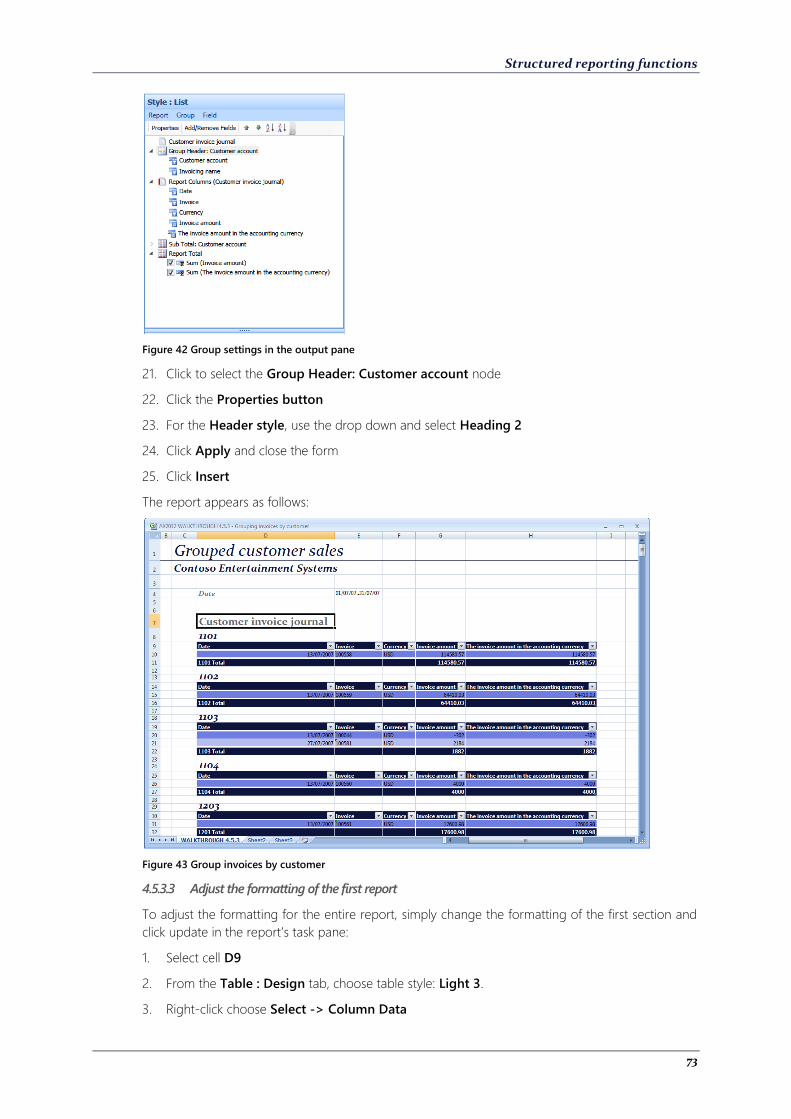
Structured reporting functions
73
Figure 42 Group settings in the output pane
21. Click to select the Group Header: Customer account node
22. Click the Properties button
23. For the Header style, use the drop down and select Heading 2
24. Click Apply and close the form
25. Click Insert
The report appears as follows:
Figure 43 Group invoices by customer
4.5.3.3 Adjust the formatting of the first report
To adjust the formatting for the entire report, simply change the formatting of the first section and
click update in the report’s task pane:
1. Select cell D9
2. From the Table : Design tab, choose table style: Light 3.
3. Right-click choose Select -> Column Data
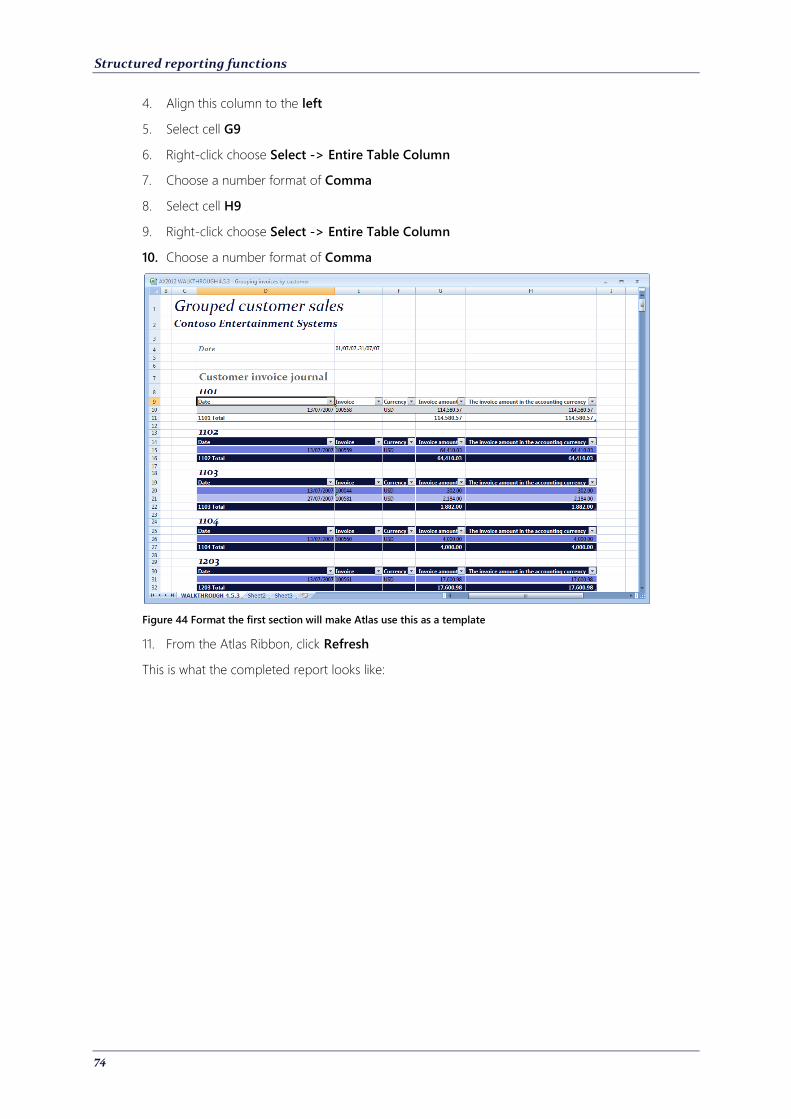
Structured reporting functions
74
4. Align this column to the left
5. Select cell G9
6. Right-click choose Select -> Entire Table Column
7. Choose a number format of Comma
8. Select cell H9
9. Right-click choose Select -> Entire Table Column
10. Choose a number format of Comma
Figure 44 Format the first section will make Atlas use this as a template
11. From the Atlas Ribbon, click Refresh
This is what the completed report looks like:
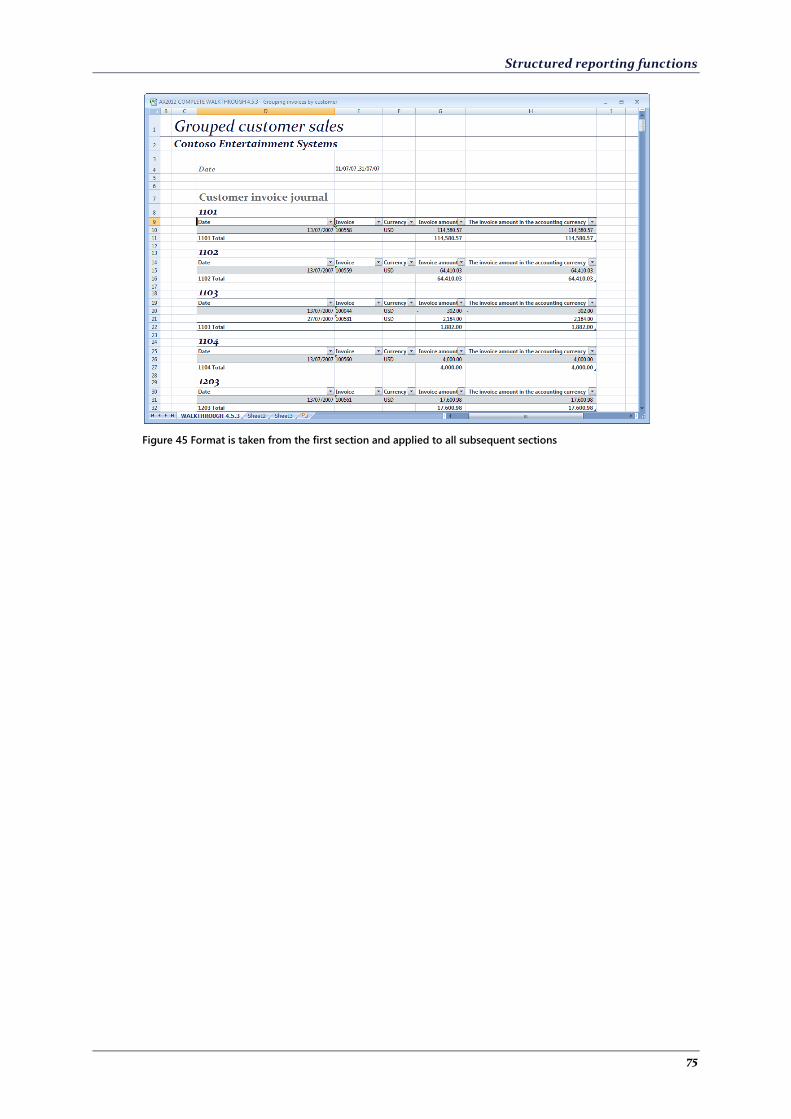
Structured reporting functions
75
Figure 45 Format is taken from the first section and applied to all subsequent sections
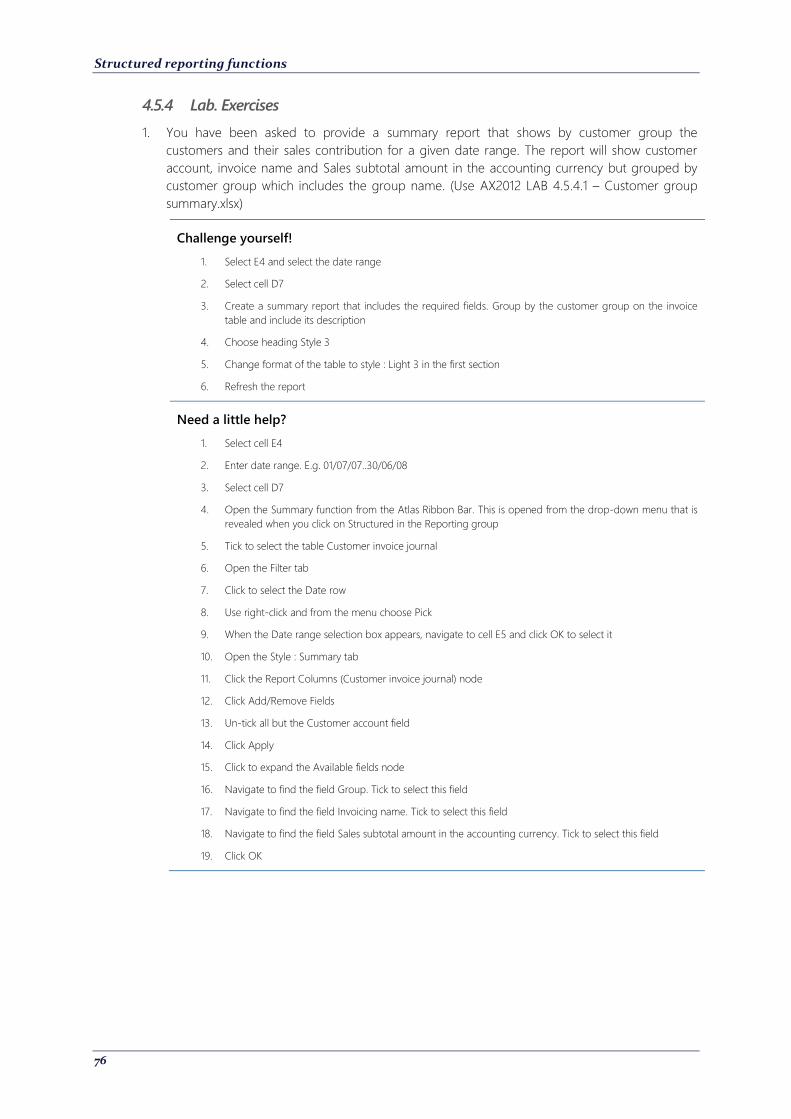
Structured reporting functions
76
4.5.4 Lab. Exercises
1. You have been asked to provide a summary report that shows by customer group the
customers and their sales contribution for a given date range. The report will show customer
account, invoice name and Sales subtotal amount in the accounting currency but grouped by
customer group which includes the group name. (Use AX2012 LAB 4.5.4.1 – Customer group
summary.xlsx)
Challenge yourself!
1. Select E4 and select the date range
2. Select cell D7
3. Create a summary report that includes the required fields. Group by the customer group on the invoice
table and include its description
4. Choose heading Style 3
5. Change format of the table to style : Light 3 in the first section
6. Refresh the report
Need a little help?
1. Select cell E4
2. Enter date range. E.g. 01/07/07..30/06/08
3. Select cell D7
4. Open the Summary function from the Atlas Ribbon Bar. This is opened from the drop-down menu that is
revealed when you click on Structured in the Reporting group
5. Tick to select the table Customer invoice journal
6. Open the Filter tab
7. Click to select the Date row
8. Use right-click and from the menu choose Pick
9. When the Date range selection box appears, navigate to cell E5 and click OK to select it
10. Open the Style : Summary tab
11. Click the Report Columns (Customer invoice journal) node
12. Click Add/Remove Fields
13. Un-tick all but the Customer account field
14. Click Apply
15. Click to expand the Available fields node
16. Navigate to find the field Group. Tick to select this field
17. Navigate to find the field Invoicing name. Tick to select this field
18. Navigate to find the field Sales subtotal amount in the accounting currency. Tick to select this field
19. Click OK
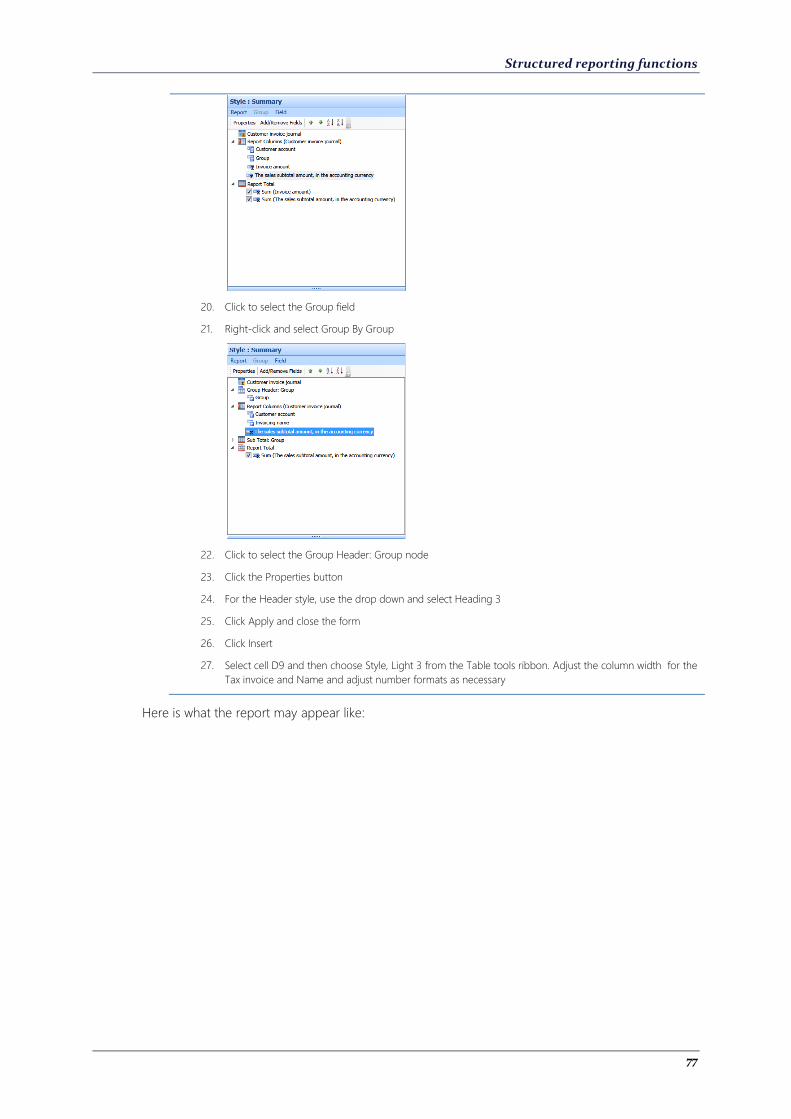
Structured reporting functions
77
20. Click to select the Group field
21. Right-click and select Group By Group
22. Click to select the Group Header: Group node
23. Click the Properties button
24. For the Header style, use the drop down and select Heading 3
25. Click Apply and close the form
26. Click Insert
27. Select cell D9 and then choose Style, Light 3 from the Table tools ribbon. Adjust the column width for the
Tax invoice and Name and adjust number formats as necessary
Here is what the report may appear like:
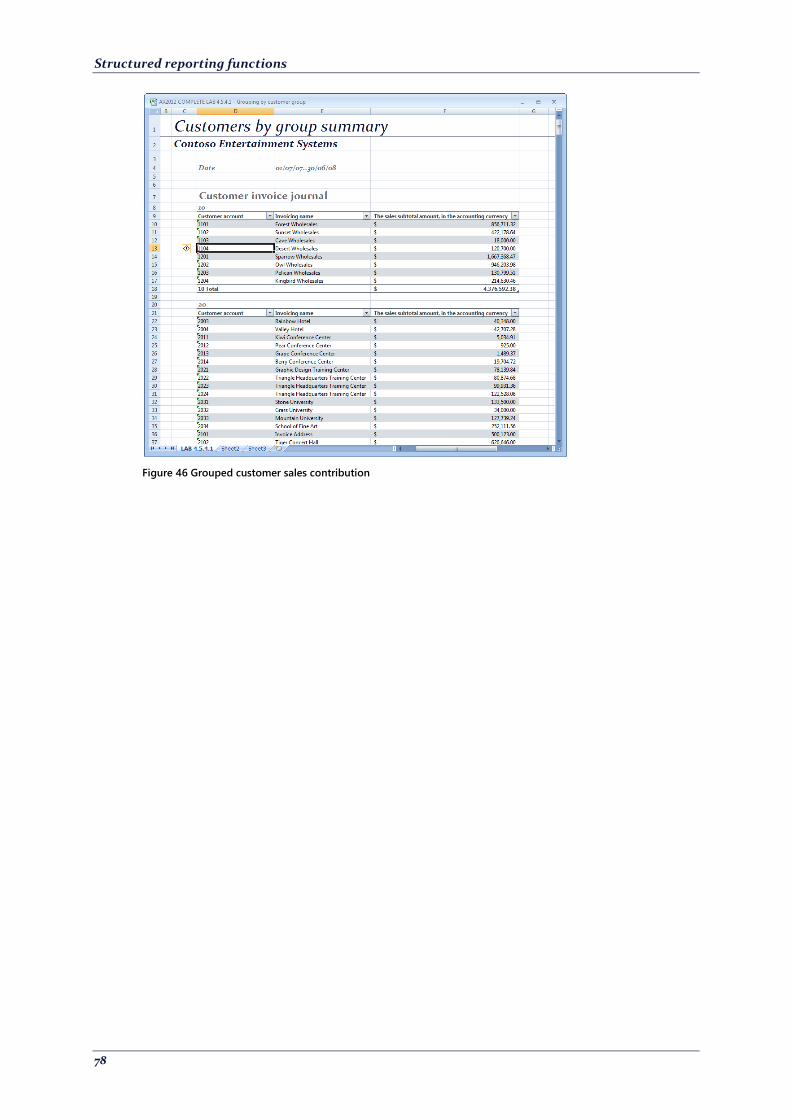
Structured reporting functions
78
Figure 46 Grouped customer sales contribution
Structured reporting functions
79
4.6 Format options
4.6.1 Outline
In general formatting is handled by the host Microsoft Office program. That is, the style, alignments
and number formats are applied after the Atlas report is finished. When you adjust any of these
settings, when the report is refreshed or updated, your settings are remembered and the new
formatting is respected.
There are other formatting features that do exist in the Atlas task panes. These are generally
function specific, but there some common ones that you should know about. These include:
Report name definition
Heading styles
o Report
o Group
Date controls
Decimal places in programs other than Microsoft Excel
4.6.2 Uses
Use these features to apply basic format controls to you report:
Heading styles can be setup and applied to various levels in your report
Report names can be adjusted away from the default of the table name
Date control can be used to adjust appearance and to control “missing” periods
Decimal place use is important in programs that do not have number formatting like Microsoft
Excel
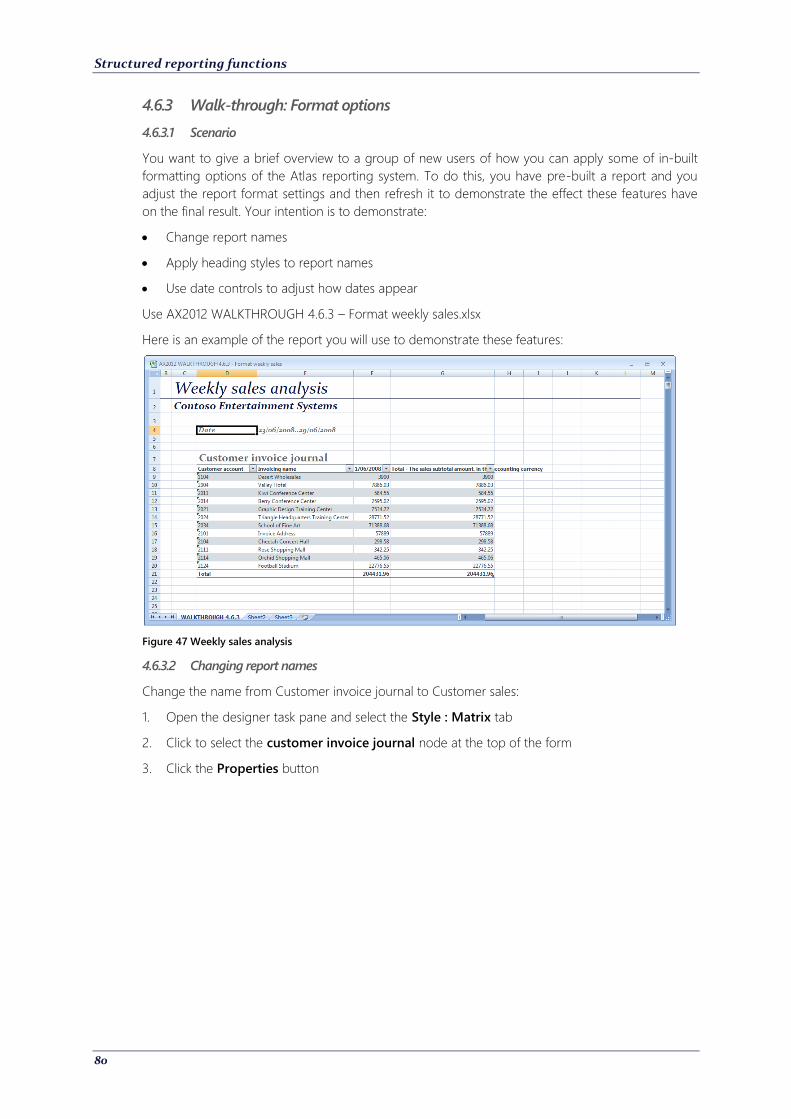
Structured reporting functions
80
4.6.3 Walk-through: Format options
4.6.3.1 Scenario
You want to give a brief overview to a group of new users of how you can apply some of in-built
formatting options of the Atlas reporting system. To do this, you have pre-built a report and you
adjust the report format settings and then refresh it to demonstrate the effect these features have
on the final result. Your intention is to demonstrate:
Change report names
Apply heading styles to report names
Use date controls to adjust how dates appear
Use AX2012 WALKTHROUGH 4.6.3 – Format weekly sales.xlsx
Here is an example of the report you will use to demonstrate these features:
Figure 47 Weekly sales analysis
4.6.3.2 Changing report names
Change the name from Customer invoice journal to Customer sales:
1. Open the designer task pane and select the Style : Matrix tab
2. Click to select the customer invoice journal node at the top of the form
3. Click the Properties button
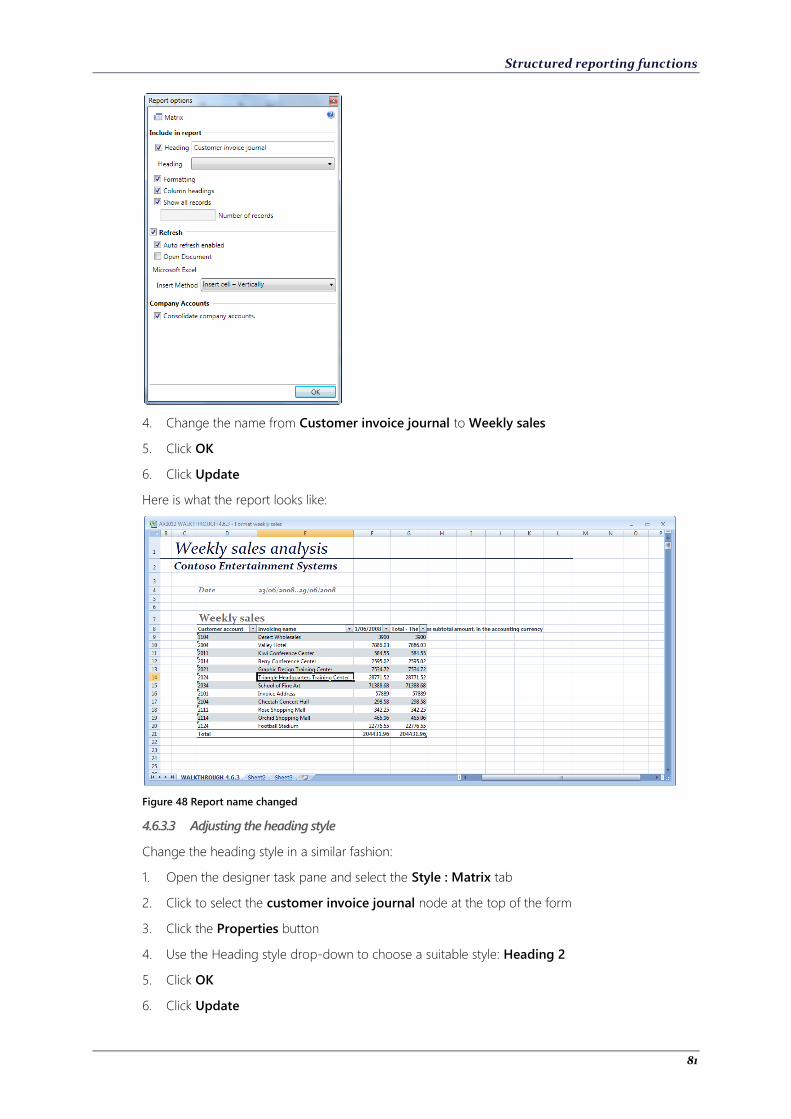
Structured reporting functions
81
4. Change the name from Customer invoice journal to Weekly sales
5. Click OK
6. Click Update
Here is what the report looks like:
Figure 48 Report name changed
4.6.3.3 Adjusting the heading style
Change the heading style in a similar fashion:
1. Open the designer task pane and select the Style : Matrix tab
2. Click to select the customer invoice journal node at the top of the form
3. Click the Properties button
4. Use the Heading style drop-down to choose a suitable style: Heading 2
5. Click OK
6. Click Update

Structured reporting functions
82
Here is what the report looks like:
Figure 49 Heading style 2 applied. Note, you may need to adjust the row height to accommodate the style
4.6.3.4 Controlling date formats
This report shows transactions within a date range of a week. However, it only shows days where
transaction amounts have been posted. In order to make the report reflect a tabulated week, we
need to use the missing periods function:
1. Open the designer task pane and select the Style : Matrix tab
2. Click to select the Date field in Column basis group
3. Click the Properties button
4. Tick to select the Empty periods check-box
5. Click Apply and close the form
6. Click OK
7. Click Update
The report now appears as follows:
Structured reporting functions
83
Figure 50 Weekly sales showing "missing" periods
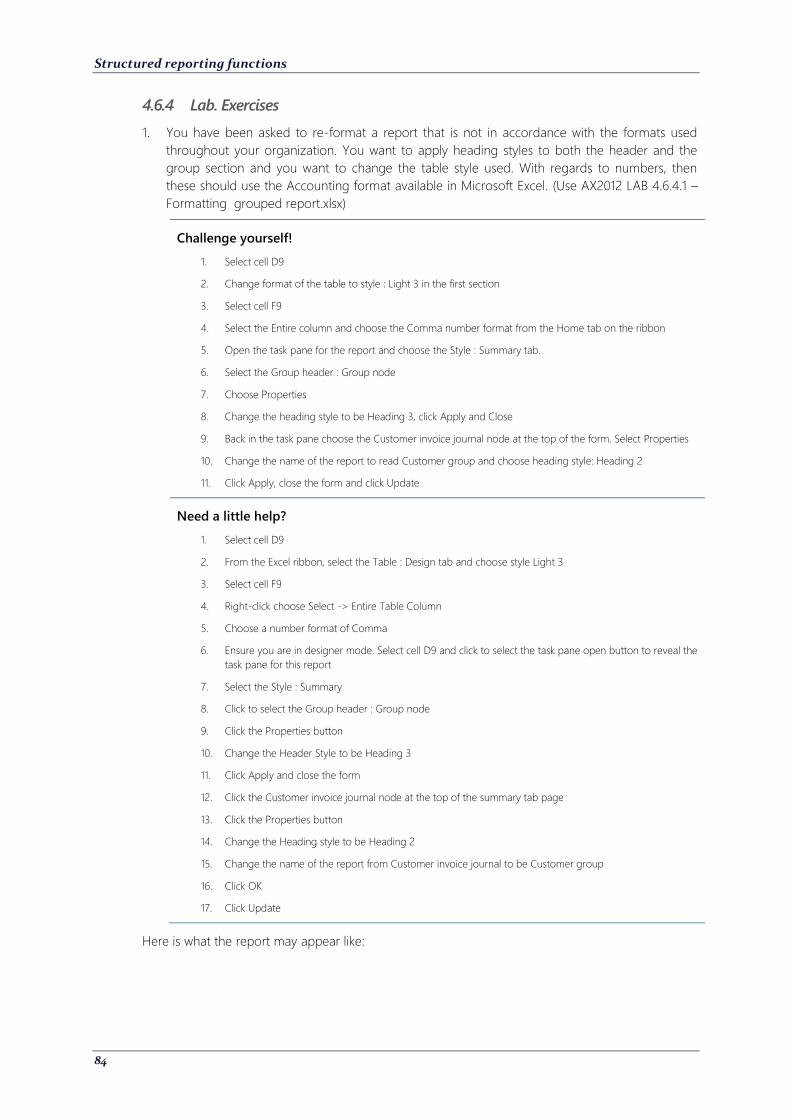
Structured reporting functions
84
4.6.4 Lab. Exercises
1. You have been asked to re-format a report that is not in accordance with the formats used
throughout your organization. You want to apply heading styles to both the header and the
group section and you want to change the table style used. With regards to numbers, then
these should use the Accounting format available in Microsoft Excel. (Use AX2012 LAB 4.6.4.1 –
Formatting grouped report.xlsx)
Challenge yourself!
1. Select cell D9
2. Change format of the table to style : Light 3 in the first section
3. Select cell F9
4. Select the Entire column and choose the Comma number format from the Home tab on the ribbon
5. Open the task pane for the report and choose the Style : Summary tab.
6. Select the Group header : Group node
7. Choose Properties
8. Change the heading style to be Heading 3, click Apply and Close
9. Back in the task pane choose the Customer invoice journal node at the top of the form. Select Properties
10. Change the name of the report to read Customer group and choose heading style: Heading 2
11. Click Apply, close the form and click Update
Need a little help?
1. Select cell D9
2. From the Excel ribbon, select the Table : Design tab and choose style Light 3
3. Select cell F9
4. Right-click choose Select -> Entire Table Column
5. Choose a number format of Comma
6. Ensure you are in designer mode. Select cell D9 and click to select the task pane open button to reveal the
task pane for this report
7. Select the Style : Summary
8. Click to select the Group header : Group node
9. Click the Properties button
10. Change the Header Style to be Heading 3
11. Click Apply and close the form
12. Click the Customer invoice journal node at the top of the summary tab page
13. Click the Properties button
14. Change the Heading style to be Heading 2
15. Change the name of the report from Customer invoice journal to be Customer group
16. Click OK
17. Click Update
Here is what the report may appear like:
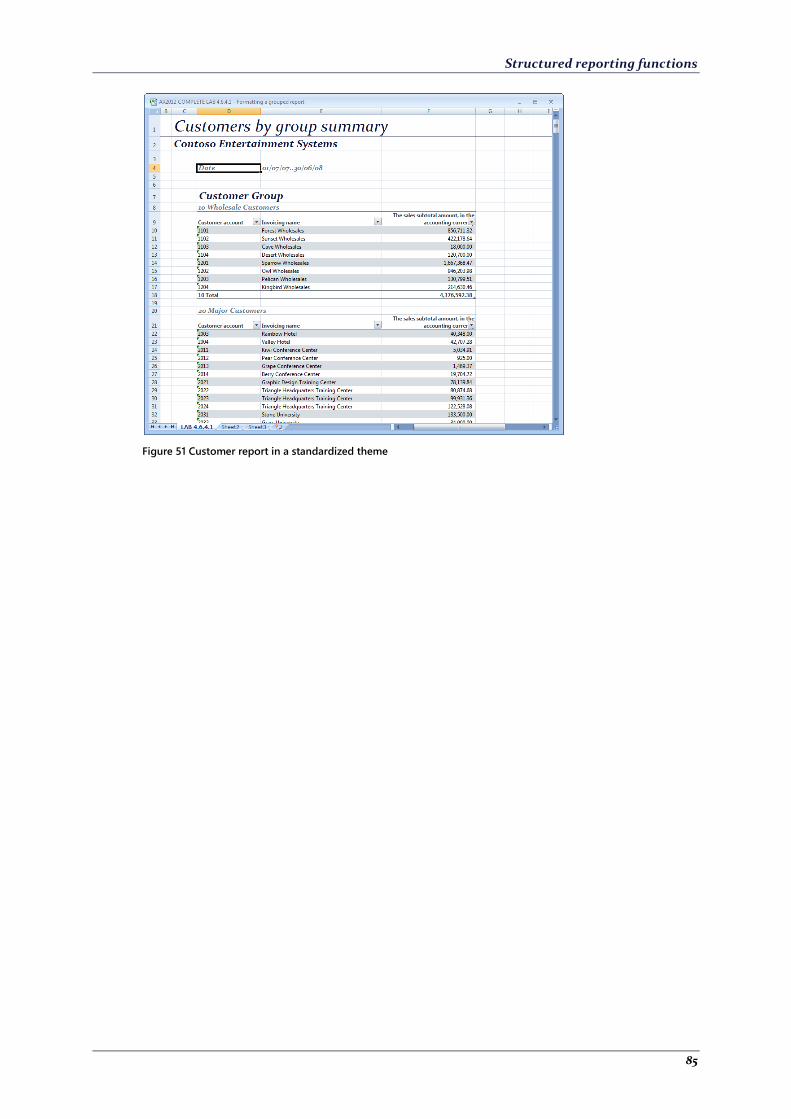
Structured reporting functions
85
Figure 51 Customer report in a standardized theme

Structured reporting functions
86
4.7 Key points
The key elements learned in this chapter included:
Managed columns
Record limits with respect to Top n and Last n reporting
Grouping and sub-totals
Formatting
Specifically, you learned that:
Managed columns are like place-holders in a structured report that can host either a standard
Excel function or an Atlas function alike.
As the report containing managed columns expands or contracts these place-holders and the
content therein are managed so that each cell is relevant to the row it is on.
Managed columns can only be added to a report via the designer task pane, although the
heading text can be adjusted in-situ when the report is in the document
Structured reports can be limited to return a specified number of rows. Use this feature on list
reports to return the first or last n records. When used with summary reports, this feature can
be used to return the top or bottom n records depending sort order of a summarized amount.
Structured reports can be grouped. A grouping basis is defined and when the report is run, for
each unique group level, a single structured report is built. Therefore, a grouped report is a
collection of individual structured reports
Grouped reports have a header and a sub-total as well as a grand total
Formatting is generally undertaken when the report is in the document, using standard
formatting options.
Some formatting can be undertaken when the report is being designed. This includes selection
of heading styles and date formatting.
For some Microsoft Office programs, those that do not have number format controls like Excel,
decimal and thousand separator control is provided.
Structured reporting functions
87
4.8 Quick interaction
Take a moment to write down the three key points you have learned:
1.
2.
3.
88
5 Pivot tables
5.1 Outline
This function allows you to create an advanced matrix style report using Microsoft Excel’s pivot table
interface. You can use Atlas to describe the data elements you want to include in the report and
then use the in-built pivot table functions to format the results. Atlas is the data retrieval engine,
whilst the pivot table feature is the presentation format.
The pivot table function uses task panes in the same way as those used to build other Atlas
functions. Once in the workbook, format the pivot table as you would any other. Upon refresh, Atlas
remembers your formatting and is applied automatically for you. Pivot table cross-tab provides a
snapshot, use the Atlas refresh options to recalculate the report.
Pivot tables produced using Atlas, also offer a drill-down and context information capability.
5.2 Objectives
By the end of this chapter you will be able to:
Understand what the two pivot table functions are used for
Produce a simple pivot table cross-tab without grouping
Produce a grouped pivot table cross-tab report with sub-totals and grand totals.
Understand how to format a pivot table
Use these functions to build a report or query in conjunction with other Atlas xl functions.
Pivot tables
89
5.3 Building pivot table report using Atlas
5.3.1 Outline
Atlas provides a front-end to Microsoft Excel’s pivot table function. Atlas generates a request
against your Microsoft Dynamics AX installation and then passes the information back to the Pivot
table for presentation. Once in the workbook, you can arrange the elements of the pivot table as
you see fit; whenever you refresh the Atlas request, the data in the pivot table is updated as a result
of the query.
The Atlas pivot table function is essentially the Matrix function with a different presentation
alternative.
Atlas pivot reporting supports drill-down and context drill-out.
5.3.2 Uses for the pivot table function
Use the pivot function when you want to present data from Microsoft Dynamics AX in a tabular
format with varying levels of grouping. Use pivot table reporting in conjunction with other functions,
particularly Lookup as an input to the request. Also use this function:
Tabulate a summary of records from a transaction record table by a particular column
When you want the tabulated results to be grouped in various ways
When you want to adjust the format of the report on-the-fly and when you want to slice-and-
dice the returned data
Use the report in conjunction with other summary reports as a building block of another report
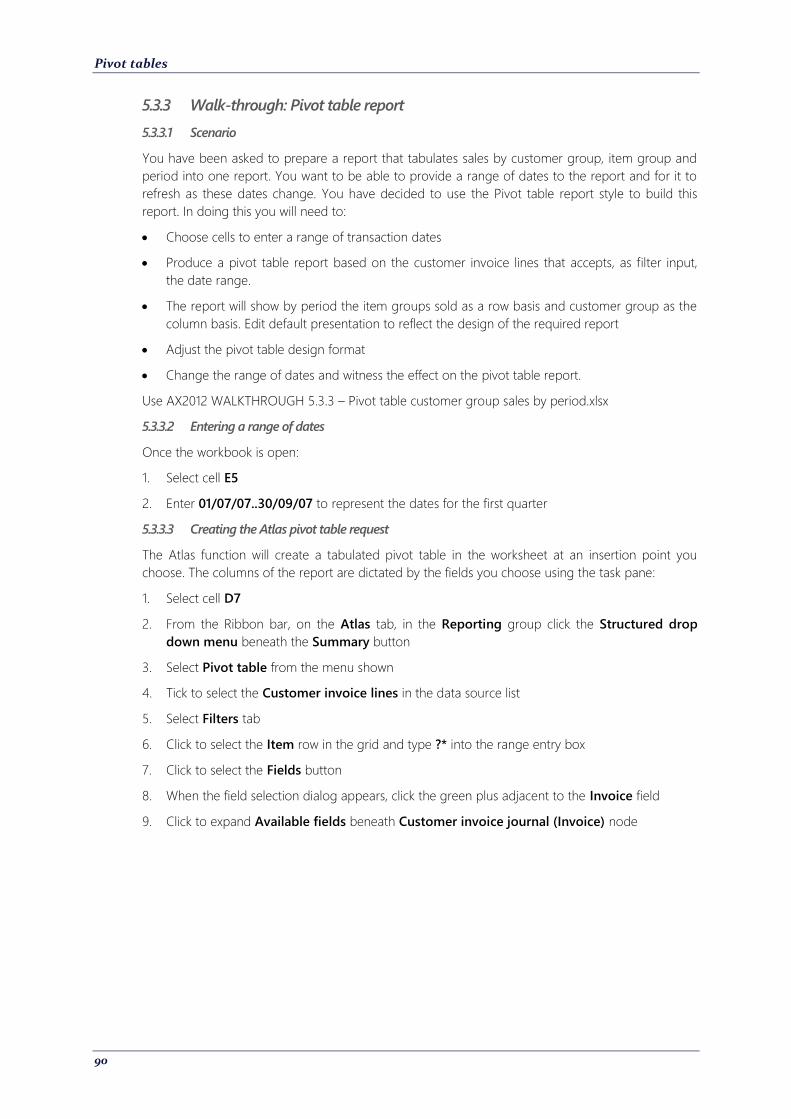
Pivot tables
90
5.3.3 Walk-through: Pivot table report
5.3.3.1 Scenario
You have been asked to prepare a report that tabulates sales by customer group, item group and
period into one report. You want to be able to provide a range of dates to the report and for it to
refresh as these dates change. You have decided to use the Pivot table report style to build this
report. In doing this you will need to:
Choose cells to enter a range of transaction dates
Produce a pivot table report based on the customer invoice lines that accepts, as filter input,
the date range.
The report will show by period the item groups sold as a row basis and customer group as the
column basis. Edit default presentation to reflect the design of the required report
Adjust the pivot table design format
Change the range of dates and witness the effect on the pivot table report.
Use AX2012 WALKTHROUGH 5.3.3 – Pivot table customer group sales by period.xlsx
5.3.3.2 Entering a range of dates
Once the workbook is open:
1. Select cell E5
2. Enter 01/07/07..30/09/07 to represent the dates for the first quarter
5.3.3.3 Creating the Atlas pivot table request
The Atlas function will create a tabulated pivot table in the worksheet at an insertion point you
choose. The columns of the report are dictated by the fields you choose using the task pane:
1. Select cell D7
2. From the Ribbon bar, on the Atlas tab, in the Reporting group click the Structured drop
down menu beneath the Summary button
3. Select Pivot table from the menu shown
4. Tick to select the Customer invoice lines in the data source list
5. Select Filters tab
6. Click to select the Item row in the grid and type ?* into the range entry box
7. Click to select the Fields button
8. When the field selection dialog appears, click the green plus adjacent to the Invoice field
9. Click to expand Available fields beneath Customer invoice journal (Invoice) node
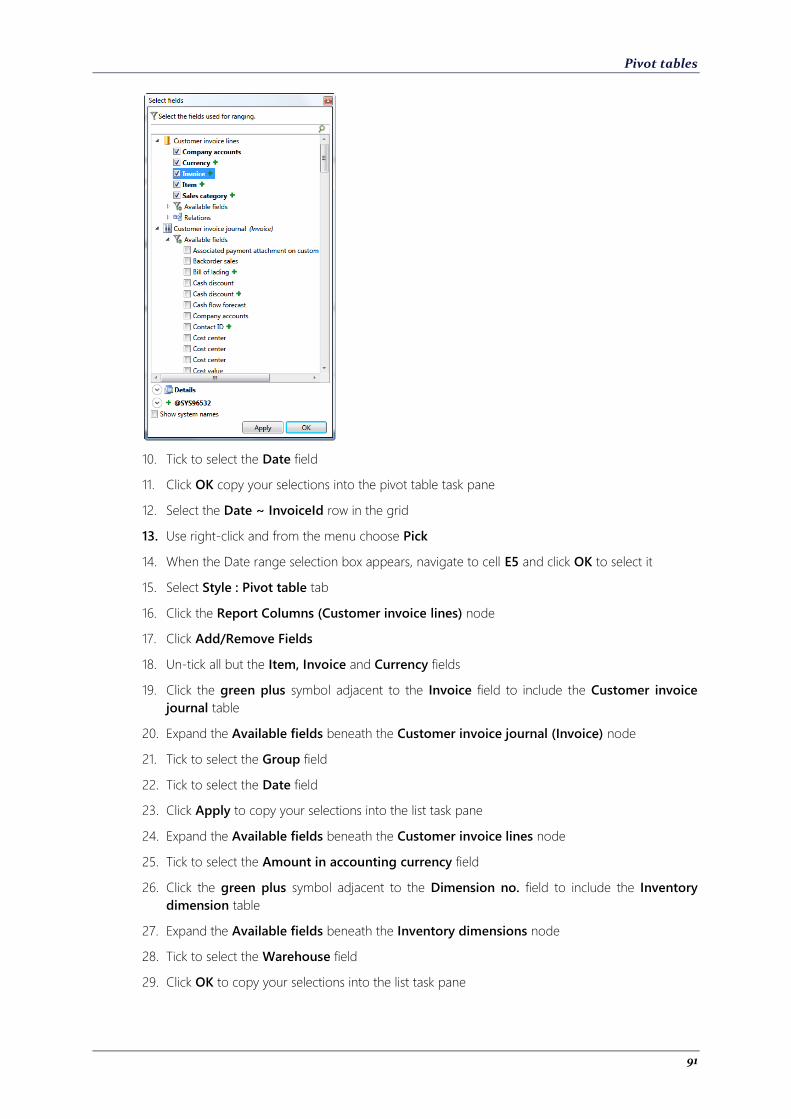
Pivot tables
91
10. Tick to select the Date field
11. Click OK copy your selections into the pivot table task pane
12. Select the Date ~ InvoiceId row in the grid
13. Use right-click and from the menu choose Pick
14. When the Date range selection box appears, navigate to cell E5 and click OK to select it
15. Select Style : Pivot table tab
16. Click the Report Columns (Customer invoice lines) node
17. Click Add/Remove Fields
18. Un-tick all but the Item, Invoice and Currency fields
19. Click the green plus symbol adjacent to the Invoice field to include the Customer invoice
journal table
20. Expand the Available fields beneath the Customer invoice journal (Invoice) node
21. Tick to select the Group field
22. Tick to select the Date field
23. Click Apply to copy your selections into the list task pane
24. Expand the Available fields beneath the Customer invoice lines node
25. Tick to select the Amount in accounting currency field
26. Click the green plus symbol adjacent to the Dimension no. field to include the Inventory
dimension table
27. Expand the Available fields beneath the Inventory dimensions node
28. Tick to select the Warehouse field
29. Click OK to copy your selections into the list task pane
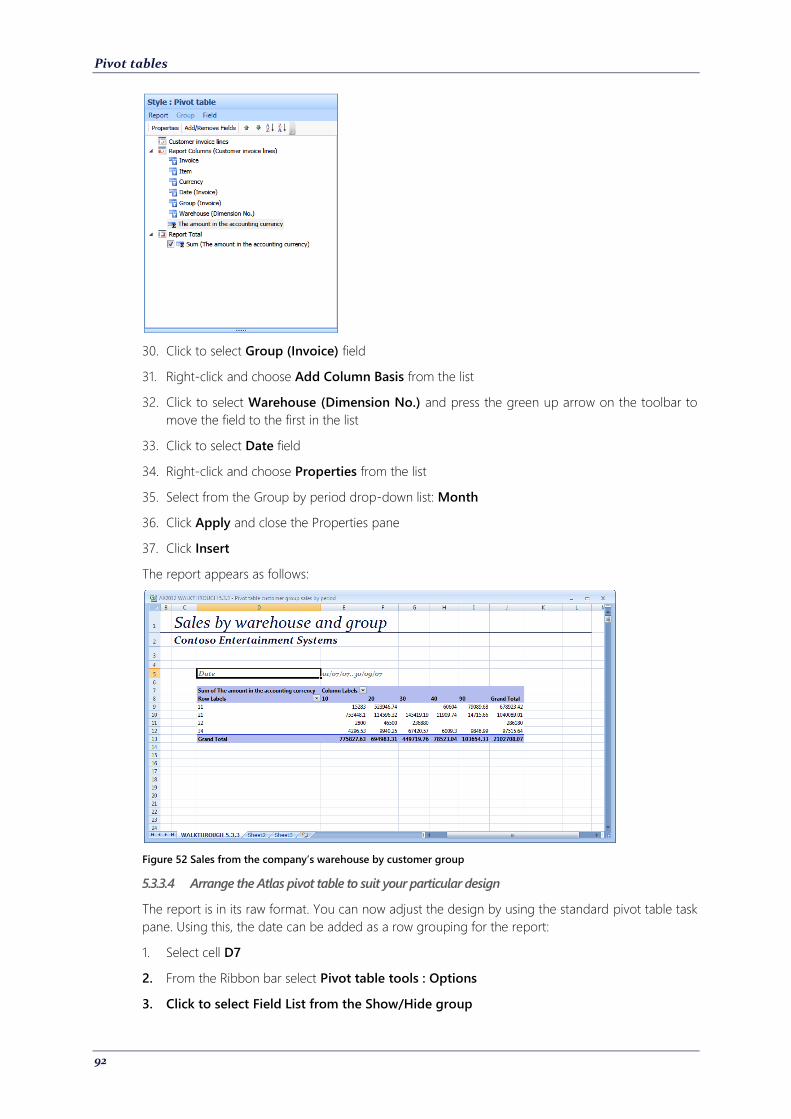
Pivot tables
92
30. Click to select Group (Invoice) field
31. Right-click and choose Add Column Basis from the list
32. Click to select Warehouse (Dimension No.) and press the green up arrow on the toolbar to
move the field to the first in the list
33. Click to select Date field
34. Right-click and choose Properties from the list
35. Select from the Group by period drop-down list: Month
36. Click Apply and close the Properties pane
37. Click Insert
The report appears as follows:
Figure 52 Sales from the company’s warehouse by customer group
5.3.3.4 Arrange the Atlas pivot table to suit your particular design
The report is in its raw format. You can now adjust the design by using the standard pivot table task
pane. Using this, the date can be added as a row grouping for the report:
1. Select cell D7
2. From the Ribbon bar select Pivot table tools : Options
3. Click to select Field List from the Show/Hide group
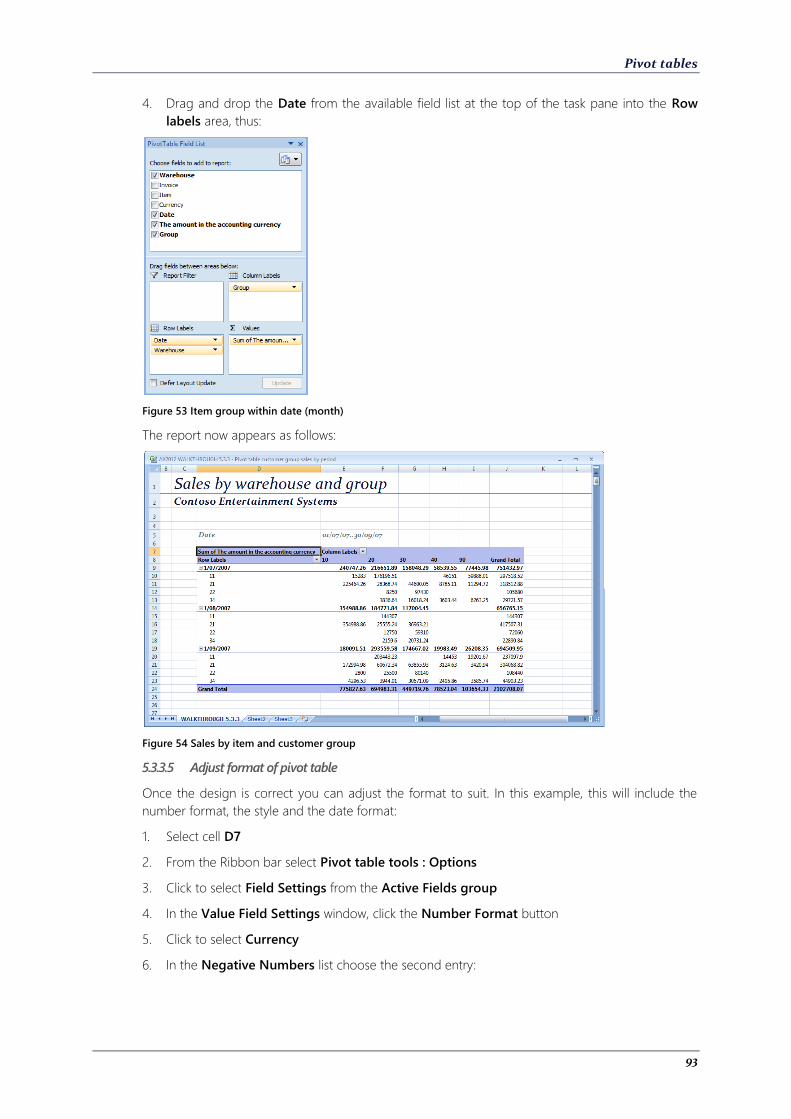
Pivot tables
93
4. Drag and drop the Date from the available field list at the top of the task pane into the Row
labels area, thus:
Figure 53 Item group within date (month)
The report now appears as follows:
Figure 54 Sales by item and customer group
5.3.3.5 Adjust format of pivot table
Once the design is correct you can adjust the format to suit. In this example, this will include the
number format, the style and the date format:
1. Select cell D7
2. From the Ribbon bar select Pivot table tools : Options
3. Click to select Field Settings from the Active Fields group
4. In the Value Field Settings window, click the Number Format button
5. Click to select Currency
6. In the Negative Numbers list choose the second entry:
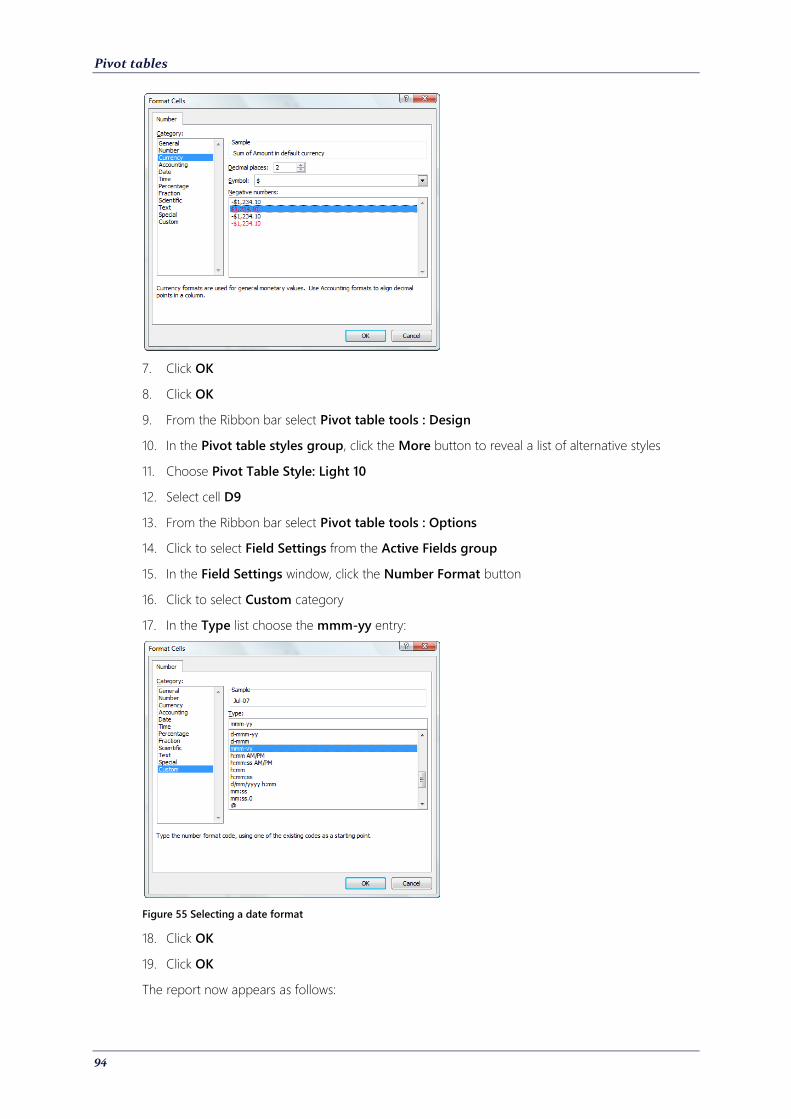
Pivot tables
94
7. Click OK
8. Click OK
9. From the Ribbon bar select Pivot table tools : Design
10. In the Pivot table styles group, click the More button to reveal a list of alternative styles
11. Choose Pivot Table Style: Light 10
12. Select cell D9
13. From the Ribbon bar select Pivot table tools : Options
14. Click to select Field Settings from the Active Fields group
15. In the Field Settings window, click the Number Format button
16. Click to select Custom category
17. In the Type list choose the mmm-yy entry:
Figure 55 Selecting a date format
18. Click OK
19. Click OK
The report now appears as follows:
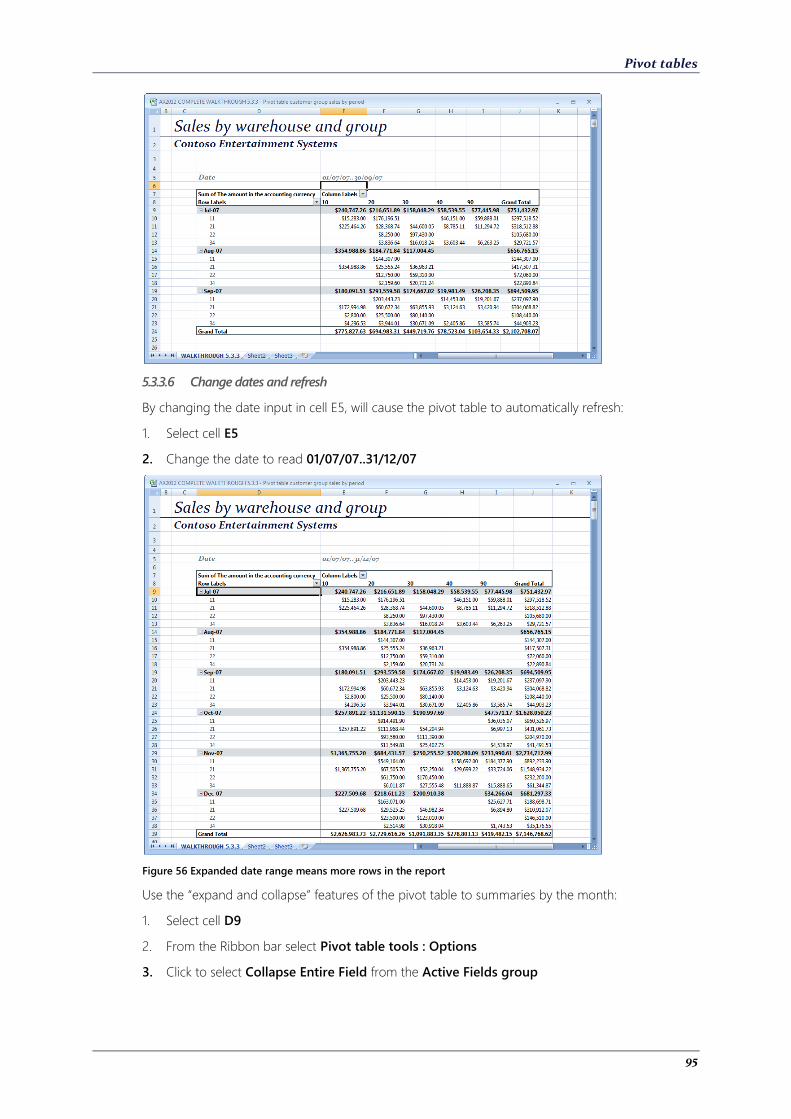
Pivot tables
95
5.3.3.6 Change dates and refresh
By changing the date input in cell E5, will cause the pivot table to automatically refresh:
1. Select cell E5
2. Change the date to read 01/07/07..31/12/07
Figure 56 Expanded date range means more rows in the report
Use the “expand and collapse” features of the pivot table to summaries by the month:
1. Select cell D9
2. From the Ribbon bar select Pivot table tools : Options
3. Click to select Collapse Entire Field from the Active Fields group
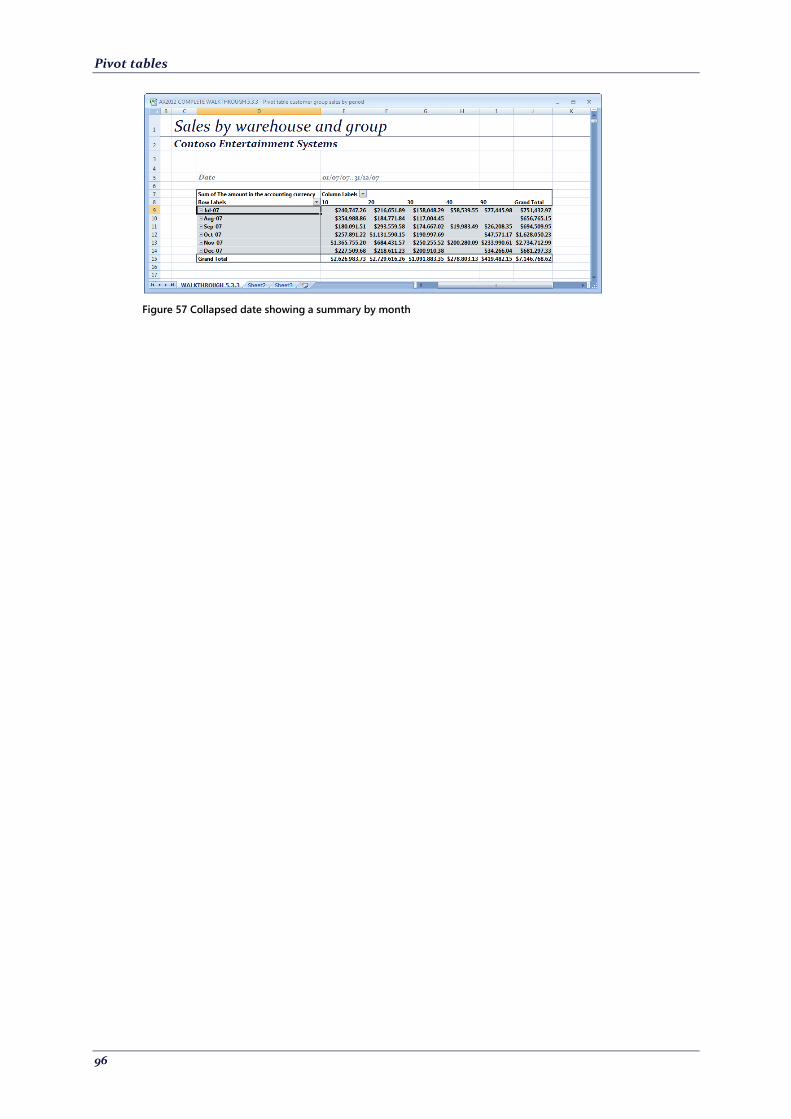
Pivot tables
96
Figure 57 Collapsed date showing a summary by month
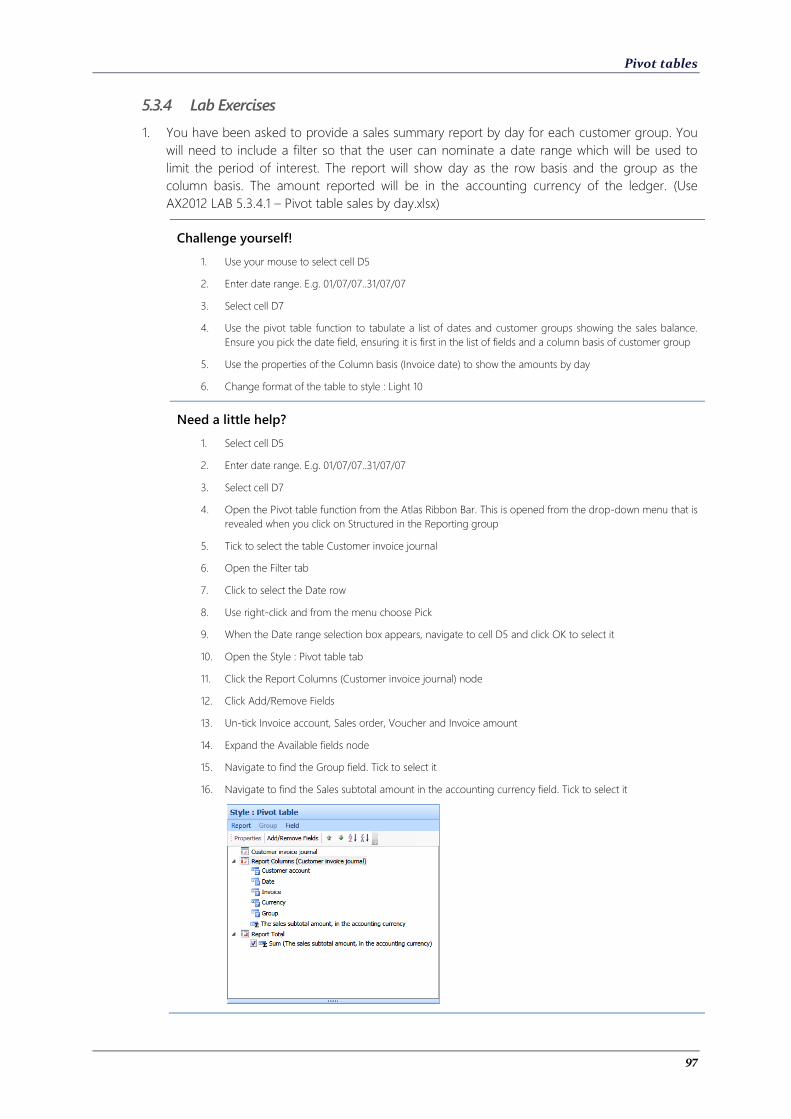
Pivot tables
97
5.3.4 Lab Exercises
1. You have been asked to provide a sales summary report by day for each customer group. You
will need to include a filter so that the user can nominate a date range which will be used to
limit the period of interest. The report will show day as the row basis and the group as the
column basis. The amount reported will be in the accounting currency of the ledger. (Use
AX2012 LAB 5.3.4.1 – Pivot table sales by day.xlsx)
Challenge yourself!
1. Use your mouse to select cell D5
2. Enter date range. E.g. 01/07/07..31/07/07
3. Select cell D7
4. Use the pivot table function to tabulate a list of dates and customer groups showing the sales balance.
Ensure you pick the date field, ensuring it is first in the list of fields and a column basis of customer group
5. Use the properties of the Column basis (Invoice date) to show the amounts by day
6. Change format of the table to style : Light 10
Need a little help?
1. Select cell D5
2. Enter date range. E.g. 01/07/07..31/07/07
3. Select cell D7
4. Open the Pivot table function from the Atlas Ribbon Bar. This is opened from the drop-down menu that is
revealed when you click on Structured in the Reporting group
5. Tick to select the table Customer invoice journal
6. Open the Filter tab
7. Click to select the Date row
8. Use right-click and from the menu choose Pick
9. When the Date range selection box appears, navigate to cell D5 and click OK to select it
10. Open the Style : Pivot table tab
11. Click the Report Columns (Customer invoice journal) node
12. Click Add/Remove Fields
13. Un-tick Invoice account, Sales order, Voucher and Invoice amount
14. Expand the Available fields node
15. Navigate to find the Group field. Tick to select it
16. Navigate to find the Sales subtotal amount in the accounting currency field. Tick to select it
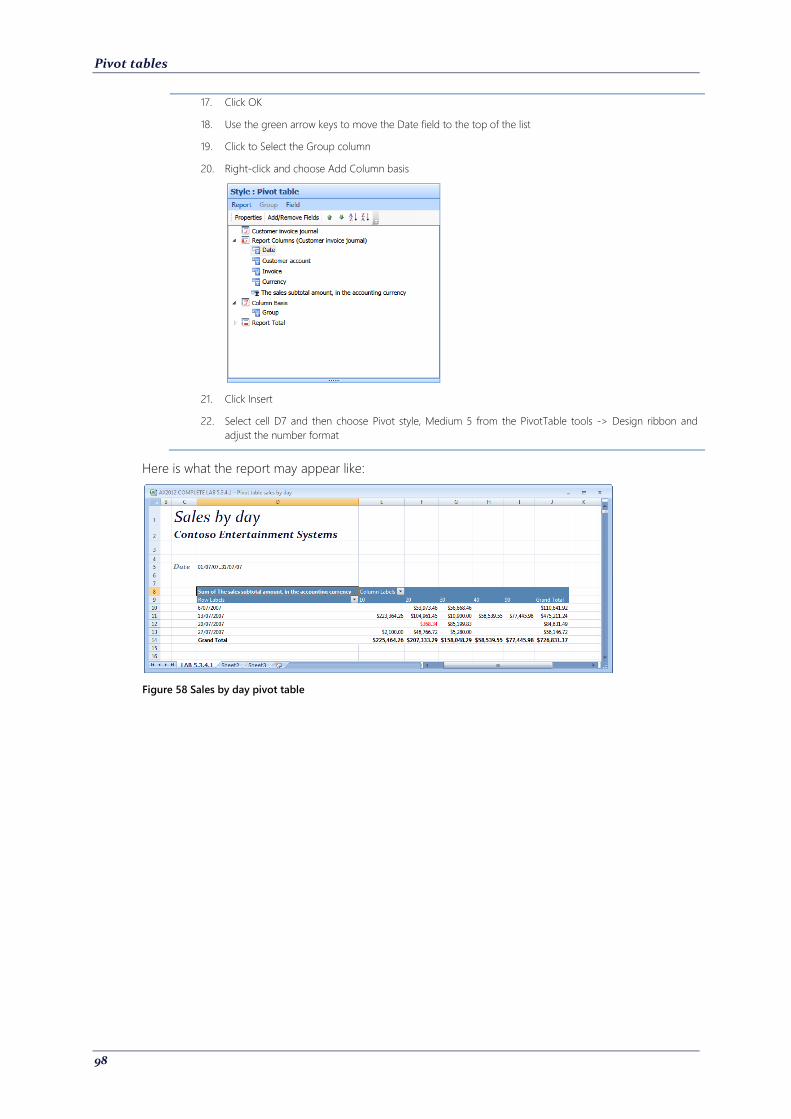
Pivot tables
98
17. Click OK
18. Use the green arrow keys to move the Date field to the top of the list
19. Click to Select the Group column
20. Right-click and choose Add Column basis
21. Click Insert
22. Select cell D7 and then choose Pivot style, Medium 5 from the PivotTable tools -> Design ribbon and
adjust the number format
Here is what the report may appear like:
Figure 58 Sales by day pivot table
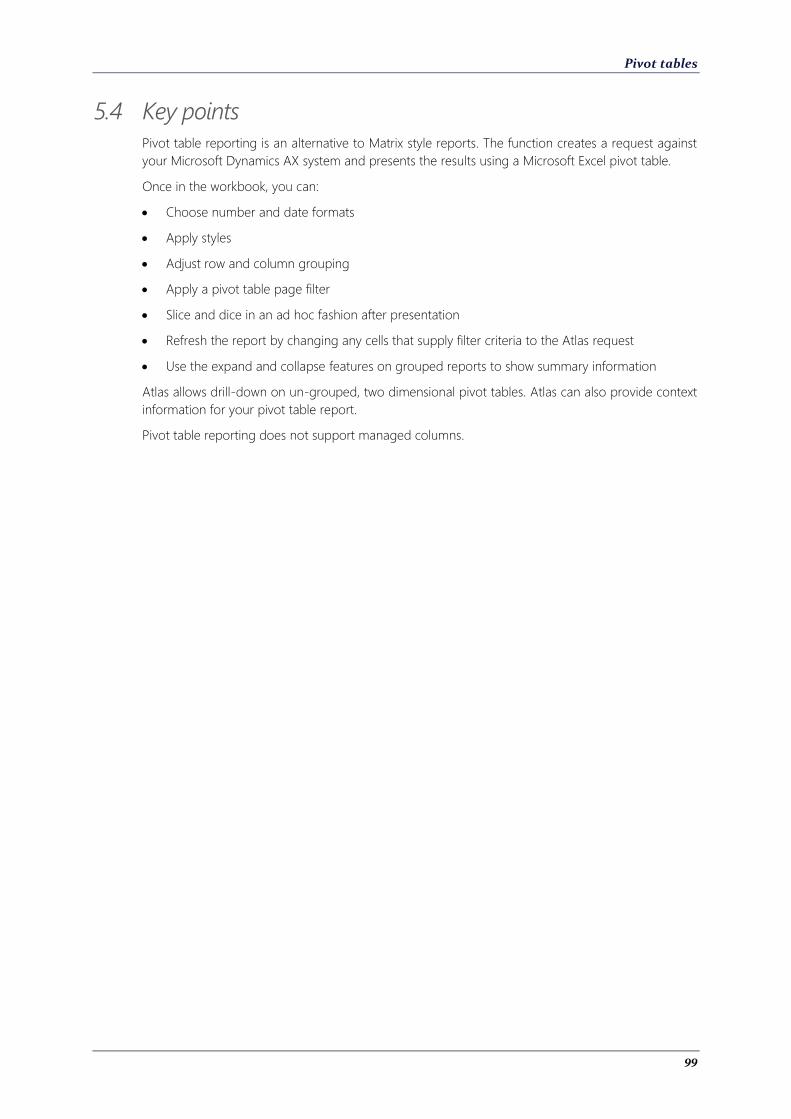
Pivot tables
99
5.4 Key points
Pivot table reporting is an alternative to Matrix style reports. The function creates a request against
your Microsoft Dynamics AX system and presents the results using a Microsoft Excel pivot table.
Once in the workbook, you can:
Choose number and date formats
Apply styles
Adjust row and column grouping
Apply a pivot table page filter
Slice and dice in an ad hoc fashion after presentation
Refresh the report by changing any cells that supply filter criteria to the Atlas request
Use the expand and collapse features on grouped reports to show summary information
Atlas allows drill-down on un-grouped, two dimensional pivot tables. Atlas can also provide context
information for your pivot table report.
Pivot table reporting does not support managed columns.
Pivot tables
100
5.5 Quick interaction
Take a moment to write down the three key points you have learned:
1.
2.
3.
101
6 Context information and drill-down
6.1 Outline
Drill-down is a cornerstone of the Atlas reporting system. There are two forms of drill-down in Atlas
5:
Drill-down and
Drill-out
The Drill-out feature is known in the Atlas reporting system as the context view or the context drill-
out. Unlike drill-down, it can report on any data source and not just the data source used in the
host report. There can be up to 5 context drill-out reports associated with the host Atlas report and
these are shown in the Context task pane.
Drill-down includes transactions from the host data source. You can adjust this behavior by
assigning an Atlas report definition in the context information tab. This overrides the default
behavior and the linked report is run in its place.
Drill-down can be extended to include field level drill-down. Typical examples include drill-down to
Voucher or Drill-down to invoice lines. These drill-downs are again based on other Atlas reports
that link to a field’s extended data type.
6.2 Objectives
At the end of this chapter, you will be able to:
Understand what is meant by a Context drill-out
Understand how to construct report that can be used in context mode
Understand how to link the host Atlas report to the context drill-out reports
Understand alternative drill-down and how to override the default drill-down behaviour
Understand how to include field based reports to extend the standard drill-down
Understand how to edit reports that use these functions
Context information and drill-down
102
6.3 Context drill-out
6.3.1 Outline
Context drill-out is a means by which you can enrich your Atlas reporting object with additional,
related information, in the form of other Atlas reports. Instead of these reports being presented in
your Office document, they are displayed in a special task pane known as the Context pane. Each
reporting object in your workbook or Office document can have up to five associated Context drill-
out reports. They can be directly associated with the host Atlas reporting object or un-related.
For example, if you have a report that shows the sales for a customer in a given period, you might
associate a context drill-out that shows this figure broken down by product purchased.
Context drill-out is only available in Context mode; controlled by a setting on the Atlas ribbon bar.
6.3.2 Uses
Use the context drill-out:
When you want to enhance the report by putting the figures shown, into context of other,
relevant items of information
When you want to provide different views of the same result-set but not within the document
When you want to provide additional lookup features, like a list of customers on a customer
group report
When you want to include sub-module figures without embedding that into the document
When you want to have on-demand reports for an in-document Atlas report
When you want to see a particular type of drill-down for a reporting object. For example, for
this Balance function I always want to know how that balance is made up in terms of a summary
of transaction type
Whenever in-line break-out is requested, then context drill-out is the solution in Atlas.
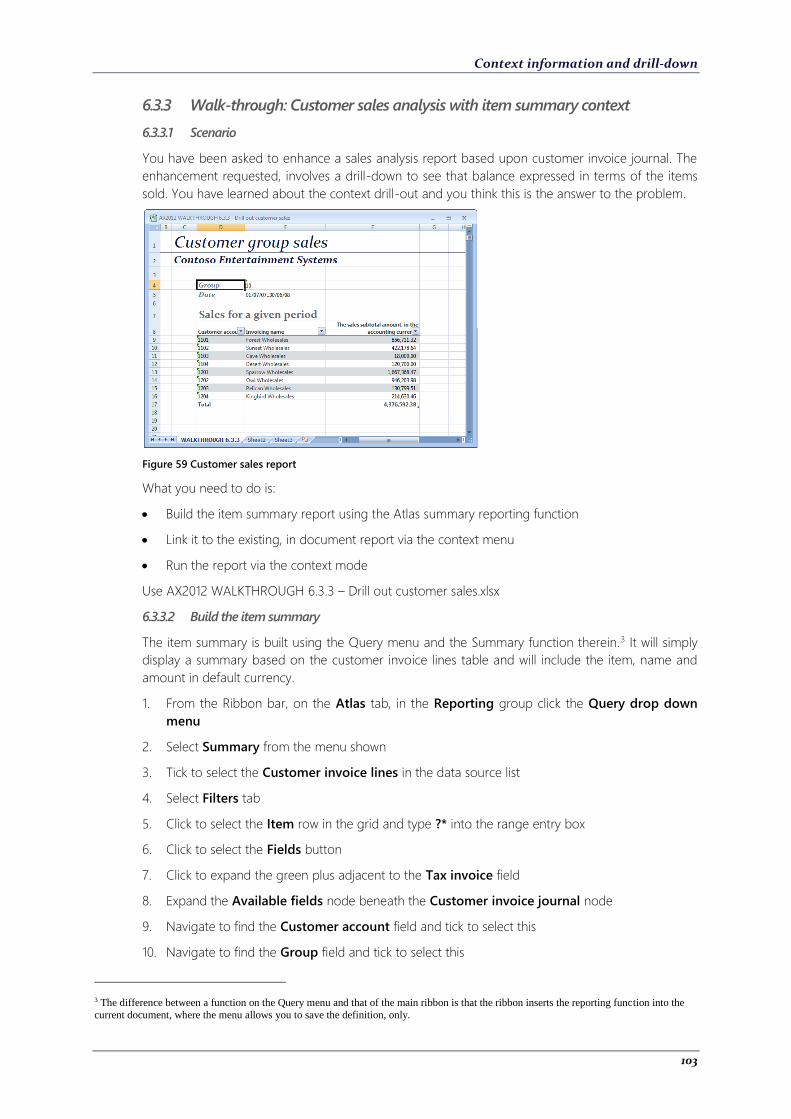
Context information and drill-down
103
6.3.3 Walk-through: Customer sales analysis with item summary context
6.3.3.1 Scenario
You have been asked to enhance a sales analysis report based upon customer invoice journal. The
enhancement requested, involves a drill-down to see that balance expressed in terms of the items
sold. You have learned about the context drill-out and you think this is the answer to the problem.
Figure 59 Customer sales report
What you need to do is:
Build the item summary report using the Atlas summary reporting function
Link it to the existing, in document report via the context menu
Run the report via the context mode
Use AX2012 WALKTHROUGH 6.3.3 – Drill out customer sales.xlsx
6.3.3.2 Build the item summary
The item summary is built using the Query menu and the Summary function therein.3 It will simply
display a summary based on the customer invoice lines table and will include the item, name and
amount in default currency.
1. From the Ribbon bar, on the Atlas tab, in the Reporting group click the Query drop down
menu
2. Select Summary from the menu shown
3. Tick to select the Customer invoice lines in the data source list
4. Select Filters tab
5. Click to select the Item row in the grid and type ?* into the range entry box
6. Click to select the Fields button
7. Click to expand the green plus adjacent to the Tax invoice field
8. Expand the Available fields node beneath the Customer invoice journal node
9. Navigate to find the Customer account field and tick to select this
10. Navigate to find the Group field and tick to select this
3 The difference between a function on the Query menu and that of the main ribbon is that the ribbon inserts the reporting function into the
current document, where the menu allows you to save the definition, only.
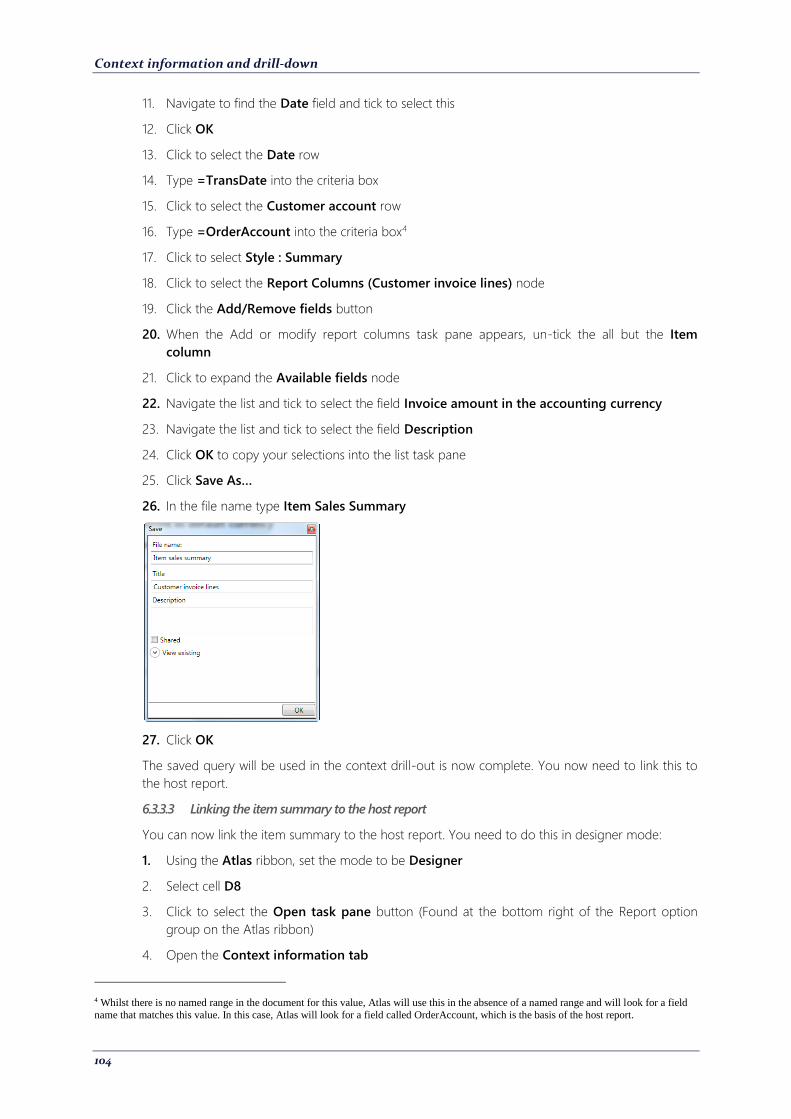
Context information and drill-down
104
11. Navigate to find the Date field and tick to select this
12. Click OK
13. Click to select the Date row
14. Type =TransDate into the criteria box
15. Click to select the Customer account row
16. Type =OrderAccount into the criteria box4
17. Click to select Style : Summary
18. Click to select the Report Columns (Customer invoice lines) node
19. Click the Add/Remove fields button
20. When the Add or modify report columns task pane appears, un-tick the all but the Item
column
21. Click to expand the Available fields node
22. Navigate the list and tick to select the field Invoice amount in the accounting currency
23. Navigate the list and tick to select the field Description
24. Click OK to copy your selections into the list task pane
25. Click Save As…
26. In the file name type Item Sales Summary
27. Click OK
The saved query will be used in the context drill-out is now complete. You now need to link this to
the host report.
6.3.3.3 Linking the item summary to the host report
You can now link the item summary to the host report. You need to do this in designer mode:
1. Using the Atlas ribbon, set the mode to be Designer
2. Select cell D8
3. Click to select the Open task pane button (Found at the bottom right of the Report option
group on the Atlas ribbon)
4. Open the Context information tab
4 Whilst there is no named range in the document for this value, Atlas will use this in the absence of a named range and will look for a field
name that matches this value. In this case, Atlas will look for a field called OrderAccount, which is the basis of the host report.
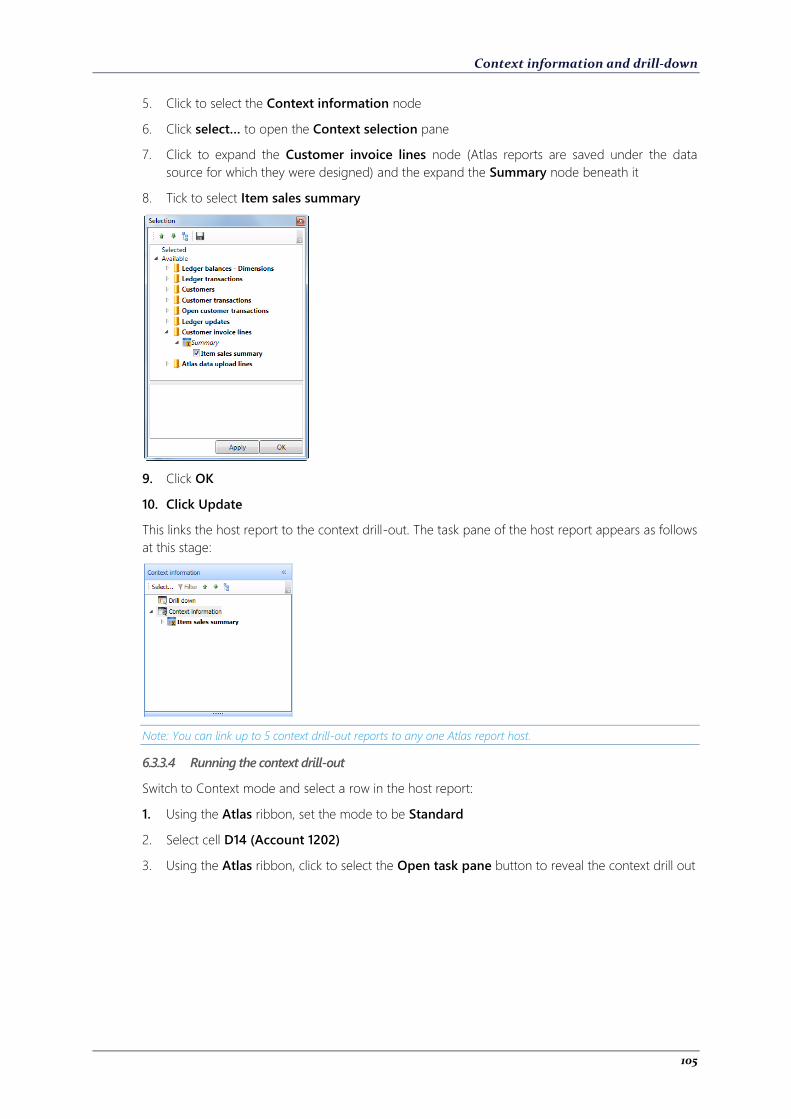
Context information and drill-down
105
5. Click to select the Context information node
6. Click select… to open the Context selection pane
7. Click to expand the Customer invoice lines node (Atlas reports are saved under the data
source for which they were designed) and the expand the Summary node beneath it
8. Tick to select Item sales summary
9. Click OK
10. Click Update
This links the host report to the context drill-out. The task pane of the host report appears as follows
at this stage:
Note: You can link up to 5 context drill-out reports to any one Atlas report host.
6.3.3.4 Running the context drill-out
Switch to Context mode and select a row in the host report:
1. Using the Atlas ribbon, set the mode to be Standard
2. Select cell D14 (Account 1202)
3. Using the Atlas ribbon, click to select the Open task pane button to reveal the context drill out
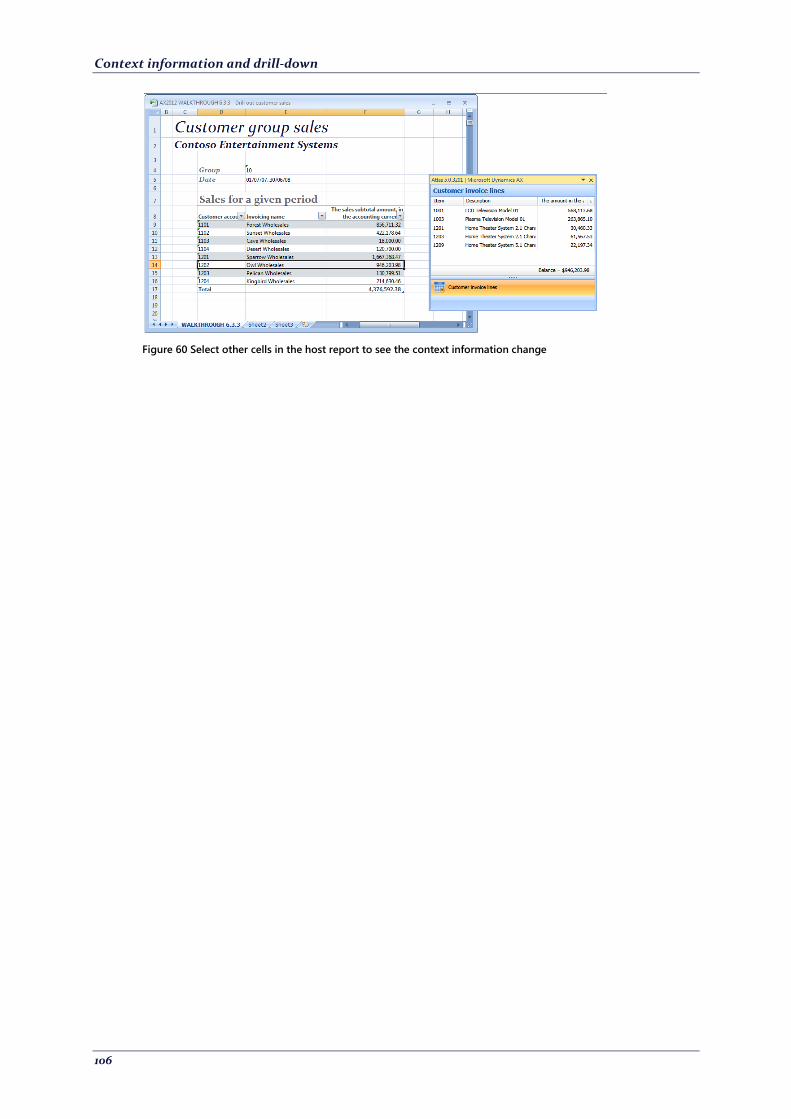
Context information and drill-down
106
Figure 60 Select other cells in the host report to see the context information change
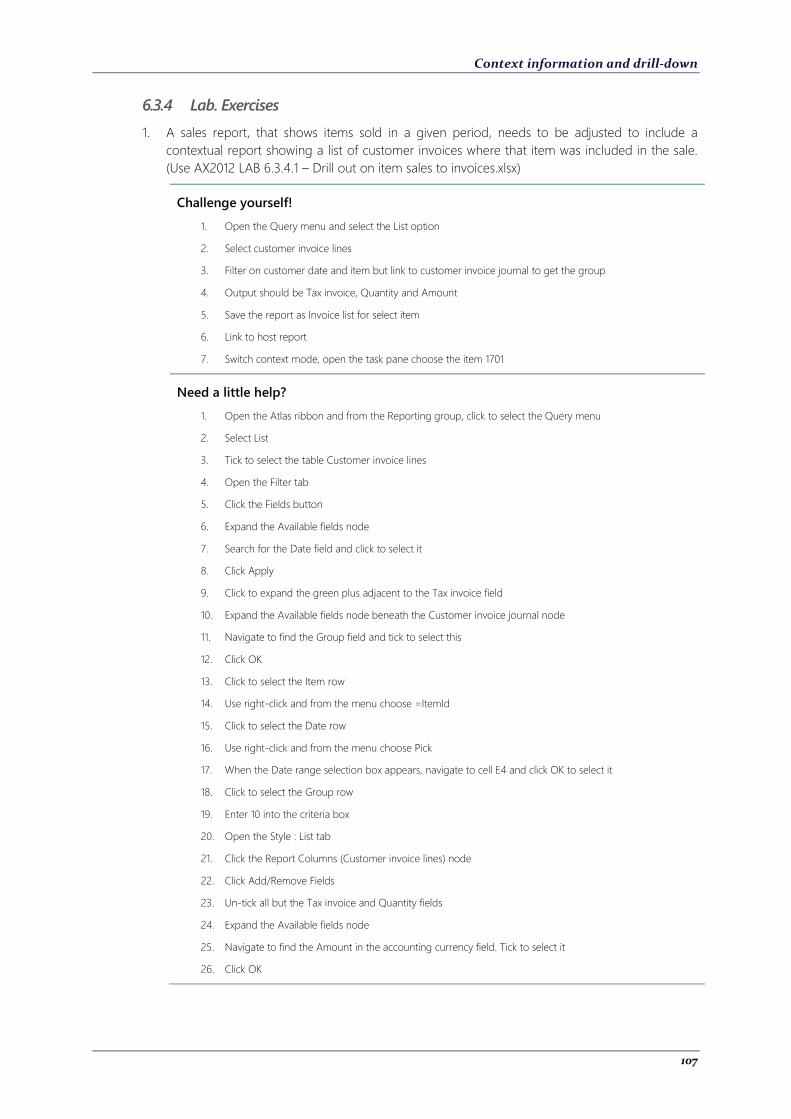
Context information and drill-down
107
6.3.4 Lab. Exercises
1. A sales report, that shows items sold in a given period, needs to be adjusted to include a
contextual report showing a list of customer invoices where that item was included in the sale.
(Use AX2012 LAB 6.3.4.1 – Drill out on item sales to invoices.xlsx)
Challenge yourself!
1. Open the Query menu and select the List option
2. Select customer invoice lines
3. Filter on customer date and item but link to customer invoice journal to get the group
4. Output should be Tax invoice, Quantity and Amount
5. Save the report as Invoice list for select item
6. Link to host report
7. Switch context mode, open the task pane choose the item 1701
Need a little help?
1. Open the Atlas ribbon and from the Reporting group, click to select the Query menu
2. Select List
3. Tick to select the table Customer invoice lines
4. Open the Filter tab
5. Click the Fields button
6. Expand the Available fields node
7. Search for the Date field and click to select it
8. Click Apply
9. Click to expand the green plus adjacent to the Tax invoice field
10. Expand the Available fields node beneath the Customer invoice journal node
11. Navigate to find the Group field and tick to select this
12. Click OK
13. Click to select the Item row
14. Use right-click and from the menu choose =ItemId
15. Click to select the Date row
16. Use right-click and from the menu choose Pick
17. When the Date range selection box appears, navigate to cell E4 and click OK to select it
18. Click to select the Group row
19. Enter 10 into the criteria box
20. Open the Style : List tab
21. Click the Report Columns (Customer invoice lines) node
22. Click Add/Remove Fields
23. Un-tick all but the Tax invoice and Quantity fields
24. Expand the Available fields node
25. Navigate to find the Amount in the accounting currency field. Tick to select it
26. Click OK

Context information and drill-down
108
27. Click Save As…
28. In the file name type Invoice list for select item
29. Click OK
30. Select cell D8
31. Ensure that the mode is Designer. Switch this from the Atlas ribbon
32. If not already visible, open the task pane to edit the host report
33. Open the Context information tab
34. Click the Select… button
35. Click to select the Context information node
36. Click select… to open the Context selection pane
37. Click to expand the Customer invoice lines node (Atlas reports are saved under the data source for which
they were designed) and the expand the List node beneath it
38. Tick to select Invoice for select item
39. Click OK
40. Click Update
41. Switch to Context mode
42. Select cell D18 (1701) and open the context task pane if not open already
Here is what the report may appear like:
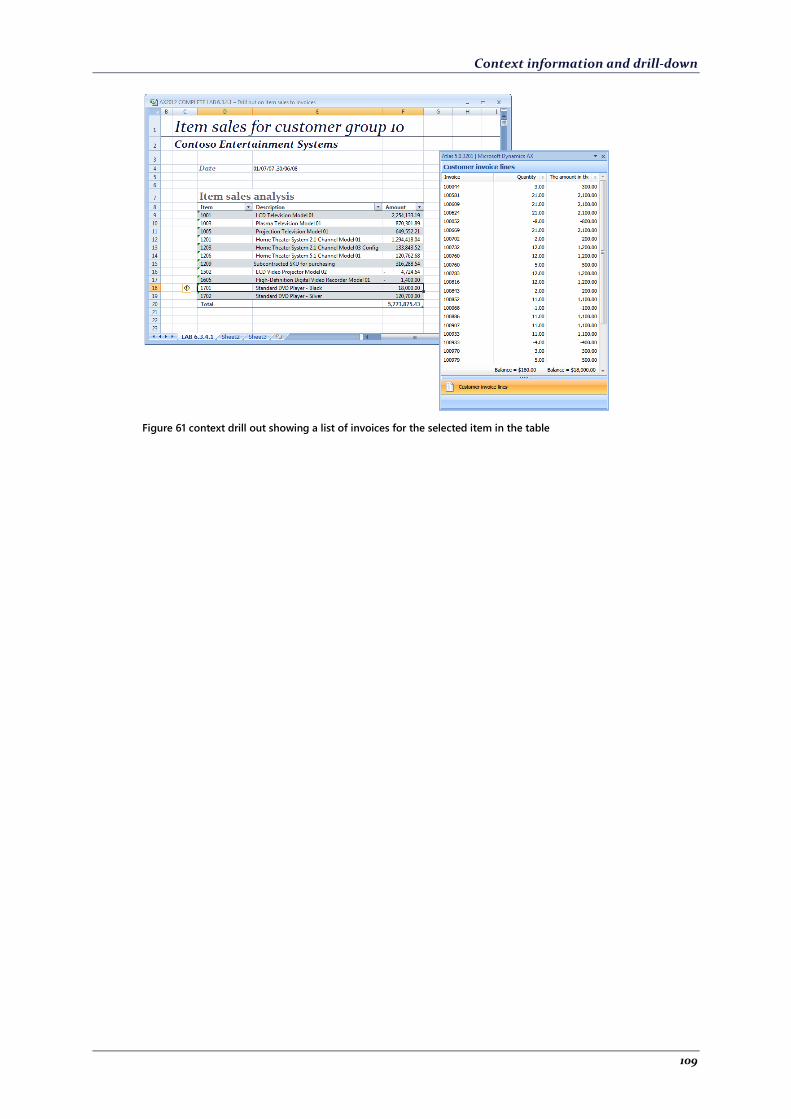
Context information and drill-down
109
Figure 61 context drill out showing a list of invoices for the selected item in the table
Context information and drill-down
110
6.4 Alternative drill-paths
6.4.1 Outline
List reporting functions do not, by default, provide a drill-down feature. That is because they are at
the record level when they are presented. There are occasions when you might want to modify this
default behavior. You can use this feature to make this modification.
On each Atlas reporting object, you can nominate an alternative drill-down path, expressed in the
same way as the Context drill-out feature. That is, you can include a saved Atlas query to run in the
place of the standard drill-down.
When you click to select the drill-down button from the Atlas ribbon, the linked saved query is run
in place of the standard drill-down request.
You should note that this is an extension of the default template feature, discussed in chapter 2. Use
this to override the default set in the data source designer.
6.4.2 Uses
Use this feature in the following circumstances:
When you want to override the default drill-down behavior
When you want to add a drill-down function to List reports
When you are reporting from summarized tables and want to include the transaction level
records for the same filter expression
When you want to provide a specific drill-down report for a particular atlas report. For example
you might want a present a summary report as the drill-down for a host report
When you do not want to use the default template described in the data source list
Context information and drill-down
111
6.4.3 Walk-through: Invoice lines
6.4.3.1 Scenario
Some of your users have complained that a report that shows a list of customer invoices for a date
range does not provide a drill-down function. Whilst the report is functional, they need to see the
invoice lines in the form of a drill-down for the report. Since the invoice lines are held in another
table, you need to use the alternative drill down feature. To adjust this report you will:
Build the list of invoice lines using the Atlas List reporting function
Link it to the existing, in document report via the context menu
Run the drill-down via the context mode
Use AX2012 WALKTHROUGH 6.4.3 – Alternate drill down customer sales.xlsx
6.4.3.2 Build the item summary
The list of invoice lines is built using the Query menu and the List function therein.5 The list report
will show each line item on the invoice and will include the item, description, quantity, and amount
in default currency.
1. From the Ribbon bar, on the Atlas tab, in the Reporting group click the Query drop down
menu
2. Select List from the menu shown
3. Tick to select the Customer invoice lines in the data source list
4. Select Filters tab
5. Click to select the Tax invoice row
6. Right-click and select =InvoiceId into the criteria box
7. Open Style : List tab
8. Click to select the Report Columns (Customer invoice lines) node
9. Click the Add/Remove fields button
10. When the Add or modify report columns task pane appears, un-tick the all but the Item and
Quantity columns
11. Click to expand the Available fields node
12. Navigate the list and tick to select the field Invoice amount in the accounting currency
13. Navigate the list and tick to select the field Description
14. Click OK to copy your selections into the list task pane
15. Click Save As…
16. In the file name type Invoice line drill-down
17. Click OK
This is the drill-down basis. You now need to link this to the host report.
6.4.3.3 Linking the item summary to the host report
Link the drill-down to the host report as follows:
5 The difference between a function on the Query menu and that of the main ribbon is that the ribbon inserts the reporting function into the
current document, where the menu allows you to save the definition, only.
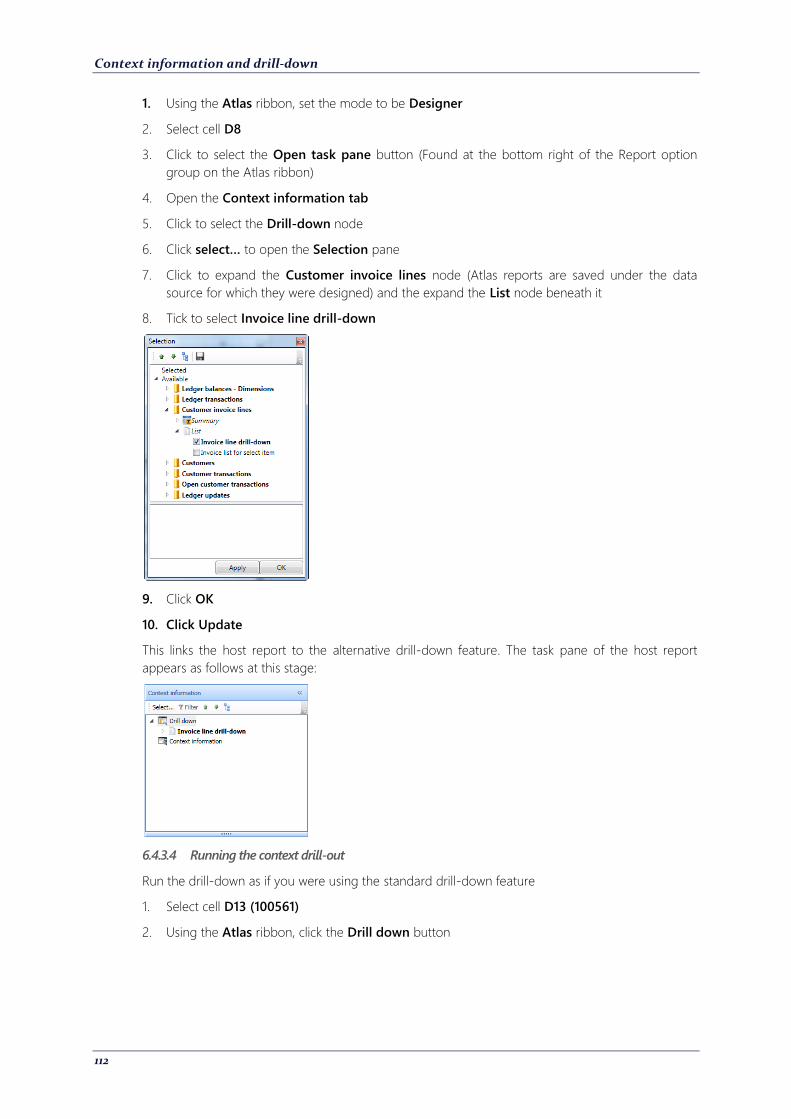
Context information and drill-down
112
1. Using the Atlas ribbon, set the mode to be Designer
2. Select cell D8
3. Click to select the Open task pane button (Found at the bottom right of the Report option
group on the Atlas ribbon)
4. Open the Context information tab
5. Click to select the Drill-down node
6. Click select… to open the Selection pane
7. Click to expand the Customer invoice lines node (Atlas reports are saved under the data
source for which they were designed) and the expand the List node beneath it
8. Tick to select Invoice line drill-down
9. Click OK
10. Click Update
This links the host report to the alternative drill-down feature. The task pane of the host report
appears as follows at this stage:
6.4.3.4 Running the context drill-out
Run the drill-down as if you were using the standard drill-down feature
1. Select cell D13 (100561)
2. Using the Atlas ribbon, click the Drill down button

Context information and drill-down
113
Figure 62 Alternative drill down
Context information and drill-down
114
6.5 Extended drill-down
6.5.1 Outline
The standard drill-down feature shows transactions from the data source of the host Atlas report or
from an Alternative drill-down source. By linking Atlas reports to fields, you can extend the drill-
down to show other drill-downs based on the fields in the window. For example, you can drill-down
to voucher from a selected transaction which includes the voucher column.
The new drill-down is presented in the same form as the original drill-down but with an additional
tab for each field that has an associated extended drill-down.
6.5.2 Uses
Use this feature to enrich the standard drill-down with additional, field based inquiries.
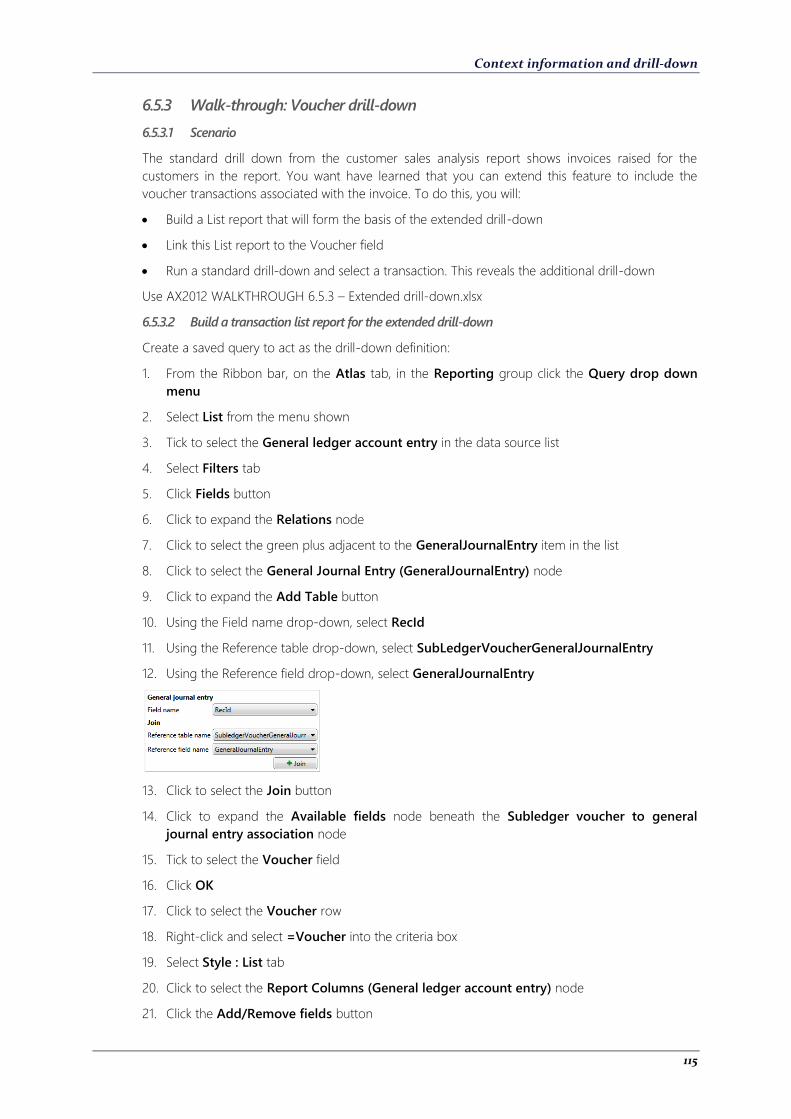
Context information and drill-down
115
6.5.3 Walk-through: Voucher drill-down
6.5.3.1 Scenario
The standard drill down from the customer sales analysis report shows invoices raised for the
customers in the report. You want have learned that you can extend this feature to include the
voucher transactions associated with the invoice. To do this, you will:
Build a List report that will form the basis of the extended drill-down
Link this List report to the Voucher field
Run a standard drill-down and select a transaction. This reveals the additional drill-down
Use AX2012 WALKTHROUGH 6.5.3 – Extended drill-down.xlsx
6.5.3.2 Build a transaction list report for the extended drill-down
Create a saved query to act as the drill-down definition:
1. From the Ribbon bar, on the Atlas tab, in the Reporting group click the Query drop down
menu
2. Select List from the menu shown
3. Tick to select the General ledger account entry in the data source list
4. Select Filters tab
5. Click Fields button
6. Click to expand the Relations node
7. Click to select the green plus adjacent to the GeneralJournalEntry item in the list
8. Click to select the General Journal Entry (GeneralJournalEntry) node
9. Click to expand the Add Table button
10. Using the Field name drop-down, select RecId
11. Using the Reference table drop-down, select SubLedgerVoucherGeneralJournalEntry
12. Using the Reference field drop-down, select GeneralJournalEntry
13. Click to select the Join button
14. Click to expand the Available fields node beneath the Subledger voucher to general
journal entry association node
15. Tick to select the Voucher field
16. Click OK
17. Click to select the Voucher row
18. Right-click and select =Voucher into the criteria box
19. Select Style : List tab
20. Click to select the Report Columns (General ledger account entry) node
21. Click the Add/Remove fields button
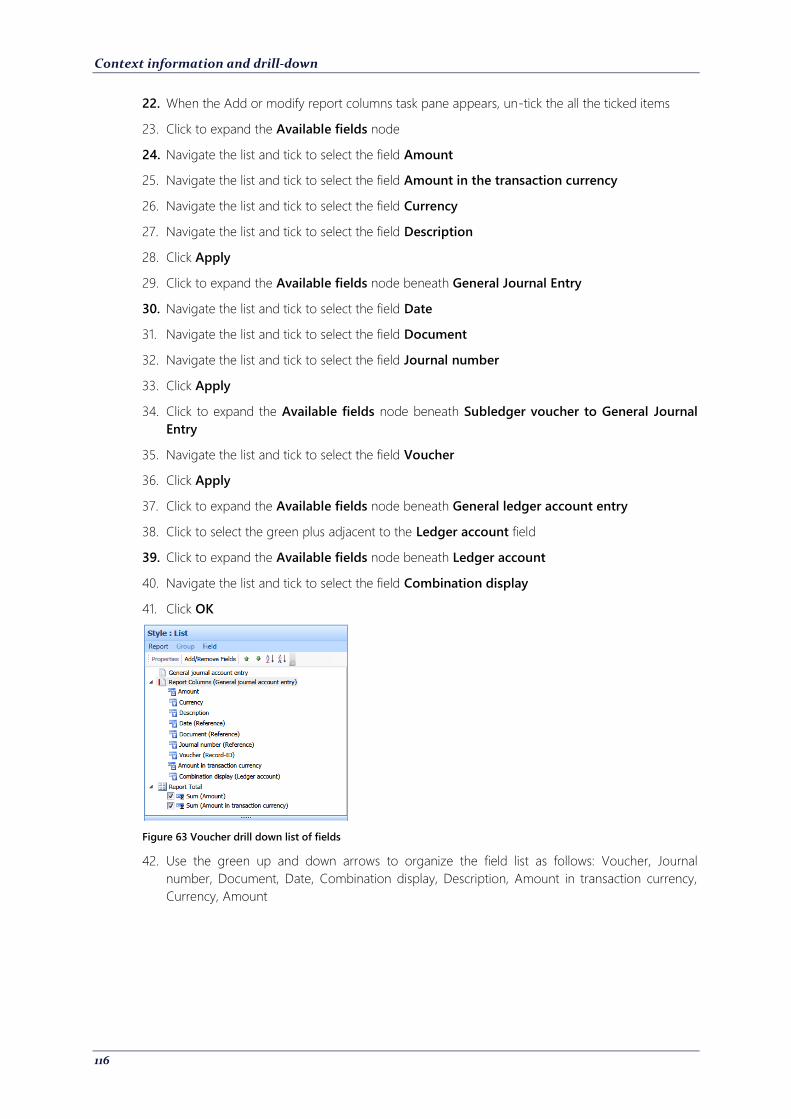
Context information and drill-down
116
22. When the Add or modify report columns task pane appears, un-tick the all the ticked items
23. Click to expand the Available fields node
24. Navigate the list and tick to select the field Amount
25. Navigate the list and tick to select the field Amount in the transaction currency
26. Navigate the list and tick to select the field Currency
27. Navigate the list and tick to select the field Description
28. Click Apply
29. Click to expand the Available fields node beneath General Journal Entry
30. Navigate the list and tick to select the field Date
31. Navigate the list and tick to select the field Document
32. Navigate the list and tick to select the field Journal number
33. Click Apply
34. Click to expand the Available fields node beneath Subledger voucher to General Journal
Entry
35. Navigate the list and tick to select the field Voucher
36. Click Apply
37. Click to expand the Available fields node beneath General ledger account entry
38. Click to select the green plus adjacent to the Ledger account field
39. Click to expand the Available fields node beneath Ledger account
40. Navigate the list and tick to select the field Combination display
41. Click OK
Figure 63 Voucher drill down list of fields
42. Use the green up and down arrows to organize the field list as follows: Voucher, Journal
number, Document, Date, Combination display, Description, Amount in transaction currency,
Currency, Amount
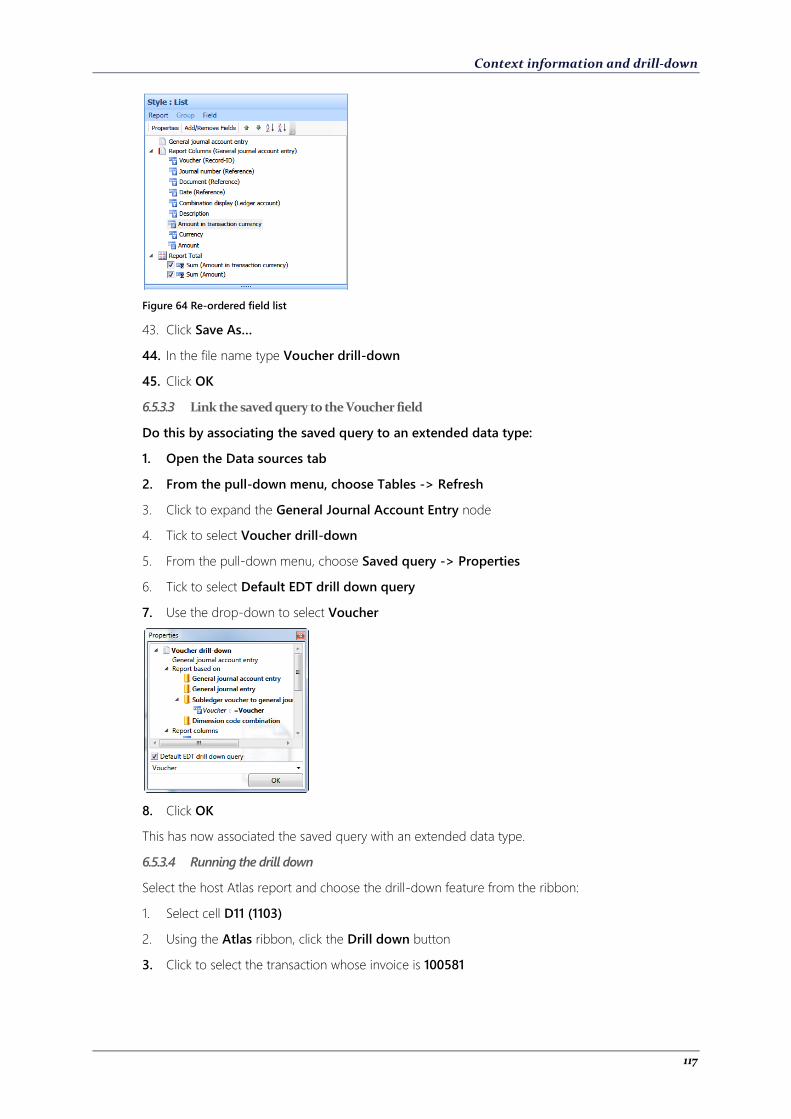
Context information and drill-down
117
Figure 64 Re-ordered field list
43. Click Save As…
44. In the file name type Voucher drill-down
45. Click OK
6.5.3.3 Link the saved query to the Voucher field
Do this by associating the saved query to an extended data type:
1. Open the Data sources tab
2. From the pull-down menu, choose Tables -> Refresh
3. Click to expand the General Journal Account Entry node
4. Tick to select Voucher drill-down
5. From the pull-down menu, choose Saved query -> Properties
6. Tick to select Default EDT drill down query
7. Use the drop-down to select Voucher
8. Click OK
This has now associated the saved query with an extended data type.
6.5.3.4 Running the drill down
Select the host Atlas report and choose the drill-down feature from the ribbon:
1. Select cell D11 (1103)
2. Using the Atlas ribbon, click the Drill down button
3. Click to select the transaction whose invoice is 100581

Context information and drill-down
118
Figure 65 Note the Voucher tab for the selected row
4. Click the voucher tab SIV-100581
Figure 66 Voucher drill down
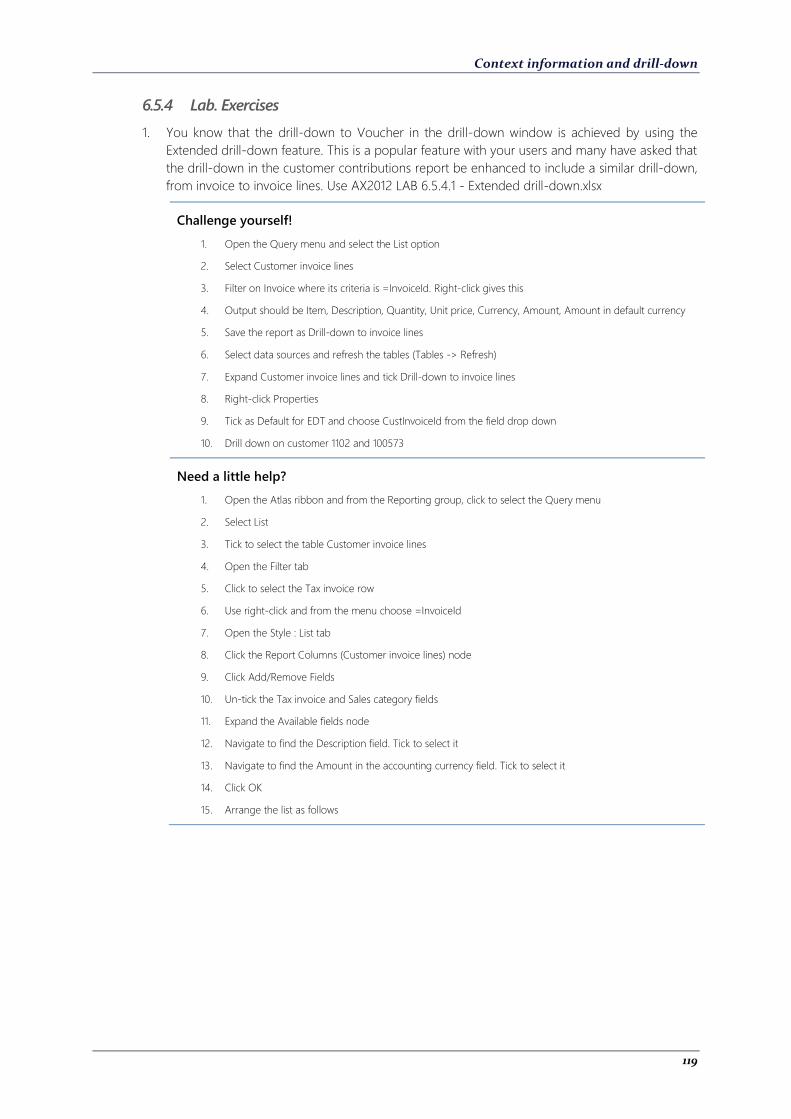
Context information and drill-down
119
6.5.4 Lab. Exercises
1. You know that the drill-down to Voucher in the drill-down window is achieved by using the
Extended drill-down feature. This is a popular feature with your users and many have asked that
the drill-down in the customer contributions report be enhanced to include a similar drill-down,
from invoice to invoice lines. Use AX2012 LAB 6.5.4.1 - Extended drill-down.xlsx
Challenge yourself!
1. Open the Query menu and select the List option
2. Select Customer invoice lines
3. Filter on Invoice where its criteria is =InvoiceId. Right-click gives this
4. Output should be Item, Description, Quantity, Unit price, Currency, Amount, Amount in default currency
5. Save the report as Drill-down to invoice lines
6. Select data sources and refresh the tables (Tables -> Refresh)
7. Expand Customer invoice lines and tick Drill-down to invoice lines
8. Right-click Properties
9. Tick as Default for EDT and choose CustInvoiceId from the field drop down
10. Drill down on customer 1102 and 100573
Need a little help?
1. Open the Atlas ribbon and from the Reporting group, click to select the Query menu
2. Select List
3. Tick to select the table Customer invoice lines
4. Open the Filter tab
5. Click to select the Tax invoice row
6. Use right-click and from the menu choose =InvoiceId
7. Open the Style : List tab
8. Click the Report Columns (Customer invoice lines) node
9. Click Add/Remove Fields
10. Un-tick the Tax invoice and Sales category fields
11. Expand the Available fields node
12. Navigate to find the Description field. Tick to select it
13. Navigate to find the Amount in the accounting currency field. Tick to select it
14. Click OK
15. Arrange the list as follows
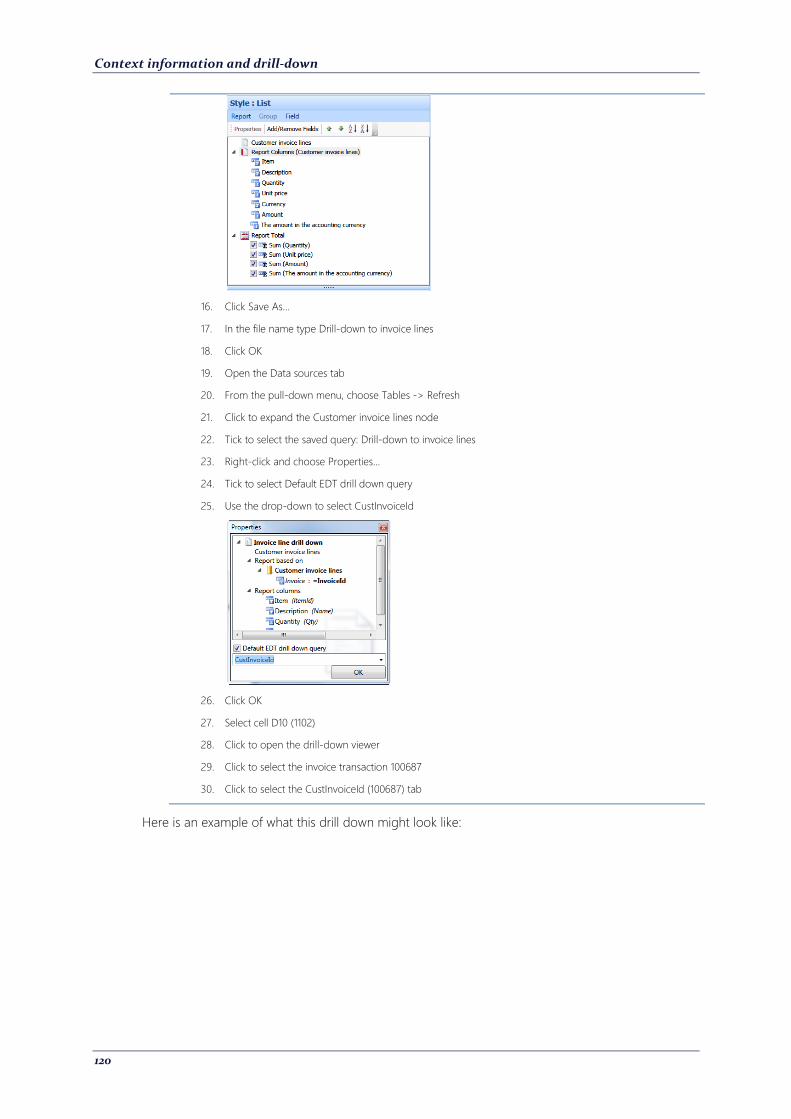
Context information and drill-down
120
16. Click Save As…
17. In the file name type Drill-down to invoice lines
18. Click OK
19. Open the Data sources tab
20. From the pull-down menu, choose Tables -> Refresh
21. Click to expand the Customer invoice lines node
22. Tick to select the saved query: Drill-down to invoice lines
23. Right-click and choose Properties…
24. Tick to select Default EDT drill down query
25. Use the drop-down to select CustInvoiceId
26. Click OK
27. Select cell D10 (1102)
28. Click to open the drill-down viewer
29. Click to select the invoice transaction 100687
30. Click to select the CustInvoiceId (100687) tab
Here is an example of what this drill down might look like:
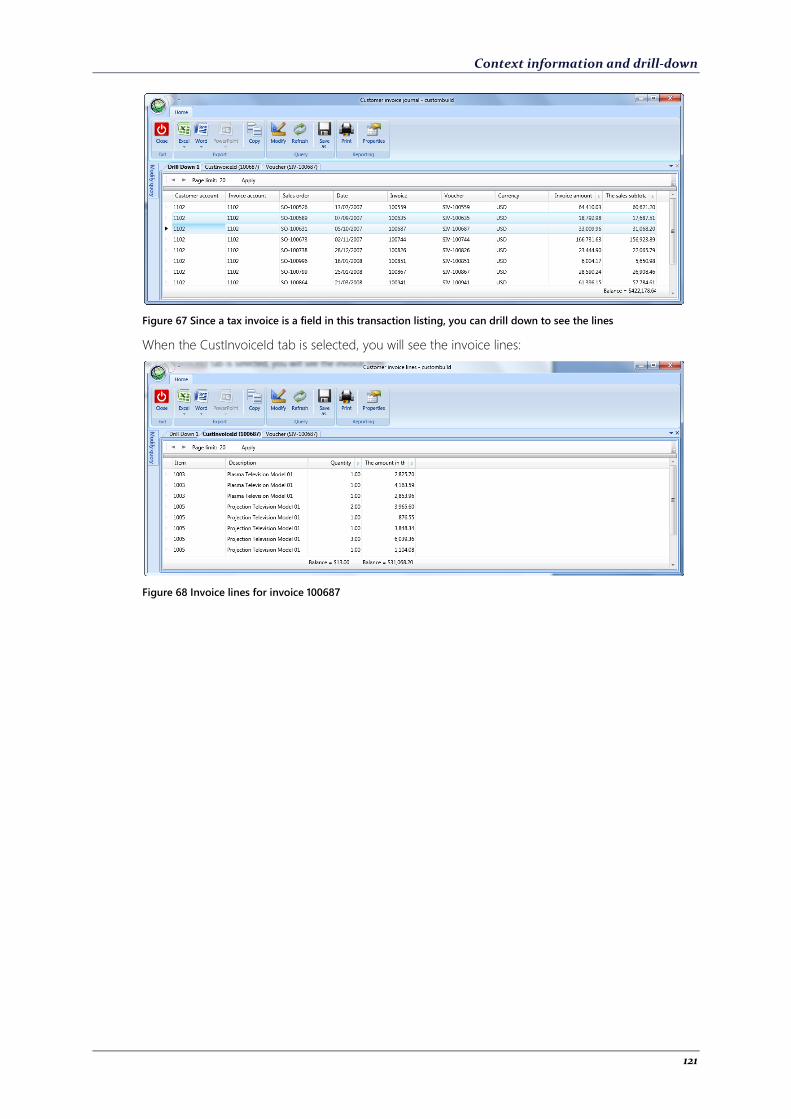
Context information and drill-down
121
Figure 67 Since a tax invoice is a field in this transaction listing, you can drill down to see the lines
When the CustInvoiceId tab is selected, you will see the invoice lines:
Figure 68 Invoice lines for invoice 100687
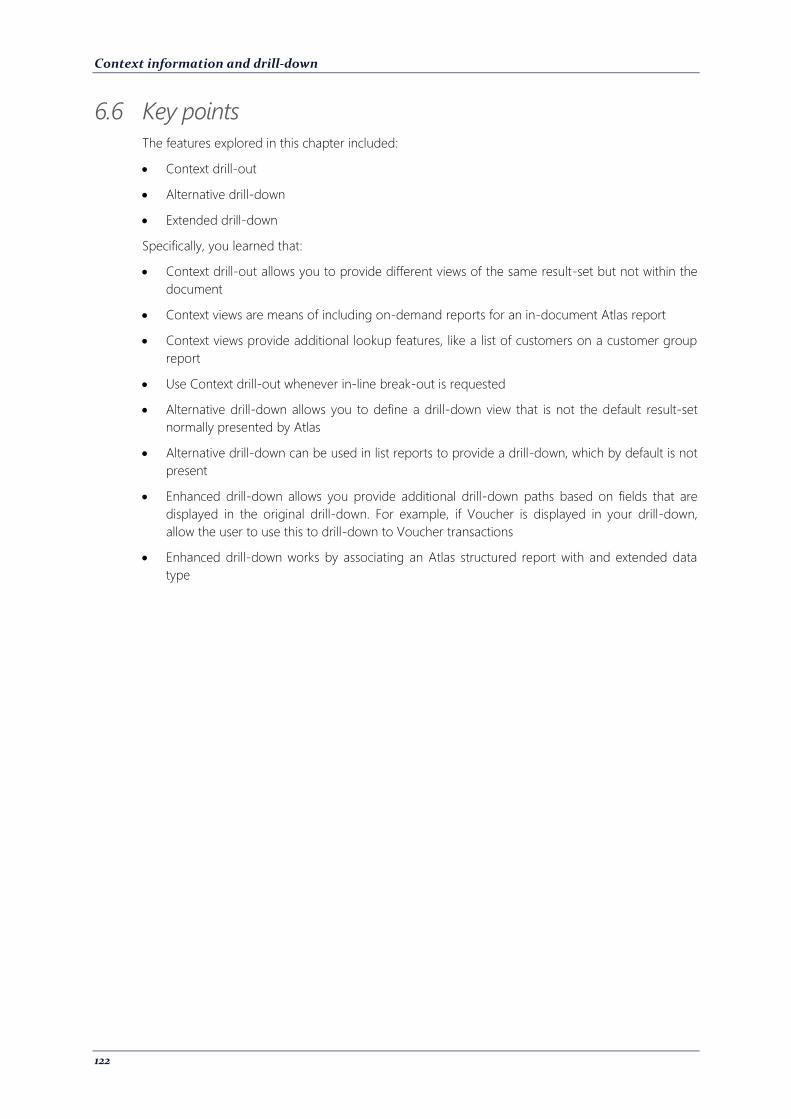
Context information and drill-down
122
6.6 Key points
The features explored in this chapter included:
Context drill-out
Alternative drill-down
Extended drill-down
Specifically, you learned that:
Context drill-out allows you to provide different views of the same result-set but not within the
document
Context views are means of including on-demand reports for an in-document Atlas report
Context views provide additional lookup features, like a list of customers on a customer group
report
Use Context drill-out whenever in-line break-out is requested
Alternative drill-down allows you to define a drill-down view that is not the default result-set
normally presented by Atlas
Alternative drill-down can be used in list reports to provide a drill-down, which by default is not
present
Enhanced drill-down allows you provide additional drill-down paths based on fields that are
displayed in the original drill-down. For example, if Voucher is displayed in your drill-down,
allow the user to use this to drill-down to Voucher transactions
Enhanced drill-down works by associating an Atlas structured report with and extended data
type
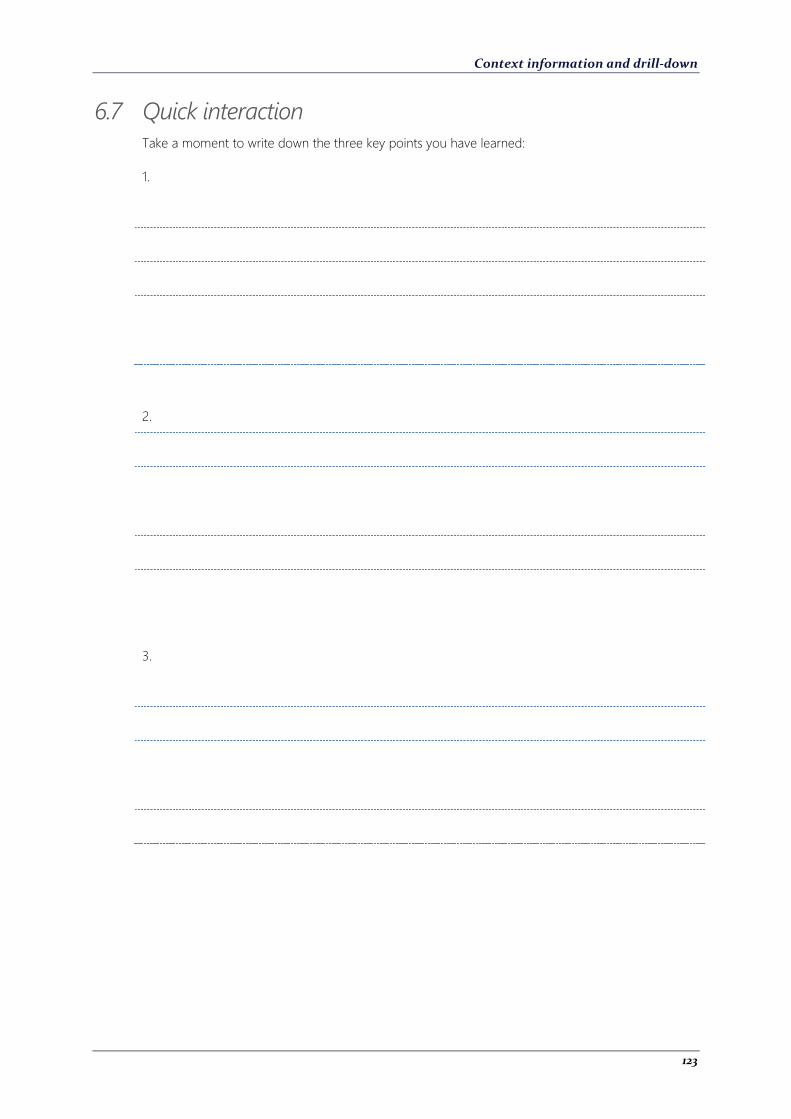
Context information and drill-down
123
6.7 Quick interaction
Take a moment to write down the three key points you have learned:
1.
2.
3.
Context information and drill-down
124
COPYRIGHT NOTICE
Copyright © 2012, Globe Software Pty Ltd, All rights reserved.
TRADEMARKS
Dynamics AX, IntelliMorph, and X++ have been registered as or are under registration as
trademarks of Microsoft Corporation.
Microsoft Office System 2007, Windows 2003 and Windows 2008 are registered trademarks of
Microsoft Corporation.
SOFTWARE RELEASE
This documentation accompanies Atlas version 5.0.3200 or higher and which is suitable for
Microsoft Dynamics AX V4.0 SP2 and Dynamics AX 2012 SP1 or higher and Microsoft Office 2007 or
higher.
PUBLICATION DATE
31/01/2012
READER COMMENTS
Any comments or suggestions regarding this publication are welcomed and should be addressed to
the attention of:
Context information and drill-down
125
Recommended