
Adm02: Be a Domino Detective: Tackling
Your Toughest Performance Issues
Kim Greene
Kim Greene Consulting, Inc.

Copyright Kim Greene Consulting, Inc. All rights reserved worldwide.
@iSeriesDomino http://www.kimgreene.com
Kim Greene - Introduction• Owner of Kim Greene Consulting, Inc.
• 15+ years experience with Domino and
Sametime and 20+ years of experience with
IBM i (AS/400, iSeries)
• Services include System & Application
performance optimization, Administration,
upgrades, health, performance, security etc.
checks, migrations, custom development,
enterprise integration
• IBM Champion
• Blog: www.dominodiva.com

Agenda
Copyright Kim Greene Consulting, Inc. All rights reserved worldwide.
• Identifying the problem
• Resources – what to look for
• Critical detective tools
• Alleviating bottlenecks
• Example time!!

Identifying The Problem
Copyright Kim Greene Consulting, Inc. All rights reserved worldwide.
• What is the issue?• How does the problem manifest itself?
• What does the problem look like?
• What are indicators there is a problem?
• What is state of normalcy for:• CPU utilization
• Disk I/O rates
• Network bandwidth
• Transactions per minute / hour
• Client or web response times

Identifying The Problem
Copyright Kim Greene Consulting, Inc. All rights reserved worldwide.
• Is it repeatable?
• Need ability to collect data to resolve the
issue
• The process of resolution is iterative
• Perceived or real?• Performance data collection BEFORE
problems occur is critical!
• Certain users? Specific locations?• How pervasive is the problem?
• Which locations or groups are having
performance issues?
• What is the pattern of slowness?
• Daily
• Hourly
• Types of interfaces / connections

Identifying The Problem
Copyright Kim Greene Consulting, Inc. All rights reserved worldwide.
• Where is the issue coming from?• A resource
• Or resource management
Identifying The Problem
Copyright Kim Greene Consulting, Inc. All rights reserved worldwide.
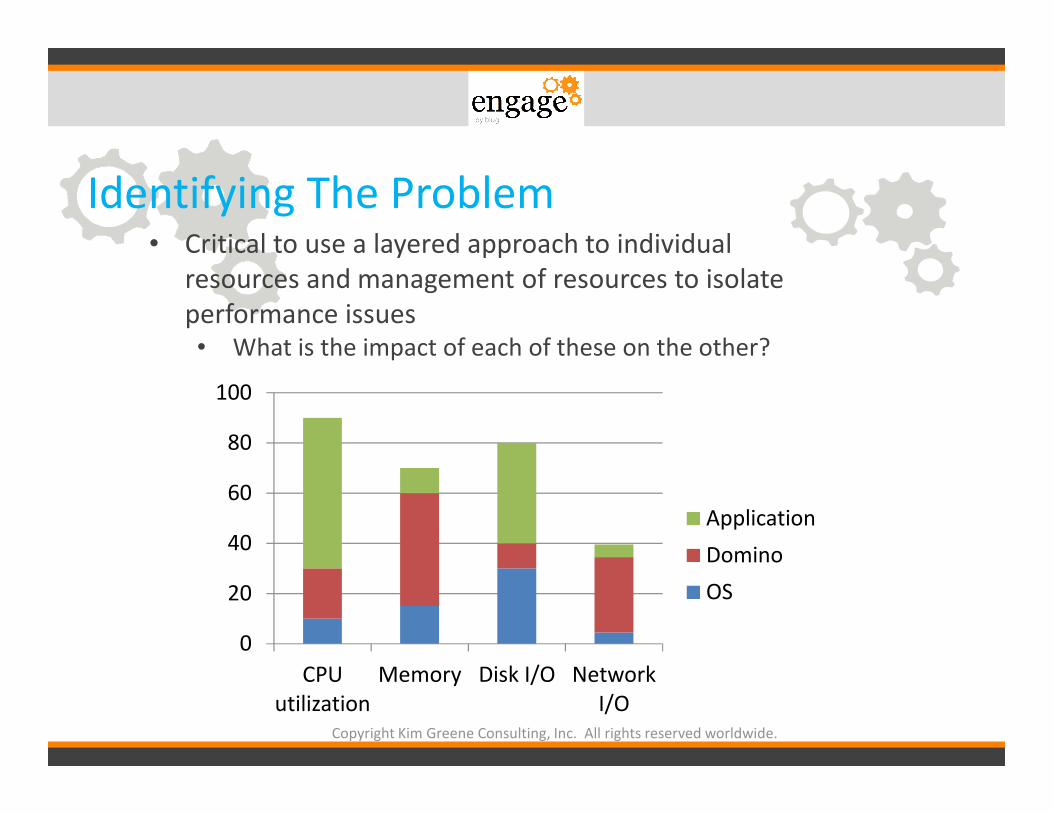
CPU
utilization
Memory Disk I/O Network
I/O
0
20
40
60
80
100
Application
Domino
OS
• Critical to use a layered approach to individual
resources and management of resources to isolate
performance issues• What is the impact of each of these on the other?
Identifying The Problem
Copyright Kim Greene Consulting, Inc. All rights reserved worldwide.
• Is it a throughput or bandwidth issue?• Throughput
• Constrained by ability to use a resource
• A resource management issue
• Tend to characterize OS or Domino / application issues
• Bandwidth• Constrained by not having enough resources
• Tend to characterize resource issues
• It may be a combination of the two

Agenda
Copyright Kim Greene Consulting, Inc. All rights reserved worldwide.
• Identifying the problem
• Resources – what to look for
• Critical detective tools
• Alleviating bottlenecks
• Example time!!
CPU
Copyright Kim Greene Consulting, Inc. All rights reserved worldwide.
• Typically an issue of over or under
consumption
• How many CPUs are assigned?• Partial processors can be cause for concern
• How configured?• Physical system
• LPAR
• VM
• What other work is running on the server
/ LPAR /VM?
• Managed via:• Hardware
• Operating system
• Domino

CPU Too High
Copyright Kim Greene Consulting, Inc. All rights reserved worldwide.
• Finding the problem• Need to look at each component
• Analyze thread or process using bulk of CPU to isolate root
cause of CPU consumption
• server_show_performance=1• Displays server performance events on the console

CPU Very Low
Copyright Kim Greene Consulting, Inc. All rights reserved worldwide.
• What is the issue?• Need to look at each component
• Need to look at system as a whole to hone in
where bottleneck is
• Resource management issue

Memory
Copyright Kim Greene Consulting, Inc. All rights reserved worldwide.
Hardware Operating System Domino
Not enough memory?
Problem with memory
chips?
Too much disk
fragmentation?
Proper amount of
memory for OS and
applications?
Large indexes?
Applications with memory leaks?
Caches and buffers set properly?
• Critical for optimal performance
• High paging and faulting can dramatically
impact performance of Domino

Memory
Copyright Kim Greene Consulting, Inc. All rights reserved worldwide.
• Important to look at system level and Domino level• IBM i example
• Drilling down further we see the memory pool involved is where all of the
Domino servers are running

Memory
Copyright Kim Greene Consulting, Inc. All rights reserved worldwide.
• Proper allocation of resources is key!• Memory allocation before optimization
• Memory allocation after optimization

Memory
Copyright Kim Greene Consulting, Inc. All rights reserved worldwide.
• Impact on CPU by properly optimizing memory allocation

Disk
Copyright Kim Greene Consulting, Inc. All rights reserved worldwide.
Hardware Operating System Domino
Not enough disk space
Not enough disks units
Slow disk access times
Raid or mirroring?
SAN or DAS?
Too much disk
fragmentation?
Not enough free space?
Too much disk
fragmentation?
High paging / faulting
impacting I/O?
Semaphore timeouts?
• All aspects of disk I/O need to be examined
• Assess Domino and the operating system’s
impact to disk performance

Disk
Copyright Kim Greene Consulting, Inc. All rights reserved worldwide.
• The impact of uneven disk I/O• Disk utilization was great, customer was running out of disk
space
• After addition of 3 much larger drives

Disk Defragmentation – Are You Affected?
Copyright Kim Greene Consulting, Inc. All rights reserved worldwide.
• Monitor split I/O per second• Ratio for which I/Os to disk are split into more
than one I/O
• If split I/Os > 10% of total I/O = PROBLEM!!
• Ensure operating system I/O is good before
focusing on Domino I/O
1 2 3 4 5 6 Free space
1 3 4 5 6 Free space
1 7 3 4 5 6 Free space
1 7 8 3 4 5 6 Free space
1 7 8 3 4 5 6 7 extent Free space

Network
Copyright Kim Greene Consulting, Inc. All rights reserved worldwide.
• One of the most difficult areas to analyze
• Need to check many things:• Server configuration
• DNS configuration and availability
• Firewall configuration
• Host files (if being used)
• Connection documents
• Network retransmissions are cause for concerns• Typically find to be an issue for users in specific locations
• Avoid ARP storms• Ensure each NIC has its own route
• Prevent intelligent switches from dynamically generating route
tables

Network
Copyright Kim Greene Consulting, Inc. All rights reserved worldwide.
• It’s imperative to understand what is happening with the network

Agenda
Copyright Kim Greene Consulting, Inc. All rights reserved worldwide.
• Identifying the problem
• Resources – what to look for
• Critical detective tools
• Alleviating bottlenecks
• Example time!!

Patterns, Patterns, Patterns ….
Copyright Kim Greene Consulting, Inc. All rights reserved worldwide.
• It’s all about the patterns …
Critical Detective Tools
Copyright Kim Greene Consulting, Inc. All rights reserved worldwide.
• System statistics
• Domino statistics
• DDM
• NSDs
• Memory dumps
• Semaphore debug
• Call stacks
• Activity logging
• Web application tools

System Statistics
Copyright Kim Greene Consulting, Inc. All rights reserved worldwide.
• Need tool to gather statistics for system
as a whole
• Capture statistics on:• CPU
• Memory
• Disk I/O
• Network I/O
• Some examples• Perfmon
• Perfpmr
• nmon
• vmstat
• Performance navigator
• iostat
• netstat

Domino Statistics
Copyright Kim Greene Consulting, Inc. All rights reserved worldwide.
• Great starting point when debugging performance issues• Statistics collection
• Stats and Collect tasks
• Sh stat
• Be sure to collect platform statistics too!!
• Critical areas of focus:• Domino memory management
• Cache sizes• Group cache
• Name lookup cache
• Database cache
• Transaction rates

Domino Domain Monitoring (DDM)
Copyright Kim Greene Consulting, Inc. All rights reserved worldwide.
• Great for determining where to focus within
Domino applications• Probe type = Application Code
• Probe subtypes• Agents behind schedule
• Agents evaluated by CPU usage
• Agents evaluated by memory usage
• Long running agents
• Processes to probe = AMGR or HTTP
• Embedded probes can be used to instrument code

Memory Dumps
Copyright Kim Greene Consulting, Inc. All rights reserved worldwide.
• Provides details on memory contents• Find out where memory is allocated from a Domino perspective
• Pool allocations by process ID*** Dump of Pools for ProcessID 00000229 (HTTP)
largest ---- P o o l A l l o c a t i o n s ---- Free List Iterations
pool addr size used free total skip search failure success frees total alloc free created
1 D691E7024101BEC0 14648K 13911K 94% 71K 141179 116 141063 26 141037 139160 1757014 800200 956814
2 FA83CEBEA3002000 14648K 6464K 44% 0b 35755 0 35755 0 35755 35175 403963 171251 232712 05/04/2009 09:31:22
3 process private memory pools
28 MB total pools size
19 MB total pools used
69.55% pool utilization
• Can be helpful to determine bottlenecks and memory leaks
• Memcheck• Good to use in combination with memory dumps
• Provide details on Java memory utilization
• Usage summary and top 10 sections are key

MEMCHECK
Copyright Kim Greene Consulting, Inc. All rights reserved worldwide.
• Notes memory usage summary<@@ ------ Notes Memory -> Usage Summary -> Shared Memory Stats :: (Shared) (Time 16:26:20) ------ @@>
TYPE : Count SIZE ALLOC FREE FRAG OVERHEAD %used %free
Static-DPOOL: 49 496194304 472697000 23439088 0 114034 95% 4%
VPOOL : 82 5002704 486884 4295456 0 222108 9% 85%
POOL : 93 5377312 2124984 2778016 0 479224 39% 51%
Overall : 49 496194304 465623528 30512560 0 815366 93% 6%
• Top 10 memory block usage<@@ ------ Notes Memory -> Usage Summary -> Top 10 Memory Block Usage -> Memhandles By Size :: (Shared) (Time 16:26:20) ------ @@>
Type TotalSize Count Typename
-----------------------------------------------------------
0x82cd 417243136 106 BLK_UBMBUFFER
0x82cc 8140800 106 BLK_UBMBCB
0x8252 4194322 4 BLK_NSF_POOL
0x8a05 3000000 1 BLK_NET_SESSION_TABLE
0x8439 2919518 313 BLK_BPOOL_PERPROCESS_INFO
0x834a 2621442 3 BLK_GB_CACHE
0x841c 2004708 116 BLK_VARRAY_CHUNK
0x826d 1048576 1 BLK_NSF_DIRMANPOOL
0x8252 1048576 1 BLK_NSF_POOL
x8311 1048576 1 BLK_NIF_POOL
Semaphore Debug
Copyright Kim Greene Consulting, Inc. All rights reserved worldwide.
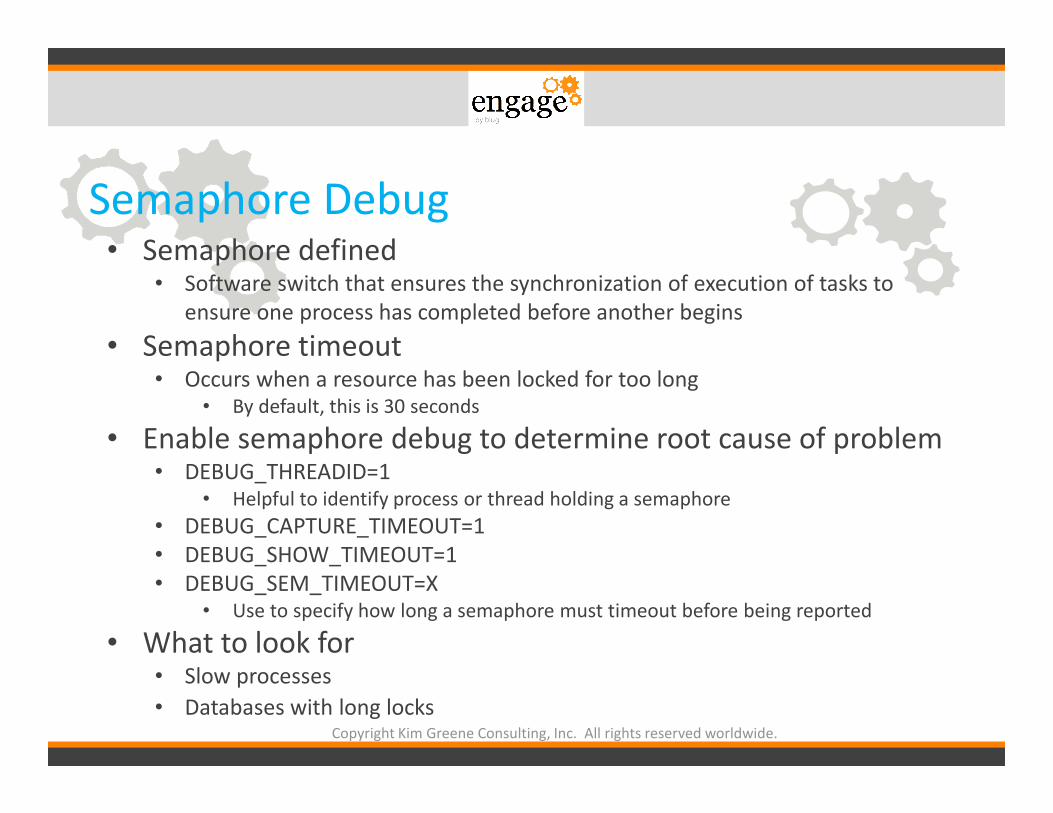
• Semaphore defined• Software switch that ensures the synchronization of execution of tasks to
ensure one process has completed before another begins
• Semaphore timeout• Occurs when a resource has been locked for too long
• By default, this is 30 seconds
• Enable semaphore debug to determine root cause of problem• DEBUG_THREADID=1
• Helpful to identify process or thread holding a semaphore
• DEBUG_CAPTURE_TIMEOUT=1
• DEBUG_SHOW_TIMEOUT=1
• DEBUG_SEM_TIMEOUT=X• Use to specify how long a semaphore must timeout before being reported
• What to look for• Slow processes
• Databases with long locks
Call Stacks
Copyright Kim Greene Consulting, Inc. All rights reserved worldwide.
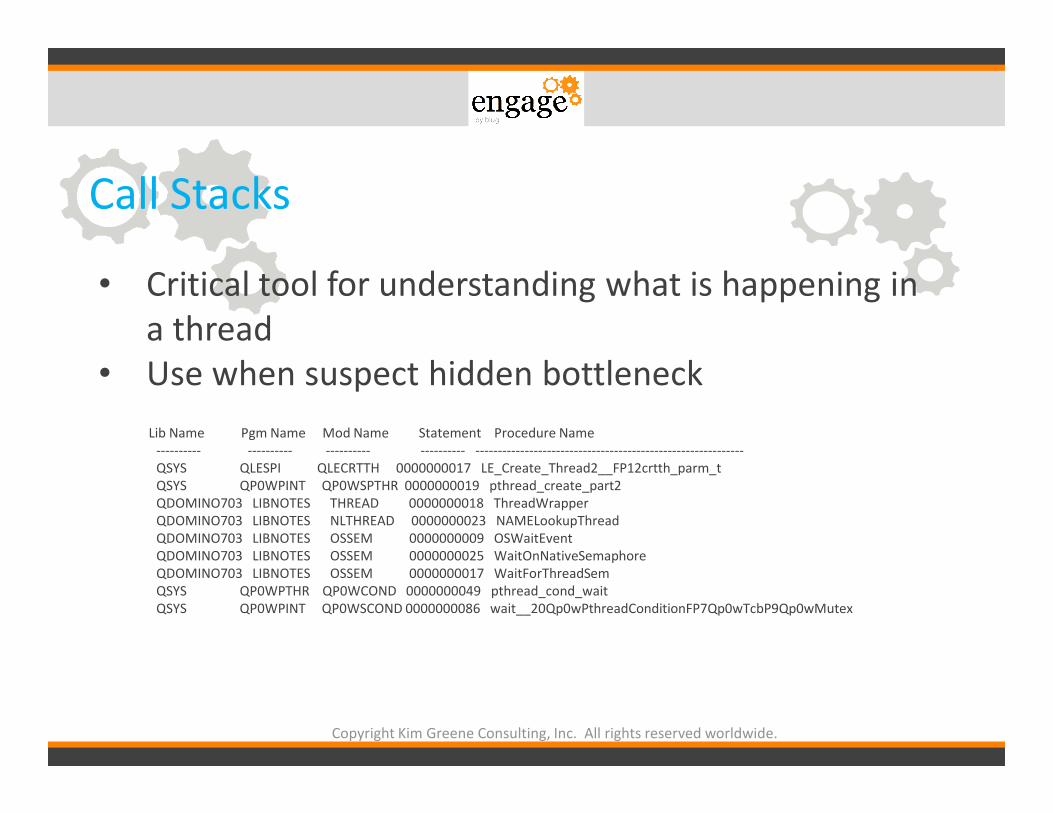
• Critical tool for understanding what is happening in
a thread
• Use when suspect hidden bottleneck
Lib Name Pgm Name Mod Name Statement Procedure Name
---------- ---------- ---------- ---------- ------------------------------------------------------------
QSYS QLESPI QLECRTTH 0000000017 LE_Create_Thread2__FP12crtth_parm_t
QSYS QP0WPINT QP0WSPTHR 0000000019 pthread_create_part2
QDOMINO703 LIBNOTES THREAD 0000000018 ThreadWrapper
QDOMINO703 LIBNOTES NLTHREAD 0000000023 NAMELookupThread
QDOMINO703 LIBNOTES OSSEM 0000000009 OSWaitEvent
QDOMINO703 LIBNOTES OSSEM 0000000025 WaitOnNativeSemaphore
QDOMINO703 LIBNOTES OSSEM 0000000017 WaitForThreadSem
QSYS QP0WPTHR QP0WCOND 0000000049 pthread_cond_wait
QSYS QP0WPINT QP0WSCOND 0000000086 wait__20Qp0wPthreadConditionFP7Qp0wTcbP9Qp0wMutex

Activity Logging
Copyright Kim Greene Consulting, Inc. All rights reserved worldwide.
• Records user activity by:• Person
• Database
• Access protocol
• Great for debugging performance slowdowns and CPU spikes• Activity recorded allows determination if:
• Specific application caused CPU spike or performance slowdown
• Spike in user activity is cause of CPU spike or performance slowdown
• A great way to:• Compare workloads across servers
• Compare user activity over time

Web Application Tools
Copyright Kim Greene Consulting, Inc. All rights reserved worldwide.
• tell http show thread state• Determine what forms, views or agents are associated with HTTP requests
• Example usage• Agents
• Is it an issue with agent concurrency?
• Forms• What type of lookups are being done?
• Lookup source can have dramatic impact on performance• Profile document lookup compared to pulled from view in external database
• Views• Which views are being used?
• How large are the views?
• How frequently should a view be updated?
• What is the view update setting?
• Is enough memory available for the view• Need 2 times the view size for optimal view rebuild time
Agenda
Copyright Kim Greene Consulting, Inc. All rights reserved worldwide.
• Identifying the problem
• Resources – what to look for
• Critical detective tools
• Alleviating bottlenecks
• Example time!!
Alleviating Bottlenecks
Copyright Kim Greene Consulting, Inc. All rights reserved worldwide.
• Critical things to remember:• Relieving bottleneck in one area,
may cause new bottleneck to
appear
• Resolution of an issue may be
dependent on what appears to
be a totally unrelated area
• It’s an iterative process

Domino Configuration – Where to Look For Bottlenecks
Copyright Kim Greene Consulting, Inc. All rights reserved worldwide.
• Unified Buffer Manager• Critical Domino buffer pool, buffers data between disk
and the NIF
• Statistics to watch:• Database.Database.BufferPool.Maximum.Megabytes
• Database.Database. BufferPool.Peak.Megabytes
• Database.Database.BufferPool.PercentReadsInBuffer• >= 95% is desired
• < 90% is issue
• Modify via:• NSF_BUFFER_POOL_SIZE_MB=xxx

Copyright Kim Greene Consulting, Inc. All rights reserved worldwide.
Domino Configuration – Where to Look For Bottlenecks
• Database Cache• Where Domino stores information about databases being accessed
• Allows Domino to read database information from cache rather than
physical disk
• Statistics to watch:• Database.DbCache.CurrentEntries
• Database.DbCache.HighWaterMark
• Database.DbCache.MaxEntries
• Database.DbCache.OvercrowdingRejections• Should be 0 on a healthy server
• Modify via:• NSF_DbCache_Maxentries=xxx

Copyright Kim Greene Consulting, Inc. All rights reserved worldwide.
Number of Mail.Box Files
• Mail.Mailbox.Accesses
• Mail.Mailbox.AccessConflicts
• Want a lower percentage of conflicts (2% or less)• Mail.Mailbox.AccessConflicts / Mail.Mailbox.Accesses = < 0.02
Mail Delivery StatisticMail Delivery StatisticMail Delivery StatisticMail Delivery Statistic OriginalOriginalOriginalOriginal AfterAfterAfterAfter TuningTuningTuningTuning
Mail.Mailbox.AccessConflicts 1151 8
Mail.Mailbox.Accesses 3877 3023
Server.MailBoxes 2 4

Copyright Kim Greene Consulting, Inc. All rights reserved worldwide.
Mail Contention – Customer Example
• Symptoms• Mail delivery very slow
• Messages queuing up in mail.box files
• Following message showing on console:
• Router: DNS server returned an error searching for MX records. The destination domain may not exist: xxx.xx.xx.xx, Error: Non-existent domain(NXDOMAIN)
Copyright Kim Greene Consulting, Inc. All rights reserved worldwide.
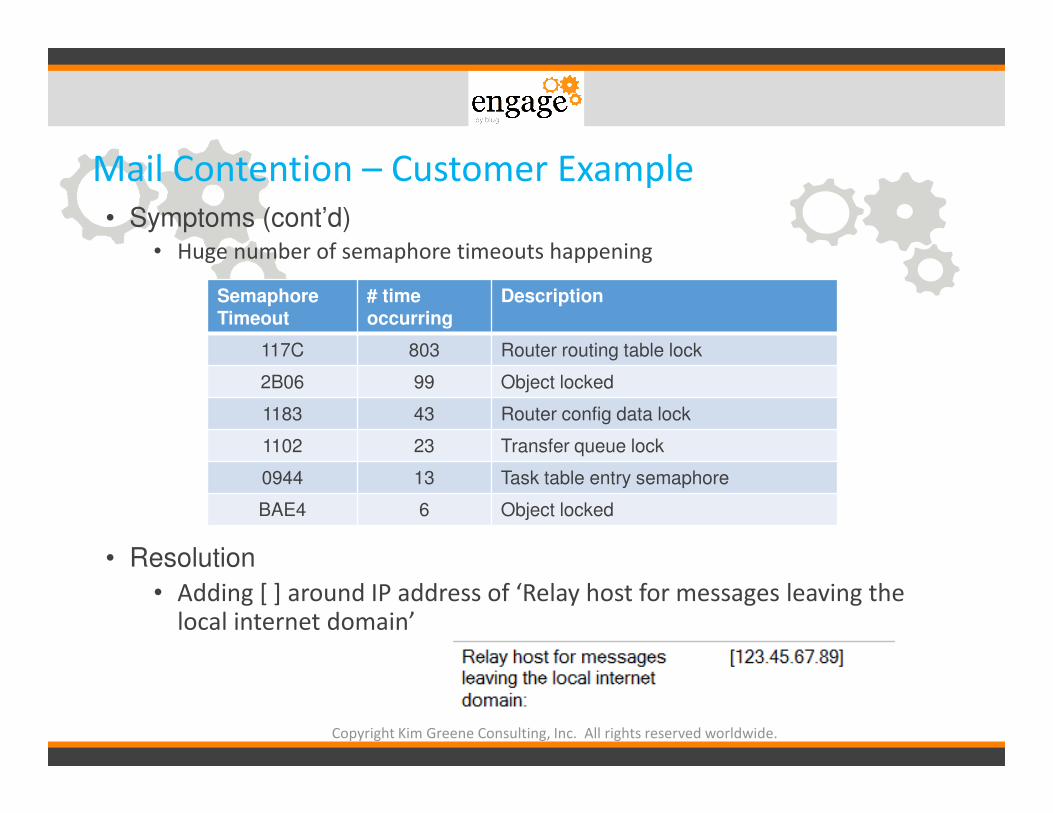
Mail Contention – Customer Example
• Symptoms (cont’d)
• Huge number of semaphore timeouts happening
• Resolution
• Adding [ ] around IP address of ‘Relay host for messages leaving the local internet domain’
Semaphore Timeout
# time occurring
Description
117C 803 Router routing table lock
2B06 99 Object locked
1183 43 Router config data lock
1102 23 Transfer queue lock
0944 13 Task table entry semaphore
BAE4 6 Object locked
Copyright Kim Greene Consulting, Inc. All rights reserved worldwide.
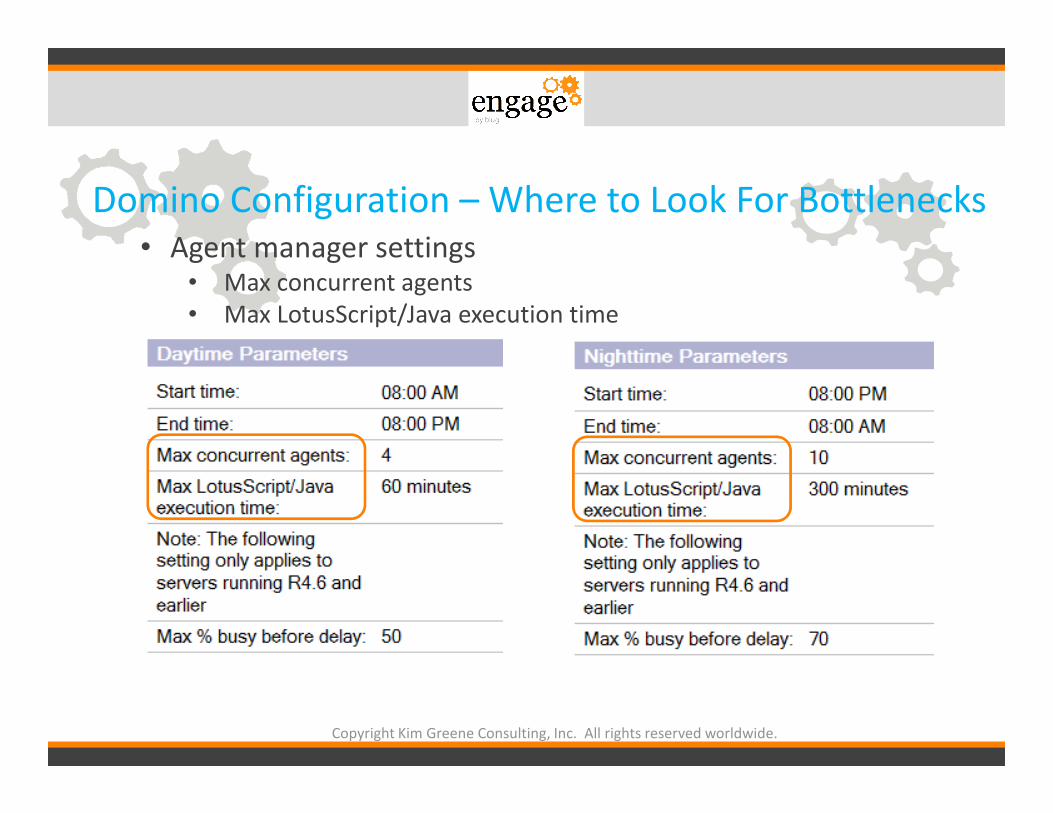
Domino Configuration – Where to Look For Bottlenecks
• Agent manager settings• Max concurrent agents
• Max LotusScript/Java execution time
Copyright Kim Greene Consulting, Inc. All rights reserved worldwide.
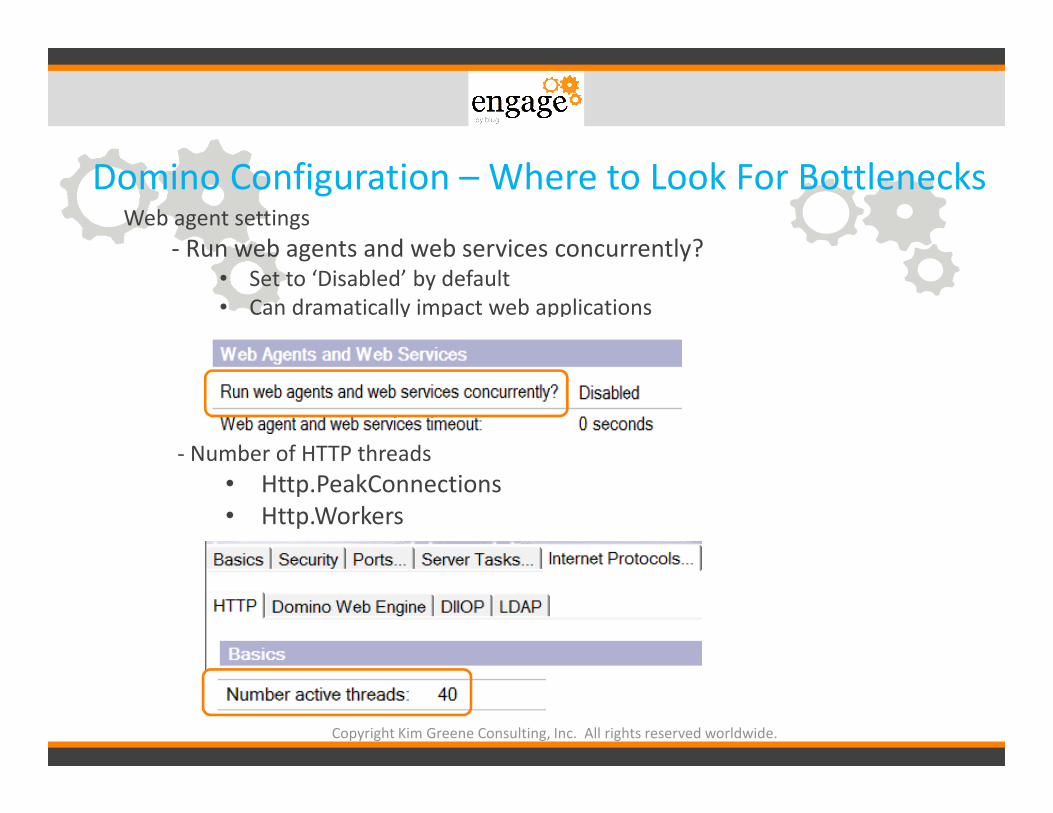
Domino Configuration – Where to Look For BottlenecksWeb agent settings
- Run web agents and web services concurrently?• Set to ‘Disabled’ by default
• Can dramatically impact web applications
- Number of HTTP threads
• Http.PeakConnections
• Http.Workers

Agenda
Copyright Kim Greene Consulting, Inc. All rights reserved worldwide.
• Identifying the problem
• Resources – what to look for
• Critical detective tools
• Alleviating bottlenecks
• Example time!!

Example 1
Copyright Kim Greene Consulting, Inc. All rights reserved worldwide.
• Scenario• New IBM i LPAR
• Three new Domino servers running in the LPAR
• Very slow performance on all 3 Domino servers• All types of operations were slow
• Opening databases, sending emails, working with applications, …
• Detective steps• Checked CPU utilization
• Less than 10%
• Checked memory utilization• Very low faulting rates
• Checked disk utilization• Less than 5%
• Checked network• Response times as expected
• Checked Domino statistics• Nothing stood out
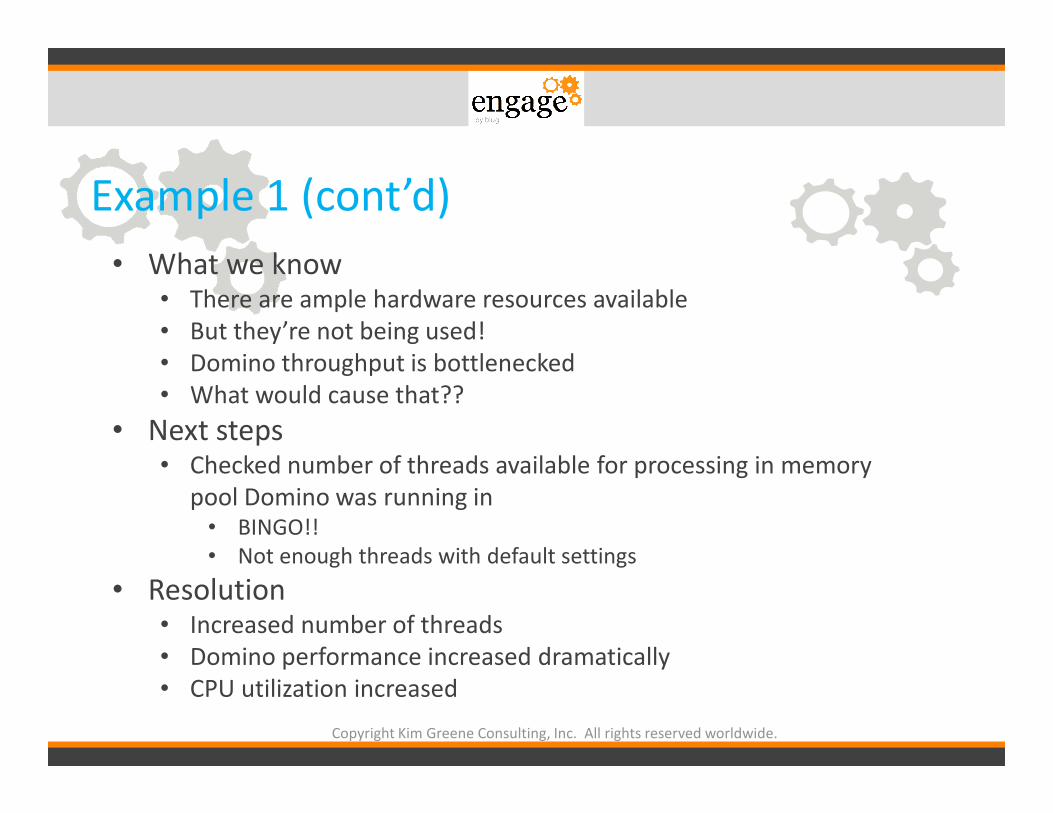
Example 1 (cont’d)
Copyright Kim Greene Consulting, Inc. All rights reserved worldwide.
• What we know• There are ample hardware resources available
• But they’re not being used!
• Domino throughput is bottlenecked
• What would cause that??
• Next steps• Checked number of threads available for processing in memory
pool Domino was running in• BINGO!!
• Not enough threads with default settings
• Resolution• Increased number of threads
• Domino performance increased dramatically
• CPU utilization increased
Example 2
Copyright Kim Greene Consulting, Inc. All rights reserved worldwide.
• Initial scenario• Recent upgrade of operating system (V5R4 -> V6R1)
• Recent upgrade of Domino (7.0.3 -> 8.5.2)
• Core application slow
• End users complaining about response times
• Detective steps• Analyzed server performance (CPU, memory, disk)
• No bottlenecks found
• Analyzed notes.ini file• Found ‘PercentAvailSysResources’ set on server
• Obsolete in Domino 8.x
• Next steps• Removed ‘PercentAvailSysResources’
• Restarted Domino server• Performance improves, Domino is utilizing memory much better

Example 2 (cont’d)
Copyright Kim Greene Consulting, Inc. All rights reserved worldwide.
• Scenario after initial tuning• Performance great majority of time
• Intermittent poor response times
• Detective steps• Ensured system performance monitor still active
• Enabled semaphore debug
• Enabled Domino statistic collection
• Analyzed system performance data
• Analyzed semaphore debug
• Analyzed Domino statistics
• Analyzed call stacks while performance issue occurred again

Example 2 (cont’d)
Copyright Kim Greene Consulting, Inc. All rights reserved worldwide.
• What we know• Large number of semaphore timeouts reported on the Domino server console
• Number of active threads for HTTP task spikes from average of 25 threads to
maximum of 512 threads
• Faulting in Domino memory pool spikes when problem occurs
• Server appears to be choking itself spending more time trying to check to see if
it can now take its turn to process a request than performing actual work
• Accesses to the Agent log database causing semaphore timeouts
• Resolution• Reduced size of Agent log database
• Reduced number of HTTP threads to 100
• Moved ODBC connection processing jobs (QSQSRVR) to separate memory pool
• Overall throughput improved dramatically
• No server performance complaints
• HTTP requests average 55 ms (previously were 150 ms)
Example 3
Copyright Kim Greene Consulting, Inc. All rights reserved worldwide.
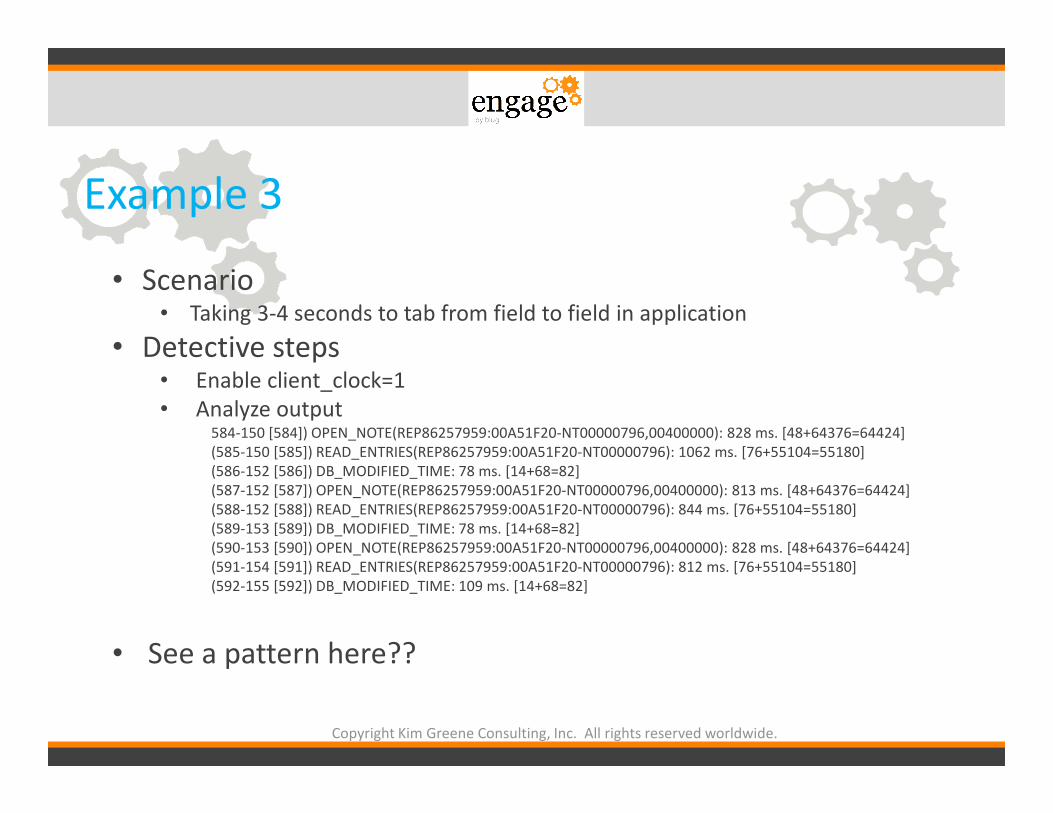
• Scenario• Taking 3-4 seconds to tab from field to field in application
• Detective steps• Enable client_clock=1
• Analyze output584-150 [584]) OPEN_NOTE(REP86257959:00A51F20-NT00000796,00400000): 828 ms. [48+64376=64424]
(585-150 [585]) READ_ENTRIES(REP86257959:00A51F20-NT00000796): 1062 ms. [76+55104=55180]
(586-152 [586]) DB_MODIFIED_TIME: 78 ms. [14+68=82]
(587-152 [587]) OPEN_NOTE(REP86257959:00A51F20-NT00000796,00400000): 813 ms. [48+64376=64424]
(588-152 [588]) READ_ENTRIES(REP86257959:00A51F20-NT00000796): 844 ms. [76+55104=55180]
(589-153 [589]) DB_MODIFIED_TIME: 78 ms. [14+68=82]
(590-153 [590]) OPEN_NOTE(REP86257959:00A51F20-NT00000796,00400000): 828 ms. [48+64376=64424]
(591-154 [591]) READ_ENTRIES(REP86257959:00A51F20-NT00000796): 812 ms. [76+55104=55180]
(592-155 [592]) DB_MODIFIED_TIME: 109 ms. [14+68=82]
• See a pattern here??

Example 3 (cont’d)
Copyright Kim Greene Consulting, Inc. All rights reserved worldwide.
• What we know• Same database is being opened and read from over and over• 584-150 [584]) OPEN_NOTE(REP86257959:00A51F20-NT00000796,00400000): 828 ms. [48+64376=64424]
(585-150 [585]) READ_ENTRIES(REP86257959:00A51F20-NT00000796): 1062 ms. [76+55104=55180
• Next steps• Analyze form design
• What we know• Found computed field doing lookup
• Found form property “Automatically refresh fields” set on form
• Resolution• Changed form property
• Changed view involved in lookup to not rebuild more than once an hour
• Dramatically improved performance

Questions
Copyright Kim Greene Consulting, Inc. All rights reserved worldwide.
Recommended