P a g e |26
Activity 4: Graphic Encounters SummaryInthisactivity,studentstravelaroundtheclassroommakingobservationsaboutvariousmapsandgraphsrelatedtoclimatechange.Studentsarethenaskedto“translate”theinformationintoaninfographic,highlightingtheinformationtheyfoundmostcompelling.Theyarealsoaskedtoprovidesuggestionsofatargetaudienceforthisinformation.Duration:two60-75minutessessionsLearningoutcomesAfterparticipatingintheactivity,studentswillbeableto:• Explainhowphysicalprocesseshelpto
shapefeaturesandpatternsonEarth’ssurface,
• CompareandinterpretmapsandgraphstoexplainhowclimatechangecanaffectphysicalprocessesonEarth,and
• Explainwaysinwhichlivingthingsandnaturalsystemsareaffectedbyclimatechange.
CompetencyoutcomesDuringthisactivity,studentswilldeveloporimprovetheseabilities:
• Research• Communication• Creativity• Criticalthinking• Collaboration
Teacherbackgrounder
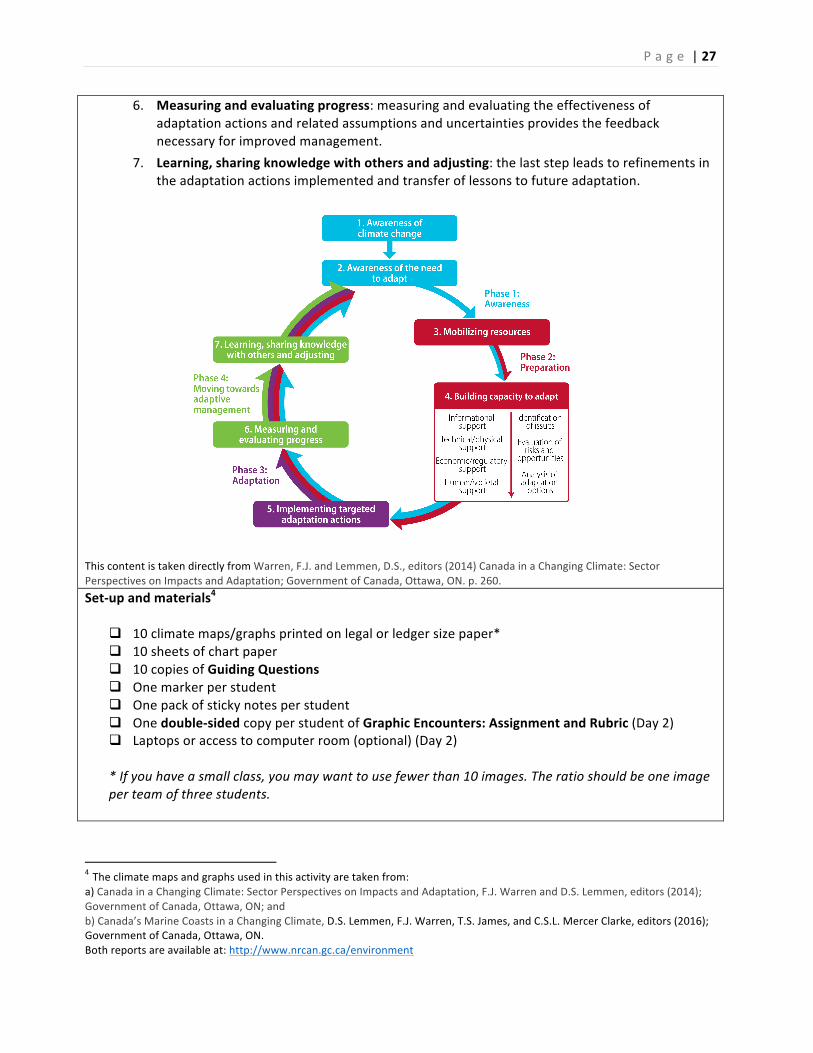
THEADAPTATIONPROCESSLikeanyprocessinvolvingchangesinthinkingandpractice,adaptingtoachangingclimateinvolvesdeepeninglevelsofengagement(phases)andactionsthatcanbetakeninsupportofdecision-making(steps).Thefigurebelowsummarizesthesephasesandsteps,whichintegrateobservationsonhowadaptationisoccurringinCanadawithcommonelementsofseveraladaptationplanningframeworks.Althoughpresentedasalinearprocess,organizationsmaytakedifferentpathwaysastheytransitionanditeratethroughthesephasesandsteps.
Phasesintheadaptationprocessincludeawareness,preparation,implementationanditerativelearning.Thesevenstepsare:1. Awarenessofclimatechange:theadaptationprocessbeginsonceanindividualor
organizationbecomesawareofachangingclimateasathreatoropportunity.2. Awarenessoftheneedtoadapt:anawarenessofthemagnitudeoftheproblemhelpsto
identifyadaptationasasolution.3. Mobilizingresources:awarenesscanleadindividualsandorganizationstodedicatehuman
and/orfinancialresourcestohelpclarifythenatureofthreatsoropportunities.4. Buildingcapacitytoadapt:involvesapplyingscientificinformation,financialresources,and
skillstofocusedactivitiessuchasissuescreening,riskassessmentandin-depthanalysistogeneratetheunderstandingneededforinformeddecisionmaking.
5. Implementingtargetedadaptationactions:concreteactionsareputinplacetoreducevulnerability(riskorexposure)toclimatechangeand/ortotakeadvantageofopportunities.
P a g e |27
6. Measuringandevaluatingprogress:measuringandevaluatingtheeffectivenessofadaptationactionsandrelatedassumptionsanduncertaintiesprovidesthefeedbacknecessaryforimprovedmanagement.
7. Learning,sharingknowledgewithothersandadjusting:thelaststepleadstorefinementsintheadaptationactionsimplementedandtransferoflessonstofutureadaptation.
ThiscontentistakendirectlyfromWarren,F.J.andLemmen,D.S.,editors(2014)CanadainaChangingClimate:SectorPerspectivesonImpactsandAdaptation;GovernmentofCanada,Ottawa,ON.p.260.Set-upandmaterials4
q 10climatemaps/graphsprintedonlegalorledgersizepaper*q 10sheetsofchartpaperq 10copiesofGuidingQuestionsq Onemarkerperstudentq Onepackofstickynotesperstudentq Onedouble-sidedcopyperstudentofGraphicEncounters:AssignmentandRubric(Day2)q Laptopsoraccesstocomputerroom(optional)(Day2)
*Ifyouhaveasmallclass,youmaywanttousefewerthan10images.Theratioshouldbeoneimageperteamofthreestudents.
4Theclimatemapsandgraphsusedinthisactivityaretakenfrom:a)CanadainaChangingClimate:SectorPerspectivesonImpactsandAdaptation,F.J.WarrenandD.S.Lemmen,editors(2014);GovernmentofCanada,Ottawa,ON;andb)Canada’sMarineCoastsinaChangingClimate,D.S.Lemmen,F.J.Warren,T.S.James,andC.S.L.MercerClarke,editors(2016);GovernmentofCanada,Ottawa,ON.Bothreportsareavailableat:http://www.nrcan.gc.ca/environment

P a g e |28
Whattodo
Day1
1. Hangthemapsandgraphs(p.29)aroundtheclassroom,withasheetofchartpaperbeloweach.HangacopyoftheGuidingQuestionsaboveeachimage.
2. Explaintostudentsthatclimatechangeadaptationandmitigationdecisionsarerootedinscientificevidence.Whendecision-makersandscientistsinterpretthedata,theyaretryingtofigureoutwhateffectitwillhaveontheworldwelivein.
3. Askstudentstoformgroupsofthreeandplacethemselvesunderonemaporgraph.Givethemoneminutetosilentlycontemplatetheimagebeforetheystarttotalktotheirgroupaboutit.
4. Givethemthreeminutestowritetheirideasonthefirsttwoguidingquestionsonthechartpaper;anyquestionstheyhaveshouldgoonthestickynotes.Theycandiscussthesewiththeirgroup,buteachstudentshouldbewritingdownhisorherownideasonthechartpaper(whetherornottheothersfinditinteresting).
5. Askthestudentstorotatetothenextmaporgraphandrepeatsteps2and3.Beforewritingouttheirideas,theyshouldreadwhatotherstudentshavewrittenandputcheckmarksnexttotheitemstheyagreewithratherthanre-writinganidea.
6. Afterseveralrounds(choosethenumberofroundsbasedonthetimeavailable),discussthediscoveriesmadebythestudents.
Tip:Askthelastgroupofstudentstohaveanalyzedthemaporgraphtoleadthediscussion.
7. Beforetheendofclass,askeachstudenttoputhisorhernameunderthemaporgraphtheyfoundmostcompellingandthattheywouldliketocontinueexploring.Thestudentsarefreetoformnewgroupsbasedontheirpreferredimage.
Day2
1. Introducethe“createaninfographic”assignmenttothestudents.Itisstronglyrecommendedthatyouspendsometimeanalyzingafewexistinginfographicswiththestudentssothattheyknowwhatisexpectedofthem,startingwiththesixinfographicsthataccompanythisresource.
Tip:Tolearnmoreaboutusinginfographicsasateachingandassessmenttool,visitKathySchrock’sInfographicsasaCreativeAssessmentathttp://bit.ly/schrockinfographics.
2. DownloadthetwoNaturalResourcesCanadareportsthatthemapsandgraphsinthisassignmentaretakenfrom(CanadainaChangingClimate;andCanada’sMarineCoastsinaChangingClimate)sothattheyarereadilyavailabletostudents.
We’dlovetoseeyourstudents’creations!Sendphotographsorshortvideosofyourclass’sinfographicsto:

P a g e |29
Clickonthethumbnailtoopenahigh-resolutionimage.Itisrecommendedthatyouleavetheimagedescriptorasitappearsinthedocumenttochallengestudents’interpretationskills
Canada’sMarineCoastsinaChangingClimate,p.11
Canada’sMarineCoastsinaChangingClimate,p.54
CanadainaChangingClimate:SectorPerspectivesonImpactsandAdaptation,p.28

P a g e |30
Canada’sMarineCoastsinaChangingClimate,p.171
Canada’sMarineCoastsinaChangingClimate,p.177

P a g e |31
CanadainaChangingClimate:SectorPerspectivesonImpactsandAdaptation,p.8
CanadainaChangingClimate:SectorPerspectivesonImpactsandAdaptation,p.30
CanadainaChangingClimate:SectorPerspectivesonImpactsandAdaptation,p.10

P a g e |32
CanadainaChangingClimate:SectorPerspectivesonImpactsandAdaptation,p.12
CanadainaChangingClimate:SectorPerspectivesonImpactsandAdaptation,p.213

P a g e |33
CanadainaChangingClimate:SectorPerspectivesonImpactsandAdaptation,p.34
CanadainaChangingClimate:SectorPerspectivesonImpactsandAdaptation,p.8and41.

P a g e |34
CanadainaChangingClimate:SectorPerspectivesonImpactsandAdaptation,p.109.
CanadainaChangingClimate:SectorPerspectivesonImpactsandAdaptation,p.165.

P a g e |35
CanadainaChangingClimate:SectorPerspectivesonImpactsandAdaptation,p.201.
Canada’sMarineCoastsinaChangingClimate,p.172.

P a g e |36
Activity4–TeacherBLM:GuidingQuestions
GuidingQuestions
1. Inyourownwords,whatisthisimagetryingtoconvey?
2. Whatdoyounotice?Isthereanythingstrangeorsurprising?Doyouseetrends?
3. Canyouthinkofanyenvironmental,economic,orsocialconsequencesofthisdata?
4. Onstickynotes,writedownanyquestionsyouhaveaboutthisimage.

P a g e |37
Activity4–StudentBLM:AssignmentandRubric Thefirststeptowardsadaptationimplementationisawarenessofclimatechange,potentialimpacts,andtheneedtoadapt.Increasedawarenessofclimatechangecanoccurspontaneously(e.g.throughtheexperienceofextremeevents)orthroughplannedactivities(e.g.workshops,awareness-raisingcampaigns,learningmodulesorpublications).5
Inthisassignment,yourteamwill“translate”themaporgraphyouchoseintoaninfographicthatclearlycommunicatesitsmessageandimportancetoanaudience.Theinfographicmustconveyboththeinformationcontainedintheimageaswellasasummaryoffurtherresearchyourteamwillconducttosupportyourideas.StartwiththetworeportsproducedbyNaturalResourcesCanada(CanadainaChangingClimate;andCanada’sMarineCoastsinaChangingClimate)thatyourteacherhasdownloadedforyou.
GraphicEncountersRubric
Exemplary Proficient Satisfactory UnsatisfactoryMainideaInfographicconveysthemainideainaclearandcompellingmanner
ResearchInfographicreflectsresearchintotheenvironmentaland/orsocialsignificanceofthedata
GraphicsGraphicsarerelevant,chosentoenhanceandsupportthedata
LayoutanddesignThelayoutofthegraphicsandtextpurposelyenhancesthecommunicationofthemainideas.Theflowofinformationisunclutteredandwellorganized.
LanguageLanguageisusedinapreciseandconcisemannerwithnoerrorsinspelling,grammarorpunctuation.
AudienceInfographicclearlyidentifiesandsupportstherelevanceoftheinformationforatleasttwosocio-economicsectors.
Infographicelements Containsatitlethatreflectsthemainideaoftheinfographic
Containsatleast5images Eachimagecontainsaconcisestatementtohelpaudienceunderstandit
Contains(ontheback)areferencelistforresearchandimages,withreferencescitedproperly
Seereverseforteamworksheet.
5FromCanadainaChangingClimate:SectorPerspectivesonImpactsandAdaptation,p.274.
1/2
Name:_________________________________________ Date:________________________

P a g e |38
Names:
Imagechosen:
CanadainaChangingClimate:SectorPerspectivesonImpactsandAdaptation,p.________
OR
Canada’sMarineCoastsinaChangingClimate,p._______
Furtherresearchnotes(environmentaland/orsocialrelevanceofthedata):
Informationtoinclude:
Onthebackoftheinfographic,pleaseanswerthefollowing:
Inyouropinion,whichofthefollowingsectorsshouldbeconcernedbythisinformation?(Chooseatleasttwo.)Why?
1. Energy(oilandgas,wind,solar)2. Foodproduction3. Mining4. Forestry5. Tourism6. Housing/construction
7. Insurance8. Manufacturing9. Biodiversity10. Infrastructureandtransportation11. Healthandsocialwell-being
2/2
Recommended