1
Spatial distribution of aerosol microphysical and optical properties and 1
direct radiative effect from the China Aerosol Remote Sensing Network 2
Huizheng Che1*, Xiangao Xia2,3, Hujia Zhao1,4, Oleg Dubovik5, Brent N. 3
Holben6, Philippe Goloub5, Emilio Cuevas-Agulló7, Victor Estelles8, Yaqiang 4
Wang1, Jun Zhu9 Bing Qi10, Wei Gong 11, Honglong Yang12, Renjian Zhang13, 5
Leiku Yang14, Jing Chen15, Hong Wang1, Yu Zheng1, Ke Gui1,2,Xiaochun 6
Zhang16, Xiaoye Zhang1* 7
1 State Key Laboratory of Severe Weather (LASW) and Key Laboratory of Atmospheric 8
Chemistry (LAC), Chinese Academy of Meteorological Sciences, CMA, Beijing, 9
100081, China 10
2 Laboratory for Middle Atmosphere and Global Environment Observation (LAGEO), 11
Institute of Atmospheric Physics, Chinese Academy of Sciences, Beijing, 100029, 12
China 13
3 University of Chinese Academy of Science, Beijing, 100049, China 14
4 Institute of Atmospheric Environment, CMA, Shenyang, 110016, China 15
5 Laboratoire d’Optique Amosphérique, Université des Sciences et Technologies de 16
Lille, 59655, Villeneuve d’Ascq, France 17
6 NASA Goddard Space Flight Center, Greenbelt, MD, USA 18
7 Centro de Investigación Atmosférica de Izaña, AEMET, 38001 Santa Cruz de 19
Tenerife , Spain 20
8 Dept. Fisica de la Terra i Termodinamica, Universitat de Valencia, C/ Dr. Moliner 50, 21
46100 Burjassot, Spain 22
9 Collaborative Innovation Center on Forecast and Evaluation of Meteorological 23
Disasters, Nanjing University of Information Science & Technology, Nanjing, 210044, 24
China 25
10 Hangzhou Meteorological Bureau, Hangzhou, 310051, China 26
11 State Key Laboratory of Information Engineering in Surveying, Mapping and Remote 27
Sensing, Wuhan University, Wuhan, 430079, China 28
12 Shenzhen Meteorological Bureau, Shenzhen, 518040, China 29
13 Key Laboratory of Regional Climate-Environment Research for Temperate East Asia, 30
Institute of Atmospheric Physics, Beijing, 100029, Chinese Academy of Sciences. 31
14 School of Surveying and Land Information Engineering, Henan Polytechnic University, 32
Jiaozuo, 454000, China 33
15 Shijiazhuang Meteorological Bureau, Shijiazhuang, 050081, China 34
16 Meteorological Observation Center, CMA, Beijing, 100081 35
Corresponding author: [email protected] & [email protected] 36
https://doi.org/10.5194/acp-2019-405Preprint. Discussion started: 28 May 2019c© Author(s) 2019. CC BY 4.0 License.

2
Abstract 37
Long-term observations of aerosol microphysical and optical properties 38
obtained through ground-based remote sensing at 50 China Aerosol Remote 39
Sensing Network (CARSNET) sites were used to characterize the aerosol 40
climatology for representative remote, rural, and urban areas over China to 41
assess effects on climate. The annual mean effective radii for total particles 42
(Refft) decreased from north to south and from rural to urban sites, and high 43
total particle volumes were found at the urban sites. The aerosol optical depth 44
at 440 nm (AOD440nm) increased from remote/rural sites (0.12) to urban sites 45
(0.79), and the extinction Ångström exponent (EAE440-870nm) increased from 46
0.71 at the arid/semi-arid sites to 1.15 at the urban sites, presumably due to 47
anthropogenic emissions. Single scattering albedos (SSA440 nm) ranged from 48
0.88 to 0.92 indicating slightly to strongly absorbing aerosols. Absorption 49
AOD440nm’s were 0.01 at the remote sites versus 0.07 at the urban sites. The 50
average direct aerosol radiative effect (DARE) at the bottom of atmosphere 51
increased from the sites in the remote (-24.40 W/m2) to the urban area 52
(-103.28 W/m2) indicating increased cooling at the latter. The DARE for the top 53
of the atmosphere increased from -4.79 W/m2 at the remote sites to -30.05 54
W/m2 at the urban sites, indicating overall cooling effects for the 55
earth-atmosphere system. A classification method based on SSA440 nm, fine 56
mode fraction (FMF), and EAE440-870 nm showed that coarse mode particles 57
(mainly dust) were dominant at the rural sites near the northwestern deserts, 58
while light-absorbing, fine-mode particles were important at most urban sites. 59
This study will be useful for understanding aerosol climate effects and regional 60
environmental pollution, and the results will provide useful information for 61
satellite validation and the improvement of climate modelings. 62
Keywords: aerosol optical properties; direct aerosol radiative effect; aerosol 63
type; climatology; China Aerosol Remote Sensing Network 64
65
https://doi.org/10.5194/acp-2019-405Preprint. Discussion started: 28 May 2019c© Author(s) 2019. CC BY 4.0 License.
3
1. Introduction 66
Atmospheric aerosols have important direct effects on climate because 67
they can scatter and absorb radiant energy and in so doing affect the Earth’s 68
energy balance (Charlson et al., 1992). The optical properties of the aerosol 69
determine the particles’ direct effects on the Earth’s radiative balance and 70
climate change (Ramanathan et al., 2001; Eck et al., 2005; Myhre, 2009). 71
Aerosol optical depth (AOD) is one of the key measures of the aerosols’ effects 72
on climate (Breon et al., 2002), and the extinction Ångström exponent (EAE) 73
can be used together with AOD to study aerosol sizes and types (Gobbi et al., 74
2007; Eck et al., 1999). The aerosols’ absorptivity is a key determinant of 75
radiative effect (Haywood and Shine, 1995), and the single scattering albedo 76
(SSA) is the parameter needed to calculate the direct aerosol radiative effect 77
(Jacobson et al., 2000; Dubovik et al., 2002; Gelencser et al., 2004; Russell et 78
al., 2010; Giles et al., 2012). 79
With the recognition of the importance for climate, the aerosol optical 80
properties have been obtained from ground-based monitoring networks 81
worldwide; some of the major networks include AERONET-Aerosol Robotic 82
Network) (Holben et al., 1998) and its sub-networks of 83
PHOTONS-PHOtométrie pour le Traitement Opérationnel de Normalisation 84
Satellitaire, AEROCAN-Canadian Sun-Photometer Network, and RIMA-Iberian 85
Network for aerosol measurements ((Goloub et al., 2007; Bokoye et al., 2001; 86
Prats et al., 2011), SKYNET-SKYrad Network (Takamura and Nakajima, 2004; 87
Che et al., 2008), EARLINET-European aerosol Lidar network (Pappalardo et 88
al., 2014), the GAW-PFR Network-Global Atmosphere Watch 89
Programmer-Precision Filter Radiometers (Wehrli, 2002; Estellés et al., 2012),. 90
The CARSNET-China Aerosol Remote Sensing NETwork, the 91
CSHNET-Chinese Sun Hazemeter Network and the SONET-Sun–Sky 92
Radiometer Observation Network have been established to measure aerosol 93
optical properties in China (Che et al., 2009a, 2015; Xin et al., 2007; Li et al., 94
2018). Furthermore, the aerosol optical properties have also been used in 95
https://doi.org/10.5194/acp-2019-405Preprint. Discussion started: 28 May 2019c© Author(s) 2019. CC BY 4.0 License.

4
comprehensive studies of aerosol physical characteristics and chemical 96
composition. 97
China has become one of the largest aerosol sources in the world due to 98
its rapid economic development, and this has caused significant effects on 99
local environments and regional climate (Che et al., 2005; Xia, 2010). There 100
have been numerous studies that have focused on aerosol optical properties 101
obtained though ground-based remote sensing methods in China (Luo et al., 102
2002; Li et al., 2003; Duan and Mao, 2007). A few researches have pay more 103
attention to the aerosol optical properties and its radiative effects over the 104
urban-industrial areas as well as at coastal sites in northeastern China (Wang 105
et al., 2010; Xin et al., 2011; Xia et al., 2007; Zhao et al., 2016; Wu et al. 2012). 106
Many studies of aerosol optical properties conducted in northern China with 107
high aerosol loadings, such as the Beijing-Tianjin-Hebei region (Che et al. 108
2014; Xia et al., 2013; Fan et al., 2006; Xie et al., 2008). Aerosol optical 109
properties also have been investigated at Hefei, Shouxian, Nanjing, Taihu and 110
Shanghai in eastern China (Lee et al., 2010; He et al., 2012; Zhuang et al., 111
2014; Wang Z et al., 2015; Che et al., 2018). Some studies of aerosol optical 112
properties have been made in southern China (Wang et al., 2015; Tao et al., 113
2014), and those at remote and rural sites in China provide information on 114
regional background conditions (Che et al., 2009b; Wang et al., 2010; Xue et 115
al., 2011; Zhu et al., 2014; Yuan et al., 2014). 116
China’s vast size, varied terrain, and heterogeneity of aerosol sources, 117
has led to strong temporal and spatial variability in aerosol optical and physical 118
properties. The mixtures of aerosol types at most sites are complex, and 119
aerosol populations’ size and composition are affected by their sources, 120
transformations that occurring during transportation and removing processes 121
(Cao et al., 2007; Wang et al., 2007; Zhang et al., 2013; Wan et al., 2015). 122
National scale, ground-based measurements of aerosol microphysical and its 123
optical properties obtained from the sunphotometer provide for a better 124
understanding of the aerosols’ climate effects over the different regions of 125
https://doi.org/10.5194/acp-2019-405Preprint. Discussion started: 28 May 2019c© Author(s) 2019. CC BY 4.0 License.

5
China. The measurements of greatest interest include aerosol size 126
distributions, optical properties (AOD, AE, SSA, absorption AOD) because 127
those data can be used to evaluate direct radiative effect. 128
The aim of this study was focused on the investigation of the 129
climatological spatial distribution of aerosol microphysical and optical 130
properties over regional-scales using spatial distribution data from the national 131
CARSNET network. The data were collected at CARSNET sites, which include 132
sites in the remote, rural and urban area, with the same calibration procedures 133
and calculation algorithms were used at all sites. As a result, the data are 134
directly comparable among sites (Che et al., 2009a), and the results can be 135
provide to characterize the regional distribution and temporal variation of 136
aerosol optical properties. This research focused on aerosol climate effects 137
and regional environmental pollution, and the results should be useful for 138
satellite validations and for the improvement of models in the future. The 139
remainder of this paper is organized as following: Section 2 firstly describes 140
the sites in detail, and then introduced the methods in data processing of the 141
aerosol optical properties as well as the direct aerosol radiative effect 142
calculation through the retrieved aerosol optical parameters. Section 3 143
illustrates the aerosol microphysical and optical properties, as well as its direct 144
aerosol radiative effect. An aerosol type classification method is proposed 145
according to the aerosol optical parameters. Section 4 presents the 146
conclusions of the study. 147
2 Site description, instruments, and data 148
2.1 Site description 149
Sunphotometers (CE-318, Cimel Electronique, Paris, France, see 150
Appendix A,) were installed at 50 CARSNET sites (Fig. 1) in multi-year from 151
2010 to 2017. The stations were classified as remote, rural, or urban sites 152
based on administrative division (Appendix Table 1). Three of the remote 153
stations were about more than 3000 m above the sea level on the Tibetan 154
Plateau far from the anthropogenic influences, and one of them was a 155
https://doi.org/10.5194/acp-2019-405Preprint. Discussion started: 28 May 2019c© Author(s) 2019. CC BY 4.0 License.

6
northwestern regional background site in China. The 23 rural sites represent (a) 156
five sites of desert regions (five sites) affected by most of dust aerosols 157
rather than anthropogenic particles, (b) two sites affected by both dust and 158
anthropogenic activities on the Loess Plateau, and (c) 16 sites located near or 159
surrounding the large cities relatively strong to the impacts of anthropogenic 160
activities in the central and eastern China. The last category is 24 urban sites 161
located in provincial capitals or heavily populated cities. 162
2.2 Instruments and calibration 163
The CE-318 sunphotometers used in this study were calibrated annually, 164
using the CARSNET calibration protocol, to verify the accuracy and reliability 165
of the sky irradiance measurements (Holben et al., 1998; Che et al., 2009; Tao 166
et al., 2014). The reference instruments for CARSNET were periodically 167
calibrated at Izaña, Tenerife, Spain located at 28.31°N, 16.50°W (2391.0 m 168
a.s.l.) in conjunction with the AERONET program. There is several different 169
types of the Cimel instruments have been used of the 50 sites in this network 170
as follows: (1) logical type CE-318 sunphotometers (440 nm, 675 nm, 870 nm, 171
940 nm, 1020 nm and three 870 nm at the polarization band), (2) numerical 172
type CE-318 sunphotometers (440 nm, 675 nm, 870 nm, 940 nm, 1020 nm 173
and three polarization bands at 870 nm), (3) numerical type CE-318 174
sunphotometers at eight wavelengths (340 nm, 380 nm, 440 nm, 500 nm, 675 175
nm, 870 nm, 940 nm, and 1020 nm), (4) and numerical type CE-318 176
sunphotometers at nine wavelengths (340 nm, 380 nm, 440 nm, 500 nm, 675 177
nm, 870 nm, 940 nm, 1020 nm and 1640 nm). 178
Measurements used to retrieve AODs were at 340 nm, 380 nm, 440 nm, 179
500 nm, 675 nm, 870 nm, 1020 nm, and 1640 nm, while the total precipitable 180
water content was obtained by using those measurements at 940 nm (Holben 181
et al., 1998; Dubovik and King, 2000). The cloud-screened AOD data were 182
calculated by using the ASTPwin software, and extinction Ångström exponents 183
(EAE) were calculated from the instantaneous AODs for wavelengths of 440 184
nm and 870 nm (Che et al., 2009, 2015). Sites with more than three daily AOD 185
https://doi.org/10.5194/acp-2019-405Preprint. Discussion started: 28 May 2019c© Author(s) 2019. CC BY 4.0 License.

7
observations and more than 10 monthly AOD observation days were used to 186
calculate the daily and monthly mean AODs and extinction Ångström 187
exponents. The FMF is described as the fraction of fine mode particles of total 188
AOD440nm (AODfine440 nm/AOD440 nm). 189
190
2.3. Data processing 191
The aerosol microphysical and optical properties, including volume size 192
distributions (dV(r)/dln(r), the total, fine, and coarse mode aerosol effective 193
radii (ReffT, ReffF, and ReffC, respectively) single-scattering albedo (SSA), 194
complex refractive indices, absorption AODs (AAODs), and absorption 195
Angström exponents (AAEs), were retrieved from the observational data from 196
the sky scattering channel of the sunphotometers at 440 nm, 670 nm, 870 nm, 197
1020 nm using the algorithms of Dubovik et al. (2002, 2006). In the process of 198
retrieval, the data of surface albedo (SA) was interpolated or extrapolated to 199
440 nm, 670 nm, 870 nm, and 1020 nm based on the daily MCD43C3 data, a 200
product from the MODIS-Moderate Resolution Imaging Spectroradiometer 201
surface reflectance (https://ladsweb.modaps.eosdis.nasa.gov/). The algorithm 202
used to calculate aerosol volume size distributions (dV/lnr) was under the 203
assumption of a homogeneous distribution of non-spherical particles following 204
the approach of Dubovik (2006). The sphericity fraction retrieved from the 205
inversions is defined as: spherical particles/(spheroidal particles + spherical 206
particles) (Giles et al., 2011). 207
As Dubovik et al. (2002, 2006) defined that all the particles with effective 208
radii < 0.992 μm were considered as fine mode particles; and those > 0.992 209
μm were considered as coarse mode particles. For the total (ReffT), fine (ReffF) 210
and coarse (ReffC) mode aerosols, the effective radii are calculated by the 211
equation as follows: 212
Reff =∫ r3dN(r)
dlnrdlnr
rmaxrmin
∫ r2dN(r)
dlnrdlnr
rmaxrmin
(1) 213
https://doi.org/10.5194/acp-2019-405Preprint. Discussion started: 28 May 2019c© Author(s) 2019. CC BY 4.0 License.

8
Where rmin denotes 0.05, 0.05, 0.992 μm and rmax denotes 15, 0.992, 15 214
μm of the total, fine and coarse mode particles, respectively. 215
The coarse (PVC) and fine aerosol particle volumes distributions (PVF) 216
are calculated according to a bimodal lognormal function descript by Whitby 217
(1978), Shettle and Fenn (1979) and Remer and Kaufman (1998): 218
𝑑𝑉(r)
𝑑lnr= ∑
Cv,𝑖
√2𝜋𝜎𝑖𝑒𝑥𝑝 [−
(𝑙𝑛𝑟−𝑙𝑛𝑟𝑉,𝑖)2
2𝜎𝑖2 ]2
𝑖=1 (2) 219
where Cv,𝑖 means for the volume concentration; 𝑟𝑉,𝑖 means the median 220
radius, and 𝜎𝑖 means the standard deviation. 221
The volume median radius is computed by fine and coarse modes 222
particles as follows: 223
ln𝑟V =∫ ln𝑟
dV(r)
dlnrdlnr
rmaxrmin
∫ dV(r)
dlnrdlnr
rmaxrmin
(3) 224
Then the standard deviation is calculated from the volume median radius: 225
σ𝑉 = √∫ (𝑙𝑛𝑟−𝑙𝑛𝑟𝑉)2𝑑𝑉(𝑟)
𝑑 𝑙𝑛𝑟𝑑 𝑙𝑛𝑟
𝑟𝑚𝑎𝑥𝑟𝑚𝑖𝑛
∫𝑑𝑉(𝑟)
𝑑 𝑙𝑛𝑟𝑑 𝑙𝑛𝑟
𝑟𝑚𝑎𝑥𝑟𝑚𝑖𝑛
(4) 226
The volume concentration (μm3/μm2) is speculated by the following 227
equation: 228
C𝑉 = ∫𝑑𝑉(𝑟)
𝑑 𝑙𝑛𝑟𝑑 𝑙𝑛𝑟
𝑟𝑚𝑎𝑥
𝑟𝑚𝑖𝑛 (5) 229
The SSA was retrieved only for AOD440nm > 0.40; this was done to avoid 230
the larger uncertainty inherent in the lower AOD retrieval according to Dubovik 231
et al. (2002, 2006). The AAOD and AAE for wavelength λ were calculated as 232
follows: 233
AAOD(λ) = [1 − SSA(λ)] × AOD(λ) (6) 234
https://doi.org/10.5194/acp-2019-405Preprint. Discussion started: 28 May 2019c© Author(s) 2019. CC BY 4.0 License.

9
AAE =−dln[AAOD(λ)]
dln(λ) (7) 235
The total AODs’ uncertainty was 0.01 to 0.02 according to Eck et al. 236
(1999). The accuracy of SSA retrieved from AOD440nm > 0.50 with solar zenith 237
angles > 50 was 0.03 (Dubovik et al., 2002). The accuracy of the particle 238
volume size distribution was 15–25% between 0.1 μm r 7.0 μm and 25–100% 239
in conditions of r < 0.1 μm and r >7μm. 240
Direct aerosol radiative effect (DARE in W/m2) was calculated by the 241
radiative transfer module under cloud-free conditions, which is similar to the 242
inversion of AERONET (García et al., 2008; 2012). The DARE at the bottom of 243
the atmosphere (BOA) and the top of the atmosphere (TOA) was defined as 244
the difference in the shortwave radiative fluxes with and without aerosol effects 245
as follows: 246
247
DARE 𝑇𝑂𝐴 = 𝐹𝑇𝑂𝐴↑0 − 𝐹𝑇𝑂𝐴
↑ (8) 248
249
DARE 𝐵𝑂𝐴 = 𝐹𝐵𝑂𝐴↓ − 𝐹𝐵𝑂𝐴
↓0 (9) 250
251
Where F and F0 denoted the broadband fluxes including and excluding 252
aerosols, respectively at the BOA and TOA. The “↑” and “↓”mean the 253
downward fluxes and upward fluxes, respectively. 254
In the radiative transfer module, the absorption and multiple scattering 255
effects are taken into account during flux calculations by the Discrete 256
Ordinates (DISORT) approach (Nakajima and Tanaka, 1988; Stamnes et al., 257
1988). The gaseous distributions and single fixed aerosol vertical distribution 258
(exponential to 1 km) from the multi-layered US standard 1976 atmosphere 259
were used in the radiative flux calculations (García et al., 2008). The error for 260
the observed solar radiation at the surface in global was +2.1 ± 3.0% for an 261
overestimation of about +9 ± 12 Wm-2. The data used in preparing the figures 262
for the present paper have been made available as an Appendix. 263
https://doi.org/10.5194/acp-2019-405Preprint. Discussion started: 28 May 2019c© Author(s) 2019. CC BY 4.0 License.

10
264
3. Results and discussion 265
3.1 Spatial distribution of aerosol microphysical properties 266
A map showing the 50 CARSNET sampling sites and plots of the aerosol 267
volume size distributions (dV/dlnr) at each of the sites is shown in Fig. 1. 268
Generally, the annual mean effective radius of total particles (ReffT) decreased 269
from the inland northwest to the southeastern coastal areas. Furthermore, the 270
volume concentration of total particles was found to be substantially higher at 271
the urban sites. The volume of the coarse mode particles was considerably 272
larger than that of the fine mode particles at the remotes, arid/semi-arid sites 273
and at those sites on the CLP-Chinese Loess Plateau or nearby, indicating that 274
those areas were most strongly affected by larger particles, most likely mineral 275
dust as discussed below. 276
The average (arithmetic mean) ReffT at the remote sites was about 0.47 277
μm with the volume about 0.05 μm3/μm2 (Table 1). A large ReffT (0.64 μm) was 278
found at Lhasa, and the total aerosol volume there was 0.05 μm3/μm2. These 279
results are consistent with those reports by Li et al. (2018) who found high 280
levels of coarse mode particles at Lhasa due to the presence of mineral dust. 281
The two other remote sites, Akedala and Shangri-La, had smaller average ReffT 282
values than Lhasa (0.36 and 0.39 μm, respectively), and corresponding 283
volumes were 0.06 and 0.03 μm3/μm2. The average fine-mode effective radius 284
(ReffF) was 0.14 μm at the remote sites, and fine-mode particle fractional 285
volume (PVF) was 0.01 μm3/μm2, while the average coarse-mode effective 286
radii (ReffC) was 2.35 μm and the coarse-mode fractional volume (PVC) was 287
0.03 μm3/μm2. These findings indicated that the contribution of coarse-mode 288
particles to the total volume of aerosol was larger at the remote sites. A study 289
by Cong et al. (2009) at the remote Nam Co site on the Tibetan Plateau 290
showed that dust particles mainly affected the site in spring, while 291
anthropogenic aerosols were prevalent in the summer. 292
The average ReffT at the arid and semi-arid sites (0.55 μm) was larger than 293
https://doi.org/10.5194/acp-2019-405Preprint. Discussion started: 28 May 2019c© Author(s) 2019. CC BY 4.0 License.

11
at the remote sites, and the total volume of aerosols at the arid/semi-arid sites 294
also was large (0.14 μm3/μm2), nearly three times that at the remote sites. 295
Large ReffT values (0.71 μm) were found at Tazhong, which is near the 296
northwestern deserts, and the aerosol volume there also was high, 0.30 297
μm3/μm2. Large PVC’s were found at the arid/semi-arid sites (0.05–0.27 298
μm3/μm2). The arithmetic mean ReffT (0.49 μm) at the rural sites on or near the 299
CLP had total aerosol volumes (0.15 μm3/μm2) similar to those at the 300
arid/semi-arid sites. These results also show a major contribution to the 301
aerosol volumes by coarse-mode particles at the sites in or near the mineral 302
dust source regions. Bi et al. (2011) similarly found that coarse particles 303
dominated the volume-size distribution at the Semi-Arid Climate and 304
Environment Observatory of Lanzhou University (SACOL) on the CLP. 305
Small ReffT values (0.33 μm) were found at the rural sites in eastern China, 306
and relatively high aerosol volumes were observed there (0.18 μm3/μm2). In 307
the Yangtze River Delta (YRD) region, the ReffF was large range for 0.16–0.17 308
μm, and the PVF’s were 0.12–0.13 μm3/μm2. At the Mt. Longfeng background 309
site in northeastern China, the total particle volume was low (0.08 μm3/μm2), 310
which is consistent with minimal anthropogenic influences and low aerosol 311
loadings. Compared with the other sites, the urban areas had relatively low 312
coarse mode aerosol concentrations, but small particles were plentiful—the 313
average ReffT was 0.37 μm and total volume was high at 0.21 μm3/μm2. The 314
average ReffF of fine-mode particles at the urban sites was 0.16 μm with a PVF 315
of 0.10 μm3/μm2 while the ReffC was 2.22 μm and PVC was 0.11 μm3/μm2. 316
The effective radii and PVF values showed strong relationships with 317
population density and vehicle emissions at the urban sites. High volumes of 318
fine mode particles occurred at the northeastern urban site of Shenyang (ReffT 319
= 0.16 μm, PVF = 0.12 μm3/μm2); at major cities in northern China, including 320
Shijiazhuang (ReffT = 0.16 μm, PVF = 0.12 μm3/μm2) and Zhengzhou (ReffT = 321
0.18 μm, PVF = 0.12 μm3/μm2); at Chengdu, a city in the Sichuan Basin of 322
(ReffT = 0.21 μm, PVF = 0.16 μm3/μm2); and at the urban regions of Nanning 323
https://doi.org/10.5194/acp-2019-405Preprint. Discussion started: 28 May 2019c© Author(s) 2019. CC BY 4.0 License.
12
(ReffT = 0.18 μm, PVF = 0.13 μm3/μm2) and Panyu (ReffT = 0.16 μm, PVF = 0.10 324
μm3/μm2) in southern China. Overall, these results show that the volumes of 325
fine-mode particles increased at the urban sites where anthropogenic 326
influences were most apparent. 327
Cheng et al. (2015) found different aerosol volume size distributions for 328
dust and sea salt at Shanghai in the eastern China, and they showed that their 329
relative abundances varied with season and in response to local or long-range 330
transport. Zhao et al. (2018) also reported the influence of sea salt aerosol on 331
the coast of northeastern China. Che et al. (2018) found that aerosol 332
hygroscopicity affected the aerosol microphysical properties in the YRD region. 333
These findings suggest that the hygroscopic growth of fine-mode particles can 334
affect aerosol microphysical properties and that differences in climatic 335
conditions could lead to geographically variable effects. 336
337
3.2 Spatial distributions of AOD and EAE 338
The spatial distributions of AOD440 nm and EAE440-870 nm are shown in Fig. 2. 339
The AOD440nm increased from the remote/rural sites to the urban sites, and as 340
one might expect, the remote sites were the least affected by particle 341
emissions and had the lowest aerosol loadings. For example, the AOD440nm at 342
the remote stations was low and had an average value of 0.12. The Lhasa and 343
Shangri-La sites on the Tibetan Plateau had similar average AOD440nm values 344
of 0.10. These phenomenons are similar to the study of Li et al. (2018), who 345
showed clean air conditions at Lhasa with AOD < 0.1. Cong et al. (2007, 2009) 346
also found a low AOD (0.05) at Nam Co, which was comparable to the 347
background levels at other remote sites. 348
The AOD440nm’s at the arid/semi-arid sites and those on or near the Loess 349
Plateau ranged from 0.32–0.42, which is higher than at the remote sites. The 350
high AOD440nm at Tazhong (0.60), which is near the deserts in northwestern 351
China was likely due to the large aerosol volume of 0.30 μm3/μm2 (section 3.1) 352
caused by mineral dust. Indeed, arid and semi-arid regions in northwestern 353
https://doi.org/10.5194/acp-2019-405Preprint. Discussion started: 28 May 2019c© Author(s) 2019. CC BY 4.0 License.

13
China are important sources of aeolian dust on a global scale (Bi et al., 2011). 354
Li et al. (2012) showed that the contribution of dust to the average AOD at 355
SACOL near Lanzhou was 28.4%. Other sites that showed large AOD440nm 356
include regions with strong anthropogenic influences, such as Dengfeng (0.79) 357
on the North China Plain, Huimin (0.83) in the YRD (0.83 to 0.87) and Huainan 358
( 0.91) in the Guanzhong Plain. 359
Compared with the sites just discussed, lower AOD440nm’s were found at 360
the Mt. Longfeng background station of the Northeast China Plain (0.34), the 361
semi-arid rural site as Tongyu in northeastern China (0.23), and the clean 362
Xiyong site in southern China (0.41). Zhu et al. (2014) found a low AOD of 0.28 363
at the North China Plain regional background site. Che et al. (2009c) have 364
pointed out that the large AOD at Lin’an was likely affected by the high aerosol 365
loadings in YRD Region. Among the urban sites in China, large AOD440nm’s 366
were found in the cities with strong influences of anthropogenic activities, such 367
as the Northeastern Plain (Shenyang 0.89), North China Plain (Zhengzhou 368
0.99), YRD region (Wuhan 1.00) and Sichuan Basin (Chengdu 1.17); the 369
average value for these sites was 0.79. Lower AOD440nm’s, that is < 0.50, 370
occurred at remote sites in northwestern China, including Urumqi (0.42), 371
Yinchuan (0.37); those sites are affected less by industrial activities and the 372
population densities are lower compared with the sites in northern or eastern 373
China. 374
It is worth noting that the particle emissions in and around the urban sites 375
could lead to large optical extinctions due to hygroscopic aerosol growth, 376
especially in summer when the relative humidity is often high. In a related 377
study, Zhang et al. (2018) found a large AOD of 1.10 at Wuhan in central China 378
and that was linked to secondary aerosol formation under the high 379
summertime temperatures. Li et al. (2015) similarly concluded that high 380
temperature and humidity promoted the formation of fine particles and led to 381
hygroscopic aerosol growth at Nanjing. Qin et al. (2017) observed a high 382
AOD500 nm of 1.04 at Shijiazhuang and related this to the hygroscopic growth of 383
https://doi.org/10.5194/acp-2019-405Preprint. Discussion started: 28 May 2019c© Author(s) 2019. CC BY 4.0 License.
14
aerosol fine-mode particles during polluted days. 384
Clear spatial variability in EAE values over China is evident in Fig. 3, and 385
at the remote sites, the average EAEs were 1.03. The EAE at Lhasa (0.77) 386
was lower than at Akedala (EAE = 1.13), which is in an arid region of central 387
Asia, or at Shangri-La (EAE = 1.19) in Tibet. The average coarse-mode 388
average effective radii (ReffC) at Lhasa was 2.26 μm and the fractional volume 389
was 0.04 μm3/μm2, this result suggests the major components of the large 390
mineral dust particles in aerosol populations over that region. The smaller 391
sphericity fraction (~42.70) and lower FMF (0.66) at Lhasa indications the 392
presence of non-spherical aerosol coarse particles compared with the 393
spherical fine particles in the urban sites. 394
At the arid and semi-arid sites in China, the average EAE value (0.71) was 395
relatively low and the FMF also was low (0.58). The EAE was extremely low at 396
Tazhong (0.25), which is in the Takliman Desert in the Xinjiang Uygur 397
Autonomous Region of northwestern China and the sphericity fraction (12.87) 398
and FMF (0.35) there were lower compared with most of the other sites. This 399
finding indicates a strong contribution of large particles in this desert region 400
consistent with large volume of the coarse-mode particles (0.27 μm3/μm2) 401
noted in section 3.1. The average EAE reached 0.93 at the rural sites near the 402
CLP, and the average value of FMF for those sites was 0.73. Eck et al. (2005) 403
found especially low EAE values in March and April (0.3 and 0.4, respectively) 404
at Yulin, China, where the dust aerosol dominated the optical column. 405
Large EAEs (1.23) were found at the sites in eastern China, and the FMFs 406
also were large (0.89) at those sites. This result can be attributed to the strong 407
impacts of anthropogenic in the more urbanized eastern part of the country. On 408
the other hand, large EAE values also occurred at the clean sites in 409
northeastern China, including Mt. Longfeng (1.38), where the sphericity 410
fraction was 58.5 and the FMF 0.90. This shows that small particles can have 411
stronger effects in these areas relative to some other regions of China. The 412
EAE at Lin’an was larger than that at Shangdianzi in the Northern Plain or 413
https://doi.org/10.5194/acp-2019-405Preprint. Discussion started: 28 May 2019c© Author(s) 2019. CC BY 4.0 License.

15
Longfengshan in Northeastern China for most months according to data from 414
Che et al. (2009c). At the urban sites, large EAEs were found at sites in 415
southern China, including Nanning (EAE = 1.36, sphericity fraction = 70.12, 416
FMF = 0.95), Panyu (EAE = 1.43, sphericity fraction = 75.55, FMF = 0.93) and 417
Zhuzilin (EAE = 1.45, sphericity fraction = 55.51, FMF = 0.94). This is likely 418
because the large populations and widespread vehicle ownership in those 419
cities led to the dominance of fine-mode particles throughout the year. Cheng 420
et al. (2015) found a uni-modal distribution of EAE centered in 1.1–1.6 with the 421
occurrence frequency about 72%, which indicated an abundance of fine 422
primary particles at Shanghai in eastern China. At the urban Nanjing site, 423
which is in east-central China, small particles were dominant, and the annual 424
average EAE was 1.21 ± 0.28 (Li et al., 2015). 425
426
3.3 Spatial distribution of aerosol single-scattering albedo 427
The spatial distribution of SSA at 440 nm of the 50 CARSNET stations is 428
shown in Fig. 4. As a frame of reference, Eck et al. (2005) reported that that 429
SSA440nm from the AERONET retrievals were 0.82 to 0.98 globally. We note 430
that SSA440nm values in this range reflect slightly to strongly absorbing aerosols, 431
and these particles originate from a multitude of sources (Che et al., 2018). 432
The SSA440nm’s decreased from remote/rural to the urban sites and from west 433
to east, which means that there were higher percentages of absorbing 434
particles at the urban and eastern stations. The average SSA440nm at the 435
remote sites was about 0.91, which is indicative of particles with moderate 436
absorption. The absorbing aerosols at the remote sites were more than likely 437
mineral dust particles because those sites are less likely to be affected by 438
carbonaceous particles, which also are absorbing, but mainly produced by 439
anthropogenic activities. The SSA440nm’s for the arid and semi-arid sites were 440
0.89. The relatively high SSA at Tazhong (0.92) was probably due to slightly 441
absorbing, coarse mode dust particles (EAE 0.25). 442
A study by Bi et al. (2011) showed that SSAs increased slightly with 443
https://doi.org/10.5194/acp-2019-405Preprint. Discussion started: 28 May 2019c© Author(s) 2019. CC BY 4.0 License.

16
wavelength when dust was present at the SACOL site. Moderately absorbing 444
particles were found in our study on or near the Chinese Loess Plateau where 445
the SSA440nm’s were typically 0.88 to 0.89. Eck et al. (2005) concluded that the 446
spectral SSA demonstrated effects of dust at Yulin because the SSA increased 447
for wavelengths from 440 to 675 nm. At the rural sites in eastern China, large 448
SSA440nm’s mainly occurred at sites in the YRD affected anthropogenic 449
influences; these include Tonglu (0.93), Xiaoshan (0.93), Xiyong (0.94). Che et 450
al. (2018) found the slightly absorbing particles came from industrial activity 451
and anthropogenic sources at YRD region with the SSA440 nm between 0.91 to 452
0.94. 453
The average value of SSA440nm at the urban sites was 0.90, which 454
indicates that particles with moderate absorption dominated the aerosol 455
populations. Cheng et al. (2015) reported a seasonal range of SSA from 0.88 456
to 0.91 at Shanghai, with higher values in autumn and winter compared with 457
spring and summer. Lower SSA440nm’s occurred at the urban sites and 458
industrial regions in northeastern China, such as Shenyang (0.84), Anshan 459
(0.89), Fuhsun (0.84), which indicates that the particles were more strongly 460
absorbing in that region. On the other hand, higher SSA440n’s were found at 461
urban sites in southern China, including Nanning (0.92), Panyu (0.90) and 462
Zhuzilin (0.96), and this indicates that the particles at those sites were slightly 463
or weakly absorbing. 464
Moreover, we found that the SSA440nm spatial distribution reflected the 465
percentages of absorbing aerosols at the urban sites both in northern and 466
eastern China. The reports of Dubovik et al. (2000, 2002, 2006) showed that 467
SSA values vary with both particle size and composition, and Su et al. (2017) 468
used the variations in SSA with wavelength to indicate the presence of brown 469
carbon aerosols at Tianjin, a coastal megacity in China. Qin et al. (2017) 470
suggested that the small SSAs found at Shijiazhuang indicated the presence 471
of fine-mode absorbing particles, such as brown carbon. Zhuang et al. (2014) 472
reported that the SSA at the Nanjing urban site ranged from 0.90 to 0.95, and 473
https://doi.org/10.5194/acp-2019-405Preprint. Discussion started: 28 May 2019c© Author(s) 2019. CC BY 4.0 License.

17
the aerosol was more absorbing in fall, possibly due to the biomass burning 474
emission in the YRD. As evident in the results presented in section 3.1, one 475
can see that the ReffT, ReffF and ReffC between northeastern and southern China 476
was very similar. For example, at Shenyang, a megacity in northeastern China, 477
the effective radii of total, fine- and coarse-mode particles were 0.31, 0.16, 478
2.23 μm and the corresponding volumes were 0.22, 0.12, 0.10 μm3/μm2, 479
respectively. At Hangzhou in the YRD region, the ReffT, ReffF and ReffC were 0.30, 480
0.17, 2.21 μm with the volumes about 0.22, 0.12, 0.10 μm3/μm2, respectively. 481
Therefore, the different SSA440nm distributions in the two regions may be 482
attributed by the special aerosol composition. 483
Dust aerosols with light-absorbing occur more frequently in spring in 484
northeastern China than in more southern regions (Zhao et al., 2018). 485
Anthropogenic emissions from seasonal biomass burning and residential 486
heating are two other main factors that affect aerosol composition between the 487
two regions (Che et al., 2018). Especially in winter, there was high percentage 488
of absorbing aerosols at the northeastern sites, and that was more than likely 489
caused by emissions of carbonaceous aerosol from residential heating (Zhao 490
et al., 2015). Climatic conditions are also the main factors affecting the 491
absorption characteristics of aerosols in different regions of north and south 492
China. The increased light scattering could well be due to the particles 493
hygroscopic growth demonstrated in other studies. For example, Mai et al. 494
(2018) found that AODs and SSAs both increased with relative humidity at 495
Guangdong in the PRD region, which suggests that condensational growth 496
can affect the aerosol optical properties. 497
498
3.4 Spatial distributions of absorption aerosol optical depth (AAOD) 499
The spatial distribution of AAOD at 440 nm shown as Fig. 5 indicates that 500
overall, the AAOD440nm’s increased from north to south and from remote/rural 501
to urban sites. Lower AAOD440nm’s were found at the remote stations, where 502
the average value was 0.01. The AAOD440nm at Akedala, a remote site in 503
https://doi.org/10.5194/acp-2019-405Preprint. Discussion started: 28 May 2019c© Author(s) 2019. CC BY 4.0 License.

18
northwestern China, was 0.02, and that was higher than at Shangri-La or 504
Lhasa (0.01), both of which are on the Tibetan Plateau. The low AAOD440nm’s 505
throughout that region indicates that the aerosol population was not strongly 506
absorbing. Compared with these three sites, the average AAOD440nm’s at the 507
arid and semi-arid sites were higher (0.03); for example, an AAOD440nm of 508
0.05was found at Tazhong, which is adjacent to the desert, and that indicates 509
that the aerosol particles were more absorbing. As discussed in sections 3.2 510
and 3.3, dust aerosols likely make a significant contribution to aerosol light 511
absorption in the areas impacted by the deserts. 512
The low AAOD440nm found at Xilinhot (0.02) was probably due to the low 513
aerosol loadings (AOD440nm = 0.21) in this region. The AAOD440nm’s at the Mt. 514
Gaolan and Yulin rural sites which on or around the CLP were about 0.04 and 515
0.03, respectively, and the particles were moderately absorbing (SSA = 0.89). 516
The large AAOD440nm at Datong (0.09) can be explained by the high AOD440nm 517
(0.58) there. Indeed, large AAOD440nm’s were found at rural sites in eastern 518
China, where there were high AODs and low SSAs as noted in sections 3.2 519
and 3.3. Of these sites, Dengfeng (AOD440nm = 0.08) and Huimin (AOD440nm = 520
0.08) are located on the North China Plain, while Huainan (AOD440nm = 0.10) is 521
on the Guanzhong Plain. Lower AAOD440nm’s, from 0.02–0.03, occurred at 522
Tongyu (0.03), which is at a semi-arid region in northeastern China, at the Mt. 523
Longfeng (0.03) regional background site on the Northeast China Plain, at the 524
Yushe rural site in northern China (0.03), and at the clean Xiyong site in the 525
PRD (0.02). 526
Several urban sites showed AAOD440nm values greater than 0.10; these 527
include Fushun (0.11) and Shenyang (0.14) in the northeastern China, 528
Lanzhou (0.10) in the northwestern China, and Nanjing (0.10) and Wuhan 529
(0.11) in the eastern China. Lower AAOD440nm’s occurred in other urban areas, 530
such as Yinchuan (AAOD440nm = 0.02, AOD440nm = 0.37) in the northwest and 531
Zhuzilin (AAOD440nm = 0.03, AOD440nm = 0.66) in the PRD; both of these sites 532
had relatively low AOD440’s indicating weaker anthropogenic influences 533
https://doi.org/10.5194/acp-2019-405Preprint. Discussion started: 28 May 2019c© Author(s) 2019. CC BY 4.0 License.

19
compared with metropolitan regions of some other areas. We note that there 534
are significant uncertainties in relating aerosol absorbing properties to particle 535
types, such as black carbon, organic matter, as well as mineral dust (Russell et 536
al., 2010; Giles et al., 2012). Nonetheless, the information presented here on 537
the spatial distribution of AAODs over China may be useful for the further 538
investigations into the relationships between light absorption and particle type 539
(Liu et al., 2017; Schuster et al., 2016a, 2016b). 540
541
3.5 Spatial distribution of aerosol direct radiative effect at the Earth’s 542
surface and top of the atmosphere 543
The spatial distributions of the DAREs calculated for both the bottom and 544
top of the atmosphere are shown in Fig. 6. Overall, the DARE-BOAs increased 545
from northwest to southeast and from rural to urban sites, consistent with 546
impacts from the densely populated regions around the sites. The average 547
DARE-BOA at the remote sites was -24.40 W/m2, and in comparison, a higher 548
DARE-BOA (-33.65 W/m2) occurred at Akedala, which occurred on a remote 549
region of northwestern China. The AOD440nm at Akedala was relatively low 550
(0.17) and the SSA moderate (0.90). The moderate absorption of aerosol could 551
lead to more strong surface cooling effects with little higher DARE-BOA than 552
the other remote sites. The DARE-BOAs for Lhasa and Shangri-La were 553
-22.13 and -17.43, respectively. These results indicate weaker surface cooling 554
effects at the remote sites relative to other regions because the aerosol 555
loadings were relatively low, as indicated by AOD440nm’s < 0.20. 556
The average DARE-BOTs at the arid and semi-arid sites of China were 557
about -56.43 W/m2, and those high DARE-BOAs can be explained by the 558
moderately absorbing particles (SSA = 0.89) and large AOD440nm’s (0.32) 559
compared with the remote sites. A large DARE-BOA (-91.20 W/m2) occurred at 560
the Tazhong site near the northwestern deserts, and there, the high AOD (0.60) 561
and the slight absorption of mineral dust (SSA = 0.92) imply substantial surface 562
cooling. The average DARE-BOA for rural sites on the Chinese Loess Plateau 563
https://doi.org/10.5194/acp-2019-405Preprint. Discussion started: 28 May 2019c© Author(s) 2019. CC BY 4.0 License.

20
or surrounding was -74.67 W/m2, and that also implies cooling at the surface. 564
Several rural sites in northern and eastern China had large DARE-BOA 565
values; these include Huimin (-111.58 W/m2), Dengfeng (-104.78 W/m2) and 566
Huainan (-129.17 W/m2), and at those sites the AODs were high, from 0.80–567
0.90, and the SSAs were ~0.89. These results show stronger surface cooling 568
effects at sites influenced by anthropogenic emissions compared with the 569
remote sites or those near the deserts. The large negative DARE-BOA values 570
(-103.28 W/m2) at the urban sites indicate that the combination of high 571
AOD440nm’s (0.79) and moderate SSAs (0.90) can cause significant surface 572
cooling. Indeed, anthropogenic emissions presumably led to the high 573
DARE-BOAs at urban sites, including Shenyang (-144.88 W/m2) and Fushun 574
(-116.91 W/m2) in the Northeastern Plain, Xian in the Guanzhong Plain 575
(-132.55 W/m2), Chengdu in the Sichuan Basin (-110.42 W/m2), Lanzhou in the 576
western region (-126.17 W/m2), and Nanjing (-143.38 W/m2) and Wuhan 577
(-171.80 W/m2) in the YRD. These results indicate that anthropogenic aerosols 578
can cause significant direct radiative effects at urban sites. 579
The DARE-TOAs increased from north to south and from rural to urban 580
sites, and the average DARE-TOA for the remote stations was low, about -4.79 581
W/m2 (Fig. 7). The DARE-TOAs at Lhasa and Shangri-La were -5.04 W/m2 582
and -8.93 W/m2, respectively. A notably small DARE-TOA was found at 583
Akedala (0.42 W/m2), indicating that the effects of the aerosol on the 584
temperature of earth-atmosphere system there would be weak. The average 585
DARE-TOA at the arid and semi-arid sites was -10.17 W/m2. The large 586
DARE-TOA found at Tazhong (-23.49 W/m2) could represent the larger 587
contribution of slightly absorbing mineral aerosols (SSA 0.92) and a large AOD 588
(0.60); this indicates more cooling at surface through the absorption and 589
scattering solar radiation compared with the less impacted sites. This is 590
consistent with the results for Tazhong discussed in section 3.1 which showed 591
high volumes of coarse mode particles with large radii. 592
The average DARE-TOA at rural sites on the Chinese Loess Plateau or 593
https://doi.org/10.5194/acp-2019-405Preprint. Discussion started: 28 May 2019c© Author(s) 2019. CC BY 4.0 License.
21
nearby was about -14.56 W/m2. Although the SSA440nm were close to Gaolan 594
and Yulin about 0.89, the TOAs were quite different (Mt. Gaolan -20.87 W/m2; 595
Yulin -9.09 W/m2) which could be due to the different AOD440nm about 0.36 and 596
0.32, respectively. In rural eastern China, the DARE-TOA was about -32.40 597
W/m2, and to put this in context, Che et al. (2018) found that DARE-TOAs of 598
−40 W/m2 at rural sites in the YRD region, which is indicative of a relatively 599
strong cooling effect. Low DARE-TOAs were found at the Mt. Longfeng rural 600
site in northeastern China (DARE-TOA = -11.34, AOD440nm = 0.34, SSA = 0.89) 601
and at the Tongyu semi-arid site in northeastern China as (DARE-TOA = -8.87, 602
AOD440nm = 0.23, SSA = 0.88 ) where the aerosol loadings were relatively low 603
and the absorption was moderate. 604
In the urban sites at central and eastern China, the average DARE-TOA 605
values were about -30.05 W/m2. Higher DARE-TOAs occurred at Anshan in 606
the Northeastern Plain (-39.66 W/m2), Chengdu in the Sichuan Basin as 607
(-52.21 W/m2), Hangzhou in the YRD (-40.16 W/m2), Jiaozuo (-39.35 W/m2) 608
and Zhengzhou (-46.18 W/m2) in the North China Plain, and Zhuzilin (-40.15 609
W/m2) in the PRD region. The high DARE-TOA values at these urban sites 610
imply relatively strong cooling effects due to moderate to strong light 611
absorption by the particles. 612
613
3.6 Spatial distributions of aerosol mixing properties 614
The spatial distribution of aerosol mixing properties (Figure 8) was 615
obtained by using the SSA440nm, FMF, and EAE results to classify the particles 616
based on size and absorbing properties. In previous studies by Zheng et al. 617
(2017) and Che et al. (2018), the particles in this study were grouped into eight 618
types as Table 2 show. Moreover, the FMF has been provided to give the 619
particle size information in the group of the particles. 620
At the remote Akedala and Lhasa sites (FMF = 0.70–0.78 and SSA440nm = 621
0.85), the percentages of mixed absorbing particles (Type V) were 35-40%, 622
while at Shangri-la (FMF = 0.76, SSA440nm = 0.84), the percentage was slightly 623
https://doi.org/10.5194/acp-2019-405Preprint. Discussion started: 28 May 2019c© Author(s) 2019. CC BY 4.0 License.

22
lower, 24.62%. The characteristics of the particles at these remote, 624
high-altitude sites were probably affected by the rugged topography which 625
would promote particle mixing. The proportion of coarse mode, mainly dust, 626
particles with moderate to strong absorption (Group VII) was highest at the arid 627
and semi-arid sites. The percent abundances of Group VII particles were 57.90% 628
at Dunhuang (AE = 0.26, SSA440nm = 0.85, FMF = 0.43) and 58.52% at 629
Tazhong (AE = 0.20, SSA 440nm= 0.87, FMF = 0.37), respectively. Mixed 630
absorbing particles (Type V) and strongly absorbing dust particles (Group VII) 631
accounted for 30 to 70% of the aerosol in the rural sites on or near the CLP. 632
The percentages of mixed absorbing particles (Type V) at Gaolan, Yulin, and 633
Datong were 31.98%, 45.22% and 29.04%, respectively, and the average 634
FMFs at those sites ranged from 0.70–0.76. 635
The proportions of the coarse-mode aerosols with strongly absorbing in 636
Group VII were about 35.23% at Gaolan and 21.21% at Yulin, which was 637
mainly dust particles with the FMFs at those sites were 0.43 and 0.48, 638
respectively. The proportion of coarse-mode particles with strongly absorbing 639
in Group VII and coarse-mode particles with weakly-absorbing in Group VIII at 640
the rural sites in eastern China were < 11%. These patterns indicated that the 641
differences in the eastern region from northwestern China because in the east, 642
coarse-mode particles have only a minor contribution to aerosol absorption. 643
The percentage of fine-mode particles with weakly-absorbing in Type IV and 644
mixed absorbing particles in Type V combined about ~50% at the eastern sites. 645
This result suggests that mixed aerosols originated from a variety of sources 646
and that many of the sites were affected by anthropogenic emissions from 647
megacities upwind. 648
The fine-mode particles with absorbing in Types I, II, III and V accounted 649
for 50 to 90% at most of the urban sites. The percentages of these four particle 650
types combined were especially large in eastern China; for example, at Panyu, 651
particle Types I—IV composed 90.83% of the total, and the FMF there was 652
0.90–0.94, while at Zhuzilin, the percentage of Types I–IV was 92.55%, and 653
https://doi.org/10.5194/acp-2019-405Preprint. Discussion started: 28 May 2019c© Author(s) 2019. CC BY 4.0 License.

23
the FMF was 0.92–0.94. These results are another indication that fine-mode 654
particles are important for light absorption in urban areas. In contrast, the 655
Lanzhou and Urumqi urban sites were less affected by absorbing fine-particles 656
because the percentages of Type I–IV particles were only 19.73% and 18.36%, 657
respectively. The mixed absorbing Type V particles accounted for large 658
percentages of the total at Lanzhou (48.80%, EAE = 0.88, SSA = 0.82, FMF = 659
0.73) and at Urumqi (59.39%, EAE = 0.94, SSA = 0.84, FMF = 0.75). Different 660
from the other urban sites, these patterns show that larger particles had 661
significant contributions to the aerosol absorption at these two northwestern 662
sites. 663
664
4. Conclusions 665
Aerosol microphysical and its optical properties obtained from the 666
ground-based sunphotometer deployed at 50 CARSNET stations were used to 667
begin the development of their climatology characteristics and to investigate 668
potential aerosol-climate effects over vast area of China. Direct aerosol 669
radiative effects (DAREs) at the bottom and at the top of the atmosphere were 670
calculated, and eight types of aerosols were classified based on the particle 671
size and absorbing properties. The annual mean values of the ReffT 672
decreased from the arid and semi-arid sites (0.55 μm) to the urban sites (0.37 673
μm). The aerosol volumes increased from the remote sites (0.05 μm3/μm2) to 674
the urban sites (0.21 μm3/μm2). The volumes of coarse-mode particle were 675
larger than those for the fine mode at the remote and arid/semi-arid sites—this 676
can be explained by the greater relative abundances of mineral dust compared 677
with pollution-derived particles at those sites. At the urban sites, where 678
anthropogenic influences were relatively strong, the proportion of fine mode 679
particles increased gradually with aerosol volume. 680
The AOD440nm progressively increased from the remote sites (0.12) to the 681
arid and semi-arid sites (0.32) to rural sites in eastern China (0.70) and finally 682
to the urban sites (0.79), which were the ones most strongly affected by 683
https://doi.org/10.5194/acp-2019-405Preprint. Discussion started: 28 May 2019c© Author(s) 2019. CC BY 4.0 License.

24
anthropogenic activities. The average EAE440-870 nm’s at the arid and semi-arid 684
sites were relatively low (0.71), which indicates an important contribution of 685
larger particles to the aerosol extinction in those regions. The consistently 686
large EAE440-870 nm’s at the urban sites (> 1.20) and the high FMFs that those 687
site (0.88) are the evidence that fine mode particles are prevalent throughout 688
year. The average SSA440nm’s at the remote, rural, and urban sites were 689
relatively similar, averaging about 0.89, and this indicates the particles were 690
moderately absorbing. 691
Overall, dust aerosols with light-absorbing in spring and emissions came 692
from biomass burning and residential heating during the colder months were 693
the main factors that led to spatial differences in the percentages of absorbing 694
aerosols over China. The AAOD440nm’s increased from the remote sites (0.01) 695
to the arid and semi-arid sites (0.03) to the rural sites of eastern China (0.05) 696
and finally to the urban sites (0.07). High AAOD440nm’s were caused by 697
light-absorbing dust aerosols at the rural sites and by the strong anthropogenic 698
emissions in the metropolitan areas. The spatial patterns in the absorbing 699
aerosols were not only affected by the chemical composition of aerosol, but 700
also by physical effects imposed by topography, weather, and climate. 701
The average DARE-BOA values were -24.40 W/m2 at the remote sites; 702
-56.43 W/m2 at the arid and semi-arid sites; -74.67 W/m2 at the sites on the 703
CLP or nearby; -85.25 W/m2 at the rural sites in eastern China; and -103.28 704
W/m2 at the urban sites. The larger DARE-BOA values at the urban sites imply 705
stronger cooling effects from anthropogenic emissions compared with those 706
from mineral dust at the remote sites or those near the desert. Moreover, larger 707
DARE-TOA’s also occurred at the urban sites (-30.05 W/m2), which indicates 708
strong cooling effects due to the large aerosol extinctions between the 709
earth-atmosphere system displayed the moderate to strong light absorption. 710
Mixed-absorbing particles were the most abundant aerosol type in the remote 711
and rural sites on or near the Chinese Loess Plateau and in eastern China. 712
Mineral dust particles with moderate to strong absorbing were dominant in the 713
https://doi.org/10.5194/acp-2019-405Preprint. Discussion started: 28 May 2019c© Author(s) 2019. CC BY 4.0 License.

25
arid and semi-arid sites while absorbing fine-mode particles accounted for 50 714
to 90% of the aerosol at the most urban sites. 715
The results of the study have considerable value for ground truthing 716
satellite observations and for validating aerosol models. Moreover, the results 717
also have provided significant information on aerosol optical and radiative 718
properties for different types of sites covering a broad expanse of China. 719
These results also are a major step towards developing a climatology for 720
aerosol microphysical and optical properties for China and even East Asia. 721
Data availability: 722
The detailed CARSNET AOD dataset used in the study can be requested 723
by contacting the corresponding author. 724
Competing interests. 725
The authors declare that they have no conflict of interest. 726
Author contribution: 727
All authors contributed to shaping up the ideas and reviewing the paper. 728
HC, XX and XZ designed and implemented the research, as well as prepared 729
the manuscript; HC, HZ,YW and HW contributed to analysis of the CARSNET 730
dataset; HC, XX, JZ, OD, BNH, PG, and ECA contributed to the CARSNET 731
data retrieval; HC, BQ, WG, HY, RZ, LY, JC, YZ, KG, and XZ carried out the 732
CARSNET observations; OD, BNH, PG, and ECA provided constructive 733
comments on this research. 734
Acknowledgments 735
This work was supported by grants from the National Science Fund for 736
Distinguished Young Scholars (41825011), the National Key R & D Program 737
Pilot Projects of China (2016YFA0601901), National Natural Science 738
Foundation of China (41590874), the CAMS Basis Research Project 739
(2017Z011), the European Union Seventh Framework Programme 740
(FP7/2007-2013) under grant agreement no. 262254. AERONET-Europe 741
ACTRIS-2 program, European Union’s Horizon 2020 research and innovation 742
programme under grant agreement No 654109. 743
https://doi.org/10.5194/acp-2019-405Preprint. Discussion started: 28 May 2019c© Author(s) 2019. CC BY 4.0 License.
26
744
References 745
Bi, J.R., Huang, J.P., Fu, Q., Wang, X., Shi, J.S., Zhang, W., Huang, Z.W., and 746
Zhang, B.D.: Toward characterization of the aerosol optical properties 747
over Loess Plateau of Northwestern China, Journal of Quantitative 748
Spectroscopy and Radiative Transfer, 112, 346-360, 749
https://doi.org/10.1016/j.jqsrt.2010.09.006, 2011. 750
Bokoye, A.I., Royer, A., O’Neill, N.T., Cliche, P., Fedosejevs, G., Teillet, P.M., 751
and Mcarthur, L.J.B.: Characterization of atmospheric aerosols across 752
Canada from a Ground-based sun photometer network: Aerocan, Atmos. 753
Ocean., 39, 429–456, https://doi.org/10.1080/07055900.2001.9649687, 754
2001. 755
Breon, F., Tanré, D., and Generoso, S.: Aerosols effect on the cloud droplet 756
size monitored from satellite, Science, 295, 834-838, 757
https://doi.org/10.1126/science.1066434, 2002. 758
Cao, J.J., Lee, S.C., Chow, J.C., Watson, J.G., Ho, K.F., Zhang, R.J., Jin, Z.D., 759
Shen, Z.X., Chen, G.C., Kang, Y.M., Zou, S.C., Zhang, L.Z., Qi, S.H., Dai, 760
M.H, Cheng, Y., and Hu, K.: Spatial and seasonal distributions of 761
carbonaceous aerosols over China, J. Geophys. Res., 112, D22S11. 762
http://dx.doi.org/10.1029/2006JD008205, 2007. 763
Charlson, R. J., Schwartz, S. E., Hales, J. M., Cess, D., Coakley, J. A., and 764
Hansen, J. E.: Climate forcing by anthropogenic aerosols, Science, 255, 765
423–430, https://doi.org/10.1126/science.255.5043.423, 1992. 766
Che, H.Z., Shi, G.Y., Zhang, X.Y., Arimoto, R., Zhao, J.Q., Xu, L., Wang, B., 767
and Chen, Z.H.: Analysis of 40 years of solar radiation data from China, 768
1961-2000, Geophysical Research Letters, 32, L06803, 769
https://doi.org/10.1029/2004GL022322, 2005. 770
Che, H., Shi, G., Uchiyama, A., Yamazaki, A., Chen, H., Goloub, P., and Zhang, 771
X.: Intercomparison between aerosol optical properties by a PREDE 772
skyradiometer and CIMEL sunphotometer over Beijing, China, Atmos. 773
https://doi.org/10.5194/acp-2019-405Preprint. Discussion started: 28 May 2019c© Author(s) 2019. CC BY 4.0 License.

27
Chem. Phys., 8, 3199–3214, http://dx.doi.org/10.5194/acp-8-3199-2008, 774
2008. 775
Che, H., Zhang, X., Chen, H., Damiri, B., Goloub, P., Li, Z., Zhang, X., Wei, Y., 776
Zhou, H., Dong, F., Li, D., and Zhou, T.: Instrument calibration and aerosol 777
optical depth (AOD) validation of the China Aerosol Remote Sensing 778
Network (CARSNET), J. Geophys. Res., 114, D03206, 779
https://doi.org/10.1029/2008JD011030, 2009a. 780
Che, H. Z., Zhang, X. Y., Alfraro, S., Chatenet, B., Gomes, L., and Zhao, J. Q.: 781
Aerosol optical properties and its radiative forcing over Yulin, China in 782
2001 and 2002, Adv. Atmos. Sci., 26, 564–576, 783
https://doi.org/10.1007/s00376-009-0564-4, 2009b. 784
Che, H. Z., Yang, Z. F., Zhang, X. Y., Zhu, C. Z., Ma, Q. L., Zhou, H. G., and 785
Wang, P.: Study on the aerosol optical properties and their relationship 786
with aerosol chemical compositions over three regional background 787
stations in China, Atmospheric Environment, 43, 1093–1099, 788
https://doi.org/10.1016/j.atmosenv.2008.11.010, 2009c. 789
Che, H., Xia, X., Zhu, J., Li, Z., Dubovik, O., Holben, B., Goloub, P., Chen, H., 790
Estelles, V., Cuevas-Agulló, E., Blarel, L., Wang, H., Zhao, H., Zhang, X., 791
Wang, Y., Sun, J., Tao, R., Zhang, X., and Shi, G.: Column aerosol optical 792
properties and aerosol radiative forcing during a serious haze-fog month 793
over North China Plain in 2013 based on ground-based sunphotometer 794
measurements, Atmos. Chem. Phys., 14, 2125–2138, 795
https://doi.org/10.5194/acp-14-2125-2014. 796
Che, H., Zhang, X.-Y., Xia, X., Goloub, P., Holben, B., Zhao, H., Wang, Y., 797
Zhang, X.-C., Wang, H., Blarel, L., Damiri, B., Zhang, R., Deng, X., Ma, Y., 798
Wang, T., Geng, F., Qi, B., Zhu, J., Yu, J., Chen, Q., and Shi, G.: 799
Ground-based aerosol climatology of China: aerosol optical depths from 800
the China Aerosol Remote Sensing Network (CARSNET) 2002–2013, 801
Atmos. Chem. Phys., 15, 7619–7652, https://doi.org/10.5194/acp- 802
15-7619-2015, 2015. 803
https://doi.org/10.5194/acp-2019-405Preprint. Discussion started: 28 May 2019c© Author(s) 2019. CC BY 4.0 License.

28
Che, H., Qi, B., Zhao, H., Xia, X., Eck, T.F., Goloub, P., Dubovik, O., Estelles, 804
V., Cuevas-Agulló, E., Blarel, L., Wu, Y., Zhu, J., Du, R., Wang, Y., Wang, 805
H., Gui, K., Yu, J., Zheng, Y., Sun, T., Chen, Q., Shi, G., and Zhang X.: 806
Aerosol optical properties and direct radiative forcing based on 807
measurements from the China Aerosol Remote Sensing Network 808
(CARSNET) in eastern China, Atmospheric Chemistry and Physics, 18, 809
405–425, https://doi.org/10.5194/acp-18-405-2018, 2018. 810
Cong, Z.Y., Kang, S.C., Liu, X.D., and Wang, G.F.: Elemental composition of 811
aerosol in the Nam Co region, Tibetan Plateau, during summer monsoon 812
season, Atmospheric Environment, 41, 1180–1187, 813
https://doi.org/10.1016/j.atmosenv.2006.09.046, 2007. 814
Cong, Z.Y., Kang, S.C., Smirnov, A., and Holben, B.: Aerosol optical properties 815
at Nam Co, a remote site in central Tibetan Plateau, Atmospheric 816
Research, 92, 42–48, https://doi.org/10.1016/j.atmosres.2008.08.005, 817
2009. 818
Duan, J. and Mao, J.: Study on the distribution and variation trends of 819
atmospheric aerosol optical depth over the Yangtze River Delta, Acta 820
Scien. Circum., 27, 537–543, 821
https://doi.org/10.1007/978-1-4020-6475-3_126, 2007. 822
Dubovik, O. and King, M. D.: A flexible inversion algorithm for retrieval of 823
aerosol optical properties from sun and sky radiance measurements, J. 824
Geophys. Res., 105, 20673–20696, 825
https://doi.org/10.1029/2000JD900282, 2000. 826
Dubovik, O., Holben, B. N., Eck, T. F., Smirnov, A., Kaufman, Y. J., King, M. D., 827
Tanre, D., and Slutsker, I.: Variability of absorption and optical properties 828
of key aerosol types observed in worldwide locations, J. Atmos. Sci., 59, 829
590–608, 830
https://doi.org/10.1175/1520-0469(2002)059<0590:VOAAOP>2.0.CO;2, 831
2002. 832
Dubovik, O., Sinyuk, A., Lapyonok, T., Holben, B. N., Mishchenko, M., Yang, P., 833
https://doi.org/10.5194/acp-2019-405Preprint. Discussion started: 28 May 2019c© Author(s) 2019. CC BY 4.0 License.

29
Eck, T. F., Volten, H., Munoz, O., Veihelmann, B., van der Zande, W. J., 834
Leon, J. F., Sorokin, M., and Slutsker, I.: Application of spheroid models to 835
account for aerosol particle nonsphericity in remote sensing of desert dust, 836
J. Geophys. Res.-Atmos., 111, D11208, 837
https://doi.org/10.1029/2005JD006619, 2006. 838
Dubuisson, P., Buriez, J. C., and Fouquart, Y.: High spectral resolution solar 839
radiative transfer in absorbing and scattering media, application to the 840
satellite simulation, J. Quant. Spectrosc. Ra., 55, 103–126, 841
https://doi.org/10.1016/0022-4073(95)00134-4, 1996. 842
Eck, T. F., Holben, B. N., Reid, J. S., Dubovik, O., Smirnov, A., O’Neill, N. T., 843
Slutsker, I., and Kinne, S.: Wavelength dependence of the optical depth of 844
biomass burning, urban, and desert dust aerosols, J. Geophys. Res., 104, 845
31333–31349, https://doi.org/10.1029/1999jd900923, 1999. 846
Eck, T. F., Holben, B. N., Dubovik, O., Smirnov, A., Goloub, P., Chen, H. B., 847
Chatenet, B., Gomes, L., Zhang, X. Y., Tsay, S. C., Ji, Q., Giles, D., and 848
Slutsker, I.: Columnar aerosol optical properties at AERONET sites in 849
central eastern Asia and aerosol transport to the tropical Mid-Pacific, J. 850
Geophys. Res., 110, D06202, https://doi.org/10.1029/2004JD005274, 851
2005. 852
Estellés, V., Campanelli, M., Utrillas, M. P., Expósito, F., and Martínez-Lozano, 853
J. A.: Comparison of AERONET and SKYRAD4.2 inversion products 854
retrieved from a Cimel CE318 sunphotometer, Atmos. Meas. Tech., 5, 855
569–579, https://doi.org/10.5194/amt-5-569-2012, 2012. 856
Fan, X., Chen, H., Goloub, P., Xia, X., Zhang, W., and Chatenet, B.: Analysis of 857
column-integrated aerosol optical thickness in Beijing from AERONET 858
observations, China Particuol., 4, 330-335, DOI: 859
10.1016/s1672-2515(07)60285-1, 2006. 860
García, O. E., Díaz, J. P., Expósito, F. J., Díaz, A. M., Dubovik, O., Dubuisson, 861
P., Roger, J.-C., Eck, T. F., Sinyuk, A., Derimian, Y., Dutton, E. G., Schafer, 862
J. S., Holben, B. N., and García, C. A.: Validation of AERONET estimates 863
https://doi.org/10.5194/acp-2019-405Preprint. Discussion started: 28 May 2019c© Author(s) 2019. CC BY 4.0 License.

30
of atmospheric solar fluxes and aerosol radiative forcing by groundbased 864
broadband measurements, J. Geophys. Res., 113, D21207, 865
https://doi.org/10.1029/2008JD010211, 2008. 866
García, O. E., Díaz, J. P., Expósito, F. J., Díaz, A. M., Dubovik, O., and 867
Derimian, Y.: Aerosol radiative forcing: AERONET based estimates, 868
climate Models, InTech, edited by: Druyan, L., ISBN: 978- 953-51-0135-2, 869
2012. 870
Gelencser, A.: Carbonaceous Aerosol, Atmospheric and Oceanographic 871
Sciences Libery., vol. 30. Springer, Netherland., 2004. 872
Giles, D. M., Holben, B. N., Tripathi, S. N., Eck, T. F., Newcomb, W. W., 873
Slutsker, I., Dickerson, R. R., Thompson, A. M., Mattoo, S., Wang, S., 874
Singh, R. P., Sinyuk, A., and Schafer, J. S.: Aerosol properties over the 875
Indo-Gangetic Plain: A mesoscale perspective from the TIGERZ 876
experiment, J. Geophys. Res.-Atmos., 116(D18), DOI: 877
10.1029/2011JD015809, 2011. 878
Giles, D. M., Holben, B. N., Eck, T. F., Sinyuk, A., Smirnov, A., Slutsker, I., 879
Dickerson, R. R., Thompson, A. M., and Schafer, J. S.: An analysis of 880
AERONET aerosol absorption properties and classifications 881
representative of aerosol source regions, J. Geophys. Res.-Atmos., 117, 882
127–135, DOI: 10.1029/2012JD018127, 2012. 883
Gobbi, G. P., Kaufman, Y. J., Koren, I., and Eck, T. F.: Classification of aerosol 884
properties derived from AERONET direct sun data, Atmos. Chem. Phys., 885
7, 453–458, http://dx.doi.org/10.5194/acp-7-453-2007, 2007 886
Goloub, P., Li, Z., Dubovik, O., Blarel, L., Podvin, T., Jankowiak, I., Lecoq, R., 887
Deroo, C., Chatenet, B., and Morel, J. P.: PHOTONS/AERONET 888
sunphotometer network overview: description, activities, results, 889
Fourteenth International Symposium on Atmospheric and Ocean 890
Optics/Atmospheric Physics, 6936, 69360V, DOI: 10.1117/12.783171, 891
2007. 892
https://doi.org/10.5194/acp-2019-405Preprint. Discussion started: 28 May 2019c© Author(s) 2019. CC BY 4.0 License.

31
Haywood, J. M. and Shine, K. P.: The effect of anthropogenic sulfate and soot 893
aerosol on the clear sky planetary radiation budget, Geophys. Res. Lett., 894
22, 603–606, https://doi.org/10.1029/95GL00075, 1995. 895
He, Q., Li, C., Geng, F., Yang, H., Li, P., Li, T., Liu, D., and Pei, Z.: Aerosol 896
optical properties retrieved from Sun photometer measurements over 897
Shanghai, China, J. Geophys. Res.-Atmos., 117, D16204, 898
https://doi.org/10.1029/2011JD017220, 2012. 899
Holben, B. N., Eck, T. F., Slutsker, I., Tanré, D., Buis, J. P., Setzer, A., Vermote, 900
E., Reagan, J. A., Kaufman, Y. J., Nakajima, T., Lavenu, F., Jankowiak, I., 901
and Smirnov, A.: AERONET – A Federated Instrument Network and Data 902
Archive for Aerosol Characterization, Remote Sens. Environ., 66, 1–16, 903
https://doi.org/10.1016/S0034-4257(98)00031-5, 1998. 904
Jacobson, M. Z.: A physically based treatment of elemental carbon optics: 905
implications for global direct forcing of aerosols, Geophys. Res. Lett., 27, 906
217–220, DOI: 10.1029/1999gl010968, 2000. 907
Lacis, A. A. and Oinas, V.: A description of the correlated kdistribution method 908
for modeling nongray gaseous absorption, thermal emission, and multiple 909
scattering in vertically inhomogeneous atmospheres, J. Geophys. Res., 910
96, 9027–9063, DOI: 10.1029/90JD01945, 1991. 911
Lee, K. H., Li, Z., Cribb, M. C., Liu, J., Wang, L., Zheng, Y., Xia, X., Chen, H., 912
and Li, B.: Aerosol optical depth measurements in eastern China and a 913
new calibration method, J. Geophys. Res., 115, 4038–4044, 914
https://doi.org/10.1029/2009JD012812, 2010. 915
Li, C.C., Mao, J.T., Lau, A.K.H., Chen, J.C., Yuan, Z.B., Liu, X.Y., Zhu, A.H., 916
and Liu, G.Q.: Characteristics of distribution and seasonal variation of 917
aerosol optical depth in eastern China with MODIS products, Chinese 918
Science Bulletin., 48, 2488-2495, DOI: 10.1360/03wd0224, 2003. 919
Li, Z., Chen, H., Cribb, M., Dickerson, R., Holban, B., Li, C., Lu, D., Luo, Y., 920
Maring, H., Shi, G., Tsay, S.C., Wang, P., Wang, Y., Xia, X., and Zhao, F.: 921
Overview of the East Asian Studies on tropospheric aerosols, an 922
https://doi.org/10.5194/acp-2019-405Preprint. Discussion started: 28 May 2019c© Author(s) 2019. CC BY 4.0 License.

32
international regional experiment(EAST-AIRE), J. Geophys. Res., 112, 923
D22S00. http://dx.doi.org/10.1029/2007JD008853, 2007. 924
Li, X., and Zhang, L.: Analysis of aerosol sources and optical properties based 925
on backward trajectory method over SACOL, Acta Physica Sin., 61, 1-9, 926
DOI: 10.7498/aps.61.023402, 2012. 927
Li, Z. Q., Eck, T., Zhang, Y., Zhang, Y. H., Li, D. H., Li, L., Xu, H., Hou, W. Z., Lv, 928
Y., Goloub, P., and Gu, X. F.: Observations of residual submicron fine 929
aerosol particles related to cloud and fog processing during a major 930
pollution event in Beijing, Atmos. Environ., 86, 187–192, DOI: 931
10.1016/j.atmosenv.2013.12.044, 2014. 932
Li, Z., Lau, W. K.-M., Ramanathan, V., Wu, G., Ding, Y., Manoj, M. G., Liu, J., 933
Qian, Y., Li, J., Zhou, T., Fan, J., Rosenfeld, D., Ming, Y., Wang, Y., Huang, 934
J., Wang, B., Xu, X., Lee, S.- S., Cribb, M., Zhang, F., Yang, X., Takemura, 935
T., Wang, K., Xia, X., Yin, Y., Zhang, H., Guo, J., Zhai, P. M., Sugimoto, N., 936
Babu, S. S., and Brasseur, G. P.: Aerosol and monsoon climate 937
interactions over Asia, Rev. Geophys., 54, 866–929, 938
https://doi.org/10.1002/2015RG000500, 2016. 939
Li, Z.Q., Xu, H., Li, K. T., Li, D. H., Xie, Y. S., Li, L., Zhang, Y., Gu, X.F., Zhao, 940
W., Tian, Q.J., Deng, R.R., Su, X.L., Huang, B., Qiao, Y.L., Cui, W.Y., Hu, 941
Y., Gong, C.L., Wang, Y.Q., Wang, X.F., Wang, J.P., Du, W.B., Pan, Z.Q., 942
Li, Z.Z., and Bu, D.: Comprehensive Study of Optical, Physical, Chemical, 943
and Radiative Properties of Total Columnar Atmospheric Aerosols over 944
China: An Overview of Sun–Sky Radiometer Observation Network 945
(SONET) Measurements, Bulletin of the American Meteorological Society., 946
99(4), 739–755, https://doi.org/10.1175/BAMS-D-17-0133.1, 2018. 947
Luo, Y., Lu, D., Zhou, X., and Li, W.: Analyses on the spatial distribution of 948
aerosol optical depth over china in recent 30 years, Chinese Journal of 949
Atmospheric Sciences., 26, 721-730, DOI: 10.1002/mop.10502, 2002. 950
Mai, B., Deng, X., Xia, X., Che, H., Guo, J., Liu, X., Zhu, J., and Ling, C.: 951
Column-integrated aerosol optical properties of coarse- and fine-mode 952
https://doi.org/10.5194/acp-2019-405Preprint. Discussion started: 28 May 2019c© Author(s) 2019. CC BY 4.0 License.

33
particles over the Pearl River Delta region in China, Sci. Total. Environ., 953
622–623, 481-492, DOI: 10.1016/j.scitotenv.2017.11.348, 2018. 954
Myhre, G.: Consistency between satellite-derived and modeled estimates of 955
the direct aerosol effect, Science, 325, 187-190, DOI: 956
10.1126/science.1174461, 2009. 957
Nakajima, T. and Tanaka, M.: Algorithms for radiative intensity calculations in 958
moderately thick atmospheres using a truncation approximation, J. Quant. 959
Spectrosc. Ra., 40, 51–69, 960
https://doi.org/10.1016/0022-4073(88)90031-3,1988. 961
Pappalardo, G., Amodeo, A., Apituley, A., Comeron, A., Freudenthaler, V., 962
Linné, H., Ansmann, A., Bösenberg, J., D’Amico, G., Mattis, I., Mona, L., 963
Wandinger, U., Amiridis, V., AladosArboledas, L., Nicolae, D., and 964
Wiegner, M.: EARLINET: towards an advanced sustainable European 965
aerosol lidar network, Atmos. Meas. Tech., 7, 2389–2409, 966
https://doi.org/10.5194/amt- 7-2389-2014, 2014. 967
Prats, N., Cachorro, V. E., Berjón, A., Toledano, C., and De Frutos, A. M.: 968
Column-integrated aerosol microphysical properties from AERONET Sun 969
photometer over southwestern Spain, Atmos. Chem. Phys., 11, 12535–970
12547, DOI:10.5194/acp-11- 12535-2011, 2011. 971
Qin, K., Wang, L.Y., Wu, L.X., Xu, J., Rao, L.L., Letu, H., Shi, T.W., Wang, R.F., 972
2017. A campaign for investigating aerosol optical properties during winter 973
hazes over Shijiazhuang, China, Atmos. Res., 198, 113-122, 974
https://doi.org/10.1016/j.atmosres.2017.08.018, 2017. 975
Ramanathan, V., Crutzen, P. J., Kiehl, J. T., and Rosenfeld, D.: Aerosol, 976
climate, and hydrological cycle, Science 294, 2119–2124, 977
https://doi.org/10.1126/science.1064034, 2001. 978
Remer, L. A., and Kaufman, Y. J.: Dynamic aerosol model: Urban/industrial 979
aerosol, J. Geophys. Res., 103, 13859–13871, 980
https://doi.org/10.1029/98jd00994, 1998. 981
Roger, J. C., Mallet, M., Dubuisson, P., Cachier, H., Vermote, E., Dubovik, O., 982
https://doi.org/10.5194/acp-2019-405Preprint. Discussion started: 28 May 2019c© Author(s) 2019. CC BY 4.0 License.

34
and Despiau, S.: A synergetic approach for estimating the local direct 983
aerosol forcing: applications to an urban zone during the ESCOMPTE 984
experiment, J. Geophys. Res., 111, D13208, 985
https://doi.org/10.1029/2005JD006361, 2006. 986
Russell, P. B., Bergstrom, R. W., Shinozuka, Y., Clarke, A. D., DeCarlo, P. F., 987
Jimenez, J. L., Livingston, J. M., Redemann, J., Dubovik, O., and Strawa, 988
A.: Absorption Angstrom Exponent in AERONET and related data as an 989
indicator of aerosol composition, Atmos. Chem. Phys., 10, 1155–1169, 990
https://doi.org/10.5194/acp-10-1155-2010, 2010. 991
Shettle, E. P., and Fenn, R. W.: Models for the aerosols of the lower 992
atmosphere and the effects of humidity variations on their optical 993
properties. AFCRL Tech. Rep. 79 0214, Air Force Cambridge Research 994
Laboratory, Hanscom Air Force Base, MA, 100 pp, 1979. 995
Stamnes, K., Tsay, S. C., Wiscombe, W., and Jayaweera, K.: Numerically 996
stable algorithm for discrete-ordinate-method radiative transfer in multiple 997
scattering and emitting layered media, Appl. Optics., 27, 2502–2509, 998
https://doi.org/10.1364/ao.27.002502, 1988. 999
Su, X. L., Wang, Q., Li, Z. Q., Calvello, M., Esposito, F., Pavese, G., Lin, M. J., 1000
Cao, J. J., Zhou, C. Y., Li, D. H., Xu, H.: Regional transport of 1001
anthropogenic pollution and dust aerosols in spring to Tianjin — A coastal 1002
megacity in China, Sci. Total Environ., 584-585, 381-392, 1003
https://doi.org/10.1016/j.scitotenv.2017.01.016, 2017. 1004
Takamura, T., and Nakajima, T.: Overview of SKYNET and its activities, Opt. 1005
Pura Apl., 37, 3303–3308, 2004. 1006
Tao, R., Che, H. Z., Chen, Q. L., Wang, Y. Q., Sun, J. Y., Zhang, X. C., Lu, S., 1007
Guo, J. P., Wang, H., and Zhang, X.Y.: Development of an integrating 1008
sphere calibration method for Cimel sunphotometers in China aerosol 1009
remote sensing network, Particuology 13, 88–99. 1010
https://doi.org/10.1016/j.partic.2013.04.009, 2014. 1011
Twomey, S. A., Piepgrass, M., and Wolfe, T. L.: An assessment of the impact of 1012
https://doi.org/10.5194/acp-2019-405Preprint. Discussion started: 28 May 2019c© Author(s) 2019. CC BY 4.0 License.

35
pollution on the global cloud albedo, Tellus, 36B, 356–366, 1013
https://doi.org/10.1111/j.1600-0889.1984.tb00254.x, 1984. 1014
Wan, X., Kang, S.C., Wang, Y.S., Xin, J.Y., Liu, B., Guo, Y.H., Wen, T.X., Zhang, 1015
G.S., and Cong, Z.Y.: Size distribution of carbonaceous aerosols at a 1016
high-altitude site on the central Tibetan Plateau (Nam Co Station, 4730m 1017
a.s.l.), Atmos. Res., 153, 155–164, 1018
https://doi.org/10.1016/j.atmosres.2014.08.008, 2015. 1019
Wang, X., Huang, J.P., Ji, M.X., and Higuchi, K.: Variability of east Asia dust 1020
events and their long-term trend, Atmos. Environ., 42, 3156–3165, 1021
http://dx.doi.org/ 10.1016/j.atmosenv.2007.07.046, 2007. 1022
Wang, L. C., Gong, W., Xia, X. A., Zhu, J., Li, J., and Zhu, Z. M.: Long-term 1023
observations of aerosol optical properties at Wuhan, an urban site in 1024
Central China, Atmos. Environ., 101, 94–102, DOI: 1025
10.1016/j.atmosenv.2014.11.021, 2015. 1026
Wang, P., Che, H. Z., Zhang, X. C., Song, Q. L., Wang, Y. Q., Zhang, Z. H., Dai, 1027
X., and Yu, D. J.: Aerosol optical properties of regional background 1028
atmosphere in Northeast China, Atmos. Environ., 44, 4404–4412, DOI: 1029
10.1016/j.atmosenv.2010.07.043 , 2010. 1030
Wang, Z., Liu, D., Wang, Y., Wang, Z., and Shi, G.: Diurnal aerosol variations 1031
do affect daily averaged radiative forcing under heavy aerosol loading 1032
observed in Hefei, China, Atmos. Meas. Tech., 8, 2901–2907, 1033
https://doi.org/10.5194/amt-8-2901-2015, 2015. 1034
Wehrli, C.: Calibration of filter radiometers for the GAW Aerosol Optical Depth 1035
network at Jungfraujoch and Mauna Loa, in: Proceedings of ARJ 1036
Workshop, SANW Congress, Davos, Switzerland, 70–71, 2002. 1037
Whitey, K. T.: The physical characteristics of sulfur aerosols. Atmos. Environ., 1038
41(supp-S), 25-49, DOI: 10.1016/j.atmosenv.2007.10.057, 1978. 1039
Wu, Y.F., Zhang, R.J., Pu, Y.F., Zhang, L.M., Ho, K.F., and Fu, C.B.: Aerosol 1040
optical properties observed at a semi-arid rural site in Northeastern China, 1041
Aerosol. Air. Qual. Res., 12,503–514, DOI: 10.4209/aaqr.2011.11.0202 , 1042
https://doi.org/10.5194/acp-2019-405Preprint. Discussion started: 28 May 2019c© Author(s) 2019. CC BY 4.0 License.

36
2012. 1043
Xia, X.: A closer looking at dimming and brightening in China during 1961–1044
2005, Ann. Geophys., 28, 1121–1132, doi:10.5194/angeo-28-1121-2010, 1045
2010. 1046
Xia, X., Chen, H., Goloub, P., Zong, X., Zhang, W., and Wang, P.: 1047
Climatological aspects of aerosol opticalproperties in North China Plain 1048
based on ground and satellite remote-sensing data, J. Quant. Spectrosc. 1049
Ra., 127, 12–23, DOI: 10.1016/j.jqsrt.2013.06.024, 2013. 1050
Xie, C., Nishizawa, T., Sugimoto, N., Matsui, I., and Wang, Z.: Characteristics 1051
of aerosol optical properties in pollution and Asian dust episodes over 1052
Beijing, China. Appl. Opt., 47, 4945-4951, DOI: 10.1364/AO.47.004945, 1053
2008. 1054
Xin, J., Wang Y, Li, Z.Q., Wang, P.C., Hao, W.M., Nordgren, B.L., Wang, S.G., 1055
Liu, G.R., Wang, L.L., Wen, T.X., Sun, Y., and Hu, B.: Aerosol optical 1056
depth (AOD) and Ångström exponent of aerosols observed by the 1057
Chinese Sun Hazemeter Network from August 2004 to September 2005, J. 1058
Geophys. Res., 112, D05203, DOI: 10.1029/2006JD007075, 2007 1059
Xin, J.Y., Wang, L.L., Wang, Y.S., Li, Z., and Wang, P.: Trends in aerosol 1060
optical properties over the Bohai Rim in Northeast China from 2004 to 1061
2010, Atmos. Environ., 45, 6317–6325, DOI: 1062
10.1016/j.atmosenv.2011.08.052, 2011. 1063
Xin J, Wang Y, Pan Y, Ji, D., Liu, Z., Wen, T.X., Wang, Y.H., Li, X.R., Sun, Y., 1064
Sun, J., Wang, P.C., Wang, G.H., Wang, X.M., Cong, Z.Y., Song, T., Hu, B., 1065
Wang, L.L., Tang, G.Q., Gao, W.K., Guo, Y.H., Miao, H.Y., Tian, S.L., and 1066
Wang, L.: The campaign on atmospheric aerosol research network of 1067
China: CARE-China, Bulletin of the American Meteorological Society., 96, 1068
1137-1155, https://doi.org/10.1175/BAMS-D-14-00039.1, 2015. 1069
Yuan, Y., Shuai, Y., Li, X.W., Liu, B., and Tan, H.P.: Using a new aerosol 1070
relative optical thickness concept to identify aerosol particle species, 1071
Atmos. Res., 150, 1–11, DOI: 10.1016/j.atmosres.2014.07.007, 2014. 1072
https://doi.org/10.5194/acp-2019-405Preprint. Discussion started: 28 May 2019c© Author(s) 2019. CC BY 4.0 License.

37
Zhang, M., Ma, Y., Gong, W., Liu, B., Shi, Y., and Chen, Z.: Aerosol optical 1073
properties and radiative effects: Assessment of urban aerosols in central 1074
China using 10-year observations, Atmos. Environ., 182, 275-285, DOI: 1075
10.1016/j.atmosenv.2018.03.040, 2018 1076
Zhang, R., Jing, J., Tao, J., Hsu, S.-C., Wang, G., Cao, J., Lee, C.S.L., Zhu, L., 1077
Chen, Z., Zhao, Y., and Shen, Z.: Chemical characterization and source 1078
apportionment of PM2.5 in Beijing: seasonal perspective, Atmos. Chem. 1079
Phys., 13, 7053–7074, http://dx.doi.org/10.5194/acp-13-7053-2013, 2013 1080
Zhao, H., Che, H., Ma, Y., Xia, X., Wang, Y., Wang, P., and Wu, X.: Temporal 1081
variability of the visibility, particulate matter mass concentration and 1082
aerosol optical properties over an urban site in Northeast China, Atmos. 1083
Res., 166, 204–212, DOI: 10.1016/j.atmosres.2015.07.003, 2015. 1084
Zhao H., Che H., Wang Y., Wang H., Ma Y., and Wang Y.: Investigation of the 1085
Optical Properties of Aerosols over the Coastal Region at Dalian, 1086
Northeast China, Atmosphere., 7(8), 103, DOI: 10.3390/atmos7080103, 1087
2016 1088
Zhao, H., Che, H., Xia, X., Wang, Y., Wang, H., Wang, P., Ma, Y., Yang, H., Liu, 1089
Y., Wang, Y., Gui, K., Sun, T., Zheng, Y., and Zhang, X.: Multi-year 1090
ground-based measurements of aerosol optical properties and direct 1091
radiative effect over different surface types in northeastern China, J. 1092
Geophys. Res.-Atmos., 123, 13,887–13,916, 1093
https://doi.org/10.1029/2018JD029141, 2018 1094
Zhu, J., Che, H., Xia, X., Chen, H. B., Goloub, P., and Zhang, W.: 1095
Column-integrated aerosol optical and physical properties at a regional 1096
background atmosphere in North China Plain, Atmos. Environ., 84, 54–64, 1097
DOI: 10.1016/j.atmosenv.2013.11.019, 2014. 1098
Zhuang, B., Wang, T., Li, S., Liu, J., Talbot, R., Mao, H., Yang, X., Fu, C., Yin, 1099
C., Zhu, J., Che, H., and Zhang, X.: Optical properties and radiative 1100
forcing of urban aerosols in Nanjing over China, Atmos. Environ., 83, 43–1101
52, DOI: 10.1016/j.atmosenv.2013.10.052, 2014. 1102
https://doi.org/10.5194/acp-2019-405Preprint. Discussion started: 28 May 2019c© Author(s) 2019. CC BY 4.0 License.
38
Figure captions 1103
Figure 1. Annual spatial distribution of aerosol volume-size distributions 1104
at the CARSNET sites 1105
Figure 2. Annual spatial distribution of aerosol optical depth (AOD) at 440 1106
nm at the CARSNET sites 1107
Figure 3. Annual spatial distribution of extinction Ångström exponent 1108
(AE) 440-870 nm at the CARSNET sites 1109
Figure 4. Annual spatial distribution of fine mode fraction at the 1110
CARSNET sites 1111
Figure 5. Annual spatial distribution of the single scattering albedo (SSA) 1112
at 440 nm at the CARSNET sites 1113
Figure 6. Annual spatial distribution of absorption aerosol optical depth 1114
(AAOD) at 440 nm at the CARSNET sites 1115
Figure 7. Annual spatial distribution of direct aerosol radiative effect at 1116
the bottom of the atmosphere at the CARSNET sites 1117
Figure 8. Annual spatial distribution of direct aerosol radiative effect at 1118
the top of the atmosphere at the CARSNET sites 1119
Figure 9. Annual spatial distribution of the aerosol type classification of 1120
types I–VII at the CARSNET sites 1121
Table 1 The aerosol type classification based on the optical properties 1122
1123
https://doi.org/10.5194/acp-2019-405Preprint. Discussion started: 28 May 2019c© Author(s) 2019. CC BY 4.0 License.

39
Figure 1. Annual spatial distribution of aerosol volume-size distributions 1124
at the CARSNET sites 1125
1126
1127 1128
https://doi.org/10.5194/acp-2019-405Preprint. Discussion started: 28 May 2019c© Author(s) 2019. CC BY 4.0 License.

40
Figure 2. Annual spatial distribution of aerosol optical depth (AOD) at 440 1129
nm at the CARSNET sites 1130
1131
1132
1133
https://doi.org/10.5194/acp-2019-405Preprint. Discussion started: 28 May 2019c© Author(s) 2019. CC BY 4.0 License.

41
Figure 3. Annual spatial distribution of extinction Ångström exponent 1134
(AE) 440-870 nm at the CARSNET sites 1135
1136
1137 1138
https://doi.org/10.5194/acp-2019-405Preprint. Discussion started: 28 May 2019c© Author(s) 2019. CC BY 4.0 License.

42
Figure 4. Annual spatial distribution of fine mode fraction at the 1139
CARSNET sites 1140
1141
1142
1143
https://doi.org/10.5194/acp-2019-405Preprint. Discussion started: 28 May 2019c© Author(s) 2019. CC BY 4.0 License.
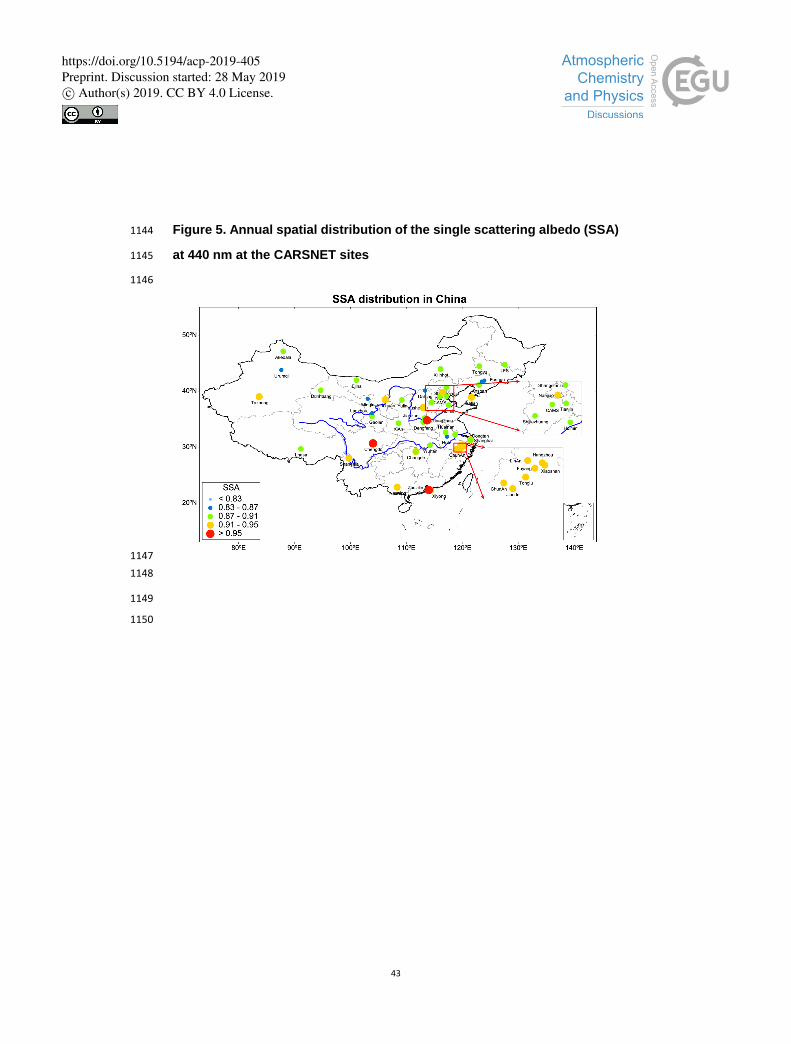
43
Figure 5. Annual spatial distribution of the single scattering albedo (SSA) 1144
at 440 nm at the CARSNET sites 1145
1146
1147
1148
1149
1150
https://doi.org/10.5194/acp-2019-405Preprint. Discussion started: 28 May 2019c© Author(s) 2019. CC BY 4.0 License.

44
Figure 6. Annual spatial distribution of absorption aerosol optical depth 1151
(AAOD) at 440 nm at the CARSNET sites 1152
1153
1154 1155
https://doi.org/10.5194/acp-2019-405Preprint. Discussion started: 28 May 2019c© Author(s) 2019. CC BY 4.0 License.

45
Figure 7. Annual spatial distribution of direct aerosol radiative effect at 1156
the bottom of the atmosphere at the CARSNET sites 1157
1158
1159
https://doi.org/10.5194/acp-2019-405Preprint. Discussion started: 28 May 2019c© Author(s) 2019. CC BY 4.0 License.

46
Figure 8. Annual spatial distribution of direct aerosol radiative effect at 1160
the top of the atmosphere at the CARSNET sites 1161
1162
1163
https://doi.org/10.5194/acp-2019-405Preprint. Discussion started: 28 May 2019c© Author(s) 2019. CC BY 4.0 License.

47
Figure 9. Annual spatial distribution of the aerosol type classification of 1164
types I–VII at the CARSNET sites 1165
1166
1167 1168
https://doi.org/10.5194/acp-2019-405Preprint. Discussion started: 28 May 2019c© Author(s) 2019. CC BY 4.0 License.

48
Table 1. The aerosol type classification based on the optical properties. 1169
1170
Type EAE SSA absorbing properties and particle size
I EAE > 1.20 SSA440nm ≤ 0.85 fine-mode particles with highly-absorbing
II EAE > 1.20 0.85 ≤ SSA440nm < 0.90 fine-mode particles with moderately-absorbing
III EAE > 1.20 0.90 ≤ SSA440nm < 0.95 fine-mode particles with slightly-absorbing
IV EAE > 1.20 SSA440nm > 0.95 fine-mode particles with weakly-absorbing
V 0.60 ≤ EAE < 1.20 SSA440nm ≤ 0.95 mixed-absorbing particles
VI 0.60 ≤ EAE < 1.20 SSA440nm > 0.95 mixed-slightly absorbing particles
VII EAE≤ 0.60 SSA440nm ≤ 0.95 coarse mode particles with strongly absorbing
(mainly dust)
VIII AE ≤ 0.60 SSA440nm > 0.95 coarse-mode particles with weakly-absorbing
1171
1172
1173
1174
1175
1176
1177
1178
1179
1180
1181
1182
1183
1184
1185
1186
1187
https://doi.org/10.5194/acp-2019-405Preprint. Discussion started: 28 May 2019c© Author(s) 2019. CC BY 4.0 License.
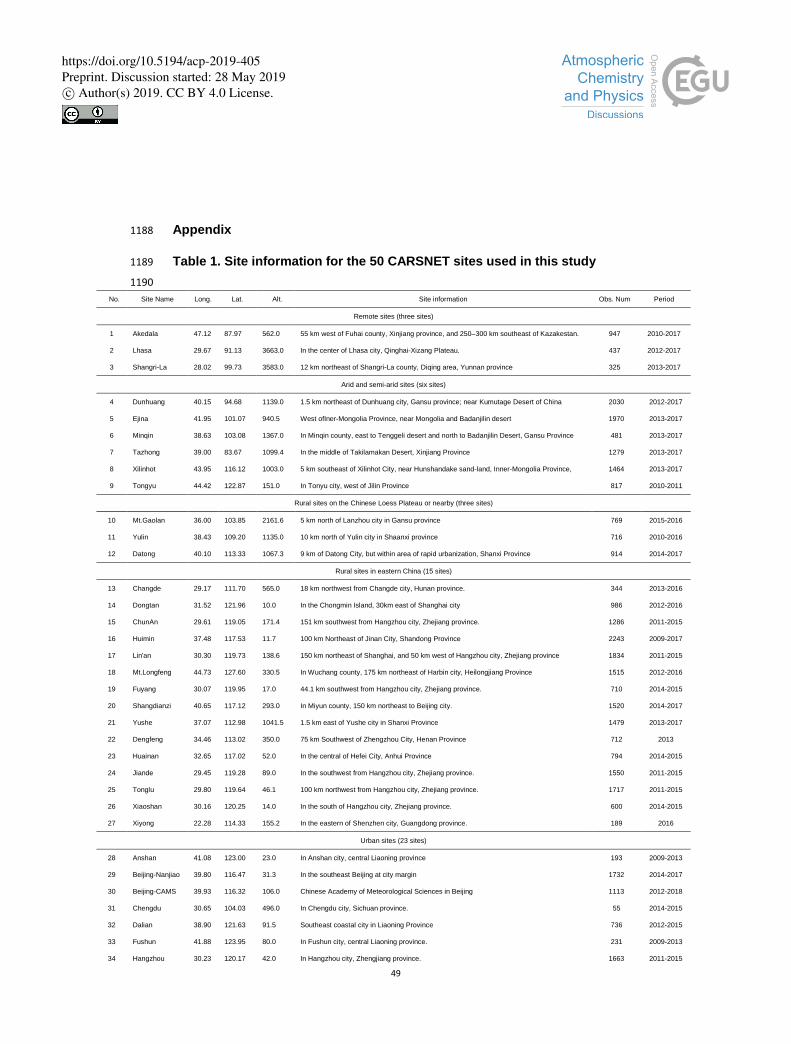
49
Appendix 1188
Table 1. Site information for the 50 CARSNET sites used in this study 1189
1190
No. Site Name Long. Lat. Alt. Site information Obs. Num Period
Remote sites (three sites)
1 Akedala 47.12 87.97 562.0 55 km west of Fuhai county, Xinjiang province, and 250–300 km southeast of Kazakestan. 947 2010-2017
2 Lhasa 29.67 91.13 3663.0 In the center of Lhasa city, Qinghai-Xizang Plateau. 437 2012-2017
3 Shangri-La 28.02 99.73 3583.0 12 km northeast of Shangri-La county, Diqing area, Yunnan province 325 2013-2017
Arid and semi-arid sites (six sites)
4 Dunhuang 40.15 94.68 1139.0 1.5 km northeast of Dunhuang city, Gansu province; near Kumutage Desert of China 2030 2012-2017
5 Ejina 41.95 101.07 940.5 West ofIner-Mongolia Province, near Mongolia and Badanjilin desert 1970 2013-2017
6 Minqin 38.63 103.08 1367.0 In Minqin county, east to Tenggeli desert and north to Badanjilin Desert, Gansu Province 481 2013-2017
7 Tazhong 39.00 83.67 1099.4 In the middle of Takilamakan Desert, Xinjiang Province 1279 2013-2017
8 Xilinhot 43.95 116.12 1003.0 5 km southeast of Xilinhot City, near Hunshandake sand-land, Inner-Mongolia Province, 1464 2013-2017
9 Tongyu 44.42 122.87 151.0 In Tonyu city, west of Jilin Province 817 2010-2011
Rural sites on the Chinese Loess Plateau or nearby (three sites)
10 Mt.Gaolan 36.00 103.85 2161.6 5 km north of Lanzhou city in Gansu province 769 2015-2016
11 Yulin 38.43 109.20 1135.0 10 km north of Yulin city in Shaanxi province 716 2010-2016
12 Datong 40.10 113.33 1067.3 9 km of Datong City, but within area of rapid urbanization, Shanxi Province 914 2014-2017
Rural sites in eastern China (15 sites)
13 Changde 29.17 111.70 565.0 18 km northwest from Changde city, Hunan province. 344 2013-2016
14 Dongtan 31.52 121.96 10.0 In the Chongmin Island, 30km east of Shanghai city 986 2012-2016
15 ChunAn 29.61 119.05 171.4 151 km southwest from Hangzhou city, Zhejiang province. 1286 2011-2015
16 Huimin 37.48 117.53 11.7 100 km Northeast of Jinan City, Shandong Province 2243 2009-2017
17 Lin'an 30.30 119.73 138.6 150 km northeast of Shanghai, and 50 km west of Hangzhou city, Zhejiang province 1834 2011-2015
18 Mt.Longfeng 44.73 127.60 330.5 In Wuchang county, 175 km northeast of Harbin city, Heilongjiang Province 1515 2012-2016
19 Fuyang 30.07 119.95 17.0 44.1 km southwest from Hangzhou city, Zhejiang province. 710 2014-2015
20 Shangdianzi 40.65 117.12 293.0 In Miyun county, 150 km northeast to Beijing city. 1520 2014-2017
21 Yushe 37.07 112.98 1041.5 1.5 km east of Yushe city in Shanxi Province 1479 2013-2017
22 Dengfeng 34.46 113.02 350.0 75 km Southwest of Zhengzhou City, Henan Province 712 2013
23 Huainan 32.65 117.02 52.0 In the central of Hefei City, Anhui Province 794 2014-2015
24 Jiande 29.45 119.28 89.0 In the southwest from Hangzhou city, Zhejiang province. 1550 2011-2015
25 Tonglu 29.80 119.64 46.1 100 km northwest from Hangzhou city, Zhejiang province. 1717 2011-2015
26 Xiaoshan 30.16 120.25 14.0 In the south of Hangzhou city, Zhejiang province. 600 2014-2015
27 Xiyong 22.28 114.33 155.2 In the eastern of Shenzhen city, Guangdong province. 189 2016
Urban sites (23 sites)
28 Anshan 41.08 123.00 23.0 In Anshan city, central Liaoning province 193 2009-2013
29 Beijing-Nanjiao 39.80 116.47 31.3 In the southeast Beijing at city margin 1732 2014-2017
30 Beijing-CAMS 39.93 116.32 106.0 Chinese Academy of Meteorological Sciences in Beijing 1113 2012-2018
31 Chengdu 30.65 104.03 496.0 In Chengdu city, Sichuan province. 55 2014-2015
32 Dalian 38.90 121.63 91.5 Southeast coastal city in Liaoning Province 736 2012-2015
33 Fushun 41.88 123.95 80.0 In Fushun city, central Liaoning province. 231 2009-2013
34 Hangzhou 30.23 120.17 42.0 In Hangzhou city, Zhengjiang province. 1663 2011-2015
https://doi.org/10.5194/acp-2019-405Preprint. Discussion started: 28 May 2019c© Author(s) 2019. CC BY 4.0 License.

50
35 Hefei 31.98 116.38 92.0 In Hefei city, Anhui province. 197 2016
36 Jiaozuo 35.18 113.25 113.0 In the center of Jiaozuo city, Henan province. 981 2016-2017
37 Lanzhou 36.05 103.88 1517.3 In Lanzhou city, Gansu province. 1493 2013-2017
38 Nanjing 32.05 118.77 99.3 In Nanjing city, Jiangsu province 1258 2007-2015
39 Nanning 22.82 108.35 172.0 In Nanning city, Guangxi province 286 2013-2017
40 Panyu 23 113.35 145.0 In district of Guangzhou city, Guangdong Province 436 2012-2016
41 Shanghai 31.22 121.55 14.0 In Pudong district of Shanghai city 144 2016
42 Shenyang 41.77 123.50 60.0 In Shenyang city, central Liaoning province. 541 2009-2013
43 Tianjin 39.10 117.17 3.3 Northern coastal city in North China Plain 1705 2013-2017
44 Urumqi 43.78 87.62 935.0 In Urumuqi city, Xijiang province 1411 2012-2017
45 Xi'an 34.43 108.97 363.0 20 km north of center of Xian city, but within Jing RiverIndustrial District, Shaanxi province 652 2012-2016
46 Yinchuan 38.48 106.22 1111.5 In Yinchuan city, Ningxia province. 124 2017
47 Zhengzhou 34.78 113.68 99.0 In Zhengzhou city, Henan province. 1485 2013-2017
48 Shijiazhuang 38.03 114.53 75.0 In the center of Shijiazhuang city, Hebei province. 1178 2015-2017
49 Wuhan 30.32 114.21 30 In the center of Wuhan city, Hubei province 220 2008
50 Zhuzilin 22.32 114.00 63.0 In the central of Shenzhen city, Guangdong province. 915 2010-2017
1191
1192
1193
1194
1195
1196
1197
1198
1199
1200
1201
1202
1203
1204
1205
1206
1207
1208
1209
1210
1211
1212
1213
https://doi.org/10.5194/acp-2019-405Preprint. Discussion started: 28 May 2019c© Author(s) 2019. CC BY 4.0 License.

51
Table 2. Annual data for aerosol microphysical properties, optical and direct radiative parameters 1214
No. Site aReffT aReffF aReffC aVolT aVolF aVolC aAODt bAlpha aFMF aSSAT aImage aReal aAAOD aBOA aTOA
Remote sites (3 sites)
1 Akedala 0.36 0.14 2.45 0.06 0.02 0.04 0.17 1.13 0.81 0.90 0.0117 1.4540 0.02 -33.65 -0.42
2 Lhasa 0.64 0.13 2.26 0.05 0.01 0.04 0.10 0.77 0.66 0.90 0.0106 1.5541 0.01 -22.13 -5.04
3 Shangri-La 0.39 0.14 2.33 0.03 0.01 0.02 0.10 1.19 0.85 0.93 0.0086 1.4626 0.01 -17.43 -8.93
Average 0.47 0.14 2.35 0.05 0.01 0.03 0.12 1.03 0.77 0.91 0.0103 1.4902 0.01 -24.40 -4.79
Arid and semi-arid sites (6 sites)
4 Dunhuang 0.62 0.14 1.52 0.15 0.02 0.13 0.33 0.48 0.44 0.88 0.0103 1.5491 0.04 -63.61 -8.96
5 Ejina 0.56 0.14 1.78 0.11 0.02 0.09 0.24 0.64 0.52 0.89 0.0116 1.5265 0.03 -47.66 -7.20
6 Minqin 0.56 0.13 1.87 0.13 0.02 0.11 0.30 0.68 0.59 0.86 0.0145 1.5430 0.04 -59.83 -5.01
7 Tazhong 0.71 0.14 1.38 0.30 0.03 0.27 0.60 0.25 0.35 0.92 0.0054 1.5257 0.05 -91.20 -23.49
8 Xilinhot 0.48 0.13 2.45 0.08 0.02 0.05 0.21 1.03 0.78 0.89 0.0139 1.5183 0.02 -37.14 -7.47
9 Tongyu 0.39 0.13 2.36 0.07 0.02 0.05 0.23 1.16 0.82 0.88 0.0179 1.5377 0.03 -39.13 -8.87
Average 0.55 0.14 1.89 0.14 0.02 0.12 0.32 0.71 0.58 0.89 0.0123 1.5334 0.03 -56.43 -10.17
Rural sites on the Chinese Loess Plateau or nearby (3 sites)
10 Mt.Gaolan 0.58 0.14 2.03 0.16 0.03 0.13 0.36 0.81 0.64 0.89 0.0108 1.5154 0.04 -59.36 -20.87
11 Yulin 0.53 0.15 2.05 0.11 0.03 0.08 0.32 0.84 0.72 0.89 0.0122 1.5070 0.03 -56.81 -9.09
12 Datong 0.35 0.13 2.15 0.19 0.09 0.10 0.58 1.15 0.83 0.86 0.0171 1.4905 0.09 -107.86 -13.71
Average 0.49 0.14 2.08 0.15 0.05 0.10 0.42 0.93 0.73 0.88 0.0134 1.5043 0.05 -74.67 -14.56
Rural sites in eastern China (15 sites)
13 Changde 0.32 0.16 2.18 0.14 0.07 0.07 0.58 1.15 0.88 0.93 0.0101 1.4619 0.04 -75.33 -31.44
14 Dongtan 0.37 0.16 2.12 0.17 0.08 0.09 0.62 1.21 0.86 0.93 0.0080 1.4624 0.04 -79.41 -33.18
15 ChunAn 0.30 0.18 2.30 0.19 0.12 0.08 0.81 1.22 0.92 0.94 0.0066 1.4095 0.04 -86.49 -46.48
16 Huimin 0.36 0.15 2.07 0.22 0.10 0.12 0.83 1.14 0.86 0.89 0.0147 1.4852 0.08 -111.58 -25.49
https://doi.org/10.5194/acp-2019-405Preprint. Discussion started: 28 May 2019c© Author(s) 2019. CC BY 4.0 License.

52
17 Lin'an 0.29 0.17 2.24 0.21 0.12 0.09 0.87 1.29 0.91 0.93 0.0089 1.4172 0.06 -93.09 -41.73
18 Mt.Longfeng 0.28 0.15 2.44 0.08 0.04 0.04 0.34 1.38 0.90 0.89 0.0165 1.4647 0.03 -51.17 -11.34
19 Fuyang 0.29 0.17 2.28 0.21 0.13 0.09 0.89 1.31 0.92 0.94 0.0070 1.4147 0.05 -91.69 -42.29
20 Shangdianzi 0.40 0.15 2.33 0.12 0.05 0.07 0.43 1.17 0.86 0.89 0.0148 1.4840 0.04 -59.99 -20.58
21 Yushe 0.41 0.15 2.18 0.14 0.06 0.08 0.50 1.07 0.84 0.92 0.0090 1.4878 0.03 -66.72 -25.99
22 Dengfeng 0.39 0.15 2.03 0.23 0.09 0.13 0.79 1.02 0.83 0.89 0.0131 1.4782 0.08 -104.78 -35.84
23 Huainan 0.30 0.17 2.25 0.21 0.13 0.08 0.91 1.17 0.92 0.88 0.0166 1.4308 0.10 -129.17 -24.44
24 Jiande 0.29 0.17 2.18 0.20 0.12 0.08 0.84 1.34 0.91 0.92 0.0099 1.4085 0.06 -91.06 -40.07
25 Tonglu 0.29 0.17 2.20 0.20 0.12 0.08 0.83 1.31 0.91 0.93 0.0091 1.4269 0.06 -89.82 -41.28
26 Xiaoshan 0.28 0.17 2.24 0.22 0.13 0.09 0.87 1.35 0.91 0.93 0.0082 1.4134 0.06 -95.23 -40.39
27 Xiyong 0.33 0.16 2.43 0.11 0.06 0.05 0.41 1.32 0.89 0.94 0.0074 1.4072 0.02 -53.18 -25.45
Average 0.33 0.16 2.23 0.18 0.09 0.08 0.70 1.23 0.89 0.92 0.0107 1.4435 0.05 -85.25 -32.40
Urban sites (23 sites)
28 Anshan 0.36 0.17 2.24 0.26 0.12 0.14 0.94 1.12 0.86 0.89 0.0158 1.4759 0.10 -117.99 -39.66
29 Beijing-Nanjiao 0.45 0.15 2.33 0.19 0.07 0.12 0.65 1.12 0.84 0.92 0.0100 1.4939 0.05 -82.06 -29.43
30 Beijing-CAMS 0.50 0.16 2.37 0.19 0.07 0.12 0.65 1.12 0.79 0.90 0.0115 1.5108 0.05 -72.66 -29.10
31 Chengdu 0.34 0.21 2.26 0.26 0.16 0.10 1.17 1.12 0.92 0.97 0.0033 1.4116 0.04 -110.42 -52.21
32 Dalian 0.35 0.16 2.24 0.16 0.08 0.09 0.62 1.22 0.87 0.93 0.0095 1.4584 0.04 -75.50 -37.42
33 Fushun 0.38 0.17 2.34 0.22 0.09 0.12 0.80 1.12 0.87 0.84 0.0244 1.4954 0.11 -116.91 -19.59
34 Hangzhou 0.30 0.17 2.21 0.22 0.12 0.10 0.87 1.30 0.90 0.91 0.0109 1.4337 0.07 -31.57 -40.16
35 Hefei 0.29 0.15 2.37 0.18 0.10 0.08 0.69 1.28 0.90 0.85 0.0195 1.4253 0.10 -105.83 -19.22
36 Jiaozuo 0.35 0.16 2.17 0.20 0.10 0.10 0.76 1.14 0.88 0.91 0.0105 1.4722 0.05 -92.29 -39.35
37 Lanzhou 0.54 0.14 2.04 0.28 0.06 0.22 0.66 0.81 0.66 0.83 0.0197 1.5193 0.10 -126.17 -13.81
38 Nanjing 0.33 0.16 2.16 0.25 0.12 0.12 0.94 1.13 0.88 0.88 0.0154 1.4446 0.10 -143.38 -28.29
39 Nanning 0.30 0.18 2.53 0.20 0.13 0.06 0.97 1.36 0.95 0.92 0.0107 1.4272 0.07 -121.92 -33.35
40 Panyu 0.26 0.16 2.29 0.16 0.10 0.06 0.69 1.43 0.93 0.90 0.0137 1.4155 0.07 -96.03 -26.56
https://doi.org/10.5194/acp-2019-405Preprint. Discussion started: 28 May 2019c© Author(s) 2019. CC BY 4.0 License.

53
41 Shanghai 0.40 0.15 1.93 0.19 0.08 0.11 0.68 1.10 0.84 0.88 0.0142 1.4814 0.07 -106.89 -24.34
42 Shenyang 0.31 0.16 2.23 0.22 0.12 0.10 0.89 1.20 0.90 0.84 0.0253 1.4589 0.14 -144.88 -15.02
43 Tianjin 0.42 0.16 2.26 0.23 0.10 0.13 0.83 1.11 0.86 0.89 0.0134 1.4957 0.07 -108.09 -33.26
44 Urumqi 0.48 0.14 2.14 0.15 0.04 0.10 0.42 0.93 0.75 0.85 0.0192 1.5371 0.05 -70.55 -11.74
45 Xi'an 0.37 0.16 1.85 0.26 0.11 0.15 0.98 0.98 0.82 0.88 0.0150 1.4888 0.10 -132.55 -35.93
46 Yinchuan 0.38 0.14 2.02 0.11 0.04 0.07 0.37 1.12 0.81 0.94 0.0054 1.4930 0.02 -48.67 -21.89
47 Zhengzhou 0.43 0.18 2.22 0.28 0.12 0.16 0.99 1.10 0.86 0.95 0.0045 1.4626 0.04 -101.10 -46.18
48 Shijiazhuang 0.40 0.16 2.28 0.26 0.12 0.14 0.95 1.09 0.87 0.88 0.0154 1.4754 0.09 -125.05 -33.66
49 Wuhan 0.34 0.17 2.22 0.22 0.12 0.10 1.00 1.16 0.91 0.88 0.0196 1.4779 0.11 -171.80 -20.40
50 Zhuzilin 0.27 0.17 2.45 0.15 0.09 0.05 0.66 1.45 0.94 0.96 0.0049 1.4438 0.03 -73.16 -40.65
Average 0.37 0.16 2.22 0.21 0.10 0.11 0.79 1.15 0.86 0.90 0.0136 1.4695 0.07 -103.28 -30.05
Table 1 (Continued) 1215 a Optical parameters at a wavelength of 440 nm. 1216
b Angstrӧm exponents between 440 and 870 nm. 1217
https://doi.org/10.5194/acp-2019-405Preprint. Discussion started: 28 May 2019c© Author(s) 2019. CC BY 4.0 License.
Recommended