Acoustical Analysis of
Farmington High School
Auditorium
Farmington, CT
This report was prepared for Farmington High School, whose supportmade this student project possible.
Report # EAC-2015-14 May 21, 2015
A Division ofThe Engineering Applications Center
College of Engineering, Technology, & Architecture
by
withEoin King, Ph.D.
Robert D. Celmer, Ph.D.
Virginia DemskeJoshua Casserino
Director, Acoustics Laboratory
LEGAL NOTICE
This report was prepared as an account of Farmington High School sponsored work. Neither the University nor the Engineering Applications Center, nor any person acting onbehalf of the University:
A. Makes any warranty or representation, express or implied, with respect to theaccuracy, completeness, or usefulness of information contained in this report,or that the use of any information, apparatus, method, or process disclosed inthis report may not infringe on privately owned rights; or
B. Assumes any liability with respect to the use of, or for damages resultingfrom the use of any information, apparatus, method, or processes disclosed inthis report.
As used in the above, "person acting on behalf of the University" includes any employeeor contractor of the University to the extent that such employee or contractor prepares,handles or distributes, or provides access to any information pursuant to his employmentor contract with the University.
2
Abstract
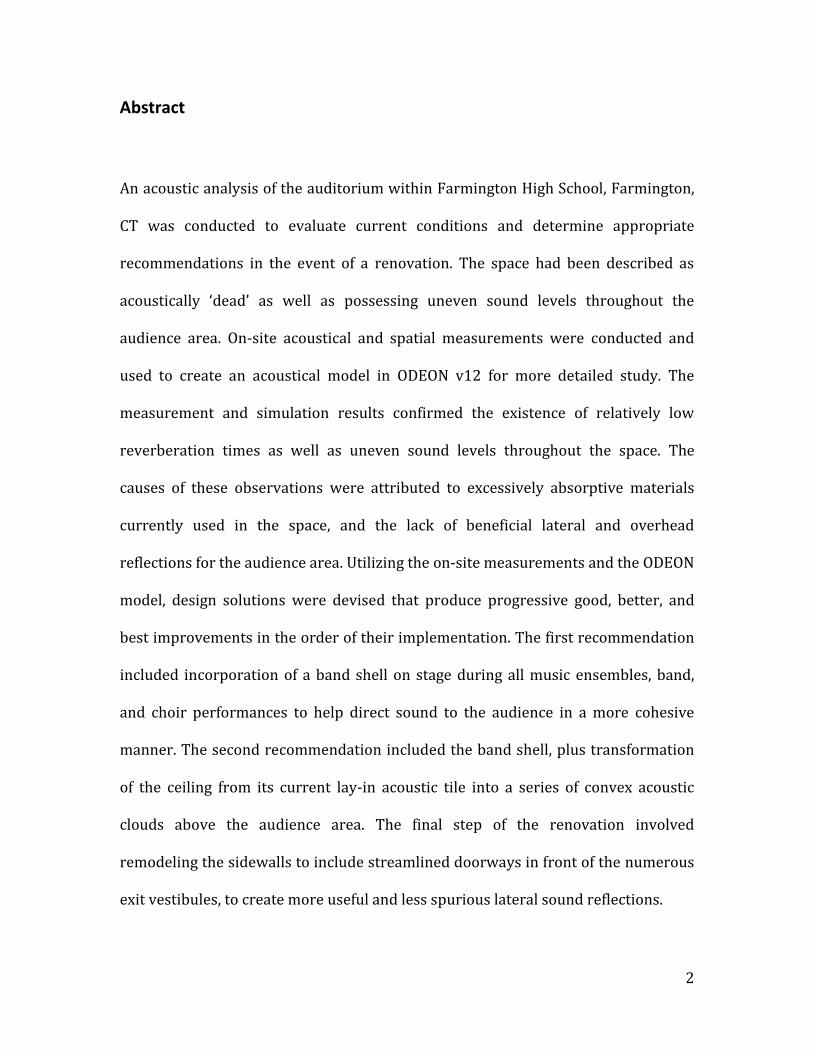
An acoustic analysis of the auditorium within Farmington High School, Farmington,
CT was conducted to evaluate current conditions and determine appropriate
recommendations in the event of a renovation. The space had been described as
acoustically ‘dead’ as well as possessing uneven sound levels throughout the
audience area. On-site acoustical and spatial measurements were conducted and
used to create an acoustical model in ODEON v12 for more detailed study. The
measurement and simulation results confirmed the existence of relatively low
reverberation times as well as uneven sound levels throughout the space. The
causes of these observations were attributed to excessively absorptive materials
currently used in the space, and the lack of beneficial lateral and overhead
reflections for the audience area. Utilizing the on-site measurements and the ODEON
model, design solutions were devised that produce progressive good, better, and
best improvements in the order of their implementation. The first recommendation
included incorporation of a band shell on stage during all music ensembles, band,
and choir performances to help direct sound to the audience in a more cohesive
manner. The second recommendation included the band shell, plus transformation
of the ceiling from its current lay-in acoustic tile into a series of convex acoustic
clouds above the audience area. The final step of the renovation involved
remodeling the sidewalls to include streamlined doorways in front of the numerous
exit vestibules, to create more useful and less spurious lateral sound reflections.
3
TableofContents
Abstract........................................................................................................................................2
ListofFigures.............................................................................................................................4
BackgroundInformation.......................................................................................................5
History....................................................................................................................................................5
SpeechIntelligibilityandVolume.................................................................................................5
TheoryandProcedure............................................................................................................7
Theory.....................................................................................................................................................7
Procedure..............................................................................................................................................9
SiteVisitandMeasurements.....................................................................................................................9
Roommodeling............................................................................................................................................10
RayTracing....................................................................................................................................................11
Results.......................................................................................................................................12
On‐siteMeasurements...................................................................................................................12
On‐siteReverberationTimeMeasurement......................................................................................12
BackgroundNoiseLevelNoiseCriterion(NC)Curves................................................................13
CurrentRoomModel......................................................................................................................15
ReverberationTimeComparison‐Measuredvs.Simulated.....................................................16
RecommendationOne....................................................................................................................20
Recommendation2.........................................................................................................................24
Recommendation3.........................................................................................................................30
DiscussionandConclusion.................................................................................................35
EconomicFactors.............................................................................................................................38
References................................................................................................................................39
Appendices...............................................................................................................................40
4
List of Figures
Figure 1: On-site reverberation time measurements .................................................................................................. 12
Figure 2: Background noise level measurements with HVAC system ON .......................................................... 13
Figure 3: Background noise level measurements with HVAC stystem OFF ...................................................... 14
Figure 4: Current room model view A ................................................................................................................................ 15
Figure 5: Current room model view B ................................................................................................................................ 15
Figure 6: Reverberation measurements vs. reverberation simulation ............................................................... 16
Figure 7: Current room SPL for a talker .............................................................. Error! Bookmark not defined.
Figure 8: Current room SPL for an ensemble.................................................................................................................. 17
Figure 9: Reverberation time vs. Room volume [2]………………………………………...................................………18
Figure 10: Ray tracing analysis of the current room .................................. Error! Bookmark not defined.9
Figure 11: Recommendation one model view A ............................................................................................................ 21
Figure 12: Recommendation one model view B ............................................................................................................ 21
Figure 13: Recommendation one SPL for a talker ........................................................................................................ 22
Figure 14: Recommendation one SPL for an emsemble ............................................................................................ 22
Figure 15: Recommendation one reverberation simulation .................................................................................... 23
Figure 16: Recommendation two ray tracing analysis ................................. Error! Bookmark not defined.
Figure 17: Approximate Reflector Placement Diagram ............................................................................................. 26
Figure 18: Recommendation two model view A ........................................................................................................... 27
Figure 19: Recommendation two model view B............................................................................................................ 27
Figure 20: Recommendation two SPL for a talker .......................................... Error! Bookmark not defined.
Figure 21: Recommendation two SPL for an emsemble .............................. Error! Bookmark not defined.
Figure 22: Recommendation two reverberation simulation ................................................................................... 33
Figure 23: Recommendation three model view A ........................................................................................................ 31
Figure 24: Recommendation three model view B ........................................................................................................ 31
Figure 25: Recommendation three SPL for a talker ..................................................................................................... 32
Figure 26: Recommendation three SPL for an ensemble.....................…………………………………………………32
Figure 27: Recommendation three reverberation simulation.............................…………………………………...33
Figure 28: Recommendation three speech clarity analysis......................................................................................34
Figure 29: Current and Recommendation one ensemble comparison................................................................35
Figure 30: Current and Recommendation two talker comparison.......................................................................36
Figure 31: Current and Recommendation two ensemble comparison...............................................................36
Figure 32: Current and Recommendation three talker comparison....................................................................37
Figure 33: Current and Recommendation three ensemble comparison............................................................37
5
Purpose
Farmington High School has reportedly received complaints that their auditorium
lacks sound volume and possesses an uneven distribution of sound within the
audience area. The purpose of this project was to analyze the auditorium at
Farmington High School for its acoustical qualities, and to make recommendations
in the event of a renovation.
Background Information
History
The Farmington High School Auditorium is located in Farmington, CT. It was built in
1978 and seats 568 with room for 12 wheelchairs. The room is a fan shape, with
rake seating, and includes an audio booth, an orchestra pit, a main stage, suspended
acoustical reflectors above the stage, a backstage area, as well as four access
doorways located within deep vestibule hallways alongside the left and right walls
of the auditorium. The current ceiling consists of acoustical lay-in tile with varying
slopes. The walls utilize a type of split-face concrete masonry units (CMU). The
seating is upholstered and the floor consists of short pile carpet glued to concrete.
The stage is primarily wooden.
Speech Intelligibility and Volume
A renovation has been discussed for the auditorium, to address both visual and
acoustical issues within the space. It has been reported that audience members
6
perceive the space as “dead”/“too quiet” as well as an uneven response across the
entire the audience area. Without amplification, there is minimal sound propagation
and a talker on stage reportedly cannot be heard in the audience. Similar problems
of poor sound level have been reported to occur when an ensemble plays from
within the stage area, Moreover, the Heating, Ventilation and Air Conditioning
System (HVAC) has supply vents directly above the stage. When the HVAC system is
on, performances on stage are reported to be difficult to hear. When the system is
off, basic thermal comfort conditions are not met, for both the performers and the
audience. According to school personnel, the auditorium has not been renovated
since the original construction.
7
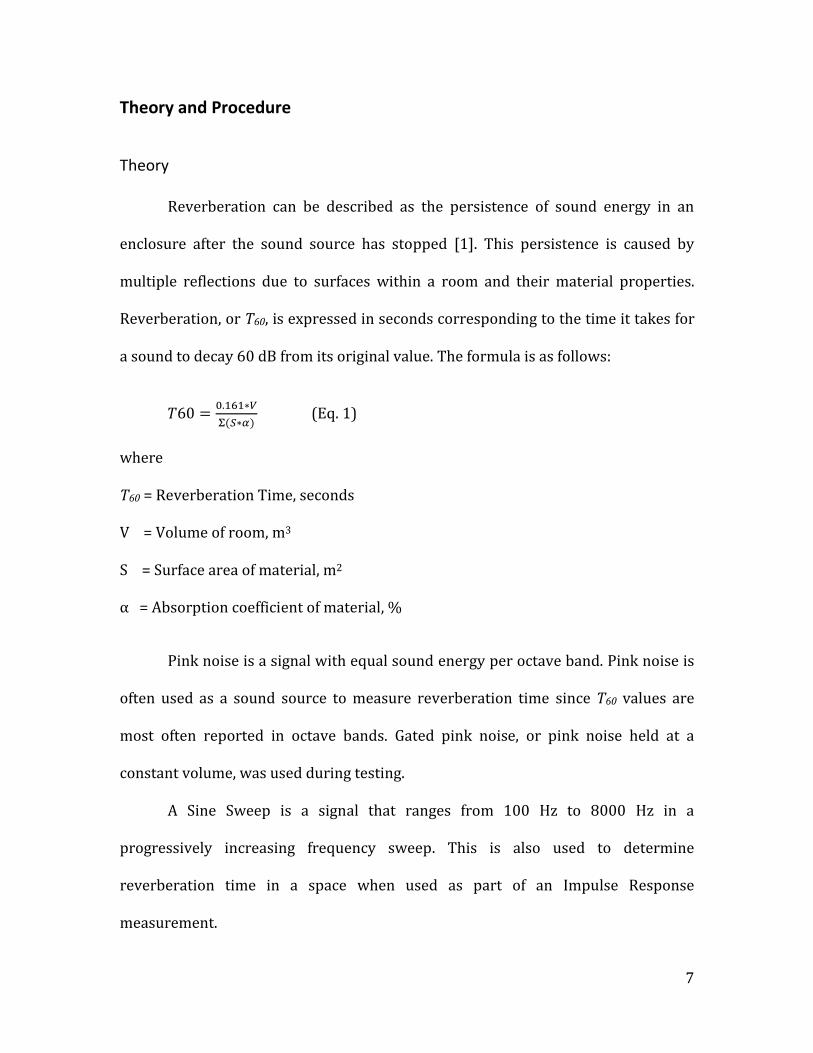
Theory and Procedure
Theory
Reverberation can be described as the persistence of sound energy in an
enclosure after the sound source has stopped [1]. This persistence is caused by
multiple reflections due to surfaces within a room and their material properties.
Reverberation, or T60, is expressed in seconds corresponding to the time it takes for
a sound to decay 60 dB from its original value. The formula is as follows:
𝑇60 =0.161∗𝑉
Σ(𝑆∗𝛼) (Eq. 1)
where
T60 = Reverberation Time, seconds
V = Volume of room, m3
S = Surface area of material, m2
α = Absorption coefficient of material, %
Pink noise is a signal with equal sound energy per octave band. Pink noise is
often used as a sound source to measure reverberation time since T60 values are
most often reported in octave bands. Gated pink noise, or pink noise held at a
constant volume, was used during testing.
A Sine Sweep is a signal that ranges from 100 Hz to 8000 Hz in a
progressively increasing frequency sweep. This is also used to determine
reverberation time in a space when used as part of an Impulse Response
measurement.
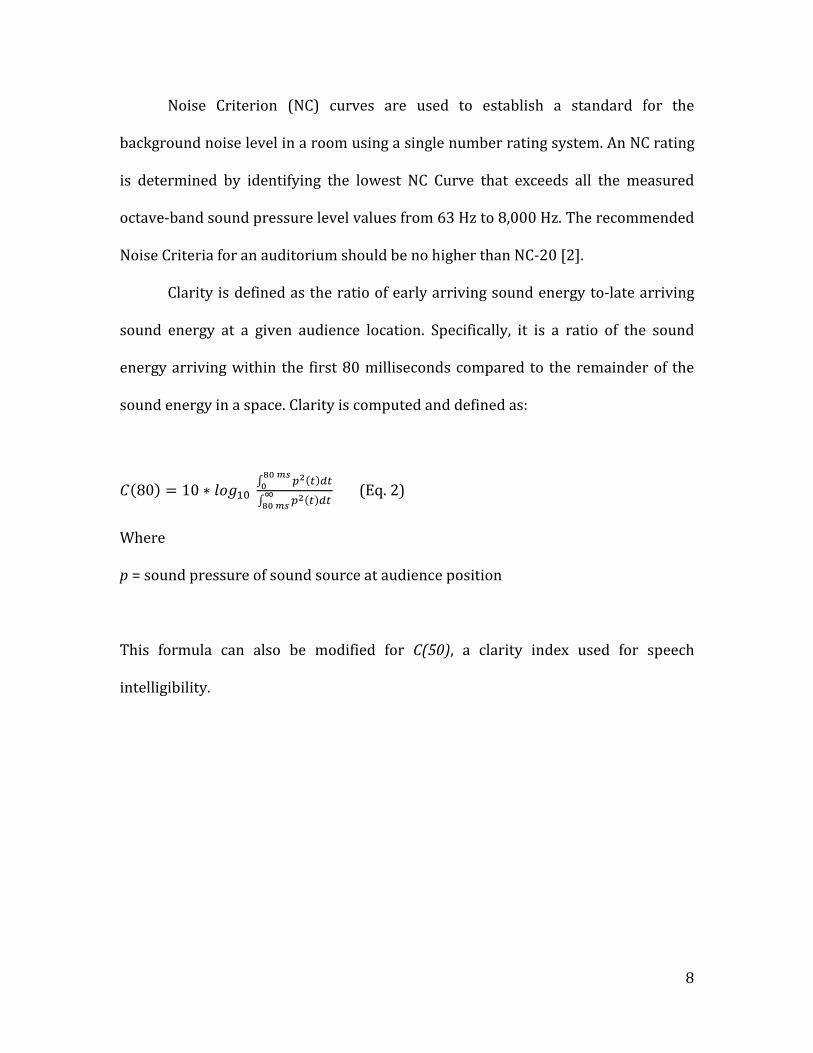
8
Noise Criterion (NC) curves are used to establish a standard for the
background noise level in a room using a single number rating system. An NC rating
is determined by identifying the lowest NC Curve that exceeds all the measured
octave-band sound pressure level values from 63 Hz to 8,000 Hz. The recommended
Noise Criteria for an auditorium should be no higher than NC-20 [2].
Clarity is defined as the ratio of early arriving sound energy to-late arriving
sound energy at a given audience location. Specifically, it is a ratio of the sound
energy arriving within the first 80 milliseconds compared to the remainder of the
sound energy in a space. Clarity is computed and defined as:
𝐶(80) = 10 ∗ 𝑙𝑜𝑔10 ∫ 𝑝2(𝑡)𝑑𝑡
80 𝑚𝑠0
∫ 𝑝2(𝑡)𝑑𝑡∞
80 𝑚𝑠
(Eq. 2)
Where
p = sound pressure of sound source at audience position
This formula can also be modified for C(50), a clarity index used for speech
intelligibility.
9
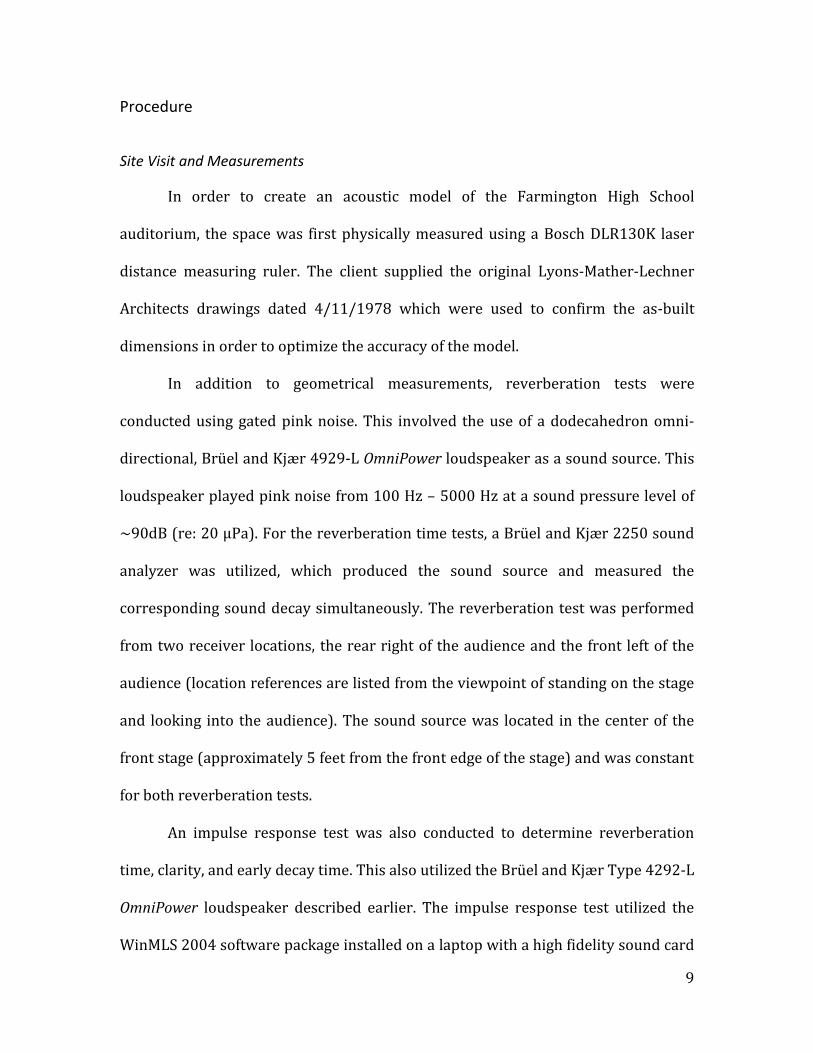
Procedure
Site Visit and Measurements
In order to create an acoustic model of the Farmington High School
auditorium, the space was first physically measured using a Bosch DLR130K laser
distance measuring ruler. The client supplied the original Lyons-Mather-Lechner
Architects drawings dated 4/11/1978 which were used to confirm the as-built
dimensions in order to optimize the accuracy of the model.
In addition to geometrical measurements, reverberation tests were
conducted using gated pink noise. This involved the use of a dodecahedron omni-
directional, Brüel and Kjær 4929-L OmniPower loudspeaker as a sound source. This
loudspeaker played pink noise from 100 Hz – 5000 Hz at a sound pressure level of
~90dB (re: 20 μPa). For the reverberation time tests, a Brüel and Kjær 2250 sound
analyzer was utilized, which produced the sound source and measured the
corresponding sound decay simultaneously. The reverberation test was performed
from two receiver locations, the rear right of the audience and the front left of the
audience (location references are listed from the viewpoint of standing on the stage
and looking into the audience). The sound source was located in the center of the
front stage (approximately 5 feet from the front edge of the stage) and was constant
for both reverberation tests.
An impulse response test was also conducted to determine reverberation
time, clarity, and early decay time. This also utilized the Brüel and Kjær Type 4292-L
OmniPower loudspeaker described earlier. The impulse response test utilized the
WinMLS 2004 software package installed on a laptop with a high fidelity sound card
10
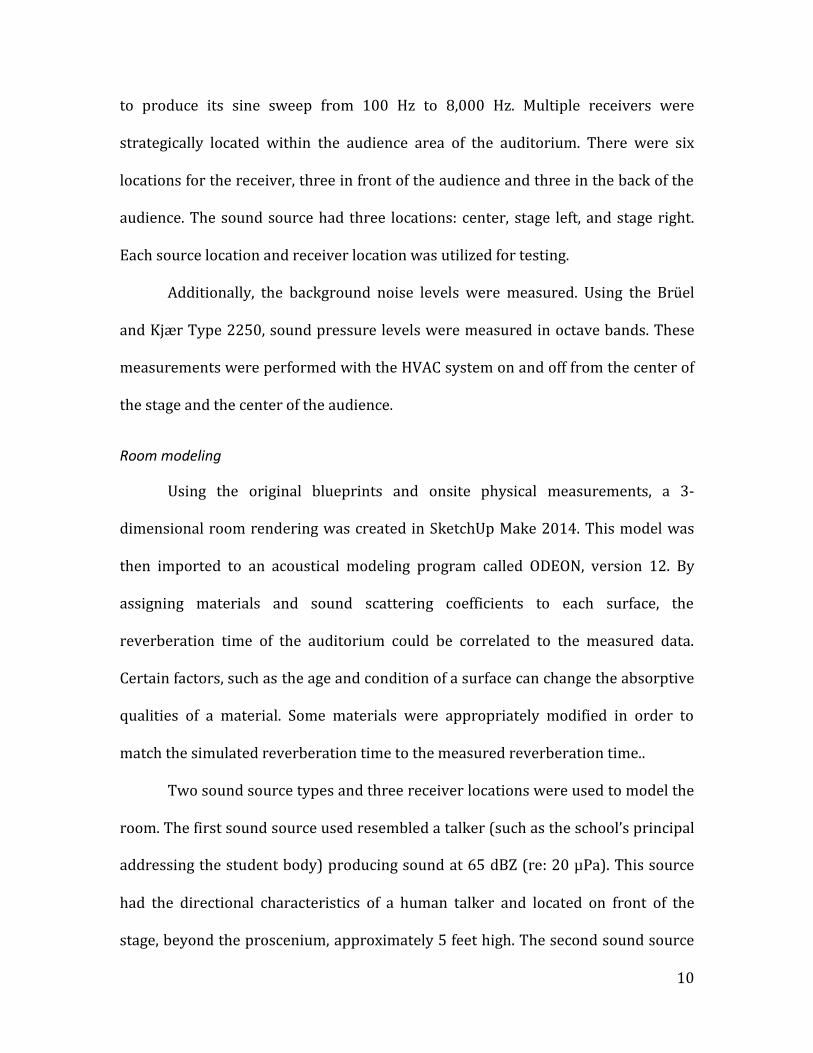
to produce its sine sweep from 100 Hz to 8,000 Hz. Multiple receivers were
strategically located within the audience area of the auditorium. There were six
locations for the receiver, three in front of the audience and three in the back of the
audience. The sound source had three locations: center, stage left, and stage right.
Each source location and receiver location was utilized for testing.
Additionally, the background noise levels were measured. Using the Brüel
and Kjær Type 2250, sound pressure levels were measured in octave bands. These
measurements were performed with the HVAC system on and off from the center of
the stage and the center of the audience.
Room modeling
Using the original blueprints and onsite physical measurements, a 3-
dimensional room rendering was created in SketchUp Make 2014. This model was
then imported to an acoustical modeling program called ODEON, version 12. By
assigning materials and sound scattering coefficients to each surface, the
reverberation time of the auditorium could be correlated to the measured data.
Certain factors, such as the age and condition of a surface can change the absorptive
qualities of a material. Some materials were appropriately modified in order to
match the simulated reverberation time to the measured reverberation time..
Two sound source types and three receiver locations were used to model the
room. The first sound source used resembled a talker (such as the school’s principal
addressing the student body) producing sound at 65 dBZ (re: 20 µPa). This source
had the directional characteristics of a human talker and located on front of the
stage, beyond the proscenium, approximately 5 feet high. The second sound source
11
emulated a musical instrument ensemble at 65 dBZ. This source was omni-
directional to simulate a broad range of instruments and located in the middle of the
stage approximately 4 feet high (simulating a seated position). Three receiver
locations were used at ear level located in the front middle and rear sections of the
auditorium. For each sound source, a sound pressure level (SPL) analysis was
performed and observed at 1000 Hz and 2,000 Hz to analyze the evenness and
loudness of sound in the room.
Ray Tracing
There are two ways of simulating reflector coverage due to the presence of
acoustic clouds in a space. One method is the “Ray Tracing Method”, in which the
specular angle of reflection is found by hand. For a candidate position of a given
cloud, the incident sound angle equals the reflection angle from the line normal to
the surface of the reflector. Another method utilizes the ODEON acoustic modeling
software. When the sources and receivers are defined in a space, ray tracing
simulations can be implemented using the image-source principle as well as
assigned scattering coefficients. Both methods were used during this analysis.
12
Results
On-site Measurements
On-site Reverberation Time Measurement
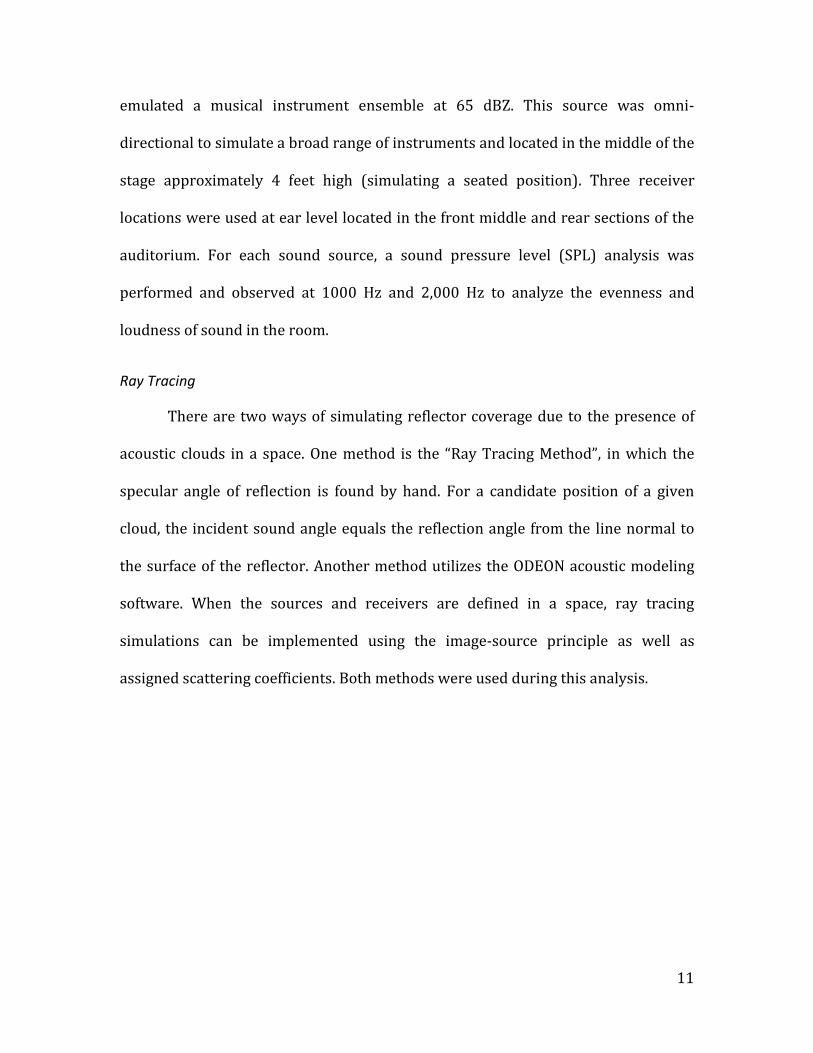
Figure 1 : On-site reverberation time measurements
0
0.2
0.4
0.6
0.8
1
1.2
1.4
125 250 500 1000 2000 4000 8000
Re
verb
era
tio
n T
ime
(T
60
)
Octave Band Center Frequency (Hz)
Sound LevelMeter
ImpulseResponse Test
13
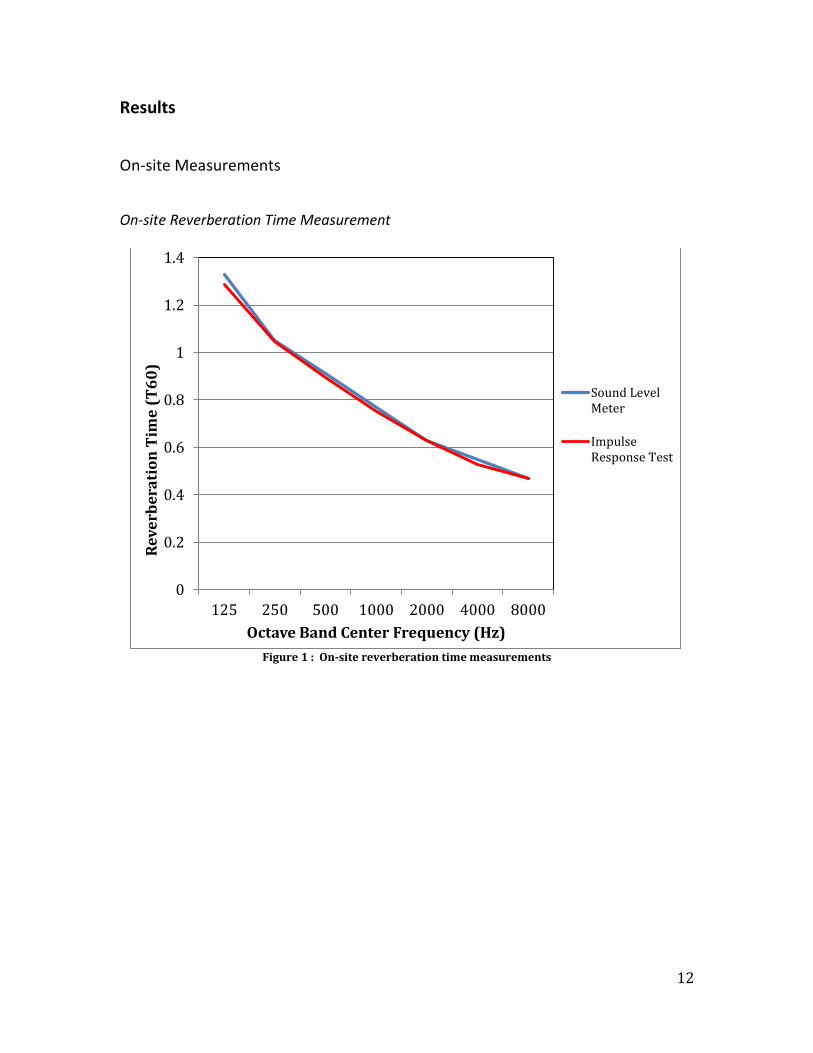
Background Noise Level Noise Criterion (NC) Curves
Figure 2: Background noise level measurements with HVAC system ON
10
20
30
40
50
60
70
80
90
62.5 125 250 500 1000 2000 4000 8000
So
un
d P
ress
ure
Le
ve
l, d
B (
re:
20
mic
roP
a)
Frequency, Hz
NC Curve - HVAC System "ON" BNL
NC-70
NC-65
NC-60
NC-55
NC-50
NC-45
NC-40
NC-35
NC-30
NC-25
NC-20
NC-15
14
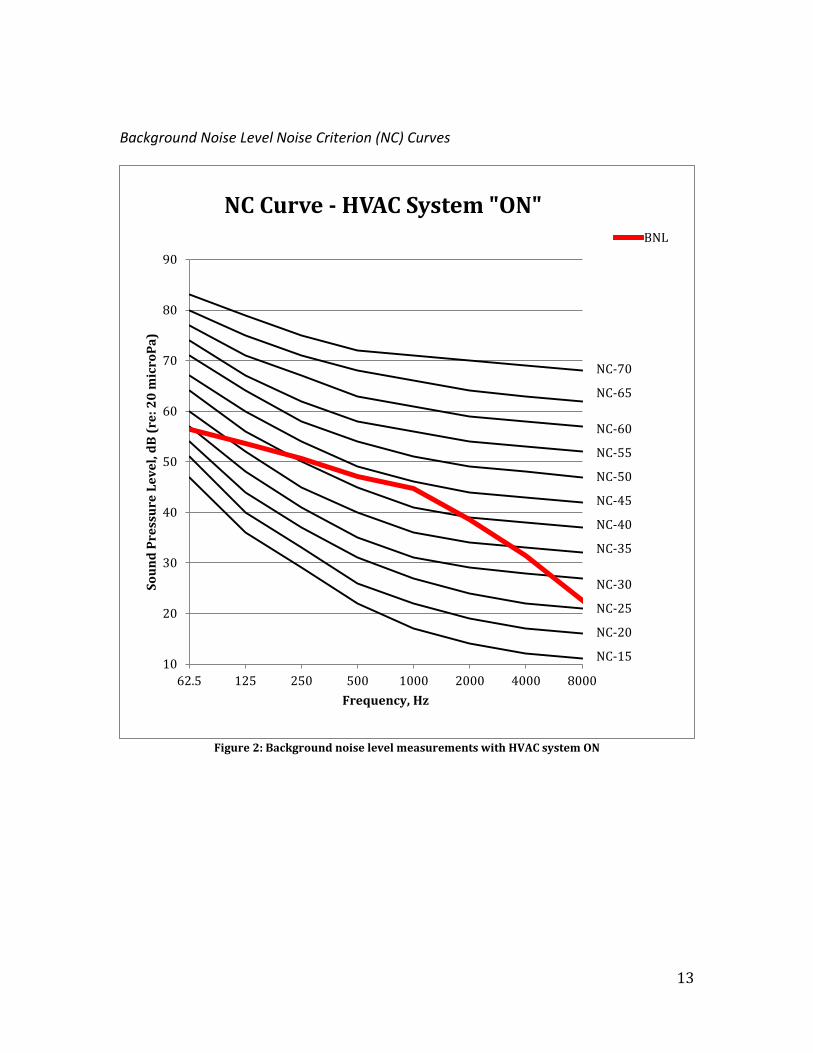
Figure 3: Background noise level measurements with HVAC system OFF
The current auditorium exhibited a Noise Criteria rating of NC 45 when the HVAC system was on, and NC 25 when the system was off. These exceed the recommended value of NC 20 for an auditorium [2].
10
20
30
40
50
60
70
80
90
62.5 125 250 500 1000 2000 4000 8000
So
un
d P
ress
ure
Le
ve
l, d
B (
re:
20
mic
roP
a)
Frequency, Hz
NC Curve - HVAC System "OFF"
BNL
NC-70
NC-65
NC-60
NC-55
NC-50
NC-45
NC-40
NC-35
NC-30
NC-25
NC-20
NC-15
15
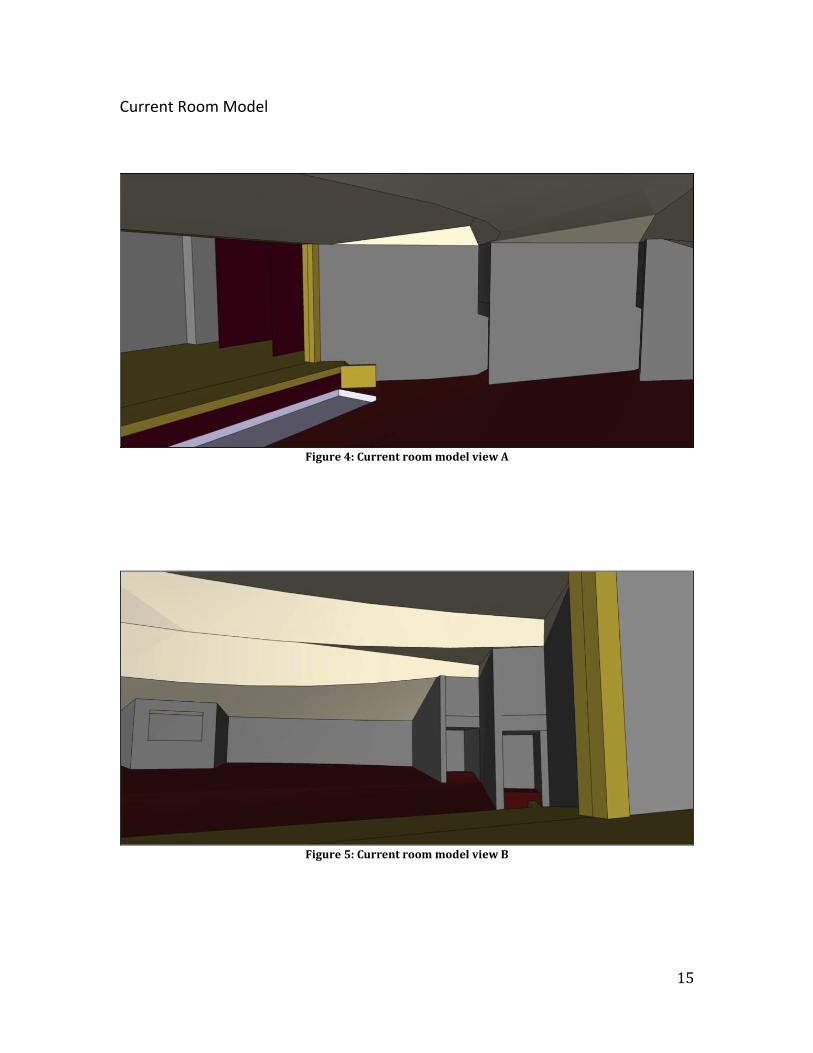
Current Room Model
Figure 4: Current room model view A
Figure 5: Current room model view B
16
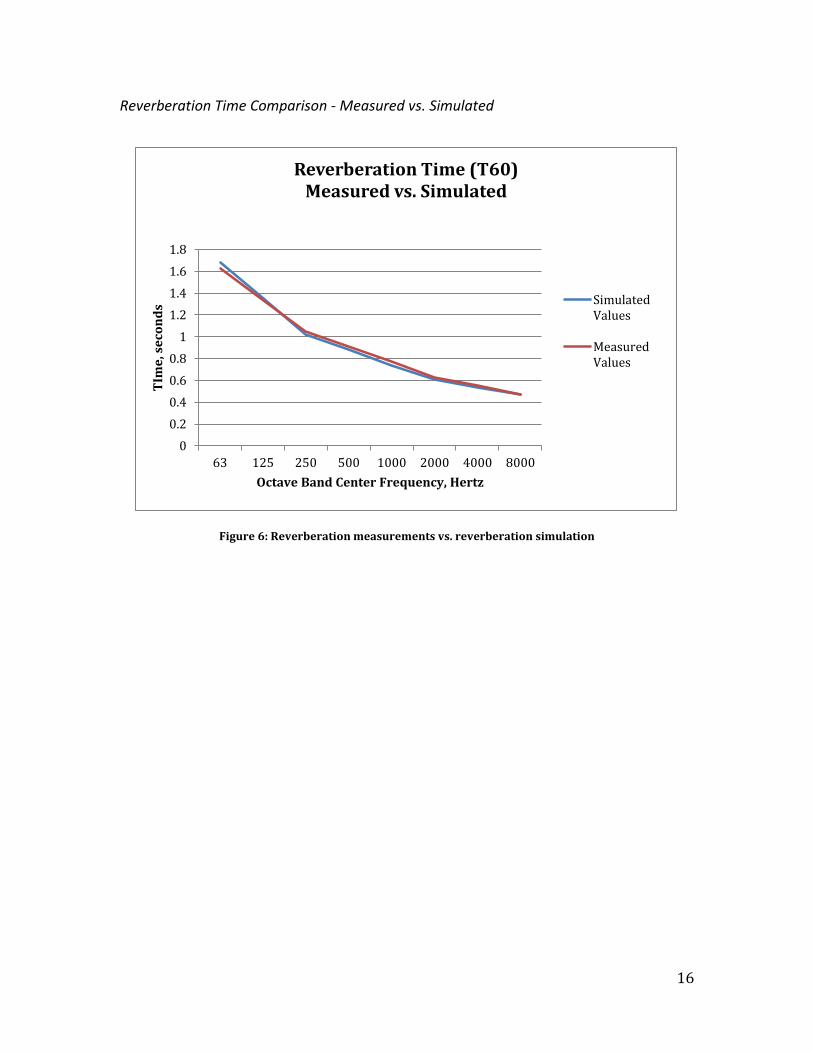
Reverberation Time Comparison - Measured vs. Simulated
Figure 6: Reverberation measurements vs. reverberation simulation
0
0.2
0.4
0.6
0.8
1
1.2
1.4
1.6
1.8
63 125 250 500 1000 2000 4000 8000
TIm
e, s
eco
nd
s
Octave Band Center Frequency, Hertz
Reverberation Time (T60) Measured vs. Simulated
SimulatedValues
MeasuredValues
17
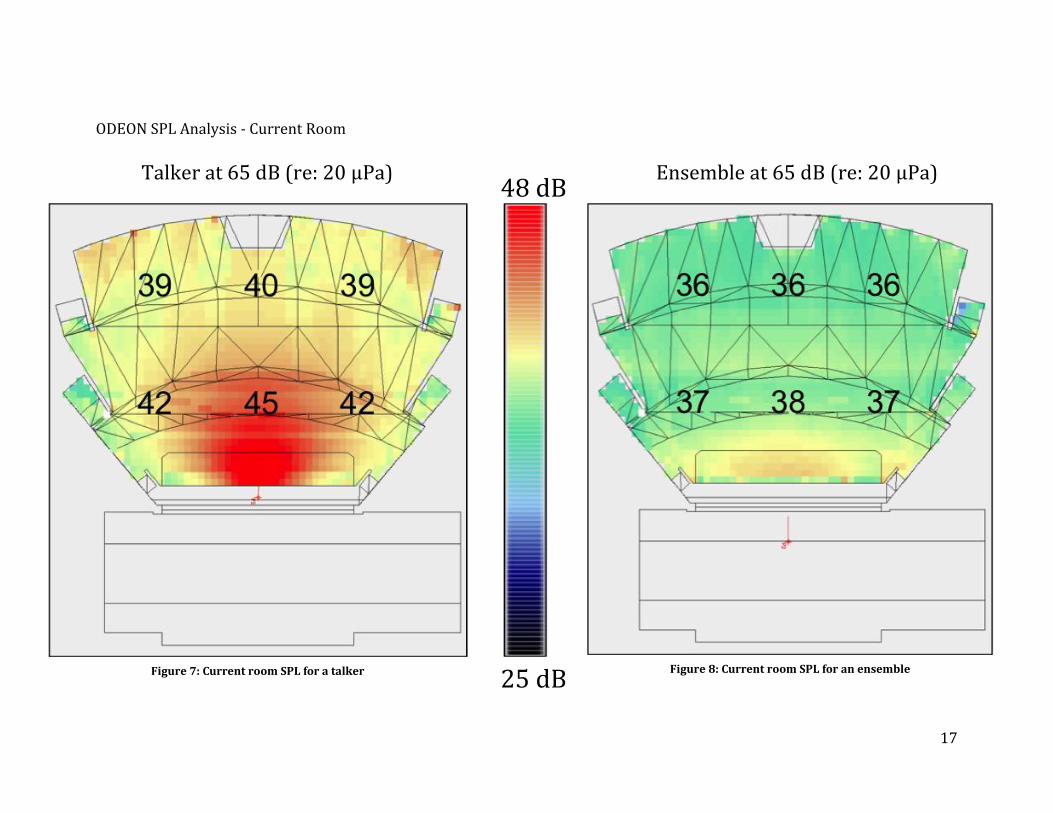
ODEON SPL Analysis - Current Room
48 dB
25 dB
Talker at 65 dB (re: 20 μPa) Ensemble at 65 dB (re: 20 μPa)
Figure 7: Current room SPL for a talker Figure 8: Current room SPL for an ensemble
18
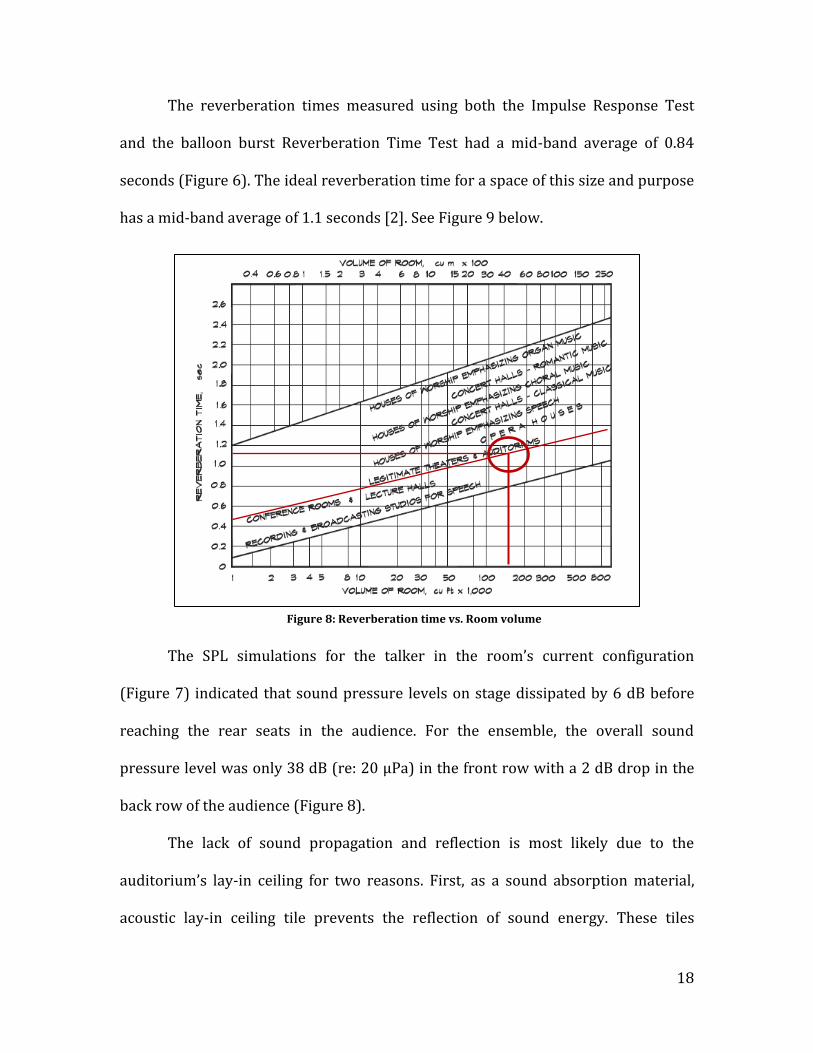
The reverberation times measured using both the Impulse Response Test
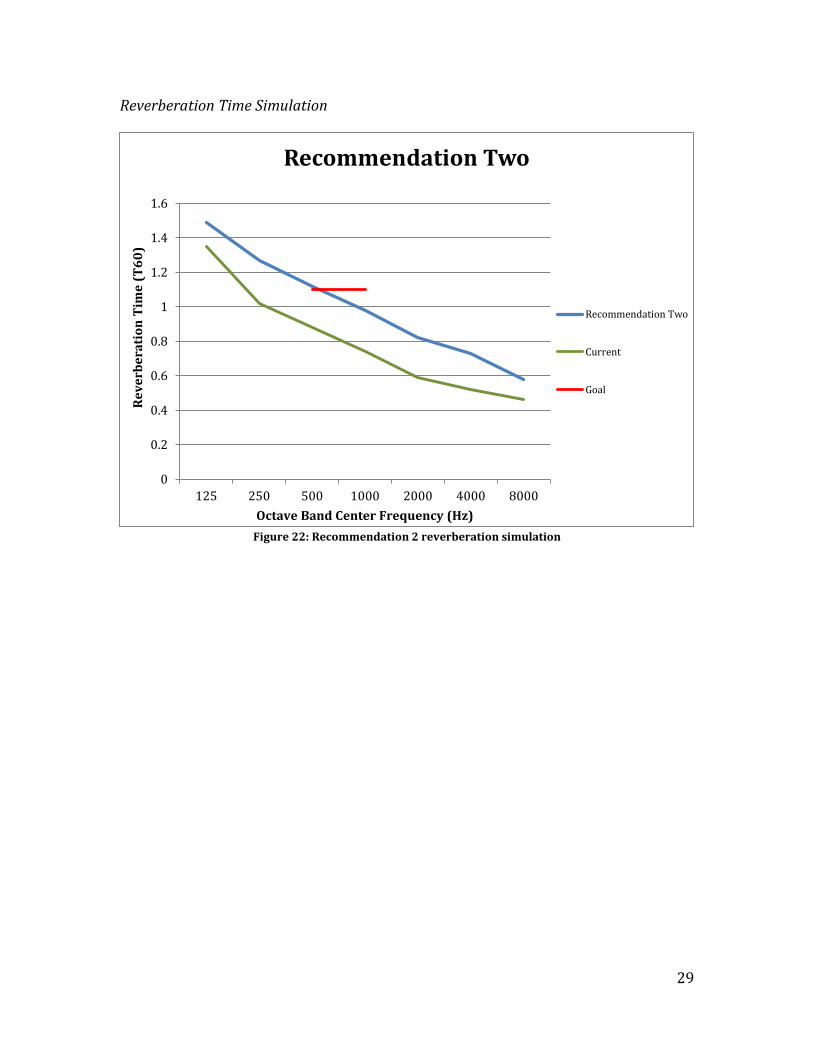
and the balloon burst Reverberation Time Test had a mid-band average of 0.84
seconds (Figure 6). The ideal reverberation time for a space of this size and purpose
has a mid-band average of 1.1 seconds [2]. See Figure 9 below.
The SPL simulations for the talker in the room’s current configuration
(Figure 7) indicated that sound pressure levels on stage dissipated by 6 dB before
reaching the rear seats in the audience. For the ensemble, the overall sound
pressure level was only 38 dB (re: 20 μPa) in the front row with a 2 dB drop in the
back row of the audience (Figure 8).
The lack of sound propagation and reflection is most likely due to the
auditorium’s lay-in ceiling for two reasons. First, as a sound absorption material,
acoustic lay-in ceiling tile prevents the reflection of sound energy. These tiles
Figure 8: Reverberation time vs. Room volume
19
contribute the majority of the acoustic absorption within the space, and the
corresponding low reverberation time measured in the auditorium. Second, the
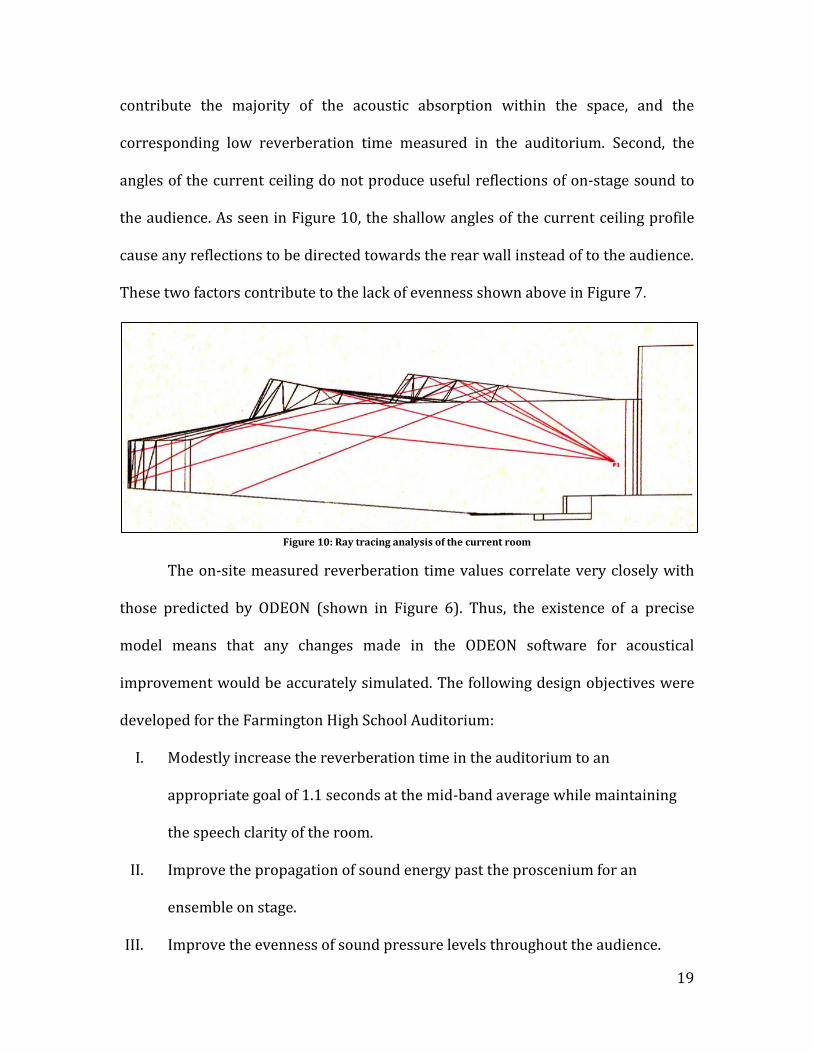
angles of the current ceiling do not produce useful reflections of on-stage sound to
the audience. As seen in Figure 10, the shallow angles of the current ceiling profile
cause any reflections to be directed towards the rear wall instead of to the audience.
These two factors contribute to the lack of evenness shown above in Figure 7.
Figure 10: Ray tracing analysis of the current room
The on-site measured reverberation time values correlate very closely with
those predicted by ODEON (shown in Figure 6). Thus, the existence of a precise
model means that any changes made in the ODEON software for acoustical
improvement would be accurately simulated. The following design objectives were
developed for the Farmington High School Auditorium:
I. Modestly increase the reverberation time in the auditorium to an
appropriate goal of 1.1 seconds at the mid-band average while maintaining
the speech clarity of the room.
II. Improve the propagation of sound energy past the proscenium for an
ensemble on stage.
III. Improve the evenness of sound pressure levels throughout the audience.
20
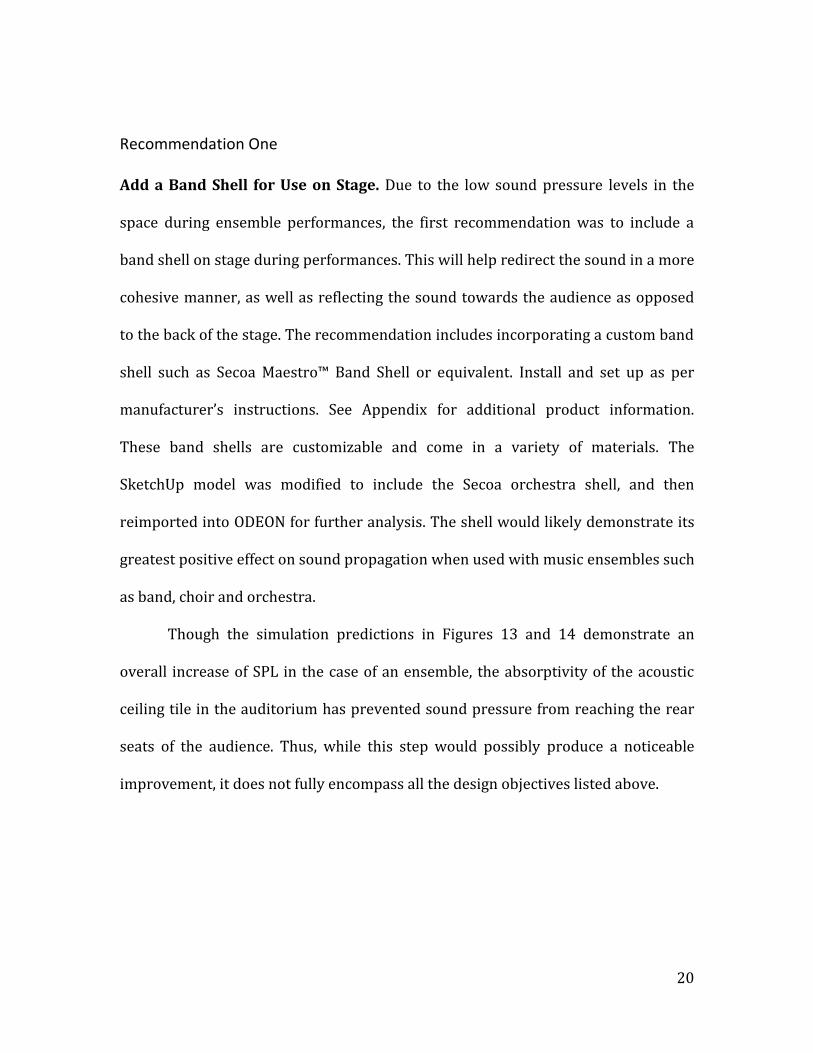
Recommendation One
Add a Band Shell for Use on Stage. Due to the low sound pressure levels in the
space during ensemble performances, the first recommendation was to include a
band shell on stage during performances. This will help redirect the sound in a more
cohesive manner, as well as reflecting the sound towards the audience as opposed
to the back of the stage. The recommendation includes incorporating a custom band
shell such as Secoa Maestro™ Band Shell or equivalent. Install and set up as per
manufacturer’s instructions. See Appendix for additional product information.
These band shells are customizable and come in a variety of materials. The
SketchUp model was modified to include the Secoa orchestra shell, and then
reimported into ODEON for further analysis. The shell would likely demonstrate its
greatest positive effect on sound propagation when used with music ensembles such
as band, choir and orchestra.
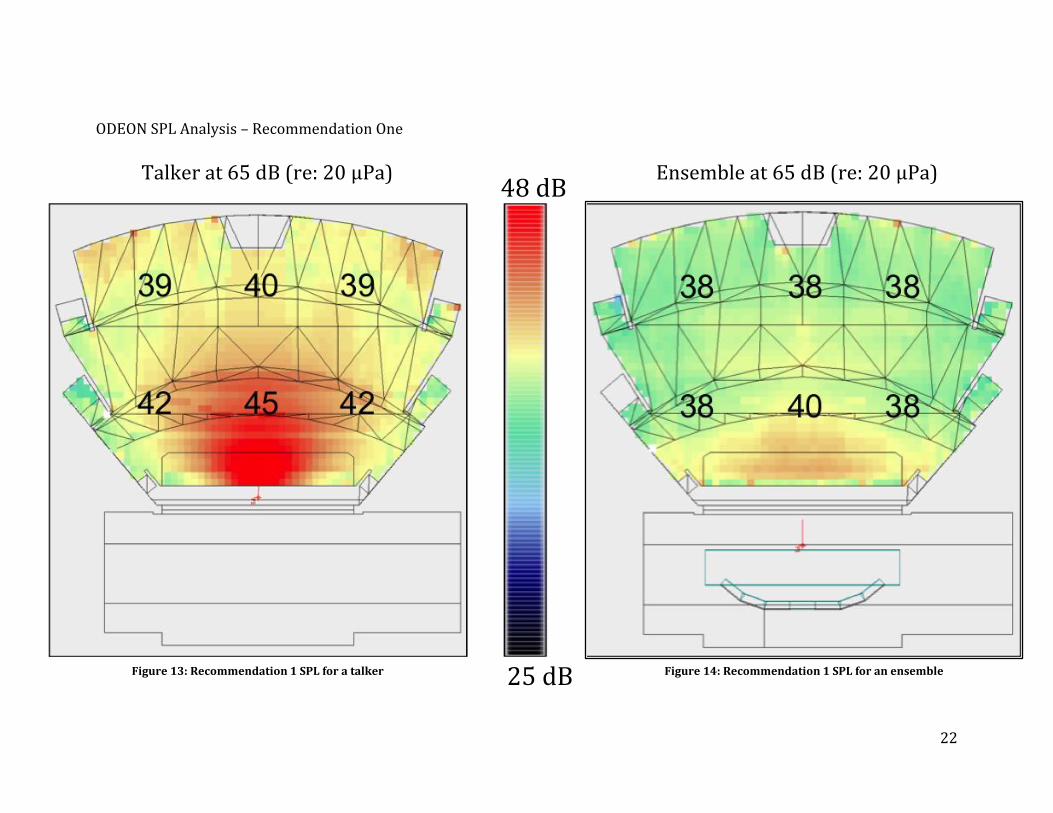
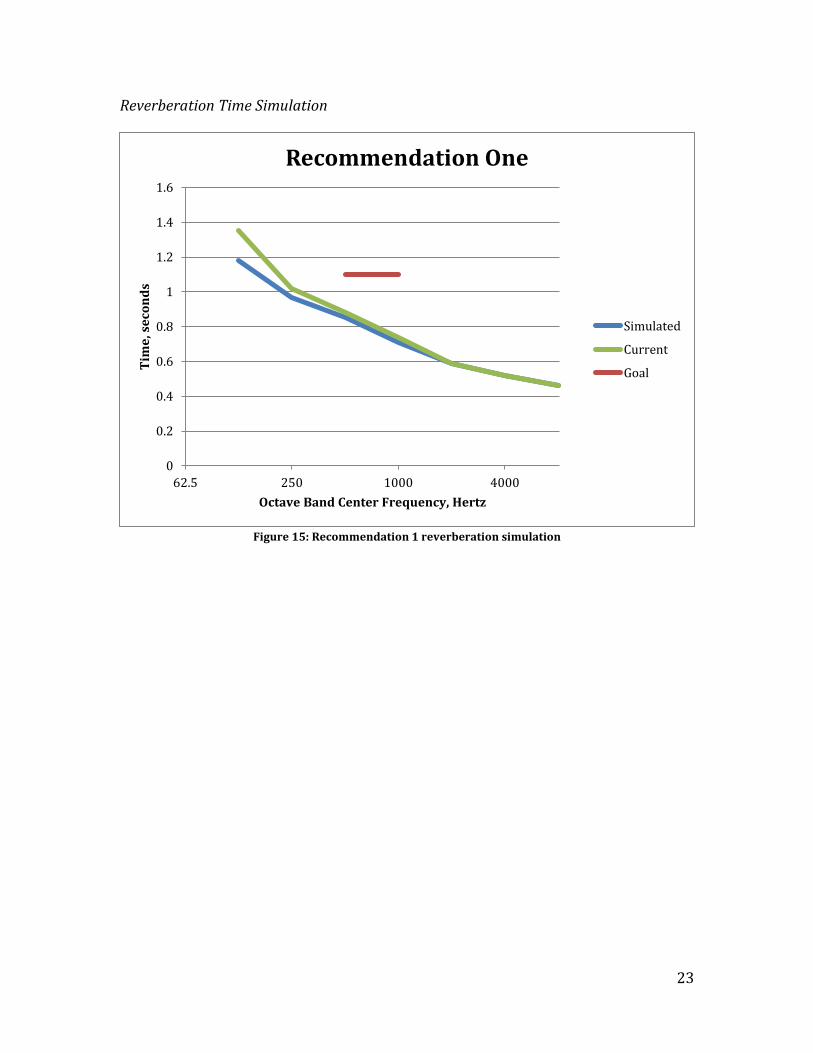
Though the simulation predictions in Figures 13 and 14 demonstrate an
overall increase of SPL in the case of an ensemble, the absorptivity of the acoustic
ceiling tile in the auditorium has prevented sound pressure from reaching the rear
seats of the audience. Thus, while this step would possibly produce a noticeable
improvement, it does not fully encompass all the design objectives listed above.
21
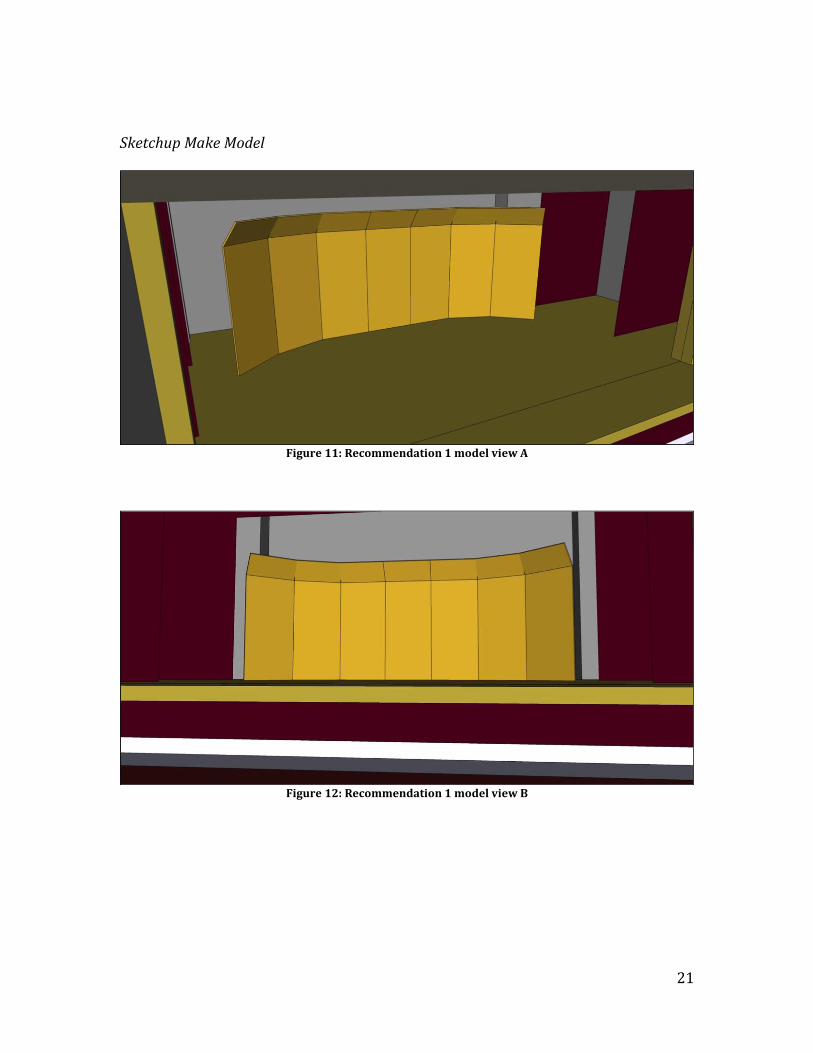
Sketchup Make Model
Figure 11: Recommendation 1 model view A
Figure 12: Recommendation 1 model view B
22
ODEON SPL Analysis – Recommendation One
48 dB Talker at 65 dB (re: 20 μPa) Ensemble at 65 dB (re: 20 μPa)
Figure 13: Recommendation 1 SPL for a talker Figure 14: Recommendation 1 SPL for an ensemble 25 dB
23
Reverberation Time Simulation
Figure 15: Recommendation 1 reverberation simulation
0
0.2
0.4
0.6
0.8
1
1.2
1.4
1.6
62.5 250 1000 4000
Tim
e, s
eco
nd
s
Octave Band Center Frequency, Hertz
Recommendation One
Simulated
Current
Goal
24
Recommendation 2
Add Band Shell + Replace Ceiling above Audience with Acoustic Clouds.
Recommendation Two includes all of Recommendation One, and entails removing
the acoustic ceiling tile and frame, exposing the true ceiling deck underneath, adding
absorption to a significant portion of that ceiling deck, and installing acoustic ceiling
clouds.
To add absorption to the exposed ceiling deck, apply at least 5,000 ft2 of 2”
thick Johns-Manville Permacote® Linacoustic® R-300 rigid fiberglass plenum liner
board to the underside of the metal deck. Install as per manufacturer’s instructions.
See Appendix * for additional product information.
For the ceiling clouds, use Kinetics™ Ovation Reflector Panels or equivalent
adjustable acoustic clouds. Install approximately 2,400 ft2 of these convex reflectors
using the approximate arrangement and location dimensions shown in Figure 17
below. Install as per manufacturer’s instructions. See Appendix for additional
product information. These acoustic clouds can help redirect useful reflections to
strategic portions of the audience to aid in increasing sound pressure levels and
evenness throughout the space. To find the proper direction of reflections, the Ray
Tracing Method was implemented and confirmed in ODEON. Figures 20 and 21
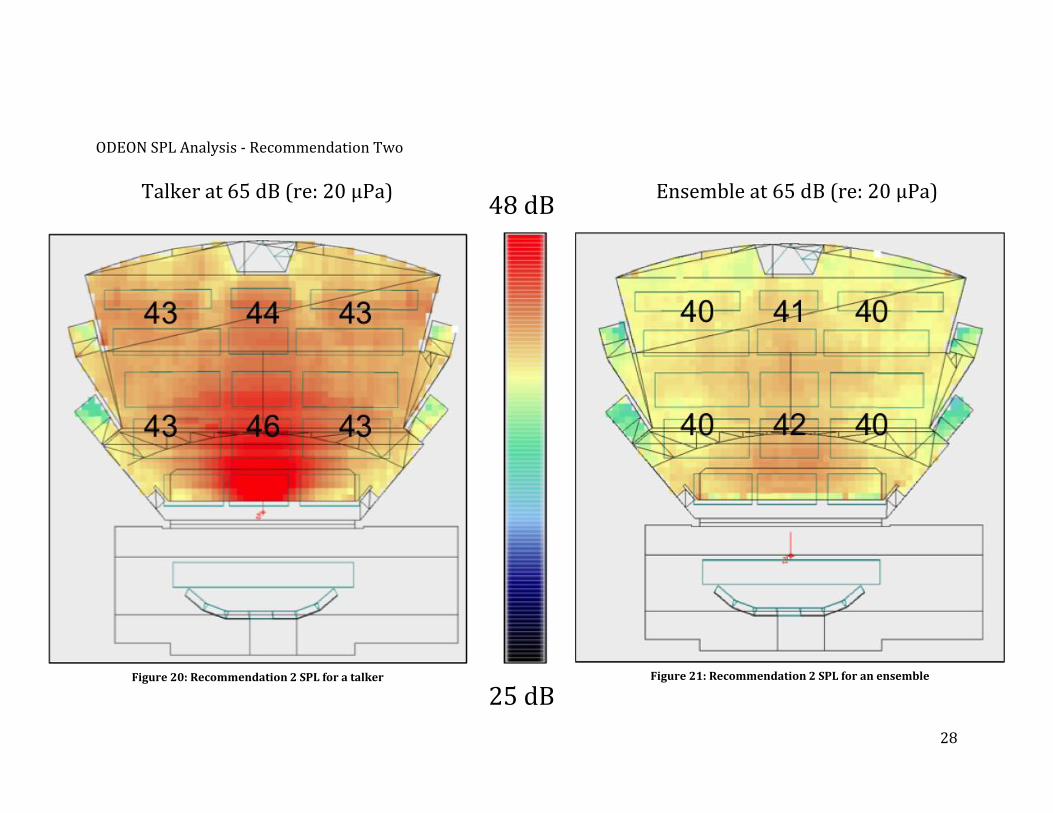
below demonstrate the improvement predicted for Recommendation 2.
In order to accommodate a talker on stage, the sound reflections should be
directed towards the audience. Because of this, the second recommendation
includes an entire ceiling renovation in addition to the Secoa orchestra shell.
25
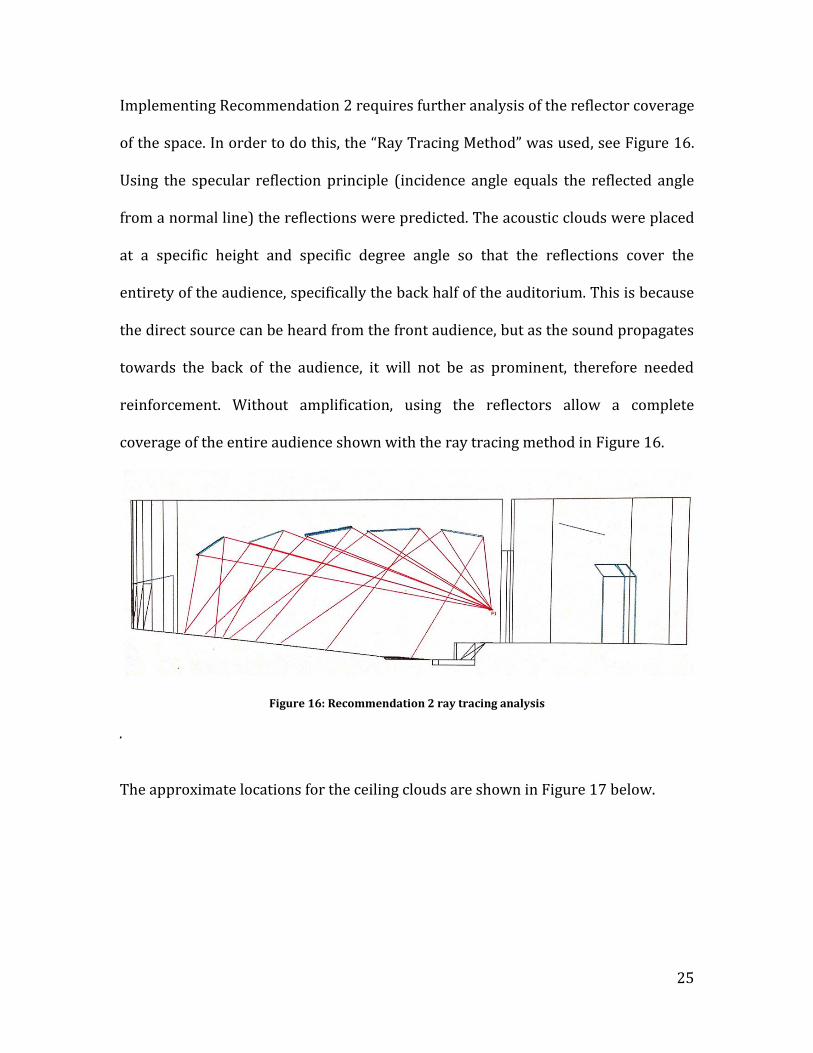
Implementing Recommendation 2 requires further analysis of the reflector coverage
of the space. In order to do this, the “Ray Tracing Method” was used, see Figure 16.
Using the specular reflection principle (incidence angle equals the reflected angle
from a normal line) the reflections were predicted. The acoustic clouds were placed
at a specific height and specific degree angle so that the reflections cover the
entirety of the audience, specifically the back half of the auditorium. This is because
the direct source can be heard from the front audience, but as the sound propagates
towards the back of the audience, it will not be as prominent, therefore needed
reinforcement. Without amplification, using the reflectors allow a complete
coverage of the entire audience shown with the ray tracing method in Figure 16.
Figure 16: Recommendation 2 ray tracing analysis
. The approximate locations for the ceiling clouds are shown in Figure 17 below.
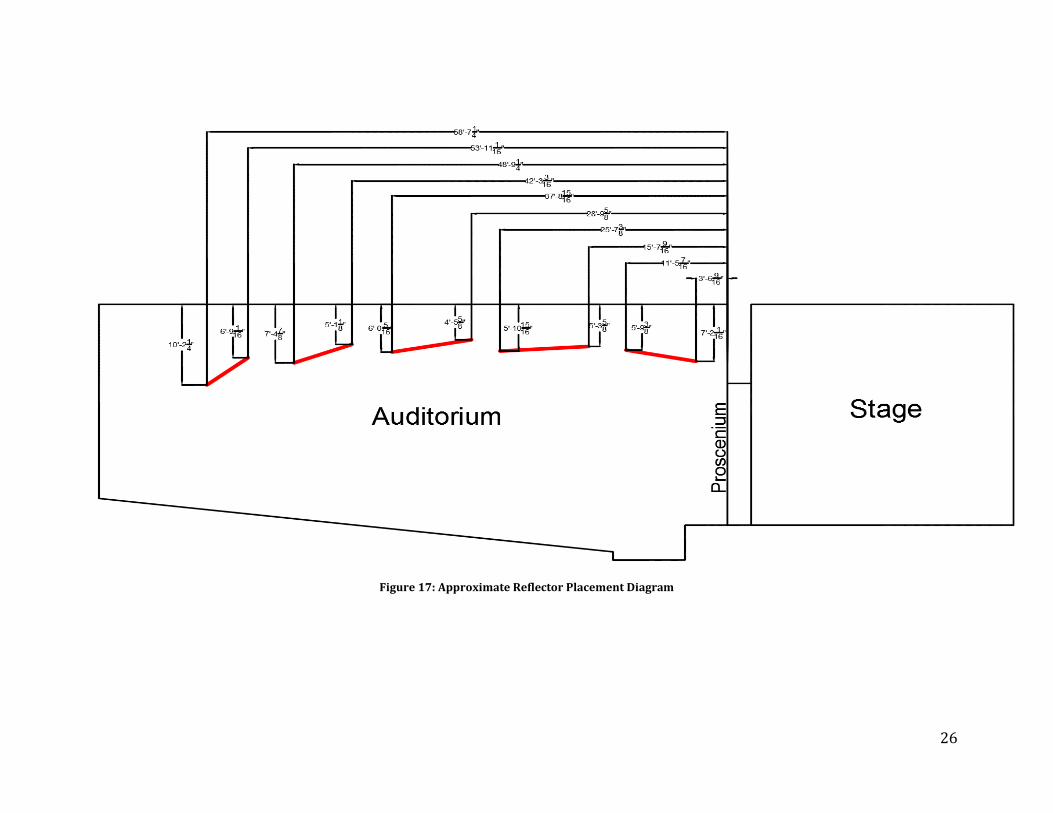
26
Figure 17: Approximate Reflector Placement Diagram
27
Sketchup Make Model
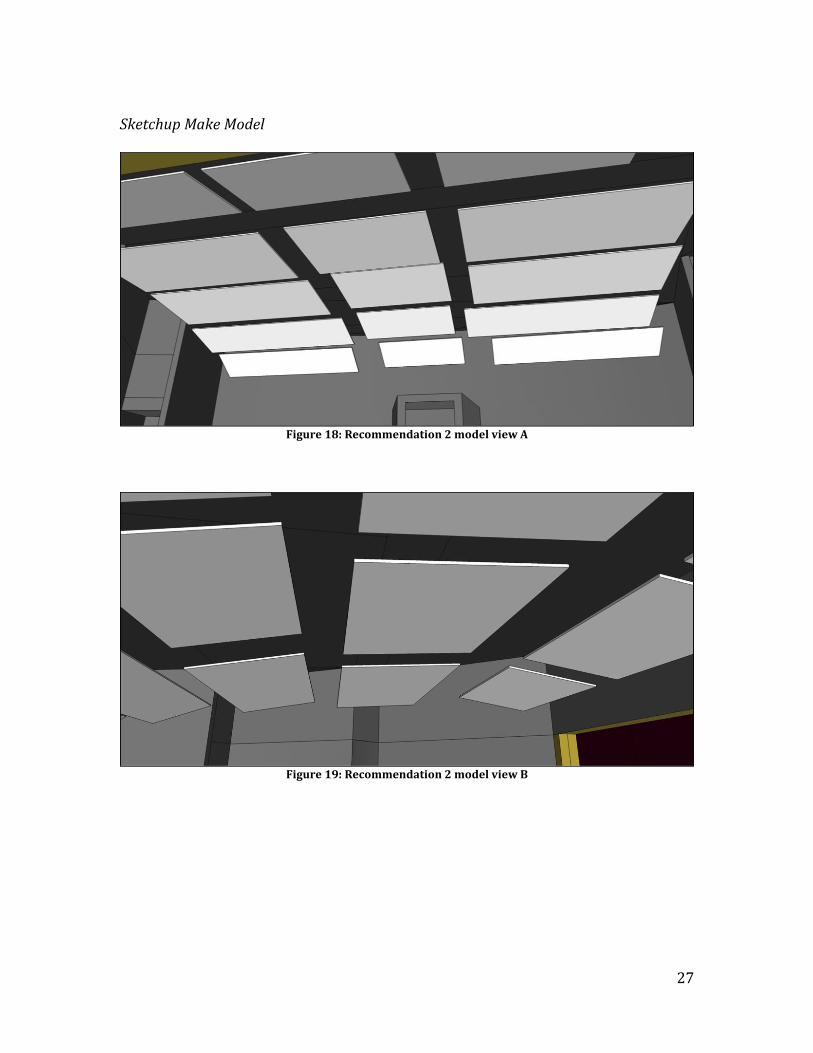
Figure 18: Recommendation 2 model view A
Figure 19: Recommendation 2 model view B
28
ODEON SPL Analysis - Recommendation Two
48 dB
25 dB
Talker at 65 dB (re: 20 μPa) Ensemble at 65 dB (re: 20 μPa)
Figure 20: Recommendation 2 SPL for a talker Figure 21: Recommendation 2 SPL for an ensemble
29
Reverberation Time Simulation
Figure 22: Recommendation 2 reverberation simulation
0
0.2
0.4
0.6
0.8
1
1.2
1.4
1.6
125 250 500 1000 2000 4000 8000
Re
ve
rbe
rati
on
Tim
e (
T6
0)
Octave Band Center Frequency (Hz)
Recommendation Two
Recommendation Two
Current
Goal
30
Recommendation 3
Streamline Side Walls, Add Doors to Eliminate Side Wall Vestibules. This final
step includes the elements of Recommendation 1 and Recommendation 2, plus the
elimination of pocket cavities that exist in the side wall doorway vestibules through
the use of reconfigured sidewall profiles and new access doors into the auditorium.
The current side exit doorway pockets prevent lateral sound reflections from
reaching the audience. Because of this, the third recommendation is an architectural
modification to streamline the walls such that the doorway gaps are removed. This
step allowed the sound to be reflected from the auditoriums’ sidewalls, as well as
the overhead acoustic ceiling clouds. New side doors (not shown) would be
incorporated flush into the new streamlined sidewalls to provide egress/access.
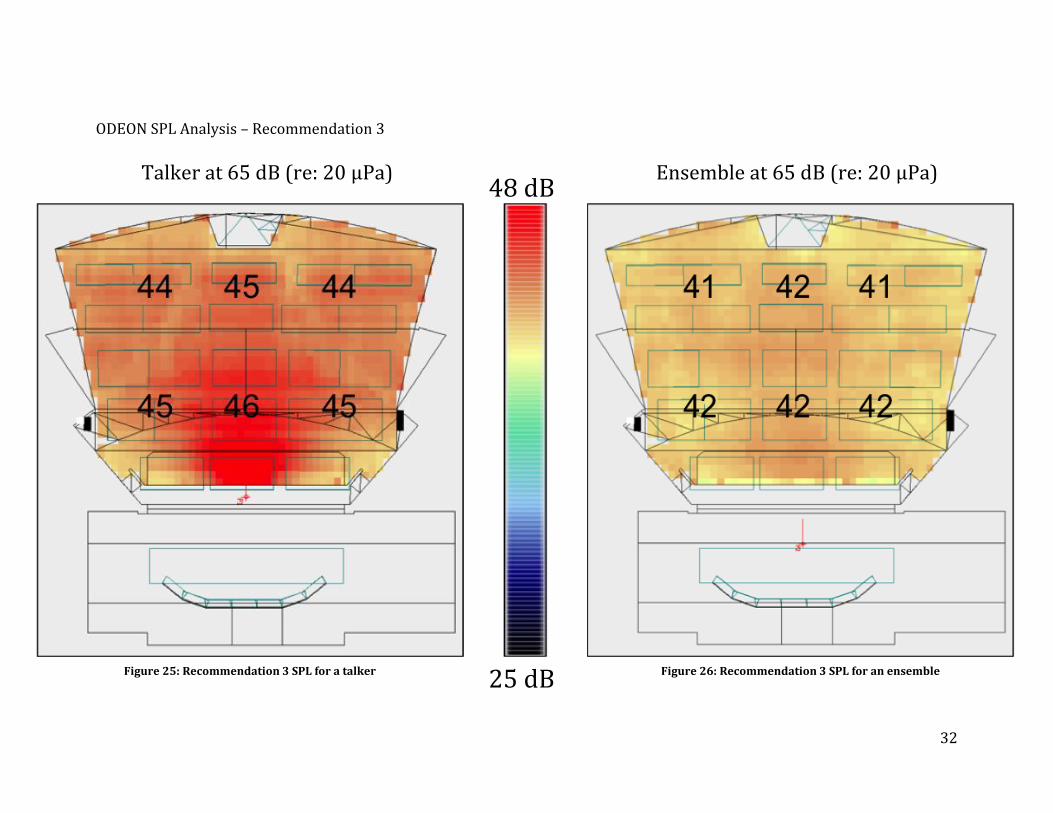
After modifying the SketchUp model, and simulating the SPL for each source
in ODEON, the sound pressure level varied only by 2 dB for a talker and 1 dB for an
ensemble. See Figure 25 and 26 below. In addition to the improved evenness of the
SPL, the overall SPL in the room increased by 1 dB in the front row for a talker and 4
dB in the front row for an ensemble.
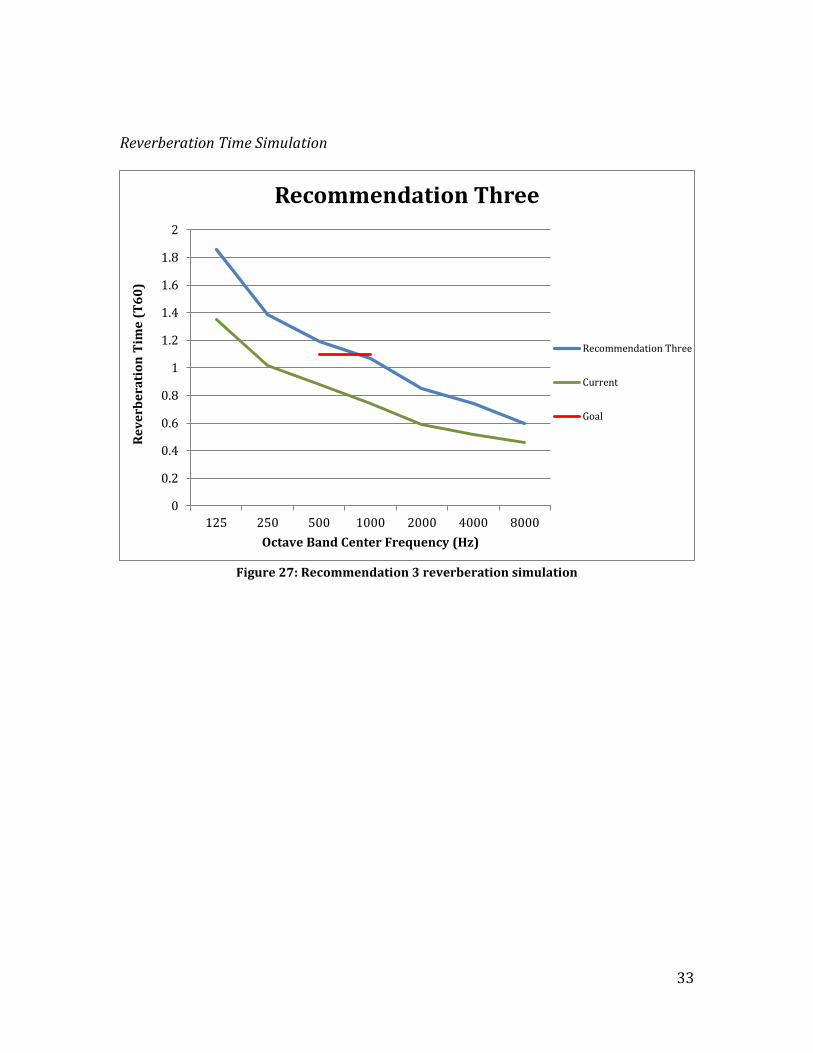
A subsequent reverberation simulation for Recommendation 3 predicted an
appropriate T60 with a mid-band average of 1.1 seconds, matching the goal value.
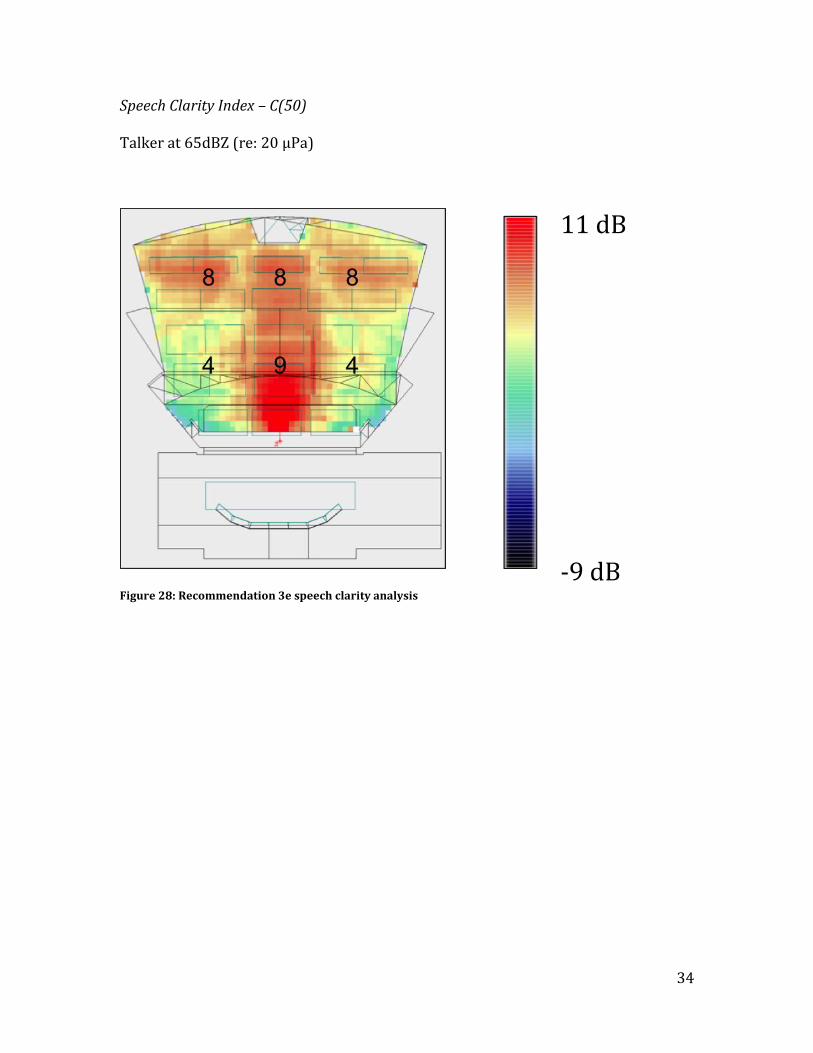
With increased reverberation, the speech intelligibility of can room
potentially decrease. However, by running a clarity index simulation for the talker,
the model actually predicted improved, satisfactory values due to improved sound
dispersion and only a modest increase in T60. See Figure 28.
31
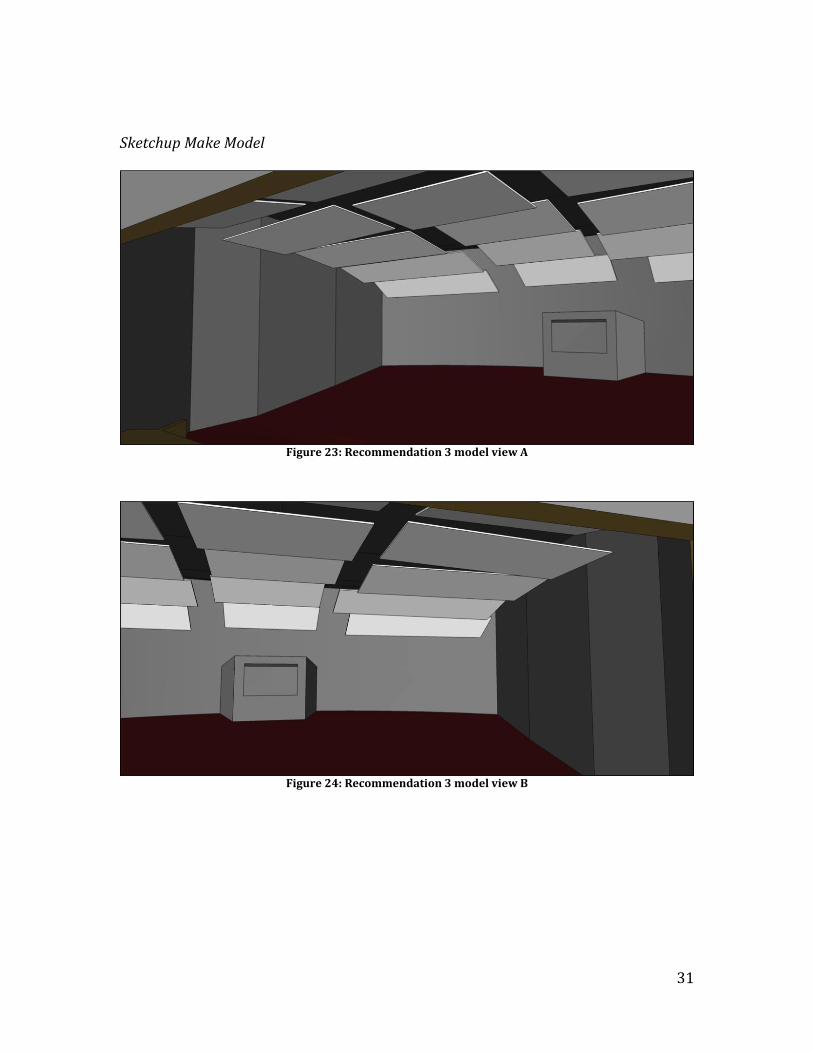
Sketchup Make Model
Figure 23: Recommendation 3 model view A
Figure 24: Recommendation 3 model view B
32
ODEON SPL Analysis – Recommendation 3
48 dB
25 dB
Talker at 65 dB (re: 20 μPa) Ensemble at 65 dB (re: 20 μPa)
Figure 25: Recommendation 3 SPL for a talker Figure 26: Recommendation 3 SPL for an ensemble
33
Reverberation Time Simulation
Figure 27: Recommendation 3 reverberation simulation
0
0.2
0.4
0.6
0.8
1
1.2
1.4
1.6
1.8
2
125 250 500 1000 2000 4000 8000
Re
ve
rbe
rati
on
Tim
e (
T6
0)
Octave Band Center Frequency (Hz)
Recommendation Three
Recommendation Three
Current
Goal
34
Speech Clarity Index – C(50)
Talker at 65dBZ (re: 20 μPa)
Figure 28: Recommendation 3e speech clarity analysis
11 dB
-9 dB
35
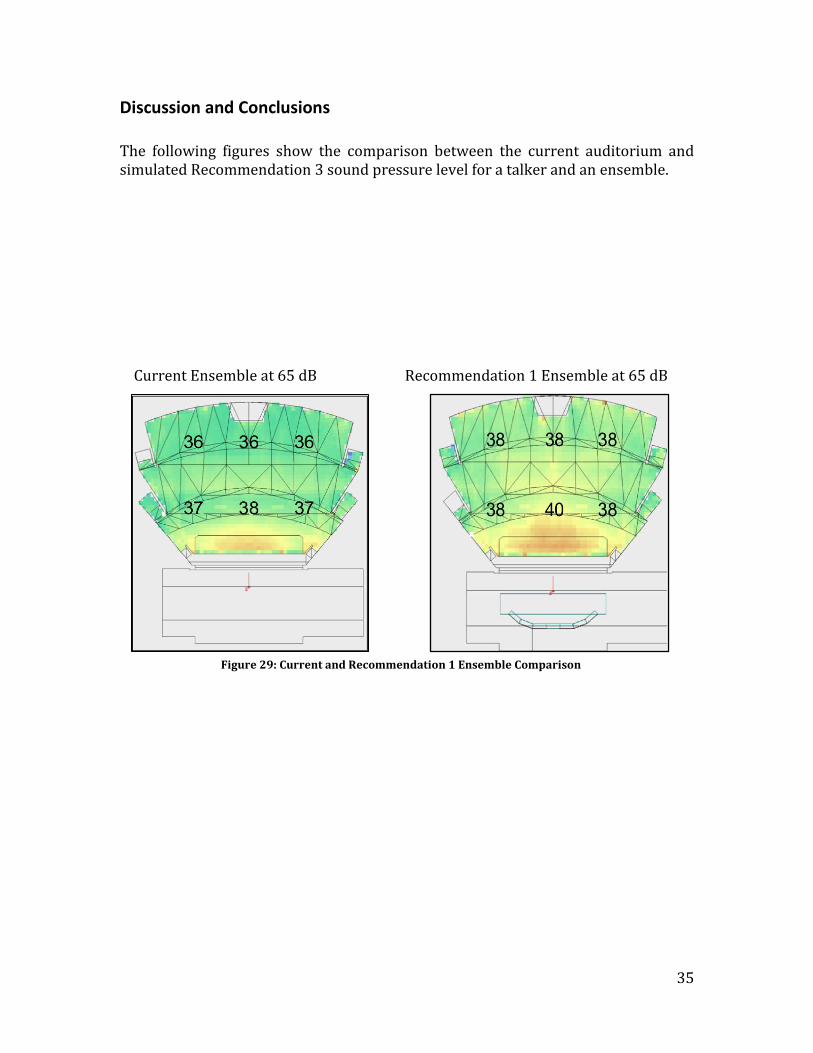
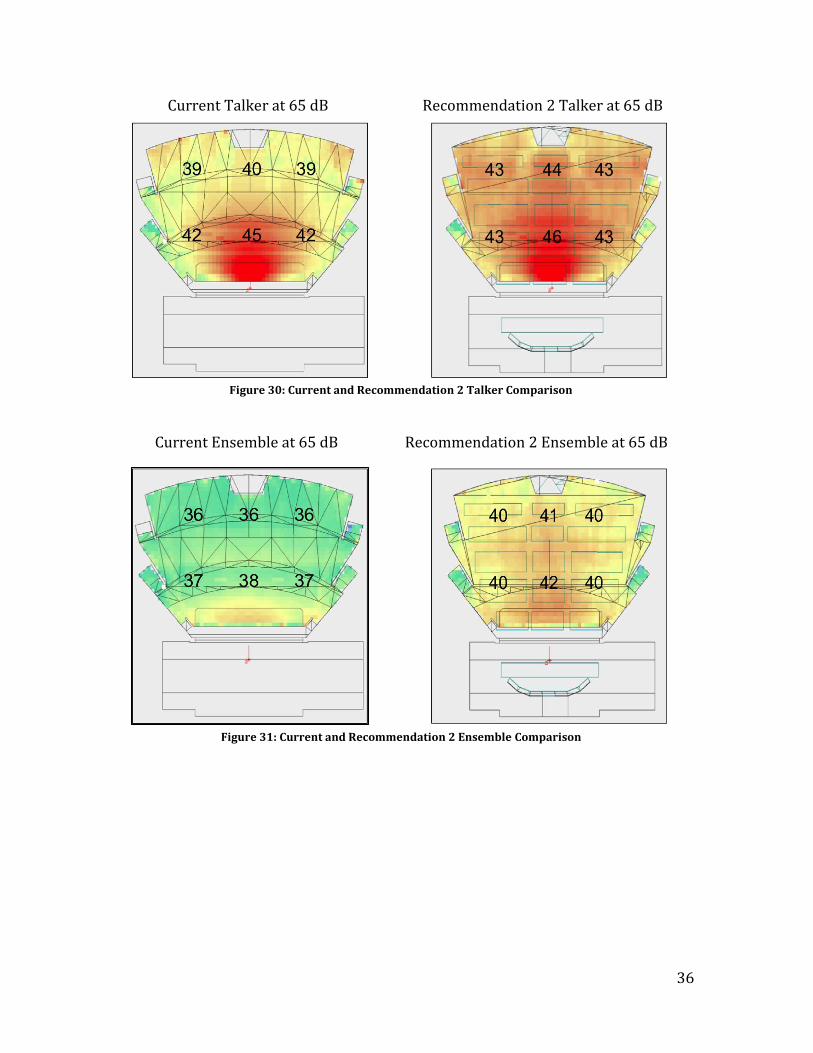
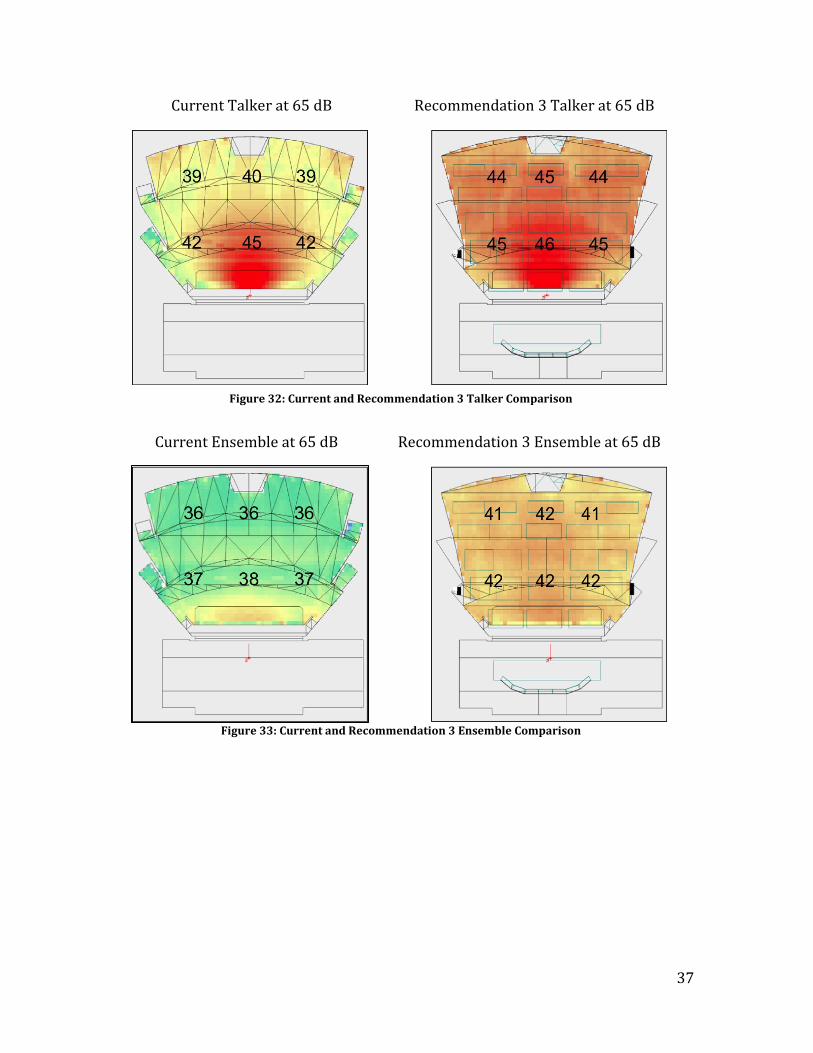
Discussion and Conclusions
The following figures show the comparison between the current auditorium and simulated Recommendation 3 sound pressure level for a talker and an ensemble. Current Ensemble at 65 dB Recommendation 1 Ensemble at 65 dB
Figure 29: Current and Recommendation 1 Ensemble Comparison
36
Current Talker at 65 dB Recommendation 2 Talker at 65 dB
Current Ensemble at 65 dB Recommendation 2 Ensemble at 65 dB
Figure 30: Current and Recommendation 2 Talker Comparison
Figure 31: Current and Recommendation 2 Ensemble Comparison
37
Current Talker at 65 dB Recommendation 3 Talker at 65 dB
Current Ensemble at 65 dB Recommendation 3 Ensemble at 65 dB
Figure 32: Current and Recommendation 3 Talker Comparison
Figure 33: Current and Recommendation 3 Ensemble Comparison
38
Economic Factors
These three Recommendations are designed to be progressive, building off
one another, and can thus be implemented in stages over time. As a three-step
implementation, there is flexibility in time and budget for Farmington High School.
Recommendation 1 is the most affordable option and is the most flexible in use. The
band shell can be setup and stored easily, and can be moved if necessary.
Recommendation 2, however, is a more permanent option. The implementation of
acoustic ceiling clouds will require a major renovation to the Auditorium. It is
possible that this renovation might necessitate other changes to meet certain codes
or regulations. In addition, such a renovation should involve a complete overhaul of
the HVAC system so that can meet a Noise Criteria requirement of no higher than NC
20. This is why the third recommendation should be implemented if possible. With
an entire room renovation, the auditorium can utilize a band shell, acoustical ceiling
clouds, streamlined walls and a quieter ventilation system for optimized sound
quality and clarity. For both Recommendations 2 and 3, these changes should be
incorporated into a larger effort coordinated by a licensed architect.
Note: These recommendations are acoustical in nature. The arrangement and loads of any acoustic treatments, including the support structure for the acoustic clouds should be reviewed by a structural engineer before installation.
39
References
[1] Egan, M. David. Architectural Acoustics. Ft. Lauderdale, FL: J. Ross Pub., 2007. Print.
[2] Long, Marshall. Architectural Acoustics. 2nd ed. N.p.: Academic Press, 2014. Print.
[3] Ermann, Michael. Architectural Acoustics Illustrated. Hoboken: John Wiley & Sons,
2015. Print.

40
Appendices
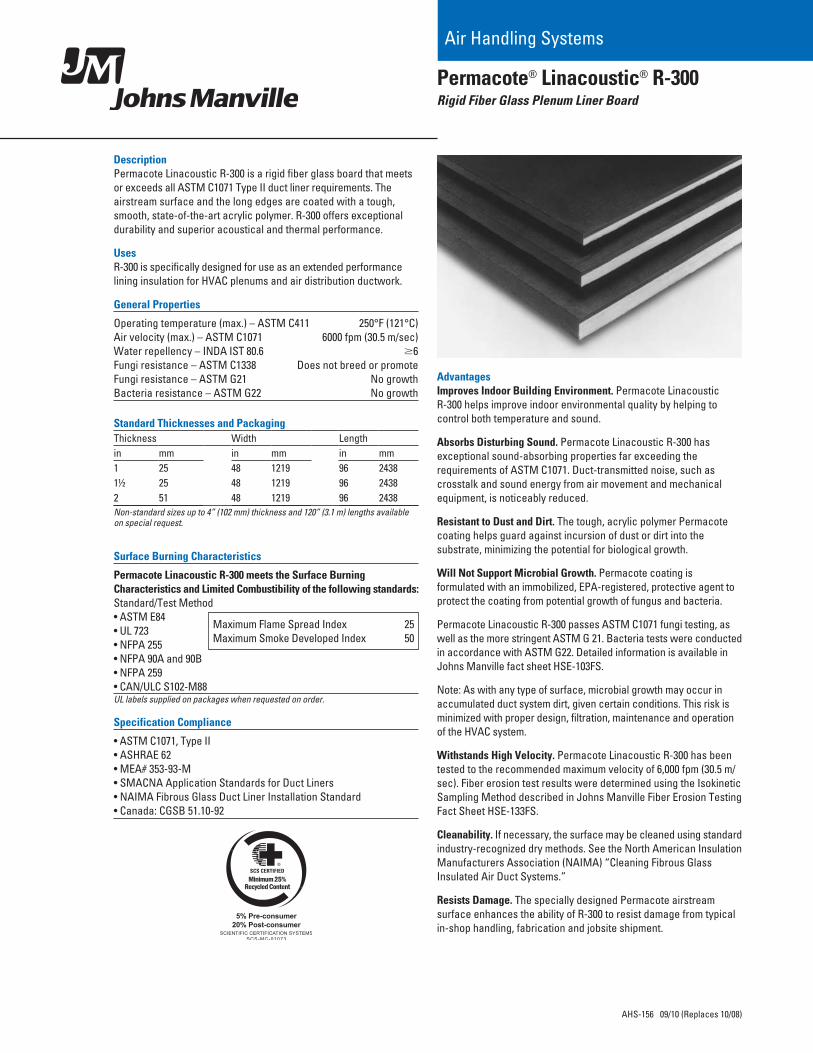
Permacote® Linacoustic® R-300Rigid Fiber Glass Plenum Liner Board
AHS-156 09/10 (Replaces 10/08)
Advantages Improves Indoor Building Environment. Permacote Linacoustic R-300 helps improve indoor environmental quality by helping to control both temperature and sound.
Absorbs Disturbing Sound. Permacote Linacoustic R-300 has exceptional sound-absorbing properties far exceeding the requirements of ASTM C1071. Duct-transmitted noise, such as crosstalk and sound energy from air movement and mechanical equipment, is noticeably reduced.
Resistant to Dust and Dirt. The tough, acrylic polymer Permacote coating helps guard against incursion of dust or dirt into the substrate, minimizing the potential for biological growth.
Will Not Support Microbial Growth. Permacote coating is formulated with an immobilized, EPA-registered, protective agent to protect the coating from potential growth of fungus and bacteria.
Permacote Linacoustic R-300 passes ASTM C1071 fungi testing, as well as the more stringent ASTM G 21. Bacteria tests were conducted in accordance with ASTM G22. Detailed information is available in Johns Manville fact sheet HSE-103FS.
Note: As with any type of surface, microbial growth may occur in accumulated duct system dirt, given certain conditions. This risk is minimized with proper design, filtration, maintenance and operation of the HVAC system.
Withstands High Velocity. Permacote Linacoustic R-300 has been tested to the recommended maximum velocity of 6,000 fpm (30.5 m/sec). Fiber erosion test results were determined using the Isokinetic Sampling Method described in Johns Manville Fiber Erosion Testing Fact Sheet HSE-133FS.
Cleanability. If necessary, the surface may be cleaned using standard industry-recognized dry methods. See the North American Insulation Manufacturers Association (NAIMA) “Cleaning Fibrous Glass Insulated Air Duct Systems.”
Resists Damage. The specially designed Permacote airstream surface enhances the ability of R-300 to resist damage from typical in-shop handling, fabrication and jobsite shipment.
Air Handling Systems
Description Permacote Linacoustic R-300 is a rigid fiber glass board that meets or exceeds all ASTM C1071 Type II duct liner requirements. The airstream surface and the long edges are coated with a tough, smooth, state-of-the-art acrylic polymer. R-300 offers exceptional durability and superior acoustical and thermal performance.
Uses R-300 is specifically designed for use as an extended performance lining insulation for HVAC plenums and air distribution ductwork.
General Properties
Operating temperature (max.) – ASTM C411 250°F (121°C) Air velocity (max.) – ASTM C1071 6000 fpm (30.5 m/sec) Water repellency – INDA IST 80.6 $6 Fungi resistance – ASTM C1338 Does not breed or promote Fungi resistance – ASTM G21 No growth Bacteria resistance – ASTM G22 No growth
Surface Burning Characteristics
Permacote Linacoustic R-300 meets the Surface Burning Characteristics and Limited Combustibility of the following standards: Standard/Test Method • ASTM E84 • UL 723 • NFPA 255 • NFPA 90A and 90B • NFPA 259 • CAN/ULC S102-M88UL labels supplied on packages when requested on order.
Specification Compliance
• ASTM C1071, Type II • ASHRAE 62 • MEA# 353-93-M• SMACNA Application Standards for Duct Liners • NAIMA Fibrous Glass Duct Liner Installation Standard• Canada: CGSB 51.10-92
Maximum Flame Spread Index 25Maximum Smoke Developed Index 50
Standard Thicknesses and PackagingThickness Width Lengthin mm in mm in mm1 25 48 1219 96 24381½ 25 48 1219 96 24382 51 48 1219 96 2438Non-standard sizes up to 4” (102 mm) thickness and 120” (3.1 m) lengths available on special request.
Permacote® Linacoustic® R-300Rigid Fiber Glass Plenum Liner Board
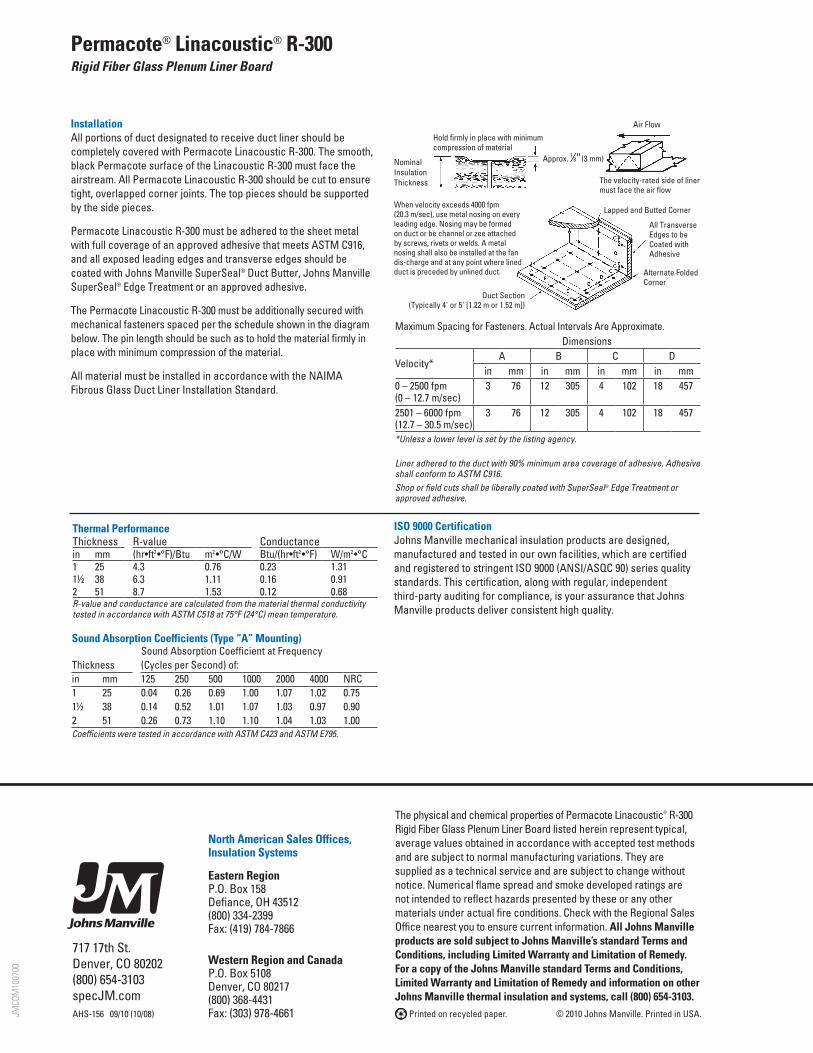
Installation All portions of duct designated to receive duct liner should be completely covered with Permacote Linacoustic R-300. The smooth, black Permacote surface of the Linacoustic R-300 must face the airstream. All Permacote Linacoustic R-300 should be cut to ensure tight, overlapped corner joints. The top pieces should be supported by the side pieces.
Permacote Linacoustic R-300 must be adhered to the sheet metal with full coverage of an approved adhesive that meets ASTM C916, and all exposed leading edges and transverse edges should be coated with Johns Manville SuperSeal® Duct Butter, Johns Manville SuperSeal® Edge Treatment or an approved adhesive.
The Permacote Linacoustic R-300 must be additionally secured with mechanical fasteners spaced per the schedule shown in the diagram below. The pin length should be such as to hold the material firmly in place with minimum compression of the material.
All material must be installed in accordance with the NAIMA Fibrous Glass Duct Liner Installation Standard.
Lapped and Butted Corner
All Transverse Edges to be Coated with Adhesive
Alternate Folded Corner
Duct Section (Typically 4' or 5' [1.22 m or 1.52 m])
When velocity exceeds 4000 fpm (20.3 m/sec), use metal nosing on every leading edge. Nosing may be formed on duct or be channel or zee attached by screws, rivets or welds. A metal nosing shall also be installed at the fan dis-charge and at any point where lined duct is preceded by unlined duct.
Hold firmly in place with minimum compression of material
Nominal Insulation Thickness The velocity-rated side of liner
must face the air flow
Air Flow
Approx. 1⁄8" (3 mm)
ISO 9000 Certification Johns Manville mechanical insulation products are designed, manufactured and tested in our own facilities, which are certified and registered to stringent ISO 9000 (ANSI/ASQC 90) series quality standards. This certification, along with regular, independent third-party auditing for compliance, is your assurance that Johns Manville products deliver consistent high quality.
Thermal PerformanceThickness R-value Conductancein mm (hr•ft2•°F)/Btu m2•°C/W Btu/(hr•ft2•°F) W/m2•°C1 25 4.3 0.76 0.23 1.311½ 38 6.3 1.11 0.16 0.912 51 8.7 1.53 0.12 0.68R-value and conductance are calculated from the material thermal conductivity tested in accordance with ASTM C518 at 75°F (24°C) mean temperature.
Sound Absorption Coefficients (Type “A” Mounting)Sound Absorption Coefficient at Frequency
Thickness (Cycles per Second) of:in mm 125 250 500 1000 2000 4000 NRC1 25 0.04 0.26 0.69 1.00 1.07 1.02 0.751½ 38 0.14 0.52 1.01 1.07 1.03 0.97 0.902 51 0.26 0.73 1.10 1.10 1.04 1.03 1.00Coefficients were tested in accordance with ASTM C423 and ASTM E795.
717 17th St. Denver, CO 80202 (800) 654-3103 specJM.com
© 2010 Johns Manville. Printed in USA. Printed on recycled paper.
The physical and chemical properties of Permacote Linacoustic® R-300 Rigid Fiber Glass Plenum Liner Board listed herein represent typical, average values obtained in accordance with accepted test methods and are subject to normal manufacturing variations. They are supplied as a technical service and are subject to change without notice. Numerical flame spread and smoke developed ratings are not intended to reflect hazards presented by these or any other materials under actual fire conditions. Check with the Regional Sales Office nearest you to ensure current information. All Johns Manville products are sold subject to Johns Manville’s standard Terms and Conditions, including Limited Warranty and Limitation of Remedy. For a copy of the Johns Manville standard Terms and Conditions, Limited Warranty and Limitation of Remedy and information on other Johns Manville thermal insulation and systems, call (800) 654-3103.
JMCO
M100700
North American Sales Offices, Insulation Systems
Eastern RegionP.O. Box 158 Defiance, OH 43512 (800) 334-2399 Fax: (419) 784-7866
Western Region and CanadaP.O. Box 5108 Denver, CO 80217 (800) 368-4431 Fax: (303) 978-4661AHS-156 09/10 (10/08)
Maximum Spacing for Fasteners. Actual Intervals Are Approximate.Dimensions
Velocity*A B C D
in mm in mm in mm in mm0 – 2500 fpm (0 – 12.7 m/sec)
3 76 12 305 4 102 18 457
2501 – 6000 fpm (12.7 – 30.5 m/sec)
3 76 12 305 4 102 18 457
*Unless a lower level is set by the listing agency. Liner adhered to the duct with 90% minimum area coverage of adhesive. Adhesive shall conform to ASTM C916.Shop or field cuts shall be liberally coated with SuperSeal® Edge Treatment or approved adhesive.
Over 50 years of success solving acoustics and noise control problems!
6300 Irelan PlaceDublin, OH 430171.800.959.1229 Toll-Freewww.kineticsnoise.com
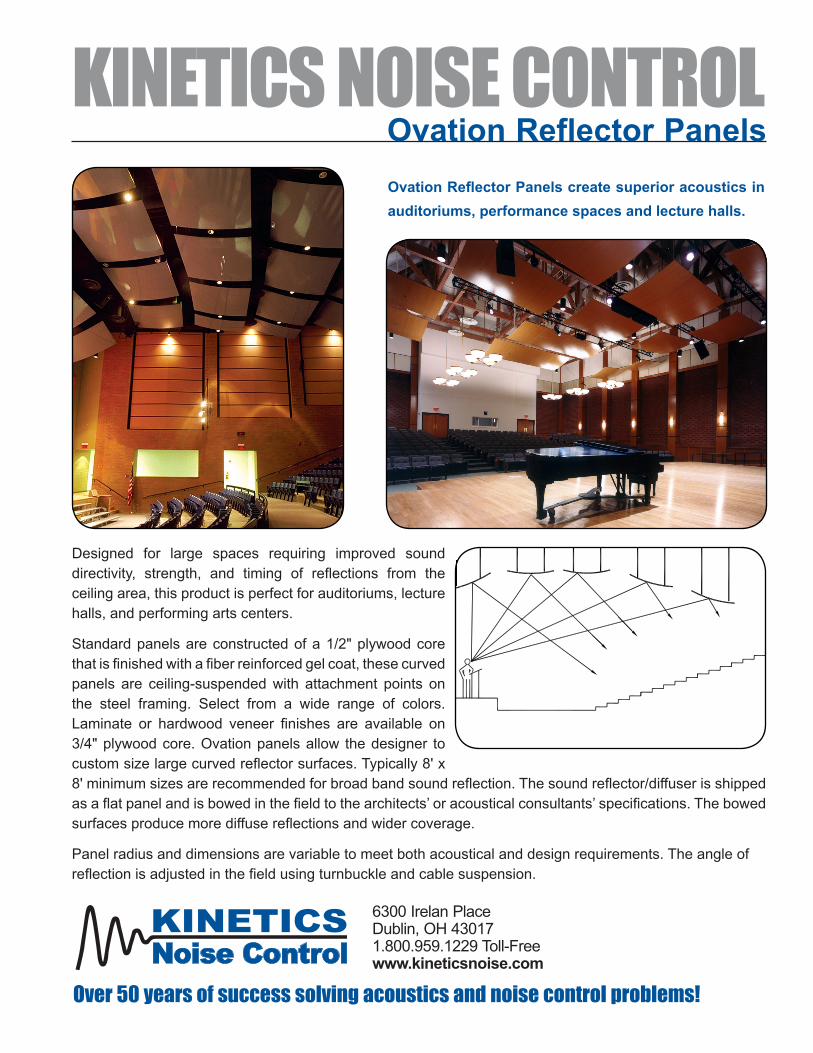
Designed for large spaces requiring improved sound directivity, strength, and timing of reflections from the ceiling area, this product is perfect for auditoriums, lecture halls, and performing arts centers.
Standard panels are constructed of a 1/2" plywood core that is finished with a fiber reinforced gel coat, these curved panels are ceiling-suspended with attachment points on the steel framing. Select from a wide range of colors. Laminate or hardwood veneer finishes are available on 3/4" plywood core. Ovation panels allow the designer to custom size large curved reflector surfaces. Typically 8' x 8' minimum sizes are recommended for broad band sound reflection. The sound reflector/diffuser is shipped as a flat panel and is bowed in the field to the architects’ or acoustical consultants’ specifications. The bowed surfaces produce more diffuse reflections and wider coverage.
Panel radius and dimensions are variable to meet both acoustical and design requirements. The angle ofreflection is adjusted in the field using turnbuckle and cable suspension.
Ovation Reflector PanelsKINETICS NOISE CONTROL
Ovation Reflector Panels create superior acoustics in auditoriums, performance spaces and lecture halls.
TE
CH
NI
CA
L
IN
FO
RM
AT
IO
N
Please contact your factory representative for design layout, specifications and pricing. Ovation 8/14
Ovation Reflector Panels
DescriptionOverhead acoustical reflector/diffuser.
Composition• 1/2" plywood core with standard (stock) gel
coat colors or optional custom colors• Specify glossy (standard) or
matte (optional) finish• Also available with optional laminate facing or
hardwood veneer on a 3/4" core board• Painted steel reinforcing angles• Standard sizes up to 20' length with width
varying between 9'-4" and 10' depending on desired finish
• Approximate weight varies based on panel size and type. Minimum 2-1/2 psf
• Optional: Absorber or mass layer on back side
Acoustical PerformanceSound Absorption per ASTM C-423.
Fire Test Data• Standard: Gel Coat Finish, Class C rated
per ASTM E84• Special Option: Class A rated 4' x 10' maximum
panel size with fire rated core and laminate face
Applications• Large spaces that require improved direction
strength and timing of sound reflections to greatly enhance listening quality.
• Auditoriums• Lecture Halls• Performing Arts Centers• Worship Spaces• Music Rehearsal Spaces
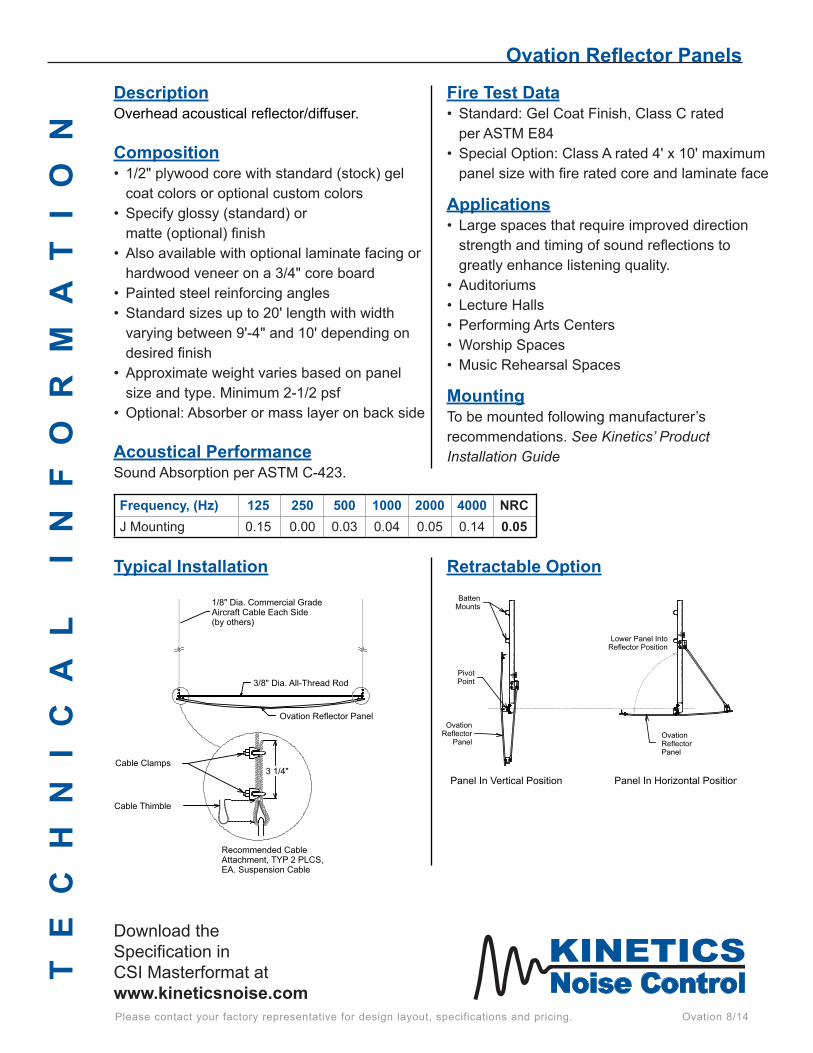
MountingTo be mounted following manufacturer’srecommendations. See Kinetics’ ProductInstallation Guide
Frequency, (Hz)J Mounting
1250.15
2500.00
5000.03
10000.04
20000.05
40000.14
NRC0.05
Download theSpecification inCSI Masterformat atwww.kineticsnoise.com
Typical Installation Retractable Option
Recommended