© 2014 CHS Inc.
ACE Ethanol Annual Conference
Ethanol & DDG Exports
Max Thomasson & Sean Broderick
CHS
August 2018

Farmer-owned
with global
connections.
2017

WHO IS CHS?
• USA’s leading
cooperative, owned by
farmers, ranchers and
co-ops
• Global energy, grains
and foods business
• Helping producers,
co-ops and customers
grow their businesses

SERVING U.S. AND THE WORLD
• Supplying grain and other products to customersin 70 countries
• Employing more than 12,500 people in the U.S. and 24 other countries
• Serving U.S. farmers, ranchers and rural America for more than 85 years
• Committed to global grain and agronomy

CHS GLOBAL OPERATIONS

CHS RENEWABLE FUELS GLOBAL FOOTPRINT
Duluth/Superior
Hong Kong
Argentina
Brazil
Kiev
Australia
Myrtle Grove
Barcelona
AmmanRomania, Hungary,Bulgaria,Serbia
Taiwan
Seoul
Winnipeg
Tokyo
Sao Paulo
Minneapolis
Shanghai
Geneva
Amsterdam
Subic BayRibeirao
Preto
Singapore
Pipavav
Nhava Sheva
Mumbai

TALKING POINTS
• CURRENT GLOBAL MARKETS
• US EXPORT DESTINATIONS
• OPPORTUNITIES
• THREATS
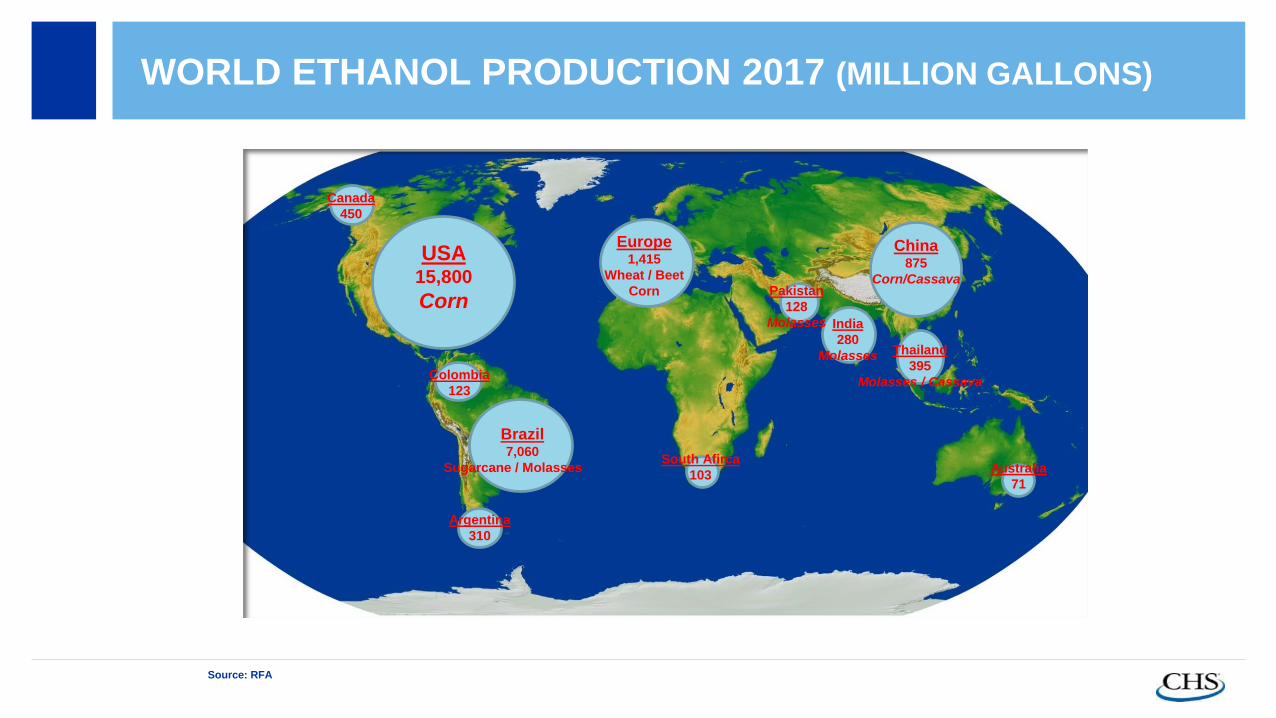
WORLD ETHANOL PRODUCTION 2017 (MILLION GALLONS)
Duluth/Superior
Hong Kong
Argentina
Brazil
Kiev
Australia
Myrtle Grove
Barcelona
AmmanRomania, Hungary,Bulgaria,Serbia
Taiwan
Seoul
Winnipeg
Tokyo
USA15,800
Corn
Brazil7,060
Sugarcane / Molasses
Colombia
123
Europe1,415
Wheat / Beet
Corn Pakistan
128
Molasses
South Afirca
103
India
280
Molasses
China875
Corn/Cassava
Thailand
395
Molasses / Cassava
Australia
71
Canada
450
Source: RFA
Argentina
310

GLOBAL SUPPLY / DEMAND BALANCE
2018
10Source: GreenPool
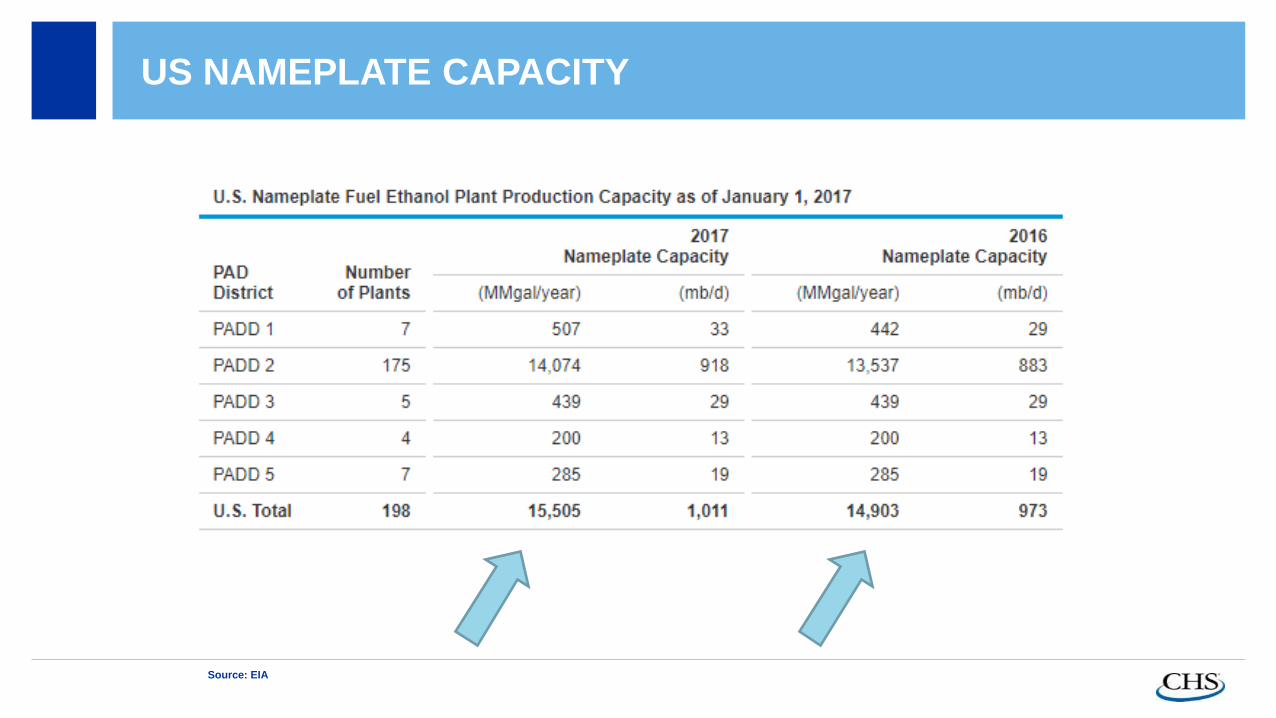
US NAMEPLATE CAPACITY
Source: EIA

US DOE FUEL ETHANOL TOTAL PRODUCTION (MILLION GALLONS/DAY)
Source: Bloomberg

US ETHANOL PRODUCTION EST. 2018
13
PRODUCTION (000 GAL/YR)
TOTAL NAMEPLATE CAPACITY 15,505
PRODUCTION ABOVE NAMEPLATE 310
CAPACITY ADDITION/EXPANSION 2018 287
ESTIMATED TOTAL PRODUCTION FOR 2018 16,102

DOE TOTAL FUEL ETHANOL INVENTORY (MILLION GALLONS)
Source: Bloomberg

US ETHANOL BALANCE SHEET-ANNUALMILLION GALLONS
Need additional
export demandPredicting record
exports for 2018,
but a more
modest increase
expected after
trade issues with
China

TALKING POINTS
• US EXPORT DESTINATIONS

ANNUAL U.S. EXPORTS
2018 estimated

TOP MARKETS FOR US EXPORTS IN 2017
Duluth/Superior
Hong Kong
Argentina
Brazil
Kiev
Australia
Myrtle Grove
Barcelona
AmmanRomania, Hungary,Bulgaria,Serbia
Taiwan
Seoul
Winnipeg
Tokyo
Brazil34%
Mexico
2%
Rest of
the World
5%UAE
3%
Nigeria
2%
India
13%
Singapore
2%
Korea
3%
Canada
24%
Source: RFA
Colombia
1%
Philippines
5%
Peru
3%
Europe
2%
2%Jamaica
1%
China

U.S. EXPORTS 2018 YTD (MILLION GALLONS)
Source: EIA

U.S. EXPORTS COMPARISON (MILLION GALLONS)
Source: Census

GLOBAL ETHANOL FLOW 2017
Source CHS
Philippines122 MYG
Fuel Grade
Vietnam
10 MYG
Fuel Grade
Singapore
10 MYG
Hydrous
China 13 MYG
Fuel Grade
India 158
MYG Fuel
Grade
Taiwan
3 MYG
Hydrous
Japan & Korea185 MYG Grade B
(+80 MYG Fuel Grade
2018)
Brazil267 MYG
Fuel Grade
Europe 80 MYG
Hydrous Grade
Canada 264
MYG Fuel Grade
Africa117 MYG
USA250 MYG Fuel Grade
Guatemala,
Peru, Bolivia
Pakistan

TALKING POINTS
• OPPORTUNITIES

BLENDING OCTANE RATING OF GASOLINE COMPONENTS
23

BLENDING COMPONENT PRICE COMPARISON
24

IN 2020, CHINA E10 POLICY WILL BE APPLIED NATION
WIDE
2016 China mandatory region for biofuel
Provinces having ethanol consumption mandatory
Provinces with some cities having ethanol mandatory
No ethanol mandatory
2020 China mandatory region for biofuel
Provinces having ethanol consumption mandatory
Source: CHS analysis

CHINA GASOLINE AND ETHANOL CONSUMPTION BY 2020
55,191 61,455 61,727
68,862 73,960
81,409
93,664 97,764
113,685
2007 2008 2009 2010 2011 2012 2013 2014 2015
Gasoline consumption
1,660 1,710 1,720 1,820 1,770 1,620 1,700 1,900 2,300
Ethanol consumption
3% 3% 3% 3% 2% 2% 2% 2% 2%
x% Ethanol percentage of gasoline
China consumption of gasoline vs. ethanol (000 MT)
• In the past 8 years, China ethanol consumption is less than 3% of its gasoline
consumption;
• If E10 policy is enforced and fuel consumption growth rate at 8%, to reach this target in
year 2020, there will be a 16.7 million tons demand of ethanol product.
10% (E10 requirement)
16,700
2020 (Estimated)
167,000
Fuel consumption Growth CAGR: 9%
Source: China Statistic Bureau report 2015, China Renewable Energy Center

CHINA - “E10 POLICY”
China Ethanol policy: Enforcing 10% ethanol added into gasoline
nationwide in 2020
Implementation of E10 will accelerate
ethanol expansion in China in the
coming 3~5 years
• In 2020, gasoline should contain 10% of
ethanol nationwide – today demand of
gasoline containing bio-fuel in the
mandatory region only accounts for 1/5
of the country.
• If the policy is fully implemented before
2020, ethanol demand will be 16.7
million MT, a 13.5 million MT increase
compared with 2016;
Growth CAGR: 4%
1,660 2,300
16,700
2007 2010 2015 2020
China Ethanol consumption ('000 MT)
Growth CAGR:
185%
Source: China Renewable Energy Center

GAP IN ETHANOL DOMESTIC SUPPLY: CHINA CURRENT CAPACITY IS ONLY 2.8
MILLION TONS, 3 MILLION TONS TO BE ADDED
Source: China JCI report, China Renewable Energy Center report, COFCO report
China major ethanol producers
Heilongjiang (1.62 million
MT)
COFCO: 500 K
Guotou/xiangyu: +600 K
Shenglong: 70 K (+150 K)
Hongzhan: +300 K
Jilin (0.6 million MT)
Jilin Ethanol: 600 K
Shandong (0.2 million
MT)
Longli: 50 K
FuEn: +150 K
Henan (0.6 million
MT)
Tianguan: 600 K
Guangxi (0.2 million
MT)
COFCO: 200 K
Guangdong (0.15
million MT)
Guotou: 150 K
Inner Mongo (0.33 million MT)
Zhongxing: 30 K
Liniu: 150 K + 150 K
Alcohol
typeEthanol
95%
alcohol
Absolute
alcohol
Capacity 2,800 12,150 2,000
Output 2,500 5,600 1,000
Year 2014 Year 2017Being
constructedPlanned
2,330 2,800 1,850 1,200
China Ethanol capacity built and
planned (‘000 MT)
China alcohol and ethanol capacity
(already built) and output (estimated)
in 2017 (‘000 MT)
Hainan (0.1 million
MT)
Yedao: +100 K
Liaoning (0.6
million MT)
Guotou: +600 K
Jiangsu (500 K MT)
Hongzhan: +100 K
Lianhai: +300 K
Kailin: +100 K
Jiangxi (0.1 million
MT)
Yufan: +100 K
Anhui (0.45 million
MT)
COFCO: 450 K
Hubei (0.1 million
MT)
Honghu: +100 K
* Capacity for liquor (drinks) production and blending are not listed
Zhejiang (0.3 million
MT)
Zhejiang Fuel: +300 K
These are the key measures to watch

INDIA – PROJECTED ETHANOL DEMAND (MILLIONS OF
GALLONS)
29
• India Gasoline demand predicted grow 5% yoy
• Current demand 9.2 billion gallons
• Current blending is E2.5% (230 MYG) target E10
• E10 Equates to ethanol demand of 920 MYG
• Total Ethanol Production India 870 MYG
• Ethanol production available for blending 340 MYG
• 580 MYG deficit (potential for imports and growing)
(All in Gallons) 2016 2017 2018 2019 2020 2021 2022 2023 2025 2026
Gasoline Projected Demand 8,561.6 9,223.9 9,937.1 10,705.9 11,534.1 12,426.2 13,387.2 14,422.8 16,740.1 18,035.1
10% Ethanol Blend 856.2 922.4 993.7 1,070.6 1,153.4 1,242.6 1,338.7 1,442.3 1,674.0 1,803.5Ethanol Available via Molasses Route
(assumes 26 MGY supply growth) 317.0 343.4 369.8 396.3 422.7 449.1 475.5 501.9 528.3 554.8
Ethanol Deficit 539.2 579.0 623.9 674.3 730.7 793.5 863.2 940.3 1,145.7 1,248.7

FUTURE OF INDIAN ETHANOL
• National Biofuel Policy set out a E20 Target by 2017 which
works out to 1.45 Billion Gallons; Unrealistic Scenario but
underscores the Indian Government’s support of the Fuel
Program
• E10 is unlikely without changes in import policy for government
owned oil marketing companies
• Imports for Industrial use will continue, while domestic
producers support the Ethanol Blending Program but only while
margins and domestic feedstock prices support that arbitrage.

EXPORT GROWTH
31
• China - E10 by 2020 means 5.6 BYG of demand (currently produces 875 MYG),
potential is huge
• Brazil - (20% TRQ), but Ottocycle demand is back in positive territory and
domestic production continues to decline (264 MYG exports predicted 2018)
• India - (E10 – 920 MYG annual demand [580 MYG imports]) growing 5% yoy
• Japan - (start taking ETBE made from US ethanol = 92 MYG incremental demand)
• Philippines - (E20 target [E10 today] – 80 MYG incremental demand)
• Vietnam - E5 by 2018 (76 MYG), E10 by 2020 (153 MYG)
• Europe ?
• Phase out of Petrol and Diesel by 2040 – impact on ethanol consumption?
• Mexico (E10 – 1.2 billion gallons demand)
• TOTAL DEMAND GROWTH has real potential.

EXPORT OUTLOOK
32
• China – Favorable pending trade talks – in the hands of politicians now
• Brazil – favorable outlook as their balance sheet remains tight and will take
beyond quota. Stocks forecasts have increased of late.
• Philippines – business as usual
• India – Increased blending w/gas this year (6% vs 2.6%) will increase
opportunities
• Canada – Clean fuel standard should increase blending starting 2019
• SE Asia – seeing growth
• Arab Gulf- Gas/ethanol spread favorable

SUMMARY
•Brazil domestic production challenged
•Global demand continues to grow, mandate driven
•Sleeping giants China, India and Mexico
•Demand for low greenhouse gas biofuels will grow
•Cleaner air and energy independence – solid premise
•Population growth (middle class in Asia)
• Lack of investment in new production facilities

GLOBAL INVESTMENT IN BIOFUELS (BILLIONS US$)
Source: Statista

TALKING POINTS
• THREATS

THREATS
• USA surplus production
• US Administration policy direction change
• Global Mandates revoked
• Global uncertainty – financial, economic, social turmoil
• Can US market access keep pace with export demand?
• Funding incremental cost of producing export grades in a low margin
environment

U.S. MONTHLY EXPORTS
37

US DDGS

U.S. DDGS PRODUCTION VS U.S. EXPORTS
0.00%
10.00%
20.00%
30.00%
40.00%
50.00%
60.00%
70.00%
80.00%
90.00%
100.00%
0
5
10
15
20
25
30
35
40
45
2011 2012 2013 2014 2015 2016 2017 2018 (YTD)
Ex
po
rt %
Per
Millio
n M
T
U.S. Production U.S. Exports Export Ratio

US DDGS CONSUMPTION BY SPECIES
8%
15%
31%
1%
45%
Beef Cattle
Dairy
Swine
Poultry
Other

DDGS VS CORN IN US GULF

CALIFORNIA MEAL/DDG/CORN
-100.0
0.0
100.0
200.0
300.0
400.0
500.0
600.0
1/3
/20
16
1/2
4/2
01
6
2/1
4/2
01
6
3/6
/20
16
3/2
7/2
01
6
4/1
7/2
01
6
5/8
/20
16
5/2
9/2
01
6
6/1
9/2
01
6
7/1
0/2
01
6
7/3
1/2
01
6
8/2
1/2
01
6
9/1
1/2
01
6
10
/2/2
01
6
10
/23
/20
16
11
/13
/20
16
12
/4/2
01
6
12
/25
/20
16
1/1
5/2
01
7
2/5
/20
17
2/2
6/2
01
7
3/1
9/2
01
7
4/9
/20
17
4/3
0/2
01
7
5/2
1/2
01
7
6/1
1/2
01
7
7/2
/20
17
7/2
3/2
01
7
8/1
3/2
01
7
9/3
/20
17
9/2
4/2
01
7
10
/15
/20
17
11
/5/2
01
7
11
/26
/20
17
12
/17
/20
17
1/7
/20
18
1/2
8/2
01
8
2/1
8/2
01
8
3/1
1/2
01
8
4/1
/20
18
4/2
2/2
01
8
5/1
3/2
01
8
6/3
/20
18
6/2
4/2
01
8
7/1
5/2
01
8
Meal MT DDG MT Corn MT Spread
411.1
210.5
181.4
29.1
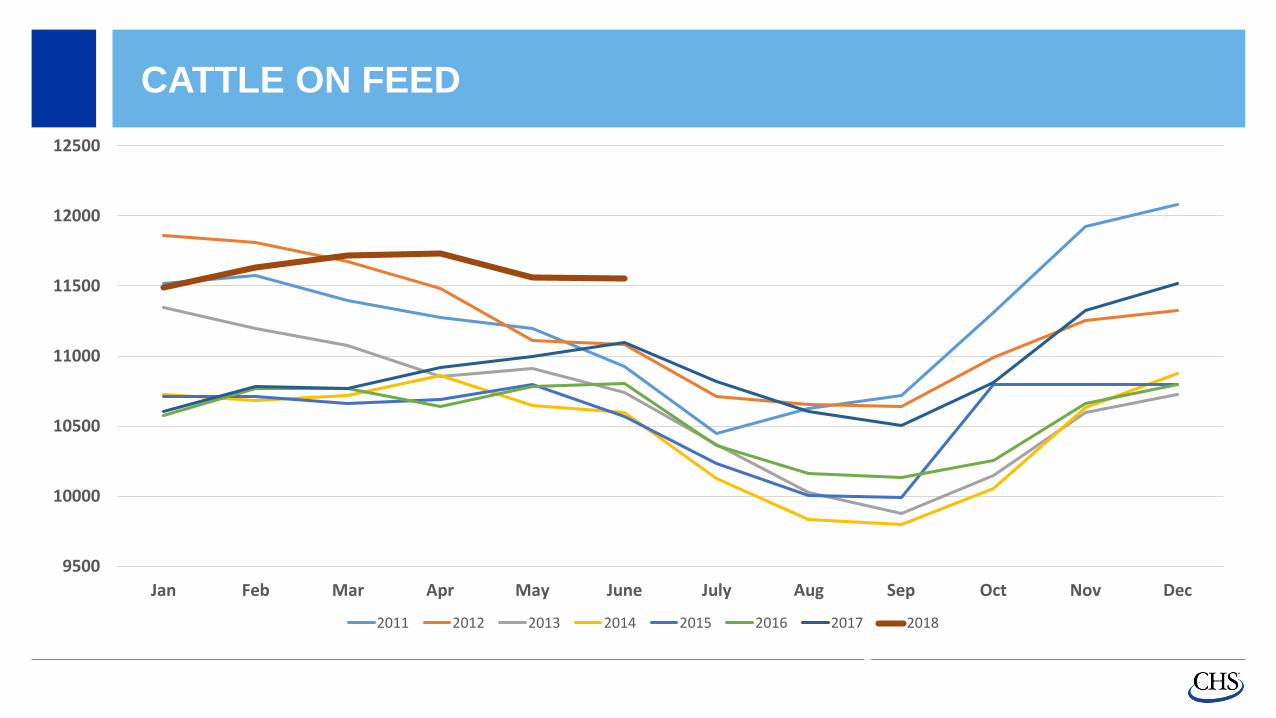
CATTLE ON FEED
9500
10000
10500
11000
11500
12000
12500
Jan Feb Mar Apr May June July Aug Sep Oct Nov Dec
2011 2012 2013 2014 2015 2016 2017 2018

DDG EXPORTS IN THE PAST THREE YEARS
China51%
Mexico13%
Vietnam5%
Korea, South
5%
Canada4%
Thailand3%
Ireland2%
Japan2%
Indonesia2%
Turkey2%
Rest Of World…Mexico
20%
Turkey13%
Korea, South
9%Thailand
7%Indonesia
6%Canada
6%
Japan4%
China4%
Ireland3%
Spain3%
Rest of World25%
2015 2016 2017
China21%
Mexico17%
Vietnam10%
Korea, South8%
Turkey7%
Thailand7%
Canada4%
Indonesia3%
Japan3%
Ireland2%
Rest of World18%

2018 TOTALS
YTD 2018 Totals 2018 June Totals
Partner Qty (June)
Mexico 186,989.00
Turkey 175,030.00
Korea, South 103,357.00
Vietnam 78,157.00
Indonesia 64,614.00
Thailand 63,909.00
Canada 54,931.00
Egypt 50,478.00
Japan 43,906.00
Morocco 41,802.00
Rest of World 171,744.00
Mexico18%
Turkey17%
Korea, South10%Vietnam
8%
Indonesia6%
Thailand6%
Canada5%
Egypt5%
Japan4%
Morocco4%
Rest of World17%
Mexico18%
Korea, South10%
Turkey10%
Vietnam10%
Thailand8%
Canada6%
Indonesia6%
Japan4%
Ireland3%
Israel3%
Rest of World22%
Partner Qty (Jan – June)
Mexico 1,031,513.00
Korea, South 580,907.00
Turkey 576,363.00
Vietnam 550,471.00
Thailand 484,270.00
Canada 330,640.00
Indonesia 324,591.00
Japan 223,991.00
Ireland 171,999.00
Israel 162,616.00
Rest of World 1,229,400.00

2017/2018 COMPARISON
0
200,000
400,000
600,000
800,000
1,000,000
1,200,000
January February March April May June July August September October November December
2017 2018
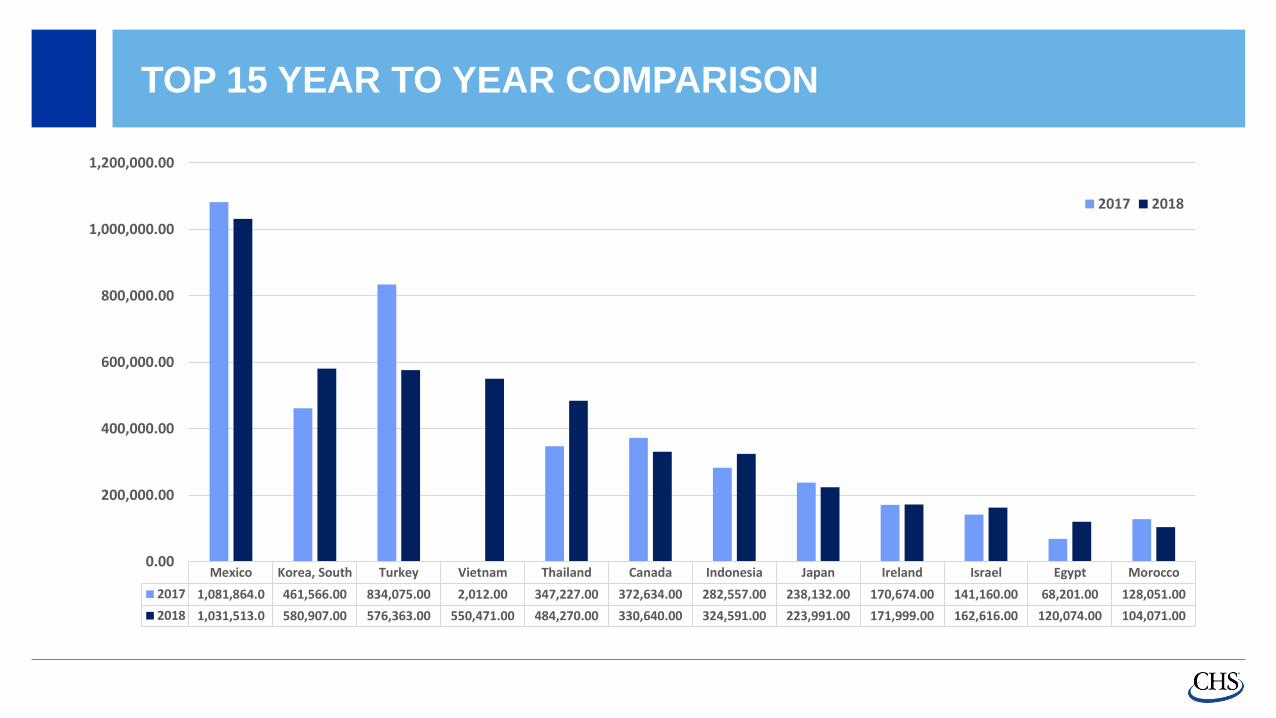
TOP 15 YEAR TO YEAR COMPARISON
Mexico Korea, South Turkey Vietnam Thailand Canada Indonesia Japan Ireland Israel Egypt Morocco
2017 1,081,864.0 461,566.00 834,075.00 2,012.00 347,227.00 372,634.00 282,557.00 238,132.00 170,674.00 141,160.00 68,201.00 128,051.00
2018 1,031,513.0 580,907.00 576,363.00 550,471.00 484,270.00 330,640.00 324,591.00 223,991.00 171,999.00 162,616.00 120,074.00 104,071.00
0.00
200,000.00
400,000.00
600,000.00
800,000.00
1,000,000.00
1,200,000.00
2017 2018

TOP 15 YEAR TO YEAR COMPARISON
Mexico Korea, South Turkey Vietnam Thailand Canada Indonesia Japan Ireland Israel Egypt Morocco
2017 1,081,864.00 461,566.00 834,075.00 2,012.00 347,227.00 372,634.00 282,557.00 238,132.00 170,674.00 141,160.00 68,201.00 128,051.00
2018 1,031,513.00 580,907.00 576,363.00 550,471.00 484,270.00 330,640.00 324,591.00 223,991.00 171,999.00 162,616.00 120,074.00 104,071.00
0.00
200,000.00
400,000.00
600,000.00
800,000.00
1,000,000.00
1,200,000.002017 2018
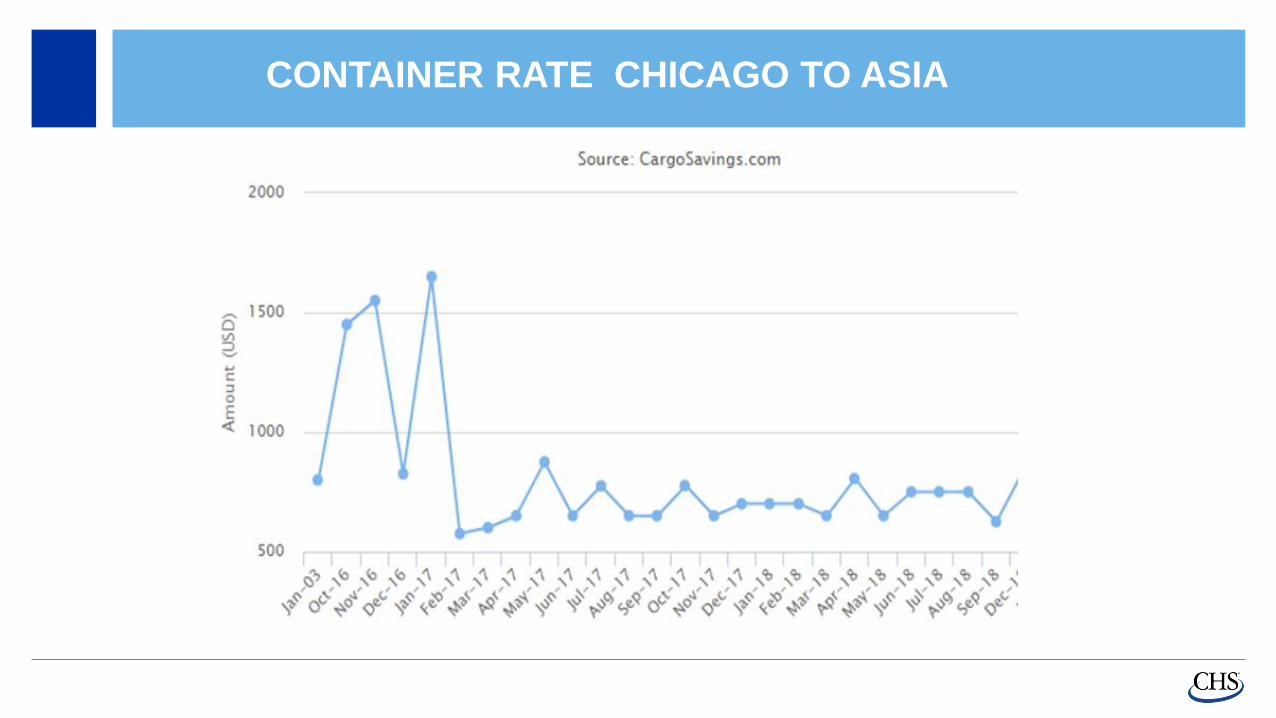
CONTAINER RATE CHICAGO TO ASIA

DDGS PRICE IMPACTS FOR 2018-19
• Export-positive NAFTA resolution
• Values of US $
• South American growing conditions
• Freight

51
Recommended