Brevard County Public SchoolsSchool Improvement Plan
2012-2013
Name of School: Area:
Principal: Area Superintendent:
SAC Chairperson:
Superintendent: Dr. Brian Binggeli
Mission Statement: Excellence is the standard.
Vision Statement: The Hoover Middle School Community will develop well-rounded, life-long learners.
Herbert C. Hoover Middle School South Area
Ms. Mollie Vega Dr. Mark Mullins
Mr. Bill LaChappelle
Page 1

Brevard County Public SchoolsSchool Improvement Plan
2012-2013RATIONAL – Continuous Improvement Cycle Process
Data Analysis from multiple data sources: (Needs assessment that supports the need for improvement)
FCAT WritingThe percent of eighth grade students meeting high standard (4.0) on the FCAT Writing has declined from 85% in 2009, 83% in 2010, to 78% in 2011. With the adjusted standard of 3.0 for meeting high standard, the percent of eighth grade students was 84% in 2012. The scoring criteria from the Florida Department of Education for 2012 included more stringent application of correct use of standard English, and increased attention to the quality of detail using relevant, logical and plausible support.
FCAT Reading Results of the 2010 Florida Comprehensive Assessment Test (FCAT) revealed that 84% of Hoover Middle School’s students are meeting high standards in reading. 84% of Hoover Middle School’s seventh grade students earned a level 3 or higher in 2010 and 83% of the eighth grade students earned a level 3 or higher.The most significant difference in the FCAT 2010 scores were found in the following scores, which show the changes in FCAT Levels made by students in reading:45 seventh graders increased a level55 seventh graders decreased a level12 eighth graders increased a level79 eighth graders decreased a level
Results of the 2011 Florida Comprehensive Assessment Test (FCAT) revealed that 85% of Hoover Middle School’s students are meeting high standards in reading. 87% of Hoover Middle School’s seventh grade students earned a level 3 or higher in 2011, while only 65% of the eighth grade students earned a level 3 or higher.
Results of the 2012 Florida Comprehensive Assessment Test (FCAT) revealed that 75% of Hoover Middle School’s students are meeting high standards in reading. 77% of Hoover Middle School’s seventh grade students earned a level 3 or higher in 2012 and 72% of the eighth grade students earned a level 3 or higher.Declining scores of higher level students continues to be a concern with the following results:21 seventh grade level 3 students’ scores declined to a level 1 or 233 seventh grade level 4 students’ scores declined to a level 2 or 319 seventh grade level 5 students’ scores declined to a level 3 or 4A total of 29% of 7th graders decreased at least one level while only 16% increased 25 eighth grade level 3 students’ scores declined to a level 1 or 2 22 eighth grade level 4 students’ scores declined to a level 2 or 319 eighth grade level 5 students’ scores declined to a level 3 or 4A total of 32% of 8th graders decreased at least one level while 23% increased
During the past three years 62% of the students on average at Hoover Middle School have made learning gains in reading. There was a decline in the number of students making learning gains in 2011 (59%) from 63% in 2010, however there was an increase in 2012 to 65%. For students in the lowest 25%, there has been a steady decrease in those making learning gains from 68% in 2010 to 59% in 2011 to 54% in 2012.
FAIRDuring the 2011-2012 school year, results from the initial FAIR testing window and the final FAIR testing window were analyzed. In the area of 7th grade reading comprehension, Hoover MS moved from a median percentile rank of 60% to 68%. For our 8 th grade students, the median percentile rank moved from 60% to 65%.
Page 2

For the 2012-2013 school year, during the initial FAIR testing window, the median percentile rank for reading comprehension test was 54% for the 7th grade and 60% for the 8th grade.
Currently for our 7th grade students, the initial FAIR testing window indicates 35.1% of our White Students, 50% of our Black Students, 65% of our Hispanic Students, and 37.5% of our Multiracial Students are performing below the 40% rank on the Reading Comprehension test. Currently for our 8th grade students, the initial FAIR testing window indicates 26% of our White Students, 50% of our Black Students, 53.8% of our Hispanic Students, and 43.8% of our Multiracial Students are performing below the 40% rank on the Reading Comprehension test.
During the 2011-2012 school year, In the area of 7th grade Reading Comprehension, when comparing the initial and final FAIR Reading Comprehension results of students performing below the 40%, White Students decreased from 30.8% to 20.6%, Black Students decreased from 83.3% to 57.1%, Hispanic Students decreased from 72.2% to 22.2% Economically Disadvantaged Students decreased from 48.8% to 37%, and Students with Disabilities decreased from 81.2% to 75%.
During the 2011-2012 school year, In the area of 8th grade Reading Comprehension, when comparing the initial and final FAIR Reading Comprehension results of students performing below the 40%, White Students decreased from 23.7% to 17.3%, Black Students decreased from 66.7% to 33.3%, Hispanic Students remained the same at 17.6% Economically Disadvantaged Students decreased from 36.8% to 23.7%, and Students with Disabilities remained the same at 60%
MathematicsNinety-one percent of students in seventh and eighth grade scored a level 3 or higher in mathematics on the 2010 FCAT. Eighty percent of the students made an annual learning gain. Eighty-five percent of the struggling students made a year’s worth of progress in mathematics on the 2010 FCAT. Eighty-six percent of students in seventh and eighth grade scored a Level 3 or higher in mathematics on the FCAT 2011. Seventy-two percent of the students made an annual learning gain. Seventy-three percent of the struggling students made a year's worth of progress in mathematics on the FCAT 2011.
Eighty-four percent of students in seventh and eighth grade scored a level 3 or higher in mathematics on the FCAT 2012. Seventy-eight percent made an annual learning gain. Sixty-two percent of the struggling students made a year’s worth of progress in mathematics on the 2012 FCAT.
Over the past three years, there has been a decrease in the percentage of students scoring at level 3 or above and a decrease the percentage of learning gains by the lowest 25%.
ScienceThere has been a change in the Science FCAT scores for the past three years. The percent of eighth grade students scoring at Level 3 or higher has moved from 73% in 2010 to 59% in 2011. In 2012, the percent of eighth grade students scoring at level 3 or higher showed a significant growth to 76%. Parental InvolvementResults of the parent survey are as follows:-The best method of communications is Email (93%), Edline (75%), Newsletters (34%), and Synervoice (33%).-Eighty-seven percent of respondents have attended informational meetings or academic events of which 91% said the information was beneficial. Those not attending said it was because the information was not relevant or meetings were not at a convenient time.-Eighty-two percent of parents are at least satisfied with classroom instruction and quality/quantity of homework.-Currently, 91% of our parents have active Edline accounts.
Analysis of Current Practice: (How do we currently conduct business?) Due to our small school size, we have not had “teams” over the last couple of years. However, given its
Page 3

importance, we have added middle school teaming to our schedule this year. This allows a cohort of teachers to share a cohort of students working collaboratively to discuss issues or concerns and to work interdisciplinary on projects. As our focus is shifting toward the Common Core Standards (CCSS) which emphasizes rigor, relevance and college and career readiness for all students, we felt it was important to ensure collaboration among departments. Therefore, we have implemented common departmental planning this year
All instructional staff share in the disaggregation of the FCAT reading data, and Language Arts teachers identify specific strengths and weaknesses for their students. Hoover Middle School uses specific reading instruction in content areas to support reading achievement for all students. Departments meet in Professional Learning Teams to share best practices and to discuss students who are not making satisfactory progress.
Students who scored a Level 1 or 2 on the 2012 Reading FCAT, receive intensive instruction in additional reading classes. Reading instruction includes modeling reading strategies, higher level questioning strategies, and response to fiction and non-fiction.
The Response to Intervention (RtI) compares students with their peers to determine learning gaps, areas of weakness, and strengths for individual students. The Problem Solving Team meets weekly to investigate strategies that may work for an individual child or groups of students in tier three of the RtI process.
Tutoring sessions are available before, during and after school in both Language Arts and Math.
Gifted Science and Gifted World Cultures are offered in seventh grade, and eighth grade students (in the gifted education program) take the Gifted U.S. History and Gifted Language Arts classes.
Advanced classes in mathematics are available to meet the needs of students, including Algebra I, Algebra I Honors and Geometry Honors.
The Science Research class is open to students interested in this intense Science course.
The need exists for consistent modeling and use of non-linguistic representation in content Areas: (Mathematics, English, Science and Social Studies) and elective classes, to ensure students build vocabulary and develop a deeper understanding of the texts and reading material.
Additionally, the need exists for continued emphasis on higher order thinking, vocabulary, and summarizing.
The 6 Traits of Writing are addressed monthly in all Language Arts department PLTs, and are taught by every Language Arts teacher. District FCAT Writing and Grammar Mastery pre/post tests are administered twice a year.
Over the past two years, Hoover has made an effort to train all teachers on Thinking Maps. With the exception of new teachers this year, all have been trained and are continuing to utilize them within their classes.
Non-Fiction writing occurs across the curriculum in Language Arts, Social Studies, Science, Math and Elective classes.
In an effort to address the various students’ achievement levels and ensure rigor for all students, students are homogeneously grouped for MESH courses this year. This will allow teachers to begin work at the students’ level current elevating them rather than “teaching to the middle” of a heterogeneous group.
Best Practice: (What does research tell us we should be doing as it relates to data analysis above?)Classroom instruction should include researched strategies that have the potential for improving studentachievement. According to Marzano (2003), nine instructional strategies were identified as affecting student achievement: Identifying similarities and differences; Summarizing and note taking; Reinforcing effort and providing recognition; Homework and practice; Nonlinguistic representations; Cooperative
Page 4
Learning; Setting objectives and providing feedback; Generating and testing hypothesis; and Questions, cues and advance organizers.
Effective teachers also tended to employ different strategies with different types of learners, whereas ineffective teachers did not use different strategies based on the students' needs.
Based on six research studies, Daggett identified ten central findings that schools to use to be successful: (1) a culture of rigorous and relevant curriculum for all students, (2) utilization of data to focus curriculum on priorities, (3) real-world applications of skills, (4) framework to organize curriculum that drives instruction, (5) multiple pathways to rigor and relevance based on student needs and interests, (6) set high expectations and continuously monitor students for success, (7) sustained professional development, (8) parent and community involvement, (9) safe and orderly school, and (10) effective leadership development for administrators, teachers, parents and community (Daggett, 2005).
Research-based high impact strategies that help raise student learning and achievement significantly are (1) extended thinking strategies, (2) summarizing, (3) vocabulary in context, (4) advance organizers, and (5) non-verbal representations. Evidence-based strategies that impact student learning are (1) vocabulary, (2) summarizing, (3) Reading comprehension, (4) writing to raise achievement, and (5) organizational and instructional focus with previewing and scaffolding grade-level content and assignments for struggling students (Thompson, 2011).
Teachers must have an in-depth knowledge of teaching specific math concepts such as the transition from additive reasoning to multiplicative reasoning (Kent, Arnosky, & McMonagle, 2002; Sowder et al., 1998; Vanhille & Baroody, 2002). Research also shows that although fractions are taught in elementary school, students tend to have a minimal and procedural understanding of fractions and lack the knowledge of underlying concepts. Middle school mathematic teachers must develop explicit lessons to assist students in a deeper understanding of fractions. The use of manipulatives and hands-on experiences help students to develop the conceptual understanding (Mack, 1990).
Probably one of the greatest determining factors in academic success is parental involvement and parental motivation. About 70-90% of children who get As and Bs in schools report they are encouraged to do well by parents in school. These parents are also around to help with homework, attend meetings and volunteer in schools. Schools regularly report that better performance and academic success is more likely when parents are actively involved. (Ellis-Christiensen)
Daggett Ed.D, Willard R., “Successful Schools: From Research to Action Plans.” Model Schools Conference. June 2005. Lecture.
Ellis-Christensen, Tricia, and O. Wallace. WiseGeek. Conjecture, n.d. Web. 23 Sept. 2012. <http://www.wisegeek.com/what-factors-contribute-to-academic-success-in-children.htm>.
Kent, L. B., Arnosky, J., & McMonagle J. (2002). Using representational contexts to support multiplicativereasoning. In B. Litwiller & G. Bright (Eds.), Making sense of fractions, ratios, and proportions: 2002 yearbook (pp. 145–152). Reston, VA: National Council of Teachers of Mathematics
Mack, N. K. (1990). Learning fractions with understanding. Journal for Research in & Mathematics Education, 21 &, 16–32.
Sowder, J., Armstrong, B., Lamon, S., Simon, M., Sowder, L., & Thompson, A. (1998). Educating teachers to teach multiplicative structures in the middle grades. Journal of Mathematics Teacher Education, 1 &, 127–155.
Thompson Ed.D., Max. Moving Schools: Lessons From Exemplary Leaders. Item Number 528, Version 1. Boone: Learning Focused, 2011.
Vanhille, L., & Baroody, A. J. (2002). Fraction instruction that fosters multiplicative reasoning. In B. Litwiller & G. Bright (Eds.), Making sense of fractions, ratios, and proportions:2002 yearbook (pp.224–236). Reston, VA: National Council of Teachers of Mathematics
Final Analysis
Page 5
Although Hoover MS is traditionally a high performing school, there is a concern of overall scores falling during the past three years. Students have traditionally be grouped heterogeneously thus requiring differentiated instruction in all classes. In an effort to address the needs of individual and groups of students, students were grouped homogeneously for their MESH courses. Common planning for departments was also incorporated in the schedule this year to allow additional time for teachers to plan collaboratively. An emphasis on higher level thinking skills and nonlinguistic representation will continue to be implemented, as well as, incorporating summarizing and vocabulary in context as high impact strategies to improve learning for all.
Page 6

CONTENT AREA: Reading Math Writing Science Parental
InvolvementDrop-out Programs
Language Arts
Social Studies
Arts/PE Other: All Elective Classes
School Based Objective: (Action statement: What will we do to improve programmatic and/or instructional effectiveness?)
READING: Teachers will utilize Common Core Literary Standards to assist students with summarizing and interpreting non-fiction reading to increase reading comprehension and assessment scores.
Strategies: (Small number of action oriented staff performance objectives)
Barrier Action Steps Person Responsible
Timetable Budget In-ProcessMeasure
1. Students have not been exposed to DBQ process
1a. Model and teach students how to answer document based questions
Social Studies Teachers
1st nine weeks Lesson plans,Classroom Walk throughs
1b. Have students utilize documents to answer a DBQ
Social Studies Teachers
Once per grading period
Lesson Plans, Student work
2. Comfort level of students with non-fiction text
2a. Model and teach students to interpret and summarize non-fiction text
Language Arts & Social Studies teachers
1st nine weeks Lesson plans,Classroom Walk Throughs
2b. Have students use literature and Scholastic Readers to read and interpret non-fiction
Language Arts Teachers
Monthly $100.00 Student work
2c. Read non-fiction literature 25% during Language Arts classes
Language Arts Teachers
Monthly Lesson plans
2d. Read content specific non-fiction text and write summary
Elective Teachers Once per semester
Lesson plans and student work
2e. Read content specific
Science Teachers Once per nine weeks
Lesson plans and student
Page 7

non-fiction text and write summary
work
3. Comprehension of mathematic word problems
3a. Model how to utilize context clues to break problems into pieces
Math Teachers 1st nine weeks Lesson Plans
3b. Utilize context clues to break problems into pieces
Math Teachers Twice a month Quizzes
EVALUATION – Outcome Measures and Reflection
Qualitative and Quantitative Professional Practice Outcomes: (Measures the level of implementation of the professional practices throughout the school)
100% of social studies teachers will model how to answer document based questions during the first nine weeks and then have students utilize documents to respond to DBQs once per grading period. 100% of Language Arts teachers will utilize non-fiction texts for 25% of all reading in the classroom. They will model and teach students to interpret and summarize non-fiction text during the first nine weeks and then have students read and summarize non-fiction text a minimum of once per month utilizing both literature and Scholastic Readers. 100% of Science teachers will have students read content specific non-fiction text and write summaries once per nine weeks and 100% of elective teachers will have students read content specific non-fiction texts and write summaries a minimum of once per semester. 100% of Math teachers will model how to use context clues to break math word problems into pieces during the first nine weeks and then will have students use context clues to interpret and solve word problems a minimum of twice per month. The level of implementation will be monitored and evident through observations, teacher lesson plans, student work samples, and an end of year teacher survey.
Qualitative and Quantitative Student Achievement Expectations: (Measures of student achievement)
Students will utilize non-fiction text in all subject areas, summarizing and interpreting text to increase reading comprehension and assessment scores according to the following: Social Studies – DBQs once per grading period Language Arts – 25% of all reading will be non-fiction, summarizing will occur once per month Science – Once per nine weeks Electives – Once per semesterIn math classes, students will utilize context clues to break down word problems to assist with solving twice per month.With an increased emphasis on reading non-fiction text and interpreting and summarizing, students will have a better understanding of content in all subject areas which will result in increased assessment scores. In 2011-12, Hoover had 78% of students score a level 3 or above on the FCAT reading. With the increased emphasis on non-fiction reading, Hoover will have 81% of students score a level 3 or above. In addition, students will complete a survey indicating that 70% of all students felt summarizing strategies helped them better understand their content material.
Page 8

CONTENT AREA: Reading Math Writing Science Parental
InvolvementDrop-out Programs
Language Arts
Social Studies
Arts/PE Other: All Elective Classes
School Based Objective: (Action statement: What will we do to improve programmatic and/or instructional effectiveness?)
WRITING: All teachers will provide opportunities for students to write utilizing proper conventions. In addition, students will have opportunities to increase vocabulary and practice higher order thinking in to improve comprehension and writing skills.
Strategies: (Small number of action oriented staff performance objectives)
Barrier Action Steps Person Responsible
Timetable Budget In-ProcessMeasure
1. Vocabulary Comprehension
1a. Use vocabulary in context within lessons to increase vocabulary comprehension
All MESH Teachers
Weekly Lesson Plans,Student work,assessments
1b. Use vocabulary in context within lessons to increase vocabulary comprehension
All Elective Teachers
Per Unit Lesson Plans,Student work,assessments
1c. Utilize word walls when teaching vocabulary
Social Studies Teachers
Each Unit Classroom Displays,Classroom Walkthroughs
2. Lack of students’ ability to summarize
2a. Model and teach students how to summarize math concepts
Math Teachers 1st nine weeks Lesson Plans
2b. Have students summarize math concepts utilizing proper vocabulary and conventions
Math Teachers Each Unit Student work
2c. Model and teach students how to write lab reports
Science Teachers 1st nine weeks Lesson Plans
Page 9

2d. Have students answer questions regarding labs and then organize them into summaries (abstracts).
Science Teachers Once per grading period
Lesson plans and student work
3. Student prior knowledge
3a. Teach pre-writing skills to include using outlines and graphic organizers
Language Arts Teachers
Monthly Lesson plans, classroom walk throughs, Graded student work
3b. Have students write 5 paragraph essays using proper conventions
Language Arts Teachers
Six per year Graded student work
4. Improper sentence conventions
4a. Incorporate long and/or short responses utilizing proper conventions in student assessments
Language Arts, Social Studies and Elective teachers
Minimum of twice per year (semester exams)
Copies of exams,Copies of assessments
EVALUATION – Outcome Measures and Reflection
Qualitative and Quantitative Professional Practice Outcomes: (Measures the level of implementation of the professional practices throughout the school)
100% of MESH teachers will utilize vocabulary in context within lessons at least once per week and 100% of elective teachers will utilize vocabulary in context within lessons each unit. Social studies teachers will create content specific word walls associated with each unit of study. Math teachers will model how to summarize math concepts during the first nine weeks and then require students to summarize and explain math concepts and procedures each unit of study. Science teachers will model how to write lab reports during the first nine weeks and then students will answer questions regarding labs and organize them into summaries once per grading period. Language Arts teachers will model and have students utilize pre-writing strategies to include outlines and graphic organizers every month and will have students write a five paragraph essay six times per year. Language Arts, history and elective teachers will include short and/or long responses on semester exams requiring the utilization of proper conventions. The level of implementation will be monitored and evident through observations, teacher lesson plans, student work samples, and an end of year teacher survey.
Page 10

Qualitative and Quantitative Student Achievement Expectations: (Measures of student achievement)
Students will be exposed to and utilize content specific vocabulary in all MESH course on a weekly basis and elective classes each unit. Vocabulary will be used in application for class writing assignments. Students will use prewriting strategies such as graphic organizers and outlines in Language Arts and Social Studies classes to help improve writing. Students will write five paragraph essays in Language Arts classes six times per year. Students will organize and write summaries when completing lab reports once per grading period. Students will summarize math concepts once per unit. Students will be required to utilize content specific vocabulary and proper conventions in all summary writingWith an increased emphasis on vocabulary, summarizing and utilization of proper conventions in writing, students will have a better understanding of content in all subject areas which will result in increased assessment scores. In 2011-12, Hoover had 84% of students score a level 3 or above on the FCAT Writes. With the increased emphasis on vocabulary, summarizing and conventions, Hoover will have 92% of students score a level 3 or above. In addition, students will complete a survey indicating that 70% of all students felt these strategies helped them better understand their content material and improve their writing skills.
Page 11

CONTENT AREA: Reading Math Writing Science Parental
InvolvementDrop-out Programs
Language Arts
Social Studies
Arts/PE Other: All Elective Classes
School Based Objective: (Action statement: What will we do to improve programmatic and/or instructional effectiveness?)
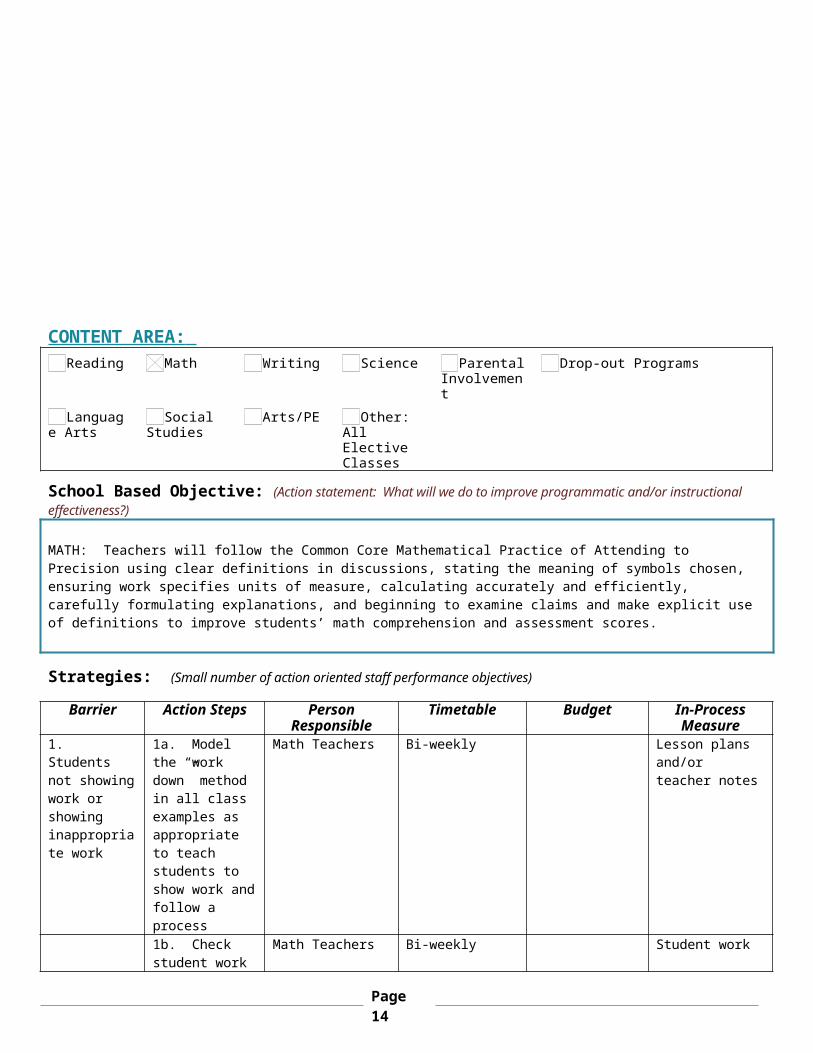
MATH: Teachers will follow the Common Core Mathematical Practice of Attending to Precision using clear definitions in discussions, stating the meaning of symbols chosen, ensuring work specifies units of measure, calculating accurately and efficiently, carefully formulating explanations, and beginning to examine claims and make explicit use of definitions to improve students’ math comprehension and assessment scores.
Strategies: (Small number of action oriented staff performance objectives)
Barrier Action Steps Person Responsible
Timetable Budget In-ProcessMeasure
1. Students not showing work or showing inappropriate work
1a. Model the “work down” method in all class examples as appropriate to teach students to show work and follow a process
Math Teachers Bi-weekly Lesson plans and/or teacher notes
1b. Check student work for proper formatting to ensure work is shown to improve student learning and achievement
Math Teachers Bi-weekly Student work
2. Student misuse or misunderstanding of mathematical symbols
2a. Teach students the proper meaning of each math symbol to clarify understanding
Math Teachers Bi-weekly Lesson plans
2b. Model the use of math symbols to reinforce proper usage
Math Teachers Bi-weekly Lesson plans and/or teacher notes
2c. Check student understanding
Math Teachers Bi-weekly Formative assessment
Page 12
through formative assessment to improve student achievement
EVALUATION – Outcome Measures and Reflection
Qualitative and Quantitative Professional Practice Outcomes: (Measures the level of implementation of the professional practices throughout the school)
All math teachers will demonstrate how to “work down” the page showing all work and following a process bi-weekly and require students to show all work using proper formatting on all assignments. They will also define proper meanings of each math symbol to clarify understanding and model the use of symbols to reinforce proper usage. Math teachers will check student understanding bi-weekly through formative assessments.The level of implementation will be monitored and evident through observations, teacher lesson plans, student work samples, and an end of year teacher survey.
Qualitative and Quantitative Student Achievement Expectations: (Measures of student achievement)
Students will be exposed to proper formatting of math problems and the “work down” model of showing all work as well as proper meaning of each math symbol to clarify understanding. Students will show all work utilizing the “work down” method and proper formatting when working math problems in all math classes. They will be required to understand the meaning of math symbols and their proper usage.
With an increased emphasis on the Common Core Mathematical Practice of Attending to Precision, students will have a better understanding of math content, vocabulary, and work processes which will result in increased assessment scores. In 2011-12, Hoover had 82% of students score a level 3 or above on the FCAT Math. With the increased emphasis on vocabulary, summarizing and conventions, Hoover will have 88% of students score a level 3 or above. In addition, students will complete a survey indicating that 70% of all students felt these strategies helped them better understand their content material and improve their computation skills.
Page 13
CONTENT AREA: Reading Math Writing Science Parental
InvolvementDrop-out Programs
Language Arts
Social Studies
Arts/PE Other: All Elective Classes
School Based Objective: (Action statement: What will we do to improve programmatic and/or instructional effectiveness?)
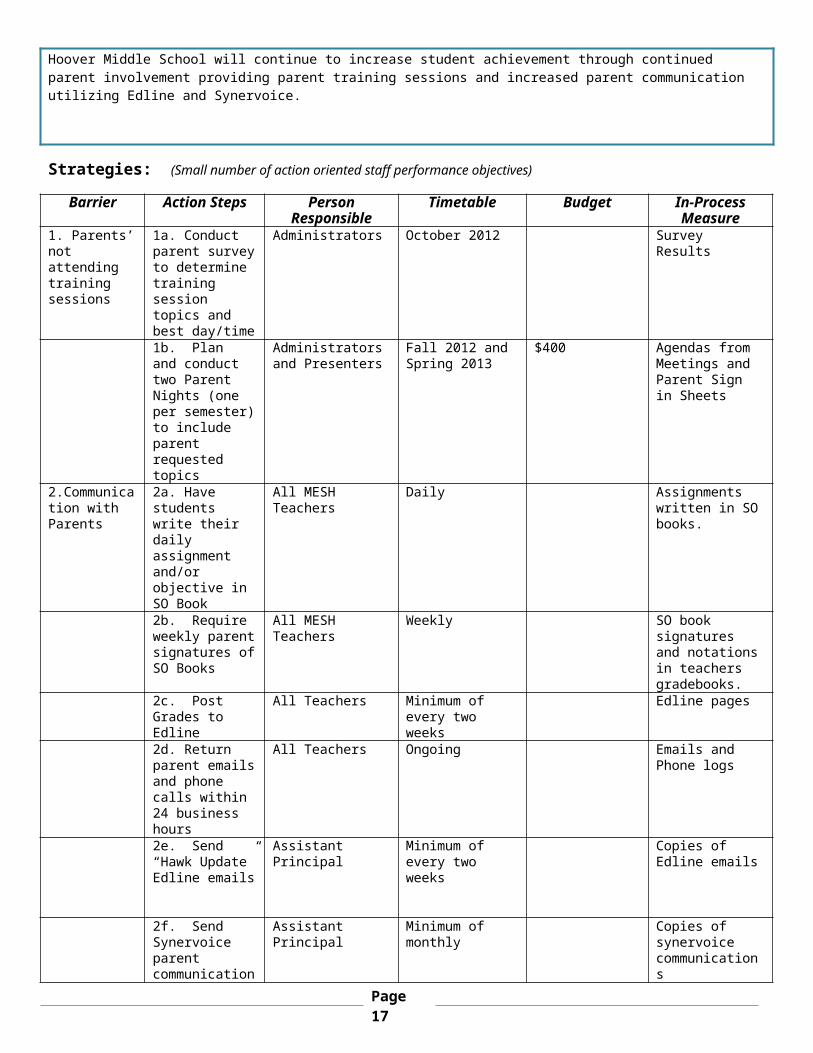
Hoover Middle School will continue to increase student achievement through continued parent involvement providing parent training sessions and increased parent communication utilizing Edline and Synervoice.
Strategies: (Small number of action oriented staff performance objectives)
Barrier Action Steps Person Responsible
Timetable Budget In-ProcessMeasure
1. Parents’ not attending training sessions
1a. Conduct parent survey to determine training session topics and best day/time
Administrators October 2012 Survey Results
1b. Plan and conduct two Parent Nights (one per semester) to include parent requested topics
Administrators and Presenters
Fall 2012 and Spring 2013
$400 Agendas from Meetings and Parent Sign in Sheets
2.Communication with Parents
2a. Have students write their daily assignment and/or objective in SO Book
All MESH Teachers
Daily Assignments written in SO books.
2b. Require weekly parent signatures of SO Books
All MESHTeachers
Weekly SO book signatures and notations in teachers gradebooks.
2c. Post Grades to Edline
All Teachers Minimum of every two weeks
Edline pages
Page 14

2d. Return parent emails and phone calls within 24 business hours
All Teachers Ongoing Emails and Phone logs
2e. Send “Hawk Update” Edline emails
Assistant Principal
Minimum of every two weeks
Copies of Edline emails
2f. Send Synervoice parent communication
Assistant Principal
Minimum of monthly
Copies of synervoice communications
2g. Post Newsletters
Principal, Assistant Principal
Monthly Copies of newsletters
EVALUATION – Outcome Measures and Reflection
Qualitative and Quantitative Professional Practice Outcomes: (Measures the level of implementation of the professional practices throughout the school) Parents will participate in a survey during the first semester to determine training requests and the best time/day to conduct parent training. Two parent nights will be planned based upon the parent survey results (one each semester). Students will write their assignments and/or daily objectives in their SO books each day for their MESH classes and have their parents sign their SO books weekly. MESH teachers will check SO books for parent signatures weekly using a rotation schedule. All teachers will post grades to Edline a minimum of once every two weeks. Administration will communicate with parents via “Hawk Update” Edline emails, synervoice, and monthly Newsletters. The level of implementation will be monitored and evident through observations, teacher lesson plans, student work samples, meeting agendas, grade books, communication logs, and an end of year teacher survey.
Qualitative and Quantitative Student Achievement Expectations: (Measures of student achievement)
Ninety percent of our parent respondents will indicate participation in attending informational meetings or academic events in the end of year parent survey. This increase will be due to providing topics of interest and convenient meeting times. Parents will receive monthly newsletters and bi-weekly emails and grade postings to allow for clearer knowledge of Hoover activities and student progress. This incWith an increased emphasis on parent involvement through meetings, communication, and Edline, students will show increased assessment scores in all areas. Assessments scores will increase as follows: FCAT Reading: increase from 78% to 81% proficient FCAT Writes: increase from 84% to 92% proficient FCAT Math: increase from 82% to 88% proficient FCAT Science: increase from 76% to 81% proficient
Page 15

APPENDIX A
(ALL SCHOOLS)Reading Goal
1. If the process of utilizing Common Core Literary Standards to assist students with summarizing and interpreting non-fiction reading is implemented with fidelity, reading achievement will be addressed for all groups.
2012 Current Level of
Performance(Enter percentage information and the number of students that percentage reflects ie.
28%=129 students)
2013 Expected Level of
Performance(Enter percentage
information and the number of students that percentage reflects ie. 31%=1134 students)
Anticipated Barrier(s):1.Strategy(s):1.FCAT 2.0Students scoring at Achievement Level 3
Barrier(s):
Strategy(s):1.
32% = 163 32% = 163Current level 3’s less 16 moved to
level 4 or 5 + 14% (16) from level 1 and 2’s
Florida Alternate Assessment: Students scoring at levels 4, 5, and 6 in Reading
Barrier(s):
Strategy(s):
1.
25% = 1 *Due to the small number of
students in this category, the
data would not be valid
FCAT 2.0Students scoring at or above Achievement Levels 4 and 5 in Reading
Barrier(s):
Strategy(s):1.
46% = 237 49% = 253Current level 4 and 5’s + 10%
from current level 3’s
Florida Alternate Assessment:Students scoring at or above Level 7 in Reading
Barrier(s):
Strategy(s):1.
25% = 1 *Due to the small number of
students in this category, the
data would not be valid
Florida Alternate Assessment:Percentage of students making learning Gains in Reading
Barrier(s):
Strategy(s):1.
0% *Due to the small number of
students in this category, the
data would not be
Page 16
validFCAT 2.0Percentage of students in lowest 25% making learning gains in Reading
Barrier(s):
Strategy(s):1.
Florida Alternate Assessment:Barrier(s):
Strategy(s):1.
57% = 50
0%
67% = 58
*Due to the small number of
students in this category, the
data would not be valid
Ambitious but Achievable Annual Measurable Objectives (AMOs). In six years school will reduce their Achievement Gap by 50%:
Baseline data 2010-11:
Student subgroups by ethnicity NOT making satisfactory progress in reading :
White:
Black:
Hispanic:
Asian:
American Indian:
Enter numerical data for current level of performance
22% = 99
*fewer than 10 in subgroup
43% = 15
*fewer than 10 in subgroup
*fewer than 10 in subgroup
Enter numerical data for expected level of
performance
20% = 89
*fewer than 10 in subgroup
35% = 12
*fewer than 10 in subgroup
*fewer than 10 in subgroup
English Language Learners (ELL) not making satisfactory progress in ReadingBarrier(s):
Strategy(s):1.
*fewer than 10 in subgroup
*fewer than 10 in subgroup
Students with Disabilities (SWD) not making satisfactory progress in ReadingBarrier(s):
Strategy(s):1.
57% = 39 51% = 35
Economically Disadvantaged Students not making satisfactory progress in ReadingBarrier(s):
Strategy(s):1.
44% = 63 36% = 51
Reading Professional DevelopmentPD Content/Topic/Focus Target
Dates/ScheduleStrategy(s) for follow-up/monitoring
Page 17

CELLA GOAL Anticipated Barrier
Strategy Person/Process/
Monitoring2012 Current Percent of Students Proficient in Listening/ Speaking:
2012 Current Percent of Students Proficient in Reading:
2012 Current Percent of Students Proficient in Writing:
Mathematics Goal(s):1. If the process of following the Common Core Mathematical Practice of Attending to Precision is implemented with fidelity, mathematics achievement will be addressed for all groups.
2012 Current Level of
Performance(Enter
percentage information and the number of students that percentage
reflects)
2013 Expected Level of
Performance(Enter percentage information and the number of students that percentage
reflects)
Anticipated Barrier(s):1.Strategy(s):1.FCAT 2.0Students scoring at Achievement Level 3Barrier(s):
Strategy(s):1.
34% = 175 34% = 175Current level 3’s less 17 moved to
level 4 or 5 + 21% (17) from level 1 and 2’s
Florida Alternate Assessment: Students scoring at levels 4, 5, and 6 in MathematicsBarrier(s):
Strategy(s):1.
50% = 2 *Due to the small number of students in this category, the
data would not be valid
FCAT 2.0Students scoring at or above Achievement Levels 4 and 5 in MathematicsBarrier(s):
Strategy(s):1.
48% = 258 54% = 275Current level 4 and 5’s + 10% from current
level 3’sFlorida Alternate Assessment:Students scoring at or above Level 7 in MathematicsBarrier(s):
25% = 1 *Due to the small number of
66% = 2
33% = 1
0%
Page 18

Strategy(s):1.
students in this category, the
data would not be valid
Florida Alternate Assessment:Percentage of students making learning Gains in MathematicsBarrier(s):
Strategy(s):1.
100% = 4 *Due to the small number of students in this category, the
data would not be valid
FCAT 2.0Percentage of students in lowest 25% making learning gains in MathematicsBarrier(s):
Strategy(s):1.
65% = 48 75% = 56
Florida Alternate Assessment:Percentage of students in Lowest 25% making learning gains in MathematicsBarrier(s):
Strategy(s):1.
0% *Due to the small number of students in this category, the
data would not be valid
Ambitious but Achievable Annual Measurable Objectives (AMOs). In six years school will reduce their Achievement Gap by 50%:
Baseline Data 2010-11:
Student subgroups by ethnicity :White:
Black:
Hispanic:
Asian:
American Indian:
15% = 65
*fewer than 10 in subgroup
44% = 15
*fewer than 10 in subgroup
*fewer than 10 in subgroup
13% = 58
*fewer than 10 in subgroup
24% = 8
*fewer than 10 in subgroup
*fewer than 10 in subgroup
English Language Learners (ELL) not making satisfactory progress in Mathematics
*fewer than 10 in subgroup
*fewer than 10 in subgroup
Students with Disabilities (SWD) not making satisfactory progress in Mathematics 53% = 35 44% = 29Economically Disadvantaged Students not making satisfactory progress in Mathematics 35% = 50 31% = 45
Mathematics Professional DevelopmentPD Content/Topic/Focus Target
Dates/ScheduleStrategy(s) for follow-up/monitoring
Page 19

Writing1. If the process of providing opportunities for students to write utilizing proper conventions and increase vocabulary and practice higher order thinking to improve comprehension and writing skills is implemented with fidelity, writing achievement will be addressed for all groups.
2012 Current Level of Performance
(Enter percentage information and the number of students
that percentage reflects)
2013 Expected Level of Performance
(Enter percentage information and the number of students that percentage
reflects)
Barrier(s):
Strategy(s):1. FCAT: Students scoring at Achievement level 3.0 and higher in writing 84% = 195 92% = 231Florida Alternate Assessment: Students scoring at 4 or higher in writing
50% = 1 *Due to the small number of students in this
category, the data would not be valid
Science Goal(s)(Elementary and Middle)
1. If the process utilizing Common Core Literacy Standards to assist students with summarizing and interpreting non-fiction reading is implemented with fidelity, science achievement will be addressed for all groups.
2012 Current Level of Performance
(Enter percentage information and the number of students
that percentage reflects)
2013 Expected Level of Performance
(Enter percentage information and the number of students
that percentage reflects)
Barrier(s):
Strategy(s):1.FCAT 2.0 Students scoring at Achievement level 3 in Science: 51% = 123 51% = 123
Current level 3’s less 12 moved to level 4 or 5 +
21% (12) from level 1 and 2’s
Florida Alternate Assessment: Students scoring at levels 4, 5, and 6 in Science
0% *Due to the small number of students in this category, the data would not be valid
FCAT 2.0 Students scoring at or above Achievement Levels 4 and 5 in Science:
25% = 60 30% = 72Current level 4 and 5’s + 10% (12) from level 3’s
Florida Alternate Assessment:Students scoring at or above Level 7 in Reading
0% *Due to the small number of students in this category, the data would not be valid
Page 20

APPENDIX B
(SECONDARY SCHOOLS ONLY)
Algebra 1 EOC Goal1. If the process of following the Common Core Mathematical Practice of Attending to Precision is implemented with fidelity, mathematics achievement will be addressed for all groups.
2012 Current Level of Performance
(Enter percentage information and the number of students
that percentage reflects)
2013 Expected Level of Performance
(Enter percentage information and the number of students
that percentage reflects)
Barrier(s):
Strategy(s):1.Students scoring at Achievement level 3 in Algebra: 43% = 69Students scoring at or above Achievement Levels 4 and 5 in Algebra: 52% = 84Ambitious but Achievable Annual Measurable Objectives (AMOs). In six years school will reduce their Achievement Gap by 50%: Baseline Data 2010-11
Student subgroups by ethnicity (White, Black, Hispanic, Asian, American Indian) not making satisfactory progress in Algebra.
White:
Black:
Hispanic:
6% = 8
0%
13% = 1
0%
0%
0%
English Language Learners (ELL) not making satisfactory progress in Algebra
0% 0%Students with Disabilities (SWD) not making satisfactory progress in Algebra
0% 0%Economically Disadvantaged Students not making satisfactory progress in Algebra
6% = 2 0%
Geometry EOC Goal1. If the process of following the Common Core Mathematical Practice of Attending to Precision is implemented with fidelity, mathematics achievement will be addressed for all groups.
2012 Current Level of Performance(Enter
percentage information and the number of students
that percentage reflects)
2013 Expected Level of Performance
(Enter percentage information and the number of students
that percentage reflects)
Barrier(s):
Strategy(s):1.
Students scoring at Achievement level 3 in Geometry:
Students scoring at or above Achievement Levels 4 and 5 in Geometry:
Ambitious but Achievable Annual Measurable Objectives (AMOs).
Page 21

In six years school will reduce their Achievement Gap by 50%: Baseline Data 2010-11
Student subgroups by ethnicity (White, Black, Hispanic, Asian, American Indian) not making satisfactory progress in Geometry.
White:
Black:
Hispanic:
English Language Learners (ELL) not making satisfactory progress in GeometryStudents with Disabilities (SWD) not making satisfactory progress in GeometryEconomically Disadvantaged Students not making satisfactory progress in Geometry
Civics EOC1. If the process utilizing Common Core Literacy Standards to assist students with summarizing and interpreting non-fiction reading is implemented with fidelity, civics achievement will be addressed for all groups.
2012 Current Level of Performance
(Enter percentage information and the number of students
that percentage reflects)
2013 Expected Level of Performance
(Enter percentage information and the number of students
that percentage reflects)
Students scoring at Achievement level 3 in Civics: N/A N/AStudents scoring at or above Achievement Levels 4 and 5 in Civics: N/A N/A
U.S. History EOC1. If the process utilizing Common Core Literacy Standards to assist students with summarizing and interpreting non-fiction reading is implemented with fidelity, US History achievement will be addressed for all groups.
2012 Current Level of Performance
(Enter percentage information and the number of students
that percentage reflects)
2013 Expected Level of Performance
(Enter percentage information and the number of students
that percentage reflects)
Students scoring at Achievement level 3 in U. S. History: N/A N/AStudents scoring at or above Achievement Levels 4 and 5 in U. S. History: N/A N/A
Science, Technology, Engineering, and
Mathematics (STEM) Goal(s)
Anticipated Barrier
Strategy Person/Process/Monitoring
Based on the analysis of school data, identify and define areas in need of improvement:
Goal 1: Teachers will regularly employ lessons that allow students to be actively engaged in using technology as a tool for the acquisition of 21st Century skills
Teachers’ level of comfort/training
Technology availability and functionality
Teachers will give students the
opportunity to develop fluency in
creativity, collaboration,
problem solving, processing
information, and interpreting media skills while involved
in STEM lessons using technology
Science and math teachersTechnology Education teachers
Science Research teacherAssessments and Rubrics
Students
Page 22

Career and Technical Education (CTE) Goal(s)
Anticipated Barrier
Strategy Person/Process/Monitoring
Based on the analysis of school data, identify and define areas in need of improvement:
Goal 1:
Goal 2:
Additional Goal(s) Anticipated Barrier
Strategy Person/Process/Monitoring
Based on the analysis of school data, identify and define areas in need of improvement:
Goal 1:
Goal 2:
For the following areas, please write a brief narrative that includes the data for the year 2011-12 and a description of changes you intend to incorporate to improve the data for the year 2012-13.
MULTI-TIERED SYSTEM OF SUPPORTS (MTSS)/RtI (Identify the MTSS leadership team and it role in development and implementation of the SIP along with data sources, data management and how staff is trained in MTSS)
There are three Tiers in the RtI process. Some students will make rapid progress and only need Tier 1. Other students may need Tier 2 or Tier 3 to be successful. Each Tier gives more intensive help to the student. Data regarding student learning will be constantly looked at to see if the student is making progress.
Tier 1 – This is core instruction that all students receive in their regular classroom. Sometimes a different teaching approach or materials are used with some of the students in the class. This helps not only the struggling student but also others in the classroom as well.
Tier 2 - If the student is still struggling, a school team called the Individual Problem Solving Team (IPST) will work with the teacher and the parent to develop more intensive strategies. The IPST may consist of many different people such as a psychologist, speech/language therapist, reading specialist, as well as the teacher. Different, more targeted strategies such as small groups may be put in place to meet the learning needs of the student.
Tier 3 - If the student is not making adequate progress with Tier 2 interventions the IPST will look at providing Tier 3 interventions, which will increase the intensity and individualization of the interventions and supports. Progress charts may show that the child needs more instructional time, for example, or needs to be taught using a different method or different materials. Tier 3 interventions are provided in addition to core (regular) instruction rather than as a replacement. If the student is successful in Tier 3, school staff and the parents decide the best way to maintain success.
Data is collected from a multitude of sources: A3 Vision, FAIR test data, DA testing data, teacher input, parent/teacher conferences.PARENT INVOLVEMENT:
Hoover Middle School maintains strong parental and community support and involvement. Our PTO is a strong supporter of our students and teachers with Classroom Mini-Grants, “Hawk Rock” celebrations, HATS celebrations, teacher luncheons, and providing chaperones and volunteers for various events. Participation in evening events is a struggle for our parents. In an effort to combat this issue, a survey will be conducted to identify interested topics and convenient times for evening parent meetings.
ATTENDANCE: (Include current and expected attendance rates, excessive absences and tardies)
Page 23

Our attendance rate the 2011-12 was 96.37% and our current attendance rate is 96.78% (as of 9/24/12). Our expected attendance rate should not fall below 95%.
SUSPENSION:
Hoover Middle School had a total of 102 suspension days last year with a total student population of 560. For the 2012-13 school year, we currently have 23 suspension day (as of 9/27/12) with a total student population of 566. In an effort to maintain attendance, we have several consequence options prior to utilizing suspensions to include phone calls home, conferences with parents/guidance/dean, teacher timeouts, teacher detentions, dean’s detentions (before school and/or during lunch), and dean timeouts.
DROP-OUT (High Schools only):
POSTSECONDARY READINESS: (How does the school incorporate students’ academic and career planning, as well as promote student course selections, so that students’ course of study is personally meaningful? Describe strategies for improving student readiness for the public postsecondary level based on annual analysis of the High School Feedback Report.)
Hoover Middle School assists students with academic and career planning through IPS student/parent/counselor meetings, promotion of high school programs, and course recommendations. High School courses to include Spanish I, Spanish II, Computing for College and Careers, Algebra I, Algebra I Honors, and Geometry Honors are available to challenge our middle school students. Courses selections are recommended by teachers and approved by students and parents. Gifted students participate in gifted classes to enhance learning and address their needs. The ability to participate in high school courses at the middle school allow students the ability to be exposed to more advanced curriculum once in high school.
Page 24
Recommended