Acceleration
Physics
Mrs. Coyle
Part I
Average Acceleration Instantaneous Acceleration Deceleration Uniform Accelerated Motion
Acceleration
The rate of change of velocity per unit time.
It is a vector quantity.
Simulation of Constant Velocity Compared to Constant Acceleration http://higheredbcs.wiley.com/legacy/college/h
alliday/0471320005/simulations6e/index.htm?newwindow=true
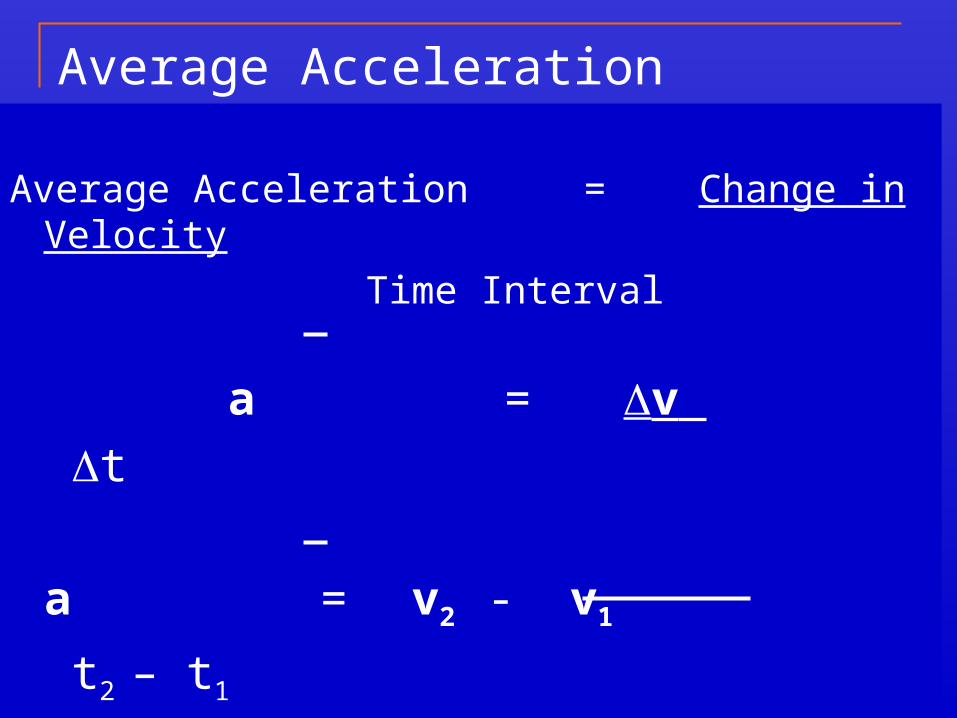
Average Acceleration = Change in Velocity
Time Interval
a = v t
a = v2 - v1
t2 – t1
Average Acceleration
Note:
v = final velocity – initial velocity

Units of Acceleration
Examples of units of acceleration are:
m/s2 or m/s/s
km/h2 or km/h/h
km/h/s

Instantaneous Acceleration
Instantaneous Acceleration is the acceleration at a given instant.
Can you always tell if you are accelerating while observing the speedometer of a car?
Questions:
1. If you are riding on a merry-go-round at a constant speed of 2m/s are you accelerating?
2. When you are riding in a car at a constant speed of 5mph turning right, are you accelerating?
Signs of Acceleration
Acceleration is + when v > 0
Acceleration is - when v < 0
Deceleration
Deceleration is acceleration that causes the velocity’s magnitude to be reduced.
Is it necessary for deceleration to be negative?
Uniform Accelerated Motion
Motion with constant acceleration Straight line Same direction
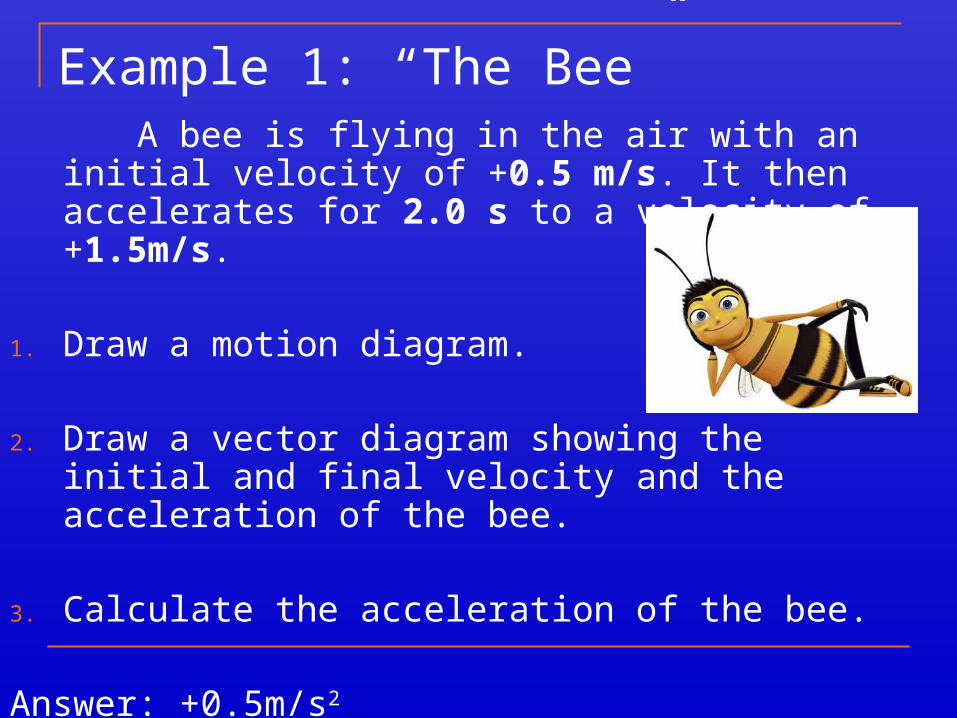
Example 1: “The Bee” A bee is flying in the air with an initial velocity of
+0.5 m/s. It then accelerates for 2.0 s to a velocity of +1.5m/s.
1. Draw a motion diagram.
2. Draw a vector diagram showing the initial and final velocity and the acceleration of the bee.
3. Calculate the acceleration of the bee.
Answer: +0.5m/s2

Example 2
The bee decides to slow down from +1.75m/s to +0.75m/s in 2s.
1. Draw the motion diagram.
2. Draw the vector diagram.
3. What was the acceleration of the bee?
Answer: -0.5m/s2

Solving for vf :
vf= vi+ a Δt
vf= vi+ a t
Example 3: Susan slides on the icy sidewalk with an initial
velocity of 2m/s. She slows down for 3s at 0.5m/s2.
Draw the vector diagram. What is her final velocity?
Answer: 0.5m/s

Part II Graphs of Accelerated Motion Position-Time Velocity-Time Acceleration-Time
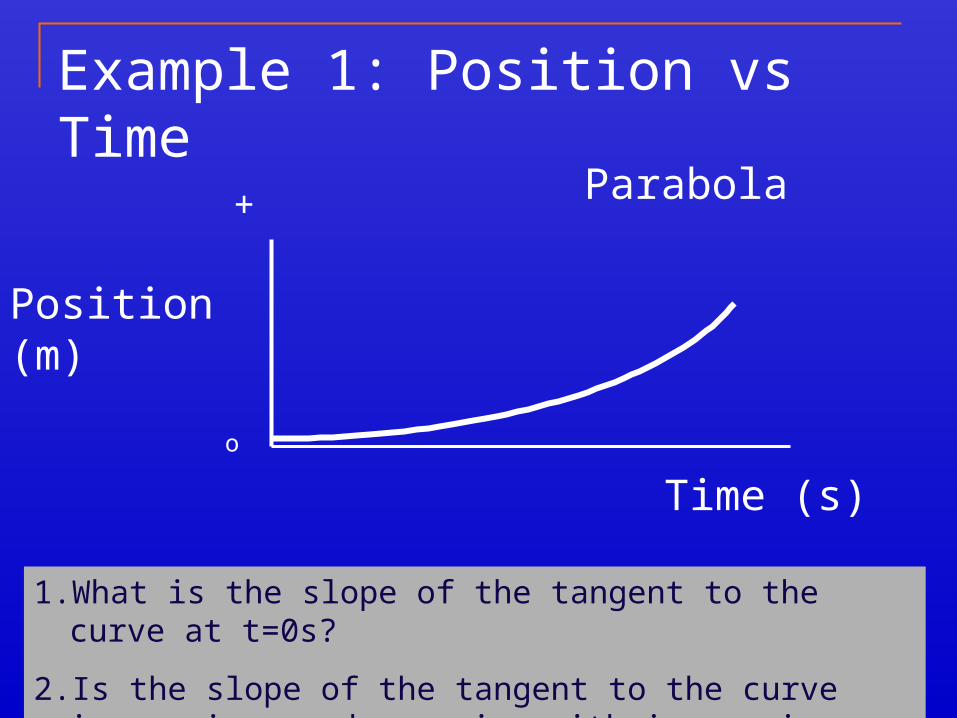
Example 1: Position vs Time
Time (s)o
Position (m)
Parabola
1. What is the slope of the tangent to the curve at t=0s?
2. Is the slope of the tangent to the curve increasing or decreasing with increasing time?
+
Note:
The slope of the tangent to the curve at a given time of the position-time graph is the instantaneous velocity.
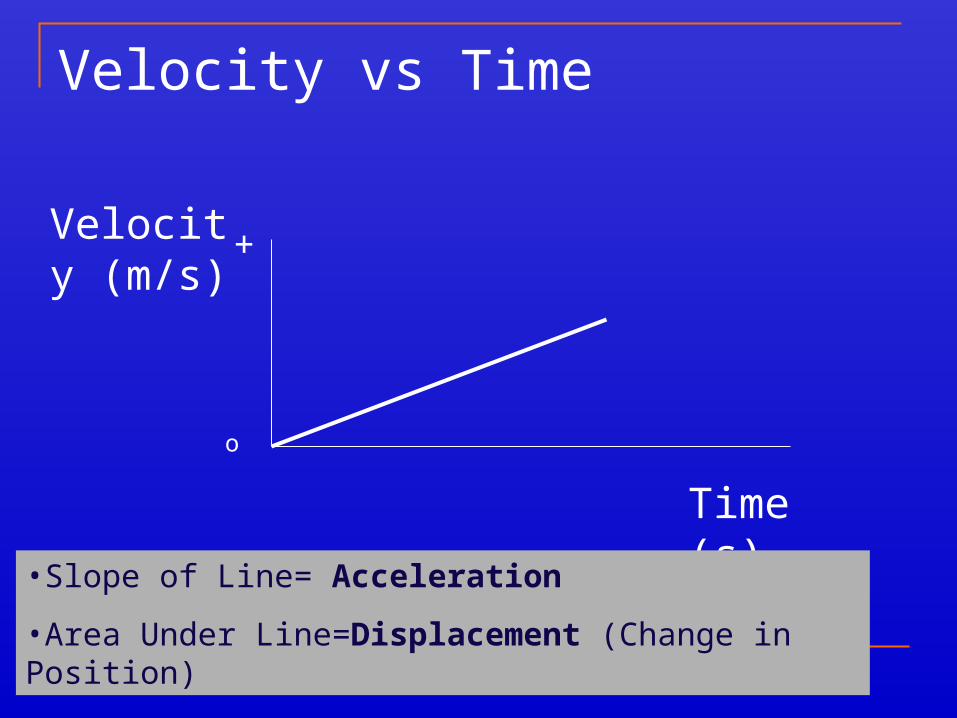
Velocity vs Time
Time (s)
o
Velocity (m/s)
•Slope of Line= Acceleration
•Area Under Line=Displacement (Change in Position)
+
The slope of the line of the velocity- time graph is the instantaneous acceleration.
For constant acceleration that slope also equals the average acceleration.
For motion with varying acceleration, the velocity graph would be a curve. The slope of the tangent to the curve at a given time would represent the instantaneous acceleration.
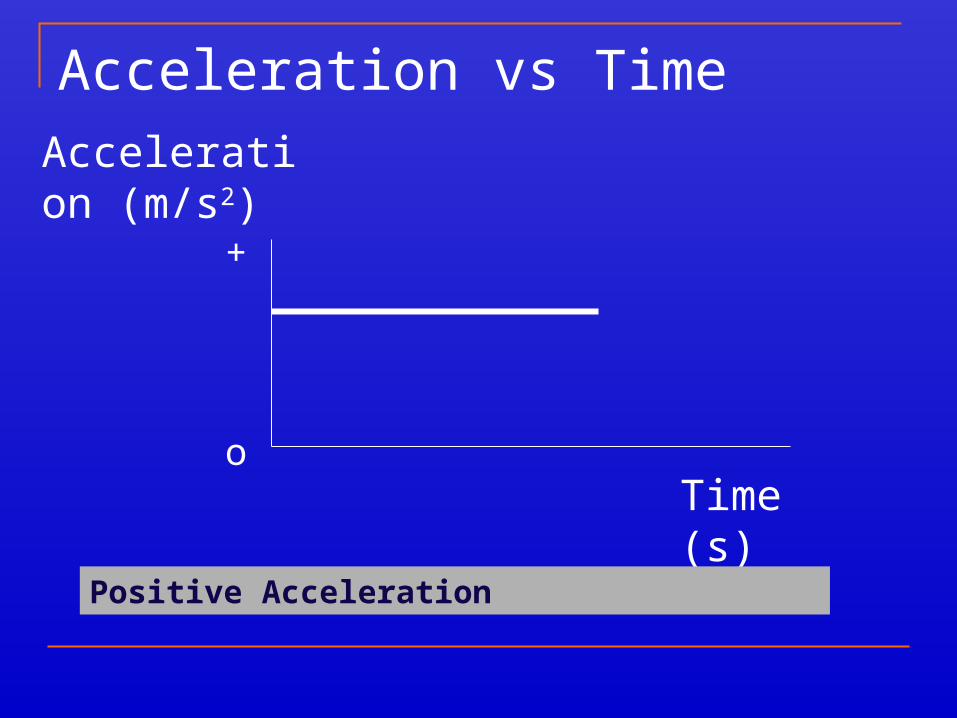
Acceleration vs Time
Time (s)o
Acceleration (m/s2)
Positive Acceleration
+
Give a qualitative example of the previous motion.
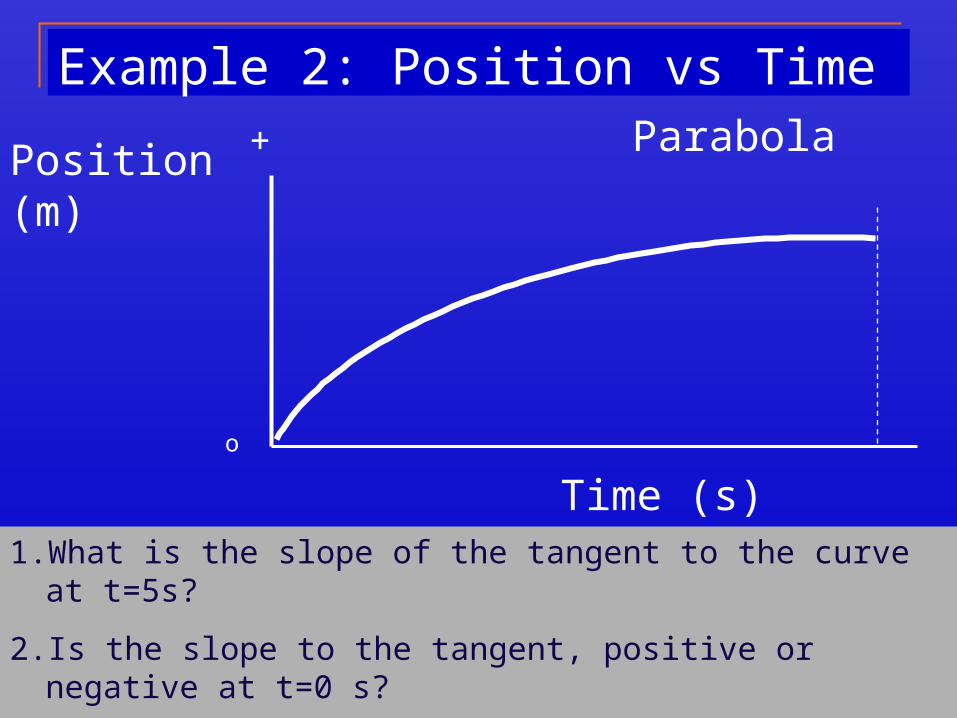
Example 2: Position vs Time
Time (s) 5s
o
Position (m)Parabola
1. What is the slope of the tangent to the curve at t=5s?
2. Is the slope to the tangent, positive or negative at t=0 s?
3. Is the slope of the tangent, increasing or decreasing with increasing time?
+
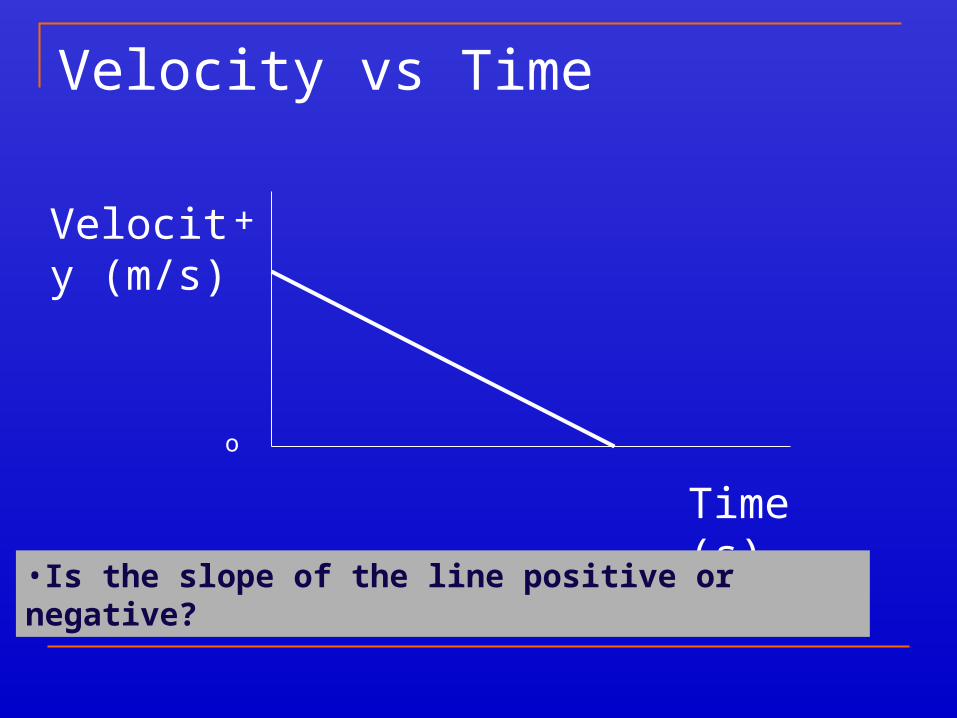
Velocity vs Time
Time (s)
o
Velocity (m/s)
•Is the slope of the line positive or negative?
+
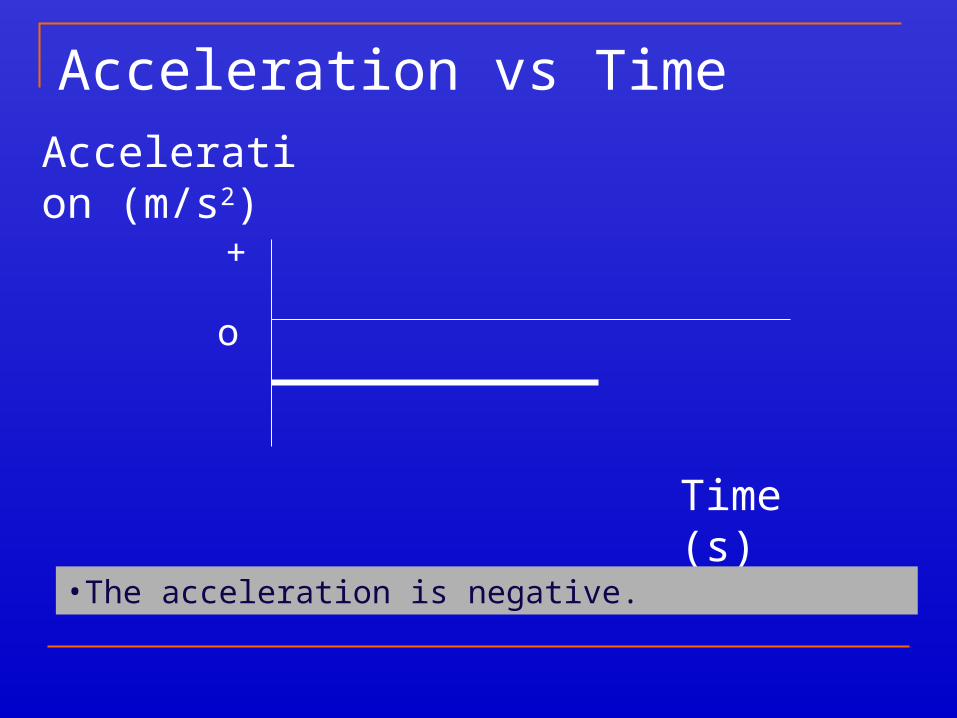
Acceleration vs Time
Time (s)
o
Acceleration (m/s2)
•The acceleration is negative.
+
Give a qualitative example of the previous motion?
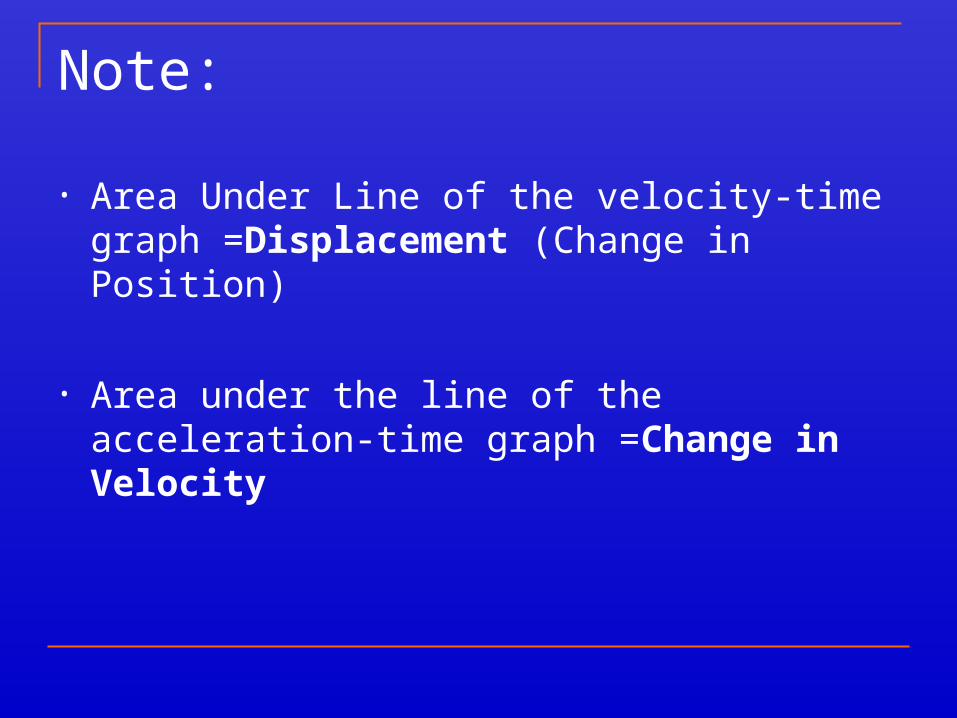
Note:
• Area Under Line of the velocity-time graph =Displacement (Change in Position)
• Area under the line of the acceleration-time graph =Change in Velocity
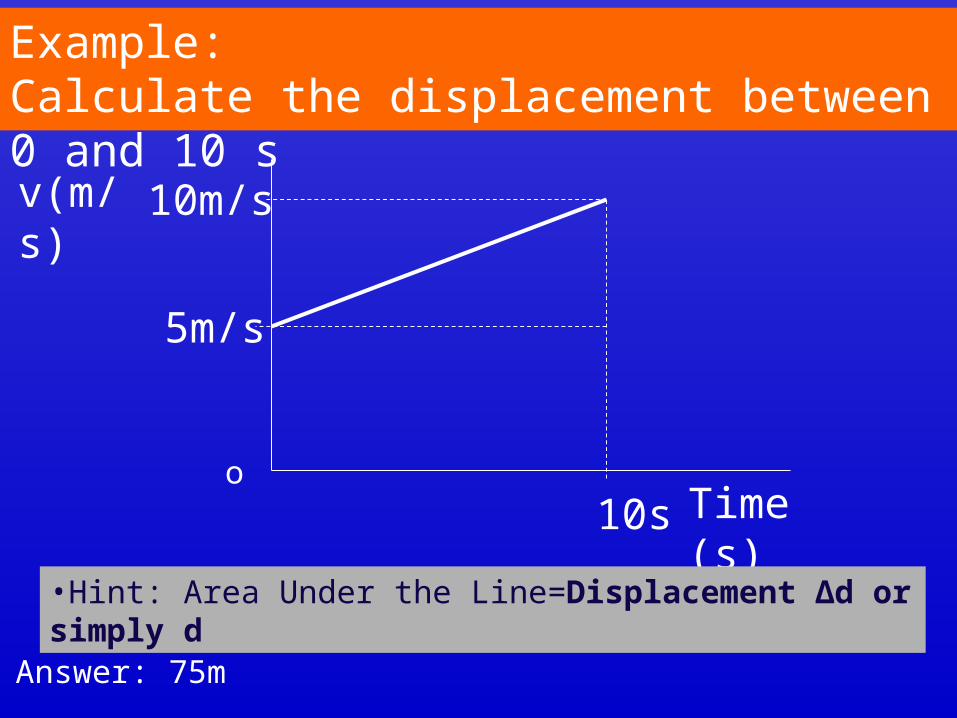
Example: Calculate the displacement between 0 and 10 s
Time (s)o
v(m/s)
•Hint: Area Under the Line=Displacement Δd or simply d
10m/s
5m/s
10s
Answer: 75m
Recommended