Accelerating Microsoft SQL Server 2014 Using Buffer Pool Extension and SanDisk® SSDs December 2014
Western Digital Technologies, Inc.
951 SanDisk Drive, Milpitas, CA 95035
www.SanDisk.com
WHITE PAPER
Accelerating Microsoft SQL Server 2014 Using Buffer Pool Extension and SanDisk SSDs
2
Introduction
Microsoft incorporated a new feature in Microsoft SQL Server 2014 that is known as a Buffer Pool
Extension (BPE). With this feature enabled, the buffer manager is capable of extending Microsoft SQL
Server’s usable memory from physical memory onto solid state disk drives (SSDs) for cost-effective
increased performance. This expands the available memory, allowing customers to scale-up their
databases, as demand for data access grows.
Given that SQL Server 2014 is the latest version of the widely installed SQL Server database, this
change in Microsoft SQL Server technology will impact IT deployments of SQL Server workloads, even
as it impacts the expectations of the business organizations that are leveraging SQL Server database.
This document will outline the usage of this BPE feature, as it describes SanDisk’s testing of its usage
models, alone with describing best practices for BPE’s use with SanDisk SSDs.
Overview
SQL Server 2014 exerts intensive pressure on the file system on which the database, backup, and
indexes are stored. During normal operations, the SQL Server database makes use of the buffer
manager in order to decrease the amount of database file I/O.
By adding the BPE functionality, Microsoft is expanding the buffer pool by moving data onto solid-state
disks. In this way, Microsoft has provided a performance increase by using a combination of DRAM and
NAND flash memory to provide SQL Server instance with a much larger pool of “lukewarm” pages in
non-volatile random access memory that is backed by the SSD. The word “lukewarm” means that the
data is ready to be transferred more quickly by the SSD than it would be from other types of storage,
such as mechanically driven HDDs.
Multiple SSDs may be used in the buffer pool extension (BPE). The new structure provides multi-level
caching hierarchy with level one (L1) as the DRAM and level two (L2) as a file that is stored on the SSD.
The file stored on the SSD can be configured by the administrator to any given size, all the way up to
full capacity. Only “clean pages” are written to the L2 cache, a process that ensures the safety of an
organization’s data in the event of an unexpected server failure.
The buffer pool extension may be enabled or disabled at any time the SQL Server remains operational,
and it can scale up to 32 times the value of max_server_memory. Importantly, Microsoft recommends a
ratio for the buffer pool extension of 1:16 or less.
SQL Server can change its memory requirements dynamically based on available resources. However, it
is recommended that the administrator configure a fixed amount of memory, using all available DRAM
that is left, when the server is fully loaded and idle.
The Buffer Pool Extension file is created to a specified size and subsequently written to in sequential
order as data as passed to the server. This data is also randomly read, as needed, by the SQL Server
database instead of retrieving the data that is stored on the spinning disks. This increases the
performance of the server by up to 30%.
Accelerating Microsoft SQL Server 2014 Using Buffer Pool Extension and SanDisk SSDs
3
Hardware Information
IBM x3650 M4 type 7915
Two Intel® Xeon® CPU E5-2690 v2 3GHz Processors (8 cores)
144GB DDR3 memory
Drive bays: one 146GB IBM-ESXS ST9146853SS JBOD operating system
Two external enclosures containing:
24 300GB SAS HDDs configured in RAID10 for database and log volume
Six 300GB SAS HDDs configured in RAID5 for backup volume
SanDisk Optimus SSD in external enclosure used for Buffer Pool Extension
Technical Setup Notes
To configure the memory options for a SQL Server database, open the SQL Server Management Studio
and do the following:
1. Right-click a server and select Properties.
2. Click the Memory node.
3. Under Server Memory Options, enter the amount that you want for Minimum Server Memory and
Maximum Server Memory.
The following command examples will enable and disabled the buffer pool extension.
To enable:
ALTER SERVER CONFIGURATION SET BUFFER POOL EXTENSION ON (FILENAME = ‘Z:\BPECACHE.
BPE’, SIZE =370 GB)
To disable:
ALTER SERVER CONFIGURATION SET BUFFER POOL EXTENSION OFF
Note that the file name Z:\BPECACHE.BPE is merely an example taken from our local configuration.
This means that you may choose to specify a different drive and file name to suit your needs.
Performance Monitoring
Once you have the buffer pool extension enabled, you may periodically want to check the performance
status in the performance monitor or by using the following commands:
SELECT * FROM sys.dm_os_performance_counters
WHERE object_name LIKE ‘%Buffer Manager%’
ORDER BY counter_name
These commands can be entered into a script and executed from the power shell using the following
command line which will allow you to automate pulling this information as needed to facilitate
performance reports that are useful in further tuning your server. In this example the commands were
entered into a file named BPEstat.sql and executed as follows:
SQLCMD.exe –E –I .\BPEstat.sql >dumpstats.txt
This will create a text file containing the performance counters related to the buffer manager. You may
also choose to display the results on screen, but keep in mind that the fields are long and that they will
Accelerating Microsoft SQL Server 2014 Using Buffer Pool Extension and SanDisk SSDs
4
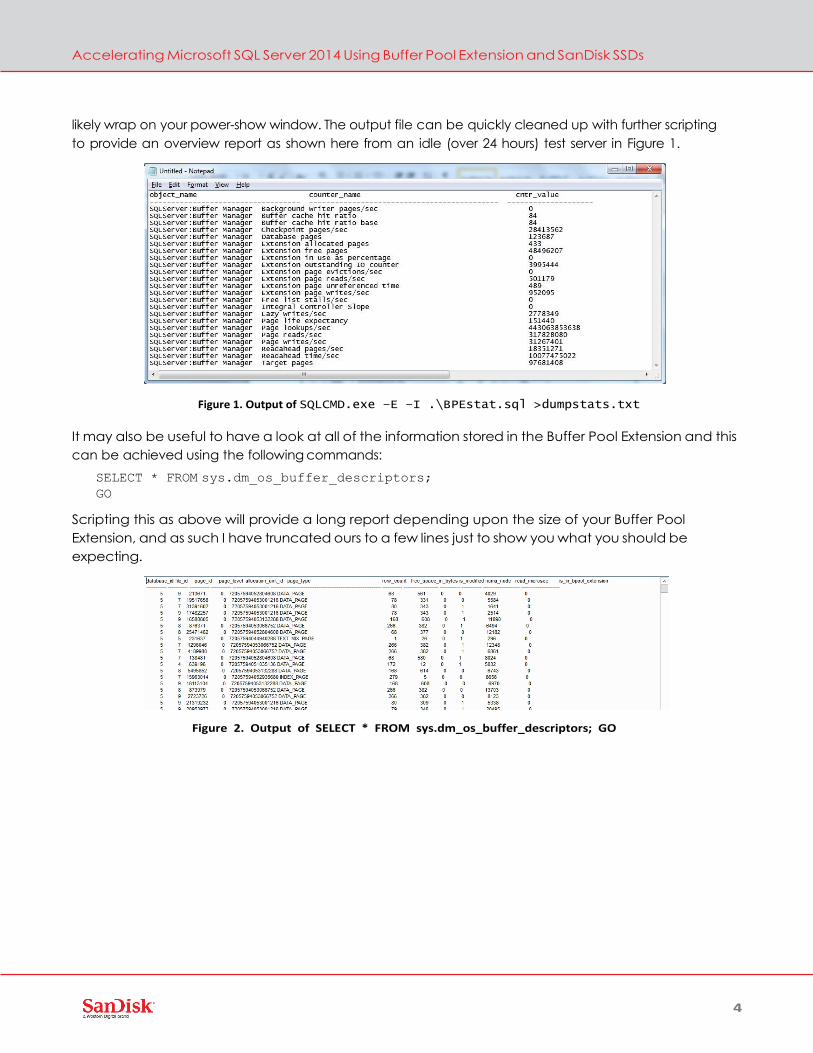
likely wrap on your power-show window. The output file can be quickly cleaned up with further scripting
to provide an overview report as shown here from an idle (over 24 hours) test server in Figure 1.
Figure 1. Output of SQLCMD.exe –E –I .\BPEstat.sql >dumpstats.txt
It may also be useful to have a look at all of the information stored in the Buffer Pool Extension and this
can be achieved using the following commands:
SELECT * FROM sys.dm_os_buffer_descriptors;
GO
Scripting this as above will provide a long report depending upon the size of your Buffer Pool
Extension, and as such I have truncated ours to a few lines just to show you what you should be
expecting.
Figure 2. Output of SELECT * FROM sys.dm_os_buffer_descriptors; GO
Accelerating Microsoft SQL Server 2014 Using Buffer Pool Extension and SanDisk SSDs
5
For a clean and decoded report of what the Buffer Pool Extension contains, use the following script:
select db_name(database_id) databaseName,
file_name(file_id) fileName,
CASE WHEN page_id = 0 THEN ‘File Header Page m_type 15’
WHEN page_id = 1 OR page_id % 8088 = 0 THEN ‘PFS m_type 11’
WHEN page_id = 2 OR page_id % 511232 = 0 THEN ‘GAM m_type 8’
WHEN page_id = 3 OR (page_id - 1) % 511232 = 0 THEN ‘SGAM m_type 9’
WHEN page_id = 6 OR (page_id - 6) % 511232 = 0 THEN ‘DCM m_type 16’
WHEN page_id = 7 OR (page_id - 7) % 511232 = 0 THEN ‘BCM m_type 17’
WHEN page_id = 9 AND file_id = 1 THEN ‘Boot Page m_type 13’
WHEN page_id = 10 AND DB_ID() = 1 THEN
‘config page > sp_configure settings only present in master m_type 14’
ELSE ‘Other’
END page_type,
page_level,
(select type_desc from sys.allocation_units where
sys.allocation_units.allocation_unit_id =
sys.dm_os_buffer_descriptors.allocation_unit_id) as allocation_type_desc,
page_type,
row_count,
free_space_in_bytes,
cast(free_space_in_bytes as numeric)/1024 as free_space_in_mega_bytes,
is_modified,
numa_node,
read_microsec,
is_in_bpool_extension
from sys.dm_os_buffer_descriptors;|
This will provide an extremely detailed and decoded view of the activity involving the Buffer Pool
Extension. As you will see when you execute the script, the output of this view is far too detailed to
include in this whitepaper. That’s why it is best to export this to a text file, or to send it directly to a
wide-format line printer for review.
The information contained in this report will include databaseName, fileName, page_type, page_level,
allocation_type_desc, page_type, row_count, free_space_in_bytes, free_space_in_mega_bytes, is_
modified, numa_node, read_microsec, is_in_bpool_extension. This report will give you a much clearer
picture of your level of activity for the Microsoft SQL Server database. It is recommended that you
periodically execute this view as you gather performance information during the setup of your Buffer
Pool Extension.
Accelerating Microsoft SQL Server 2014 Using Buffer Pool Extension and SanDisk SSDs
6
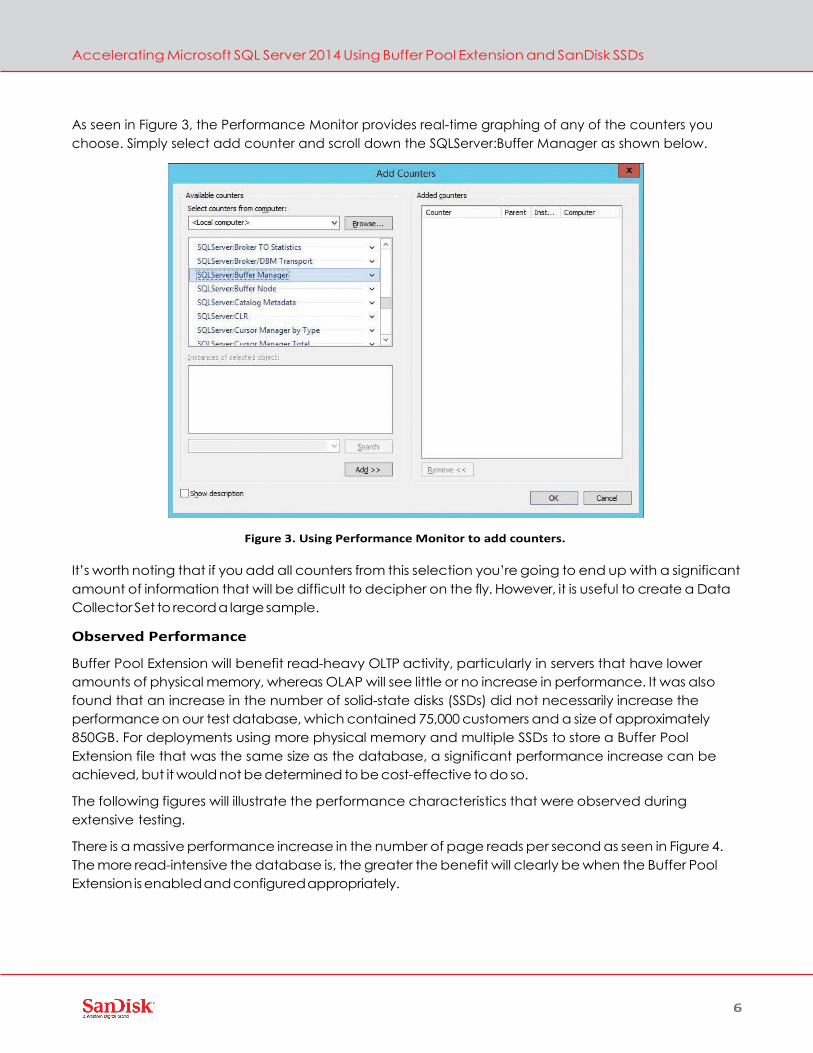
As seen in Figure 3, the Performance Monitor provides real-time graphing of any of the counters you
choose. Simply select add counter and scroll down the SQLServer:Buffer Manager as shown below.
Figure 3. Using Performance Monitor to add counters.
It’s worth noting that if you add all counters from this selection you’re going to end up with a significant
amount of information that will be difficult to decipher on the fly. However, it is useful to create a Data
Collector Set to record a large sample.
Observed Performance
Buffer Pool Extension will benefit read-heavy OLTP activity, particularly in servers that have lower
amounts of physical memory, whereas OLAP will see little or no increase in performance. It was also
found that an increase in the number of solid-state disks (SSDs) did not necessarily increase the
performance on our test database, which contained 75,000 customers and a size of approximately
850GB. For deployments using more physical memory and multiple SSDs to store a Buffer Pool
Extension file that was the same size as the database, a significant performance increase can be
achieved, but it would not be determined to be cost-effective to do so.
The following figures will illustrate the performance characteristics that were observed during
extensive testing.
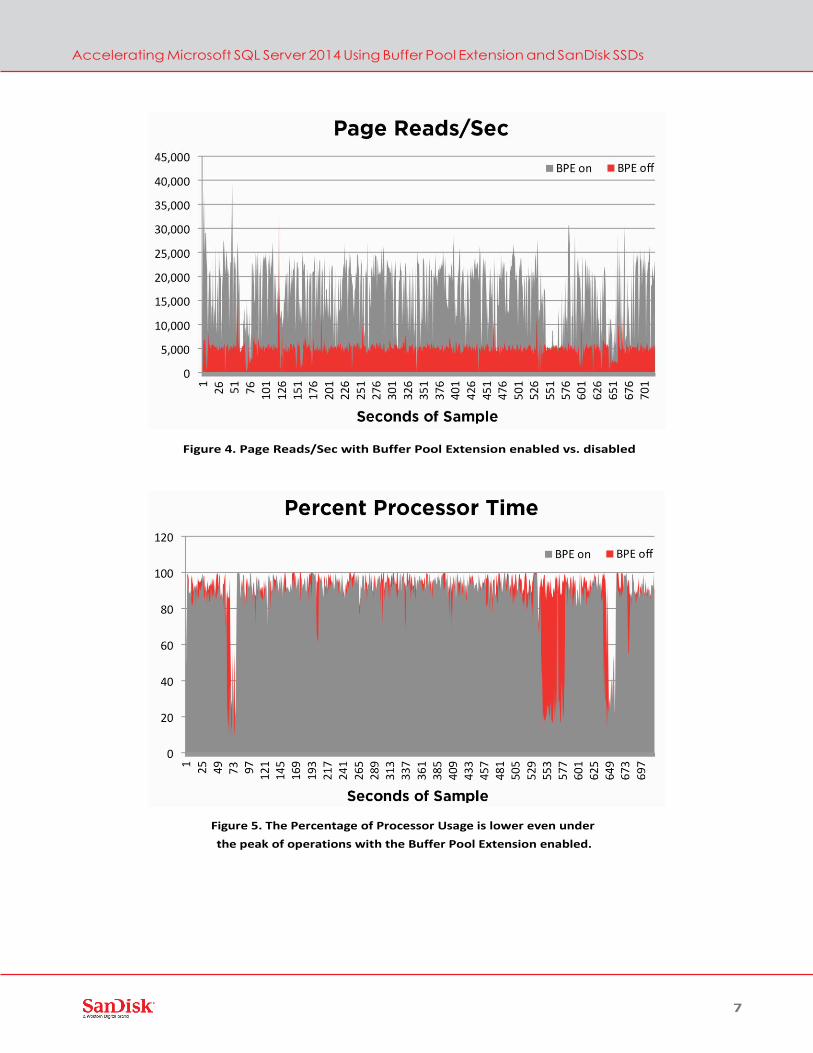
There is a massive performance increase in the number of page reads per second as seen in Figure 4.
The more read-intensive the database is, the greater the benefit will clearly be when the Buffer Pool
Extension is enabled and configured appropriately.
Accelerating Microsoft SQL Server 2014 Using Buffer Pool Extension and SanDisk SSDs
7
Figure 4. Page Reads/Sec with Buffer Pool Extension enabled vs. disabled
Figure 5. The Percentage of Processor Usage is lower even under
the peak of operations with the Buffer Pool Extension enabled.
Accelerating Microsoft SQL Server 2014 Using Buffer Pool Extension and SanDisk SSDs
8
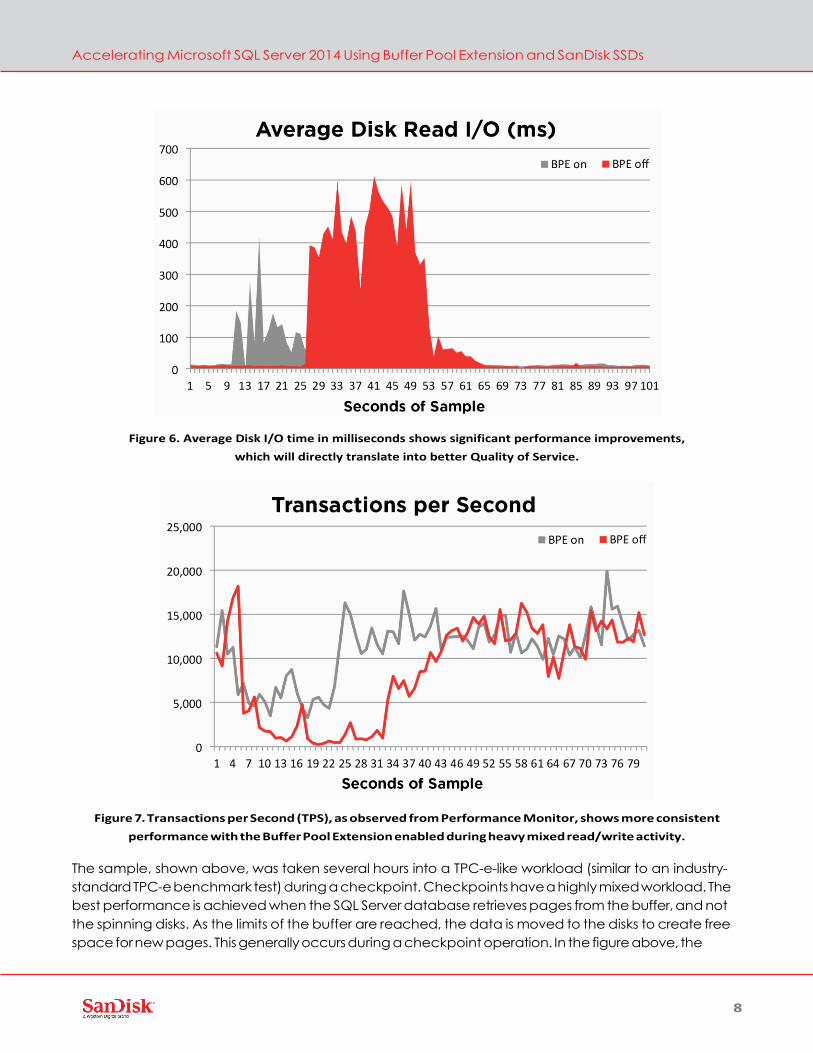
Figure 6. Average Disk I/O time in milliseconds shows significant performance improvements,
which will directly translate into better Quality of Service.
Figure 7. Transactions per Second (TPS), as observed from Performance Monitor, shows more consistent
performance with the Buffer Pool Extension enabled during heavy mixed read/write activity.
The sample, shown above, was taken several hours into a TPC-e-like workload (similar to an industry-
standard TPC-e benchmark test) during a checkpoint. Checkpoints have a highly mixed workload. The
best performance is achieved when the SQL Server database retrieves pages from the buffer, and not
the spinning disks. As the limits of the buffer are reached, the data is moved to the disks to create free
space for new pages. This generally occurs during a checkpoint operation. In the figure above, the
Accelerating Microsoft SQL Server 2014 Using Buffer Pool Extension and SanDisk SSDs
9
transaction count dips dramatically during this activity. However, there is still a significant transaction
account occurring, and a much faster recovery to the normal Quality of Service (QoS) when using the
Buffer Pool Extension (BPE).
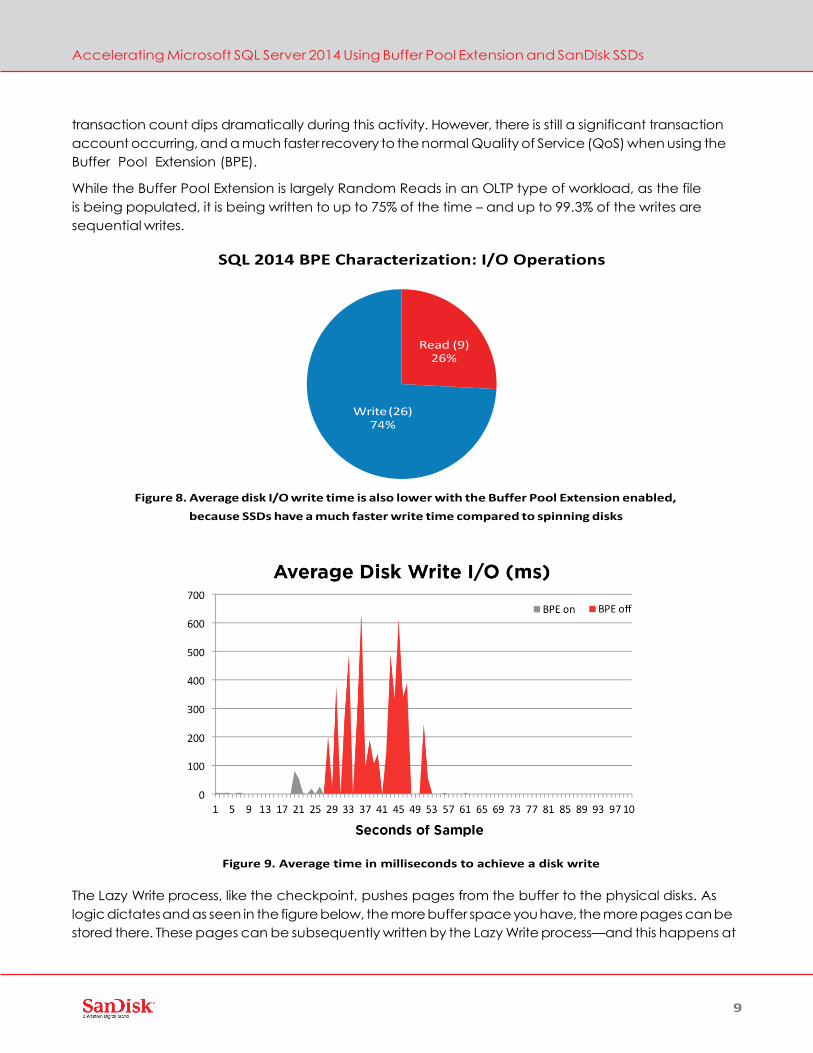
While the Buffer Pool Extension is largely Random Reads in an OLTP type of workload, as the file
is being populated, it is being written to up to 75% of the time – and up to 99.3% of the writes are
sequential writes.
SQL 2014 BPE Characterization: I/O Operations
Figure 8. Average disk I/O write time is also lower with the Buffer Pool Extension enabled,
because SSDs have a much faster write time compared to spinning disks
Figure 9. Average time in milliseconds to achieve a disk write
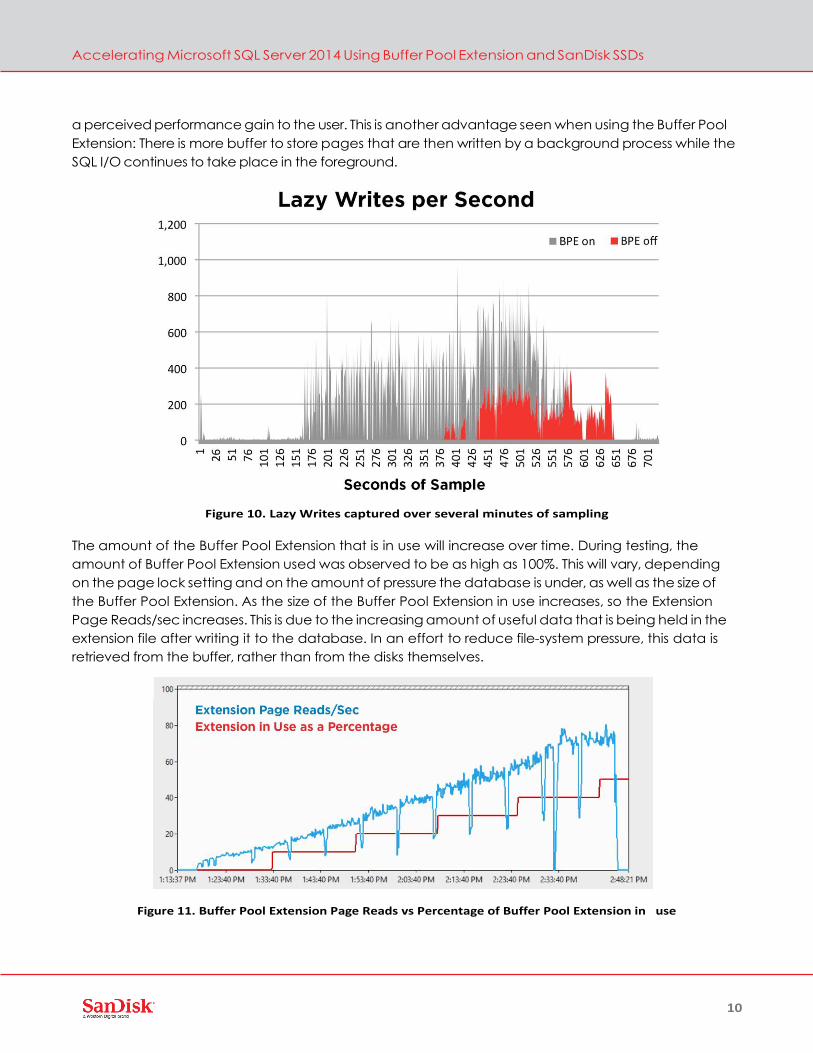
The Lazy Write process, like the checkpoint, pushes pages from the buffer to the physical disks. As
logic dictates and as seen in the figure below, the more buffer space you have, the more pages can be
stored there. These pages can be subsequently written by the Lazy Write process—and this happens at
Read (9) 26%
Write (26) 74%
Accelerating Microsoft SQL Server 2014 Using Buffer Pool Extension and SanDisk SSDs
10
a perceived performance gain to the user. This is another advantage seen when using the Buffer Pool
Extension: There is more buffer to store pages that are then written by a background process while the
SQL I/O continues to take place in the foreground.
Figure 10. Lazy Writes captured over several minutes of sampling
The amount of the Buffer Pool Extension that is in use will increase over time. During testing, the
amount of Buffer Pool Extension used was observed to be as high as 100%. This will vary, depending
on the page lock setting and on the amount of pressure the database is under, as well as the size of
the Buffer Pool Extension. As the size of the Buffer Pool Extension in use increases, so the Extension
Page Reads/sec increases. This is due to the increasing amount of useful data that is being held in the
extension file after writing it to the database. In an effort to reduce file-system pressure, this data is
retrieved from the buffer, rather than from the disks themselves.
Figure 11. Buffer Pool Extension Page Reads vs Percentage of Buffer Pool Extension in use
Accelerating Microsoft SQL Server 2014 Using Buffer Pool Extension and SanDisk SSDs
11
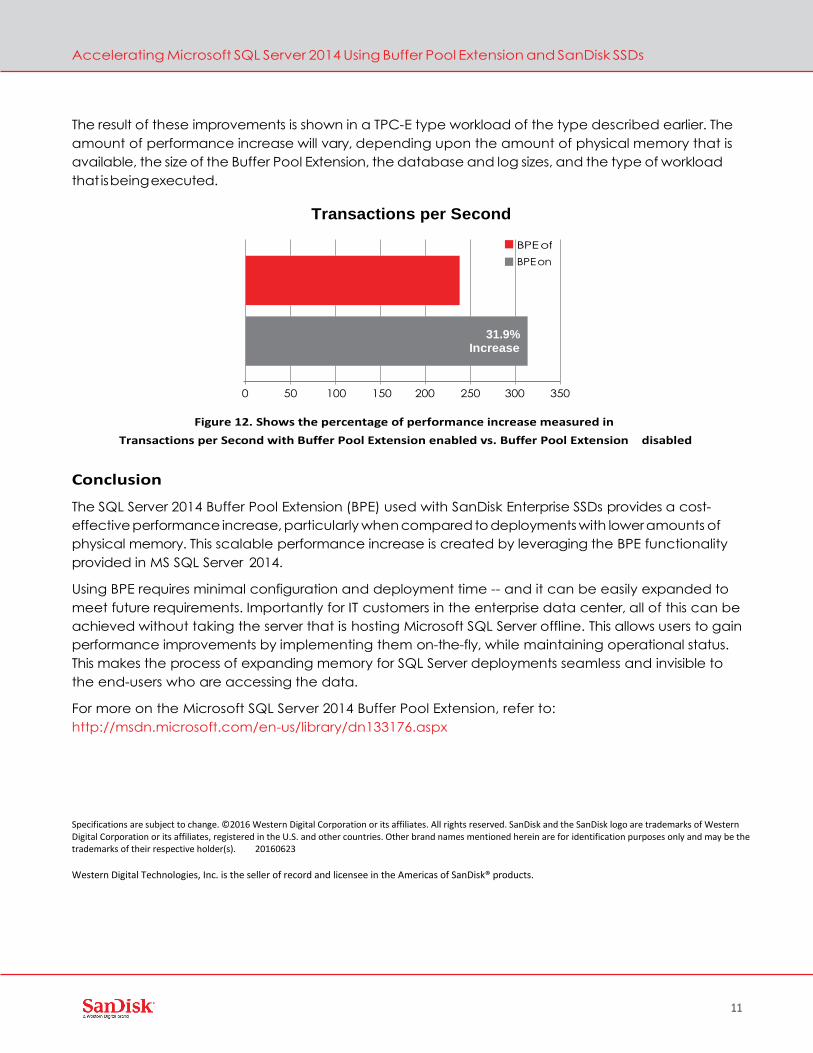
The result of these improvements is shown in a TPC-E type workload of the type described earlier. The
amount of performance increase will vary, depending upon the amount of physical memory that is
available, the size of the Buffer Pool Extension, the database and log sizes, and the type of workload
that is being executed.
Transactions per Second
0 50 100 150 200 250 300 350
Figure 12. Shows the percentage of performance increase measured in
Transactions per Second with Buffer Pool Extension enabled vs. Buffer Pool Extension disabled
Conclusion
The SQL Server 2014 Buffer Pool Extension (BPE) used with SanDisk Enterprise SSDs provides a cost-
effective performance increase, particularly when compared to deployments with lower amounts of
physical memory. This scalable performance increase is created by leveraging the BPE functionality
provided in MS SQL Server 2014.
Using BPE requires minimal configuration and deployment time -- and it can be easily expanded to
meet future requirements. Importantly for IT customers in the enterprise data center, all of this can be
achieved without taking the server that is hosting Microsoft SQL Server offline. This allows users to gain
performance improvements by implementing them on-the-fly, while maintaining operational status.
This makes the process of expanding memory for SQL Server deployments seamless and invisible to
the end-users who are accessing the data.
For more on the Microsoft SQL Server 2014 Buffer Pool Extension, refer to:
http://msdn.microsoft.com/en-us/library/dn133176.aspx
Specifications are subject to change. ©2016 Western Digital Corporation or its affiliates. All rights reserved. SanDisk and the SanDisk logo are trademarks of Western Digital Corporation or its affiliates, registered in the U.S. and other countries. Other brand names mentioned herein are for identification purposes only and may be the trademarks of their respective holder(s). 20160623
Western Digital Technologies, Inc. is the seller of record and licensee in the Americas of SanDisk® products.
BPE of
BPE on
31.9% Increase

Recommended