Academic Libraries: 2012 First Look
NCES 2014-038U . S . D E P A R T M E N T O F E D U C A T I O N
Academic Libraries: 2012 First Look JANUARY 2014 Tai Phan National Center for Education Statistics Laura Hardesty Jamie Hug Governments Division U.S. Census Bureau NCES 2014-038 U.S. DEPARTMENT OF EDUCATION

Institute of Education Sciences John Q. Easton Director National Center for Education Statistics Jack Buckley Commissioner Elementary, Secondary and Libraries Studies Division Jeffrey A. Owings Associate Commissioner The National Center for Education Statistics (NCES) is the primary federal entity for collecting, analyzing, and reporting data related to education in the United States and other nations. It fulfills a congressional mandate to collect, collate, analyze, and report full and complete statistics on the condition of education in the United States; conduct and publish reports and specialized analyses of the meaning and significance of such statistics; assist state and local education agencies in improving their statistical systems; and review and report on education activities in foreign countries. NCES activities are designed to address high-priority education data needs; provide consistent, reliable, complete, and accurate indicators of education status and trends; and report timely, useful, and high quality data to the U.S. Department of Education, Congress, states, other education policymakers, practitioners, data users, and the general public. Unless specifically noted, all information contained herein is in the public domain. We strive to make our products available in a variety of formats and in language that is appropriate to a variety of audiences. You, as our customer, are the best judge of our success in communicating information effectively. If you have any comments or suggestions about this or any other NCES product or report, we would like to hear from you. Please direct your comments to: NCES, IES, Department of Education 1990 K Street NW Washington, DC 20006-5651 January 2014 The NCES Home Page address is http://nces.ed.gov. The NCES Publications and Products address is http://nces.ed.gov/pubsearch. This publication is only available online. To download, view, and print the report as a PDF file, go to the NCES Publications and Products address shown above.
This report was prepared in part under Contract No. ED-IES-11-J-0003 with the U.S. Census Bureau. Mention of trade names, commercial products, or organizations does not imply endorsement by the U.S. Government. Suggested Citation Phan, T., Hardesty, L., and Hug, J. (2014). Academic Libraries: 2012 (NCES 2014-038). U.S. Department of Education, Washington, DC: National Center for Education Statistics. Retrieved [date] from http://nces.ed.gov/pubsearch. Content Contact Tai Phan (202) 502-7431 [email protected]

iii
Acknowledgments This publication and the collection of academic library data have been a collaborative effort. First, we would like to thank the academic librarians who provided the information upon which the report is based and the library representatives from each state/jurisdiction who assisted in this data collection. The American Library Association (ALA) Office for Research and Statistics and the Academic Libraries Survey Technical Working Group were instrumental in designing the survey. Members of the Academic Libraries Survey Technical Working Group during the time of the study were as follows: Terri Fishel, Macalester College Library; Kit Keller, ALA Consultant; Kathy Rosa, ALA Consultant; Kenley Neufeld, Santa Barbara City College; Charles Stewart, City College Libraries; Rita Pellen, Florida Atlantic University; Martha Kyrillidou, Association of Research Libraries; Patricia Profeta, Indian River State College; William Miller, Florida Atlantic University; Peggy Rudd, Texas State Library & Archives Commission; and Mary Jane Petrowski, ALA.

iv
Contents Acknowledgments...................................................................................................................... iii List of Tables .............................................................................................................................. v Introduction ................................................................................................................................. 1 Selected Findings ........................................................................................................................ 2 Tables .......................................................................................................................................... 3 References ................................................................................................................................. 17 Appendix A: Technical Notes ................................................................................................... 19 Appendix B: Glossary ............................................................................................................... 32 Appendix C: Survey Questionnaire and Instructions................................................................ 34

v
List of Tables Table Page 1. Total circulation, interlibrary loan transactions, and documents received from
commercial services at academic libraries, by control, level, size, and Carnegie classification of institution: Fiscal year 2012 ......................................................................4
2. Number of academic libraries, by public service hours per typical week, control, level, size, and Carnegie classification of institution: Fall 2012 .........................................5 3. Gate count, and total information services to individuals and groups, by control, level,
size, and Carnegie classification of institution: Fiscal year 2012 ........................................6 4. Volumes held at end of fiscal year and number of academic libraries, by number of
books, serial backfiles, and other paper materials including government documents, control, level, size, and Carnegie classification of institution: Fiscal year 2012 .................7
5. Number of volumes, and units added during and held at the end of the fiscal year at academic libraries, by control, level, size, and Carnegie classification of institution: Fiscal year 2012 ...................................................................................................................8 6. Number and percentage distribution of different types of full-time equivalent (FTE) staff at academic libraries, by control, level, size, and Carnegie classification of
institution: Fall year 2012 ....................................................................................................9 7. Number of academic libraries and expenditures, by control, level, size, and Carnegie
classification of institution: Fiscal 2012 ............................................................................10 8. Number of academic libraries and expenditures, by selected expenditure categories,
control, level, size, and Carnegie classification of institution: Fiscal year 2012 ...............11 9. Expenditures for different types of information resources at academic libraries, by
control, level, size, and Carnegie classification of institution: Fiscal year 2012 ...............12 10. Operating expenditures for equipment and other selected expenditures at academic
libraries, by control, level, size, and Carnegie classification of institution: Fiscal year 2012 .................................................................................................................13 11. Percentage of academic libraries with selected electronic services, by control, level,
size, and Carnegie classification of institution: Fiscal year 2012 ......................................14

vi
Table Page 12. Percentage of academic libraries reporting information literacy activities, by control,
level, size, and Carnegie classification of institution: Fiscal year 2012 ............................15 13. Percentage of academic libraries reporting virtual reference services, by type of virtual
reference service reported, control, level, size, and Carnegie classification of institution: Fiscal year 2012 ..........................................................................................16
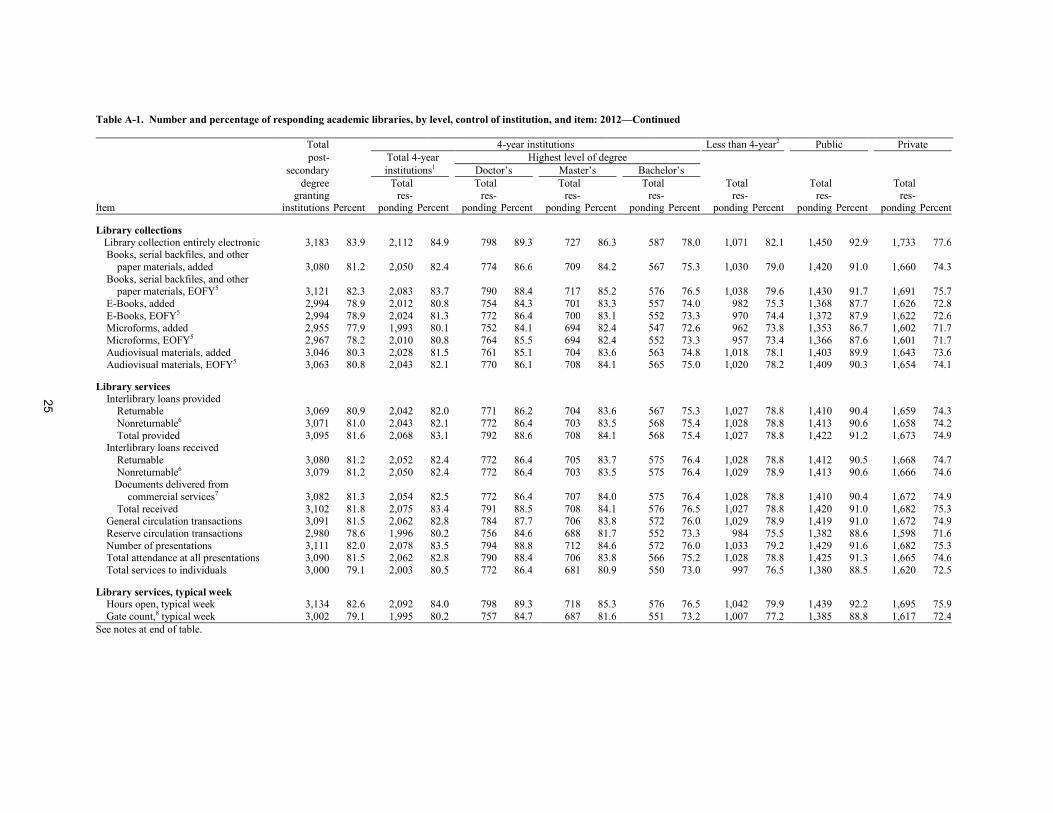
A-1. Number and percentage of responding academic libraries, by level, control of institution, and item: 2012 .................................................................................................24 A-2. Number and percentage of nonresponding academic libraries, by level, control of
institution, and state/jurisdiction: 2012 ..............................................................................28 A-3. Total number of academic libraries, by level, control of institution, and state/jurisdiction: 2012 .......................................................................................................30
1
Introduction This report presents tabulations for the 2012 Academic Libraries Survey (ALS) conducted by the U.S. Department of Education’s National Center for Education Statistics (NCES), within the Institute of Education Sciences. The 2012 ALS population included postsecondary institutions with all of the following: total library expenditures that exceed $10,000; an organized collection of printed or other materials, or a combination thereof; a staff trained to provide and interpret such materials as required to meet the informational, cultural, recreational, or educational needs of the clientele; an established schedule in which services of the staff are available to the clientele; and the physical facilities necessary to support such a collection, staff, and schedule. This definition includes libraries that are part of learning resource centers. Branch and independent libraries are defined as auxiliary library service outlets with quarters separate from the central library that houses the basic collection. The central library administers the branches. In ALS, libraries on branch campuses that have separate NCES identification numbers are reported as separate libraries.
When academic libraries are referred to in this report, they will always be entities that are informational resources within degree-granting postsecondary institutions in the United States, including institutions that are eligible for Title IV aid and branch campuses of Title IV-eligible institutions. NCES has conducted the ALS since 1966 at various intervals. However, beginning with the 1988 survey, the ALS has been conducted on a 2-year cycle. The survey focuses on library services, collections, library staff, expenditures, electronic services, and information literacy.
Because the purpose of this report is to introduce new NCES data through the presentation of tables containing descriptive information, only selected findings are presented. These findings have been chosen to demonstrate the range of information available from the study rather than to discuss all of the observed differences or focus on any particular issue.
Three appendixes follow this report. Appendix A contains technical notes, survey methodology, and methodological tables. Appendix B contains the glossary. Appendix C contains the survey questionnaire and instructions.

2
Selected Findings Services •
•
•
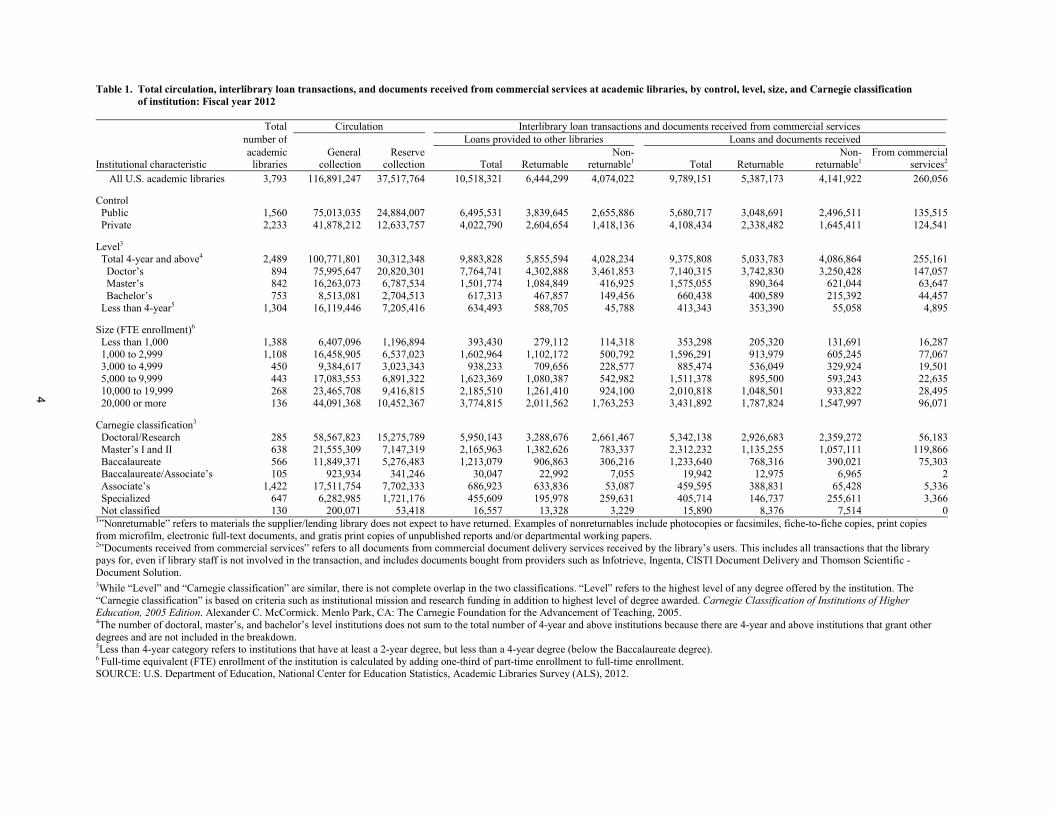
Academic libraries loaned some 10.5 million documents to other libraries in fiscal year 2012 (table 1). Academic libraries also borrowed approximately 9.8 million documents from other libraries and commercial services. The majority of academic libraries, 2,417, were open between 60-99 hours during a typical week in the fall of 2012 (derived from table 2). Another 595 academic libraries were open 100 or more hours per typical week and only 67 were open less than 40 hours per typical week. In fiscal year 2012, academic libraries conducted approximately 28.9 million information services to individuals (table 3).
Collections •
•
At the end of fiscal year 2012; there were 847 academic libraries that held less than 10,000 books, serial backfiles, and other paper materials including government documents and 223 academic libraries that held 1 million or more (derived from table 4). In fiscal year 2012, academic libraries added 52.7 million e-books, resulting in total e-books holdings of 252.6 million units (table 5).
Staff •
•
Academic libraries reported 85,752 full-time equivalent (FTE) staff working in academic libraries during the fall of 2012 (table 6). Academic libraries reported 30,819 other paid staff working during the fall of 2012 who accounted for about 36 percent of the total number paid staff in academic libraries (table 6).
Expenditures •
•
•
•
Just over half of academic libraries, 2,023, had total expenditures of less than $500,000 in fiscal year 2012, while 1,104 academic libraries had total expenditures of $1,000,000 or higher (derived from table 7). During fiscal year 2012, academic libraries spent about $3.4 billion on salaries and wages, representing 49 percent of total library expenditures (table 8). Academic libraries spent a total of approximately $2.8 billion on information resources (table 9). Of that, expenditures for electronic current serial subscriptions totaled about $1.4 billion. During fiscal year 2012, academic libraries spent approximately $123.6 million for bibliographic utilities, networks, and consortia (table 10).
Electronic Services •
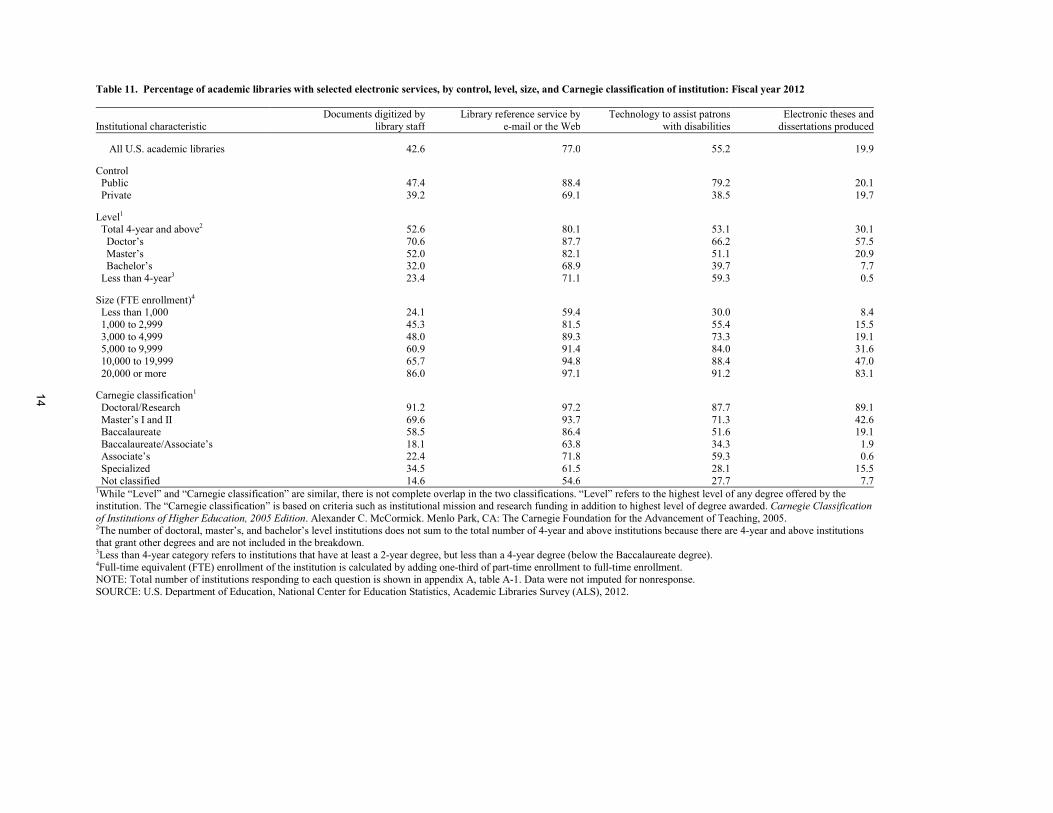
•
In fiscal year 2012, approximately 77 percent of academic libraries reported providing library reference service by e-mail or the Web (table 11). Less than half (43 percent) of academic libraries reported library staff digitizing documents in the fiscal year 2012 (table 11).
Information Literacy •
•
Nearly three-quarters of academic libraries (71 percent) reported their institution has articulated student learning or student success outcomes in fiscal year 2012 (table 12). During fiscal year 2012, about 55 percent of academic libraries reported that they incorporated information literacy into student learning or student success outcomes (table 12).
Virtual Reference •
•
During fiscal year 2012, about three-quarters (75 percent) of academic libraries reported that they supported virtual reference services (table 13). Almost one quarter (24 percent) of academic libraries reported that they utilized short message service or text messaging in fiscal year (table 13).

3
Tables
4
Table 1. Total circulation, interlibrary loan transactions, and documents received from commercial services at academic libraries, by control, level, size, and Carnegie classification Table 1. of institution: Fiscal year 2012
Total
Circulation
Interlibrary loan transactions and documents received from commercial services
number of
Loans provided to other libraries
Loans and documents received
academic
General Reserve
Non-
Non- From commercial
Institutional characteristic libraries collection collection Total Returnable returnable1 Total Returnable returnable1 services2 All U.S. academic libraries 3,793
116,891,247 37,517,764
10,518,321 6,444,299 4,074,022
9,789,151 5,387,173 4,141,922 260,056
Control Public 1,560
75,013,035 24,884,007
6,495,531 3,839,645 2,655,886
5,680,717 3,048,691 2,496,511 135,515
Private 2,233
41,878,212 12,633,757
4,022,790 2,604,654 1,418,136
4,108,434 2,338,482 1,645,411 124,541
Level3 Total 4-year and above4 2,489
100,771,801 30,312,348
9,883,828 5,855,594 4,028,234
9,375,808 5,033,783 4,086,864 255,161
Doctor’s 894
75,995,647 20,820,301
7,764,741 4,302,888 3,461,853
7,140,315 3,742,830 3,250,428 147,057 Master’s 842
16,263,073 6,787,534
1,501,774 1,084,849 416,925
1,575,055 890,364 621,044 63,647
Bachelor’s 753
8,513,081 2,704,513
617,313 467,857 149,456
660,438 400,589 215,392 44,457 Less than 4-year5 1,304
16,119,446 7,205,416
634,493 588,705 45,788
413,343 353,390 55,058 4,895
Size (FTE enrollment)6 Less than 1,000 1,388
6,407,096 1,196,894
393,430 279,112 114,318
353,298 205,320 131,691 16,287
1,000 to 2,999 1,108
16,458,905 6,537,023
1,602,964 1,102,172 500,792
1,596,291 913,979 605,245 77,067 3,000 to 4,999 450
9,384,617 3,023,343
938,233 709,656 228,577
885,474 536,049 329,924 19,501
5,000 to 9,999 443
17,083,553 6,891,322
1,623,369 1,080,387 542,982
1,511,378 895,500 593,243 22,635 10,000 to 19,999 268
23,465,708 9,416,815
2,185,510 1,261,410 924,100
2,010,818 1,048,501 933,822 28,495
20,000 or more 136
44,091,368 10,452,367
3,774,815 2,011,562 1,763,253
3,431,892 1,787,824 1,547,997 96,071
Carnegie classification3 Doctoral/Research 285
58,567,823 15,275,789
5,950,143 3,288,676 2,661,467
5,342,138 2,926,683 2,359,272 56,183
Master’s I and II 638
21,555,309 7,147,319
2,165,963 1,382,626 783,337
2,312,232 1,135,255 1,057,111 119,866 Baccalaureate 566
11,849,371 5,276,483
1,213,079 906,863 306,216
1,233,640 768,316 390,021 75,303
Baccalaureate/Associate’s 105
923,934 341,246
30,047 22,992 7,055
19,942 12,975 6,965 2 Associate’s 1,422
17,511,754 7,702,333
686,923 633,836 53,087
459,595 388,831 65,428 5,336
Specialized 647
6,282,985 1,721,176
455,609 195,978 259,631
405,714 146,737 255,611 3,366 Not classified 130 200,071 53,418 16,557 13,328 3,229 15,890 8,376 7,514 0 1”Nonreturnable” refers to materials the supplier/lending library does not expect to have returned. Examples of nonreturnables include photocopies or facsimiles, fiche-to-fiche copies, print copies from microfilm, electronic full-text documents, and gratis print copies of unpublished reports and/or departmental working papers. 2”Documents received from commercial services” refers to all documents from commercial document delivery services received by the library’s users. This includes all transactions that the library pays for, even if library staff is not involved in the transaction, and includes documents bought from providers such as Infotrieve, Ingenta, CISTI Document Delivery and Thomson Scientific - Document Solution. 3While “Level” and “Carnegie classification” are similar, there is not complete overlap in the two classifications. “Level” refers to the highest level of any degree offered by the institution. The “Carnegie classification” is based on criteria such as institutional mission and research funding in addition to highest level of degree awarded. Carnegie Classification of Institutions of Higher Education, 2005 Edition. Alexander C. McCormick. Menlo Park, CA: The Carnegie Foundation for the Advancement of Teaching, 2005. 4The number of doctoral, master’s, and bachelor’s level institutions does not sum to the total number of 4-year and above institutions because there are 4-year and above institutions that grant other degrees and are not included in the breakdown. 5Less than 4-year category refers to institutions that have at least a 2-year degree, but less than a 4-year degree (below the Baccalaureate degree). 6 Full-time equivalent (FTE) enrollment of the institution is calculated by adding one-third of part-time enrollment to full-time enrollment.
SOURCE: U.S. Department of Education, National Center for Education Statistics, Academic Libraries Survey (ALS), 2012.

5
Table 2. Number of academic libraries, by public service hours per typical week, control, level, size, and Carnegie classification of institution: Fall 2012
Public service hours per typical week
Total number of
Less
Institutional characteristic academic libraries than 20 20 - 39 40 - 59 60 - 79 80 - 99 100 - 119 120 - 167 1681
All U.S. academic libraries 3,793
16 51 714 1,519 898 432 132 31
Control Public 1,560
1 3 314 684 314 160 72 12
Private 2,233
15 48 400 835 584 272 60 19
Level2 Total 4-year and above3 2,489
8 30 230 811 844 418 121 27
Doctor’s 894
3 12 37 149 317 257 103 16 Master’s 842
1 7 70 271 375 98 12 8
Bachelor’s 753
4 11 123 391 152 63 6 3 Less than 4-year4 1,304
8 21 484 708 54 14 11 4
Size (FTE enrollment)5 Less than 1,000 1,388
15 42 443 665 174 37 6 6
1,000 to 2,999 1,108
1 8 171 396 364 146 16 6 3,000 to 4,999 450
0 0 48 199 135 56 9 3
5,000 to 9,999 443
0 1 35 167 129 84 24 3 10,000 to 19,999 268
0 0 17 80 72 61 35 3
20,000 or more 136
0 0 0 12 24 48 42 10
Carnegie classification2 Doctoral/Research 285
0 1 4 9 69 109 82 11
Master’s I and II 638
0 2 7 101 365 133 23 7 Baccalaureate 566
0 5 29 134 265 117 11 5
Baccalaureate/Associate’s 105
0 1 21 66 14 3 0 0 Associate’s 1,422
5 24 480 810 74 12 11 6
Specialized 647
7 18 124 330 106 57 4 1 Not classified 130 4 0 49 69 5 1 1 1 1These libraries are open 24 hours a day, 7 days a week.
2While “Level” and “Carnegie classification” are similar, there is not complete overlap in the two classifications. “Level” refers to the highest level of any degree offered by the institution. The “Carnegie classification” is based on criteria such as institutional mission and research funding in addition to highest level of degree awarded. Carnegie Classification of Institutions of Higher Education, 2005 Edition. Alexander C. McCormick. Menlo Park, CA: The Carnegie Foundation for the Advancement of Teaching, 2005. 3The number of doctoral, master’s, and bachelor’s level institutions does not sum to the total number of 4-year and above institutions because there are 4-year and above institutions that grant other degrees and are not included in the breakdown. 4Less than 4-year category refers to institutions that have at least a 2-year degree, but less than a 4-year degree (below the Baccalaureate degree). 5 Full-time equivalent (FTE) enrollment of the institution is calculated by adding one-third of part-time enrollment to full-time enrollment.
SOURCE: U.S. Department of Education, National Center for Education Statistics, Academic Libraries Survey (ALS), 2012.

6
Table 3. Gate count, and total information services to individuals and groups, by control, level, size, and Carnegie classification of institution: Fiscal year 2012
Gate count1
Total information
Information services to groups, fiscal year 2012
Total number of
during typical week
services to individuals2
Total number of Total number
Institutional characteristic academic libraries in fall 2012 fiscal year 2012 presentations served
All U.S. academic libraries 3,793
22,404,805
28,856,409
536,065 10,109,738
Control Public 1,560
14,918,140
19,241,454
339,036 6,876,905
Private 2,233
7,486,665
9,614,955
197,029 3,232,833
Level3 Total 4-year and above4 2,489
17,625,517
20,110,908
386,737 7,204,883
Doctor’s 894
11,885,312
13,173,475
249,989 4,795,308 Master’s 842
3,780,181
3,949,028
79,727 1,408,543
Bachelor’s 753
1,960,024
2,988,405
57,021 1,001,032 Less than 4-year5 1,304
4,779,288
8,745,501
149,328 2,904,855
Size (FTE enrollment)6 Less than 1,000 1,388
1,143,329
2,745,786
46,730 710,361
1,000 to 2,999 1,108
3,594,086
4,668,462
93,006 1,617,005 3,000 to 4,999 450
2,491,337
3,030,440
59,718 1,084,992
5,000 to 9,999 443
4,299,851
5,200,547
103,448 2,059,402 10,000 to 19,999 268
4,886,870
6,612,252
113,140 2,117,353
20,000 or more 136
5,989,332
6,598,922
120,023 2,520,625
Carnegie classification3 Doctoral/Research 285
8,129,705
9,046,851
167,501 3,237,696
Master’s I and II 638
5,257,636
5,447,722
109,450 2,102,613 Baccalaureate 566
2,390,936
1,917,550
46,251 761,491
Baccalaureate/Associate’s 105
229,823
524,810
10,625 174,248 Associate’s 1,422
5,360,817
9,896,985
166,776 3,242,149
Specialized 647
969,593
1,860,133
30,458 512,673 Not classified 130
66,295
162,358
5,004 78,868
1”Gate count” is the number of persons who physically enter library facilities over the course of a typical week. 2”Information services to individuals” is the number of information contacts that involve the knowledge, use, recommendation, interpretation, or instruction in the use of one or more information sources by a member of the library staff. 3While “Level” and “Carnegie classification” are similar, there is not complete overlap in the two classifications. “Level” refers to the highest level of any degree offered by the institution. The “Carnegie classification” is based on criteria such as institutional mission and research funding in addition to highest level of degree awarded. Carnegie Classification of Institutions of Higher Education, 2005 Edition. Alexander C. McCormick. Menlo Park, CA: The Carnegie Foundation for the Advancement of Teaching, 2005. 4The number of doctoral, master’s, and bachelor’s level institutions does not sum to the total number of 4-year and above institutions because there are 4-year and above institutions that grant other degrees and are not included in the breakdown. 5Less than 4-year category refers to institutions that have at least a 2-year degree, but less than a 4-year degree (below the Baccalaureate degree). 6Full-time equivalent (FTE) enrollment of the institution is calculated by adding one-third of part-time enrollment to full-time enrollment. SOURCE: U.S. Department of Education, National Center for Education Statistics, Academic Libraries Survey (ALS), 2012.

7
Table 4. Volumes held at end of fiscal year and number of academic libraries, by number of books, serial backfiles, and other paper materials including government documents, Table 4. control, level, size, and Carnegie classification of institutions: Fiscal year 2012
Number of academic libraries
Volumes
Number of books, serial backfiles, and other paper materials including government documents
held at end
Less than 5,000 to 10,000 to 20,000 to 30,000 to 50,000 to 100,000 to 250,000 to 500,000 to 1,000,000
Institutional characteristic of fiscal year Total 5,000 9,999 19,999 29,999 49,999 99,999 249,999 499,999 999,999 or more
All U.S. academic libraries 1,099,951,212 3,793
645 202 242 219 461 660 675 289 177 223
Control Public 669,520,968 1,560
26 38 104 137 259 372 222 138 106 158
Private 430,430,244 2,233
619 164 138 82 202 288 453 151 71 65
Level1 Total 4-year and above2 1,039,974,231 2,489
329 115 124 82 219 349 590 284 175 222
Doctor’s 836,289,423 894
29 16 31 15 56 87 198 150 103 209 Master’s 142,692,447 842
70 38 43 24 71 148 291 101 46 10
Bachelor’s 60,992,361 753
230 61 50 43 92 114 101 33 26 3 Less than 4-year3 59,976,981 1,304
316 87 118 137 242 311 85 5 2 1
Size (FTE enrollment)4 Less than 1,000 50,141,825 1,388
560 136 116 96 178 158 122 20 2 0
1,000 to 2,999 137,811,945 1,108
65 45 100 85 171 207 305 83 39 8 3,000 to 4,999 70,605,702 450
7 11 20 30 70 122 105 59 22 4
5,000 to 9,999 152,423,714 443
7 3 4 7 32 136 76 96 55 27 10,000 to 19,999 255,009,922 268
4 4 0 1 10 37 59 21 50 82
20,000 or more 433,958,104 136
2 3 2 0 0 0 8 10 9 102
Carnegie classification1 Doctoral/Research 681,988,378 285
6 1 0 2 0 6 17 27 37 189
Master’s I and II 193,027,382 638
13 7 9 6 13 89 232 156 91 22 Baccalaureate 112,055,092 566
21 10 17 14 35 129 219 68 42 11
Baccalaureate/Associate’s 3,513,178 105
37 15 8 6 15 14 9 1 0 0 Associate’s 65,034,086 1,422
366 97 122 138 257 334 98 7 2 1
Specialized 43,146,918 647
106 63 74 50 135 86 98 30 5 0 Not classified 1,186,178 130
96 9 12 3 6 2 2 0 0 0
1While “Level” and “Carnegie classification” are similar, there is not complete overlap in the two classifications. “Level” refers to the highest level of any degree offered by the institution. The “Carnegie classification” is based on criteria such as institutional mission and research funding in addition to highest level of degree awarded. Carnegie Classification of Institutions of Higher Education, 2005 Edition. Alexander C. McCormick. Menlo Park, CA: The Carnegie Foundation for the Advancement of Teaching, 2005. 2The number of doctoral, master’s, and bachelor’s level institutions does not sum to the total number of 4-year and above institutions because there are 4-year and above institutions that grant other degrees and are not included in the breakdown. 3Less than 4-year category refers to institutions that have at least a 2-year degree, but less than a 4-year degree (below the Baccalaureate degree). 4Full-time equivalent (FTE) enrollment of the institution is calculated by adding one-third of part-time enrollment to full-time enrollment.
SOURCE: U.S. Department of Education, National Center for Education Statistics, Academic Libraries Survey (ALS), 2012.

8
Table 5. Number of volumes, and units added during and held at the end of the fiscal year at academic libraries, by control, level, size, and Carnegie classification of institution: Table 5. Fiscal year 2012
Number of volumes and units added during the fiscal year Number of volumes and units held at the end of the fiscal year
Total Books, serial backfiles,
Books, serial backfiles,
number of and other paper
Audiovisual
and other paper
Audiovisual
academic materials, including
Microform materials
materials, including
Microform materials
Institutional characteristic libraries government documents E-books units units government documents E-books units units
All U.S. academic libraries 3,793 27,605,440 52,738,755 3,860,991 7,665,867
1,099,951,212 252,599,161 1,044,521,205 122,967,053
Control Public 1,560 17,133,860 27,251,780 2,216,019 6,129,072
669,520,968 136,180,907 705,524,985 90,839,468
Private 2,233 10,471,580 25,486,975 1,644,972 1,536,795
430,430,244 116,418,254 338,996,220 32,127,585
Level1 Total 4-year and above2 2,489 25,053,596 45,958,429 3,807,925 7,305,811
1,039,974,231 224,481,548 1,030,236,709 118,156,623
Doctor’s 894 20,903,400 28,245,813 3,320,334 6,279,272
836,289,423 145,741,234 862,299,239 103,048,238 Master’s 842 2,955,242 10,609,961 348,930 691,181
142,692,447 43,896,039 147,238,607 11,215,516
Bachelor’s 753 1,194,954 7,102,655 138,661 335,358
60,992,361 34,844,275 20,698,863 3,892,869 Less than 4-year3 1,304 2,551,844 6,780,326 53,066 360,056
59,976,981 28,117,613 14,284,496 4,810,430
Size (FTE enrollment)4 Less than 1,000 1,388 1,341,937 4,620,879 162,746 188,178
50,141,825 23,840,081 21,319,882 3,348,534
1,000 to 2,999 1,108 2,891,637 13,729,894 420,904 548,531
137,811,945 54,568,500 88,982,925 8,418,594 3,000 to 4,999 450 1,498,148 6,399,574 316,371 340,520
70,605,702 26,710,942 72,073,843 5,019,306
5,000 to 9,999 443 2,734,086 7,426,156 523,078 442,378
152,423,714 37,008,711 168,848,607 8,281,718 10,000 to 19,999 268 6,470,496 7,894,534 848,668 1,084,953
255,009,922 40,941,719 261,486,111 24,846,847
20,000 or more 136 12,669,136 12,667,718 1,589,224 5,061,307
433,958,104 69,529,208 431,809,837 73,052,054
Carnegie classification1 Doctoral/Research 285 18,358,882 20,514,847 2,547,398 5,827,066
681,988,378 111,152,494 690,823,692 95,689,570
Master’s I and II 638 3,488,105 10,637,106 718,109 698,897
193,027,382 46,631,855 256,204,739 11,532,767 Baccalaureate 566 1,762,358 9,192,918 328,340 423,097
112,055,092 41,456,698 59,334,813 5,834,621
Baccalaureate/Associate’s 105 116,218 939,303 2,299 90,474
3,513,178 3,496,290 844,556 273,452 Associate’s 1,422 2,660,691 8,074,399 56,537 385,555
65,034,086 37,089,995 15,307,811 5,186,250
Specialized 647 1,097,066 2,829,926 208,243 237,274
43,146,918 10,206,638 21,989,393 4,411,599 Not classified 130 122,120 550,256 65 3,504 1,186,178 2,565,191 16,201 38,794 1While “Level” and “Carnegie classification” are similar, there is not complete overlap in the two classifications. “Level” refers to the highest level of any degree offered by the institution. The “Carnegie classification” is based on criteria such as institutional mission and research funding in addition to highest level of degree awarded. Carnegie Classification of Institutions of Higher Education, 2005 Edition. Alexander C. McCormick. Menlo Park, CA: The Carnegie Foundation for the Advancement of Teaching, 2005. 2The number of doctoral, master’s, and bachelor’s level institutions does not sum to the total number of 4-year and above institutions because there are 4-year and above institutions that grant other degrees and are not included in the breakdown. 3Less than 4-year category refers to institutions that have at least a 2-year degree, but less than a 4-year degree (below the Baccalaureate degree). 4 Full-time equivalent (FTE) enrollment of the institution is calculated by adding one-third of part-time enrollment to full-time enrollment.
SOURCE: U.S. Department of Education, National Center for Education Statistics, Academic Libraries Survey (ALS), 2012.

9
Table 6. Number and percentage distribution of different types of full-time equivalent (FTE) staff at academic libraries, by control, level, size, and Carnegie classification Table 7. of institution: Fall 2012
Total
Librarians and other professionals
number of Total
Other
Other Student
academic FTE
Total
Librarians
professional staff
paid staff
assistants
Institutional characteristic libraries staff 1 Percent FTE Percent FTE Percent FTE Percent FTE Percent FTE Percent
All U.S. academic libraries 3,793 85,752 100.0
34,423 40.1
26,606 31.0
7,817 9.1
30,819 35.9
20,509 23.9
Control Public 1,560 51,064 59.5
19,601 22.9
15,124 17.6
4,477 5.2
20,175 23.5
11,288 13.2
Private 2,233 34,687 40.5
14,822 17.3
11,482 13.4
3,339 3.9
10,644 12.4
9,222 10.8
Level2 Total 4-year and above3 2,489 74,241 86.6
29,325 34.2
22,504 26.2
6,821 8.0
26,609 31.0
18,308 21.3
Doctor’s 894 55,386 64.6
21,580 25.2
16,243 18.9
5,337 6.2
21,038 24.5
12,768 14.9 Master’s 842 12,491 14.6
4,995 5.8
4,066 4.7
929 1.1
3,809 4.4
3,688 4.3
Bachelor’s 753 6,364 7.4
2,750 3.2
2,195 2.6
555 0.6
1,762 2.1
1,852 2.2 Less than 4-year4 1,304 11,510 13.4
5,098 5.9
4,102 4.8
996 1.2
4,211 4.9
2,202 2.6
Size (FTE enrollment)5 Less than 1,000 1,388 5,579 6.5
2,782 3.2
2,210 2.6
572 0.7
1,103 1.3
1,694 2.0
1,000 to 2,999 1,108 12,958 15.1
5,459 6.4
4,390 5.1
1,069 1.2
3,887 4.5
3,612 4.2 3,000 to 4,999 450 8,006 9.3
3,365 3.9
2,683 3.1
682 0.8
2,579 3.0
2,063 2.4
5,000 to 9,999 443 14,232 16.6
5,578 6.5
4,432 5.2
1,146 1.3
5,197 6.1
3,457 4.0 10,000 to 19,999 268 18,478 21.5
7,177 8.4
5,558 6.5
1,619 1.9
7,573 8.8
3,729 4.3
20,000 or more 136 26,498 30.9
10,062 11.7
7,333 8.6
2,729 3.2
10,482 12.2
5,955 6.9
Carnegie classification2 Doctoral/Research 285 40,981 47.8
15,654 18.3
11,410 13.3
4,244 4.9
16,224 18.9
9,102 10.6
Master’s I and II 638 17,621 20.5
6,892 8.0
5,669 6.6
1,223 1.4
5,943 6.9
4,786 5.6 Baccalaureate 566 8,052 9.4
3,213 3.7
2,609 3.0
604 0.7
2,274 2.7
2,565 3.0
Baccalaureate/Associate’s 105 803 0.9
397 0.5
349 0.4
48 0.1
169 0.2
237 0.3 Associate’s 1,422 12,869 15.0
5,638 6.6
4,522 5.3
1,116 1.3
4,743 5.5
2,487 2.9
Specialized 647 5,045 5.9
2,399 2.8
1,886 2.2
513 0.6
1,423 1.7
1,223 1.4 Not classified 130 381 0.4 229 0.3 161 0.2 68 0.1 43 0.1 109 0.1 1Full-time equivalent (FTE) staff is calculated by dividing the total number of hours for all part-time positions by the number of hours the library defines as a full-time position.
2While “Level” and “Carnegie classification” are similar, there is not complete overlap in the two classifications. “Level” refers to the highest level of any degree offered by the institution. The “Carnegie classification” is based on criteria such as institutional mission and research funding in addition to highest level of degree awarded. Carnegie Classification of Institutions of Higher Education, 2005 Edition. Alexander C. McCormick. Menlo Park, CA: The Carnegie Foundation for the Advancement of Teaching, 2005. 3The number of doctoral, master’s, and bachelor’s level institutions does not sum to the total number of 4-year and above institutions because there are 4-year and above institutions that grant other degrees and are not included in the breakdown. 4Less than 4-year category refers to institutions that have at least a 2-year degree, but less than a 4-year degree (below the Baccalaureate degree). 5Full-time equivalent (FTE) enrollment of the institution is calculated by adding one-third of part-time enrollment to full-time enrollment.
SOURCE: U.S. Department of Education, National Center for Education Statistics, Academic Libraries Survey (ALS), 2012.

10
Table 7. Number of academic libraries and expenditures, by control, level, size, and Carnegie classification of institution: Fiscal year 2012
Total
Expenditures
number of
Less $20,000 $50,000 $100,000 $200,000 $300,000 $500,000 $1,000,000 $2,000,000
academic Total
than to to to to to to to or
Institutional characteristic libraries expenditures $20,000 $49,999 $99,999 $199,999 $299,999 $499,999 $999,999 $1,999,999 more
All U.S. academic libraries 3,793 $7,008,113,939
15 122 518 546 304 518 666 452 652
Control Public 1,560 4,077,793,189
0 4 29 141 164 237 351 230 404
Private 2,233 2,930,320,750
15 118 489 405 140 281 315 222 248
Level1 Total 4-year and above2 2,489 6,394,887,084
7 66 266 345 143 303 395 343 621
Doctor’s 894 5,215,877,494
1 8 23 49 28 70 104 148 463 Master’s 842 796,598,625
3 14 59 113 60 139 201 144 109
Bachelor’s 753 382,410,965
3 44 184 183 55 94 90 51 49 Less than 4-year3 1,304 613,226,855
8 56 252 201 161 215 271 109 31
Size (FTE enrollment)4 Less than 1,000 1,388 308,933,525
15 118 463 401 131 155 66 26 13
1,000 to 2,999 1,108 854,089,930
0 4 48 132 144 256 299 140 85 3,000 to 4,999 450 527,213,419
0 0 2 8 28 89 147 111 65
5,000 to 9,999 443 1,085,506,153
0 0 2 3 1 16 129 118 174 10,000 to 19,999 268 1,645,740,040
0 0 2 1 0 0 24 56 185
20,000 or more 136 2,586,630,872
0 0 1 1 0 2 1 1 130
Carnegie classification1 Doctoral/Research 285 4,092,329,981
0 0 0 0 0 4 11 17 253
Master’s I and II 638 1,235,782,319
0 1 4 14 13 59 130 185 232 Baccalaureate 566 541,230,776
0 7 18 61 58 123 148 83 68
Baccalaureate/Associate’s 105 44,152,415
0 7 26 28 6 15 14 3 6 Associate’s 1,422 679,100,713
8 66 271 230 170 225 293 120 39
Specialized 647 395,089,322
5 29 122 185 56 87 68 43 52 Not classified 130 20,428,413 2 12 77 28 1 5 2 1 2 1While “Level” and “Carnegie classification” are similar, there is not complete overlap in the two classifications. “Level” refers to the highest level of any degree offered by the institution. The “Carnegie classification” is based on criteria such as institutional mission and research funding in addition to highest level of degree awarded. Carnegie Classification of Institutions of Higher Education, 2005 Edition. Alexander C. McCormick. Menlo Park, CA: The Carnegie Foundation for the Advancement of Teaching, 2005. 2The number of doctoral, master’s, and bachelor’s level institutions does not sum to the total number of 4-year and above institutions because there are 4-year and above institutions that grant other degrees and are not included in the breakdown. 3Less than 4-year category refers to institutions that have at least a 2-year degree, but less than a 4-year degree (below the Baccalaureate degree). 4Full-time equivalent (FTE) enrollment of the institution is calculated by adding one-third of part-time enrollment to full-time enrollment.
SOURCE: U.S. Department of Education, National Center for Education Statistics, Academic Libraries Survey (ALS), 2012.

11
Table 8. Number of academic libraries and expenditures, by selected expenditure categories, control, level, size, and Carnegie classification of institution: Table 9. Fiscal year 2012
Salaries Salaries and wages
Total number of Total and as a percentage All information Operating Institutional characteristic academic libraries expenditures wages of total expenditures resources1 expenditures2
All U.S. academic libraries 3,793 $7,008,113,939 $3,443,830,568 49.1 $2,790,039,494 $774,243,874
Control Public 1,560 4,077,793,189 2,060,065,923 50.5 1,572,279,128 445,448,136
Private 2,233 2,930,320,750 1,383,764,645 47.2 1,217,760,366 328,795,738
Level3 Total 4-year and above4 2,489 6,394,887,084 2,995,817,563 46.8 2,671,174,296 727,895,222
Doctor’s 894 5,215,877,494 2,340,345,402 44.9 2,264,298,933 611,233,156 Master’s 842 796,598,625 439,318,223 55.1 278,339,019 78,941,383 Bachelor’s 753 382,410,965 216,153,938 56.5 128,536,344 37,720,683 Less than 4-year5 1,304 613,226,855 448,013,005 73.1 118,865,198 46,348,652
Size (FTE enrollment)6 Less than 1,000 1,388 308,933,525 180,674,585 58.5 98,843,047 29,415,893
1,000 to 2,999 1,108 854,089,930 446,298,364 52.3 322,113,345 85,678,221 3,000 to 4,999 450 527,213,419 293,663,664 55.7 180,311,172 53,238,583 5,000 to 9,999 443 1,085,506,153 567,069,394 52.2 407,478,063 110,958,696 10,000 to 19,999 268 1,645,740,040 784,770,880 47.7 679,939,764 181,029,394 20,000 or more 136 2,586,630,872 1,171,353,681 45.3 1,101,354,103 313,923,087
Carnegie classification3 Doctoral/Research 285 4,092,329,981 1,785,396,202 43.6 1,802,253,385 504,680,391
Master’s I and II 638 1,235,782,319 658,955,673 53.3 460,370,392 116,456,254 Baccalaureate 566 541,230,776 270,329,620 49.9 214,022,806 56,878,350 Baccalaureate/Associate’s 105 44,152,415 26,971,223 61.1 12,627,117 4,554,075 Associate’s 1,422 679,100,713 493,663,048 72.7 133,278,510 52,159,155 Specialized 647 395,089,322 195,567,413 49.5 161,252,355 38,269,554 Not classified 130 20,428,413 12,947,389 63.4 6,234,929 1,246,095 1”All information resources” includes books, serial backfiles, current serial subscriptions, document delivery/interlibrary loan, preservation, and other expenditures for information resources. 2”Operating expenditures’’ include computer hardware and software; bibliographic utilities, networks, and consortia; all other expenditures not already reported, including furniture and equipment; and any related maintenance costs. 3While “Level” and “Carnegie classification” are similar, there is not complete overlap in the two classifications. “Level” refers to the highest level of any degree offered by the institution. The “Carnegie classification” is based on criteria such as institutional mission and research funding in addition to highest level of degree awarded. Carnegie Classification of Institutions of Higher Education, 2005 Edition. Alexander C. McCormick. Menlo Park, CA: The Carnegie Foundation for the Advancement of Teaching, 2005. 4The number of doctoral, master’s, and bachelor’s level institutions does not sum to the total number of 4-year and above institutions because there are 4-year and above institutions that grant other degrees and are not included in the breakdown. 5Less than 4-year category refers to institutions that have at least a 2-year degree, but less than a 4-year degree (below the Baccalaureate degree). 6Full-time equivalent (FTE) enrollment of the institution is calculated by adding one-third of part-time enrollment to full-time enrollment. SOURCE: U.S. Department of Education, National Center for Education Statistics, Academic Libraries Survey (ALS), 2012.

12
Table 9. Expenditures for different types of information resources at academic libraries, by control, level, size, and Carnegie classification of institution: Fiscal year 2012
Total
number of All
Books, serial backfiles, and
Current serial Document
Other expenditures
academic information
other materials
subscriptions delivery/inter-
for information
Institutional characteristic libraries resources1 Total Electronic Audiovisual Total Electronic library loan Preservation resources
All U.S. academic libraries 3,793 $2,790,039,494
$721,442,652 $180,569,584 $37,021,795
$1,923,935,307 $1,436,670,505 $32,490,004 $26,837,585 $85,333,946
Control Public 1,560 1,572,279,128
368,498,927 100,553,123 19,486,179
1,128,281,062 856,061,625 20,069,412 14,382,409 41,047,318
Private 2,233 1,217,760,366
352,943,725 80,016,461 17,535,616
795,654,245 580,608,880 12,420,592 12,455,176 44,286,628
Level2 Total 4-year and above3 2,489 2,671,174,296
662,335,190 171,036,133 30,625,410
1,869,701,723 1,403,322,871 31,705,384 26,409,510 81,022,489
Doctor’s 894 2,264,298,933
546,281,491 147,061,722 20,664,425
1,598,656,772 1,218,208,297 25,237,665 22,224,273 71,898,732 Master’s 842 278,339,019
71,423,486 14,246,366 5,696,662
193,183,400 131,200,887 4,665,611 2,905,791 6,160,731
Bachelor’s 753 128,536,344
44,630,213 9,728,045 4,264,323
77,861,551 53,913,687 1,802,108 1,279,446 2,963,026 Less than 4-year4 1,304 118,865,198
59,107,462 9,533,451 6,396,385
54,233,584 33,347,634 784,620 428,075 4,311,457
Size (FTE enrollment)5 Less than 1,000 1,388 98,843,047
30,344,954 6,126,052 1,970,141
60,621,303 33,164,835 926,840 1,115,032 5,834,918
1,000 to 2,999 1,108 322,113,345
83,240,514 17,576,353 7,025,579
220,817,629 154,416,327 4,404,759 3,085,964 10,564,479 3,000 to 4,999 450 180,311,172
46,685,564 9,259,884 3,884,764
125,065,270 84,123,399 2,093,870 1,598,700 4,867,768
5,000 to 9,999 443 407,478,063
105,721,917 25,960,068 6,251,708
284,842,006 210,959,806 3,935,098 3,193,599 9,785,443 10,000 to 19,999 268 679,939,764
176,727,341 40,933,068 8,257,033
475,347,599 363,644,729 6,582,758 6,171,233 15,110,833
20,000 or more 136 1,101,354,103
278,722,362 80,714,159 9,632,570
757,241,500 590,361,409 14,546,679 11,673,057 39,170,505
Carnegie classification2 Doctoral/Research 285 1,802,253,385
450,995,636 121,307,427 14,733,316
1,257,638,015 981,063,236 20,077,043 18,409,352 55,133,339
Master’s I and II 638 460,370,392
105,485,492 25,543,000 7,939,076
334,392,056 233,855,853 6,686,590 3,606,532 10,199,722 Baccalaureate 566 214,022,806
57,837,348 11,249,406 4,278,689
145,301,394 99,238,651 3,628,620 2,822,650 4,432,794
Baccalaureate/Associate’s 105 12,627,117
6,845,179 1,782,910 443,080
5,085,729 3,359,593 169,572 84,569 442,068 Associate’s 1,422 133,278,510
66,370,185 10,790,865 7,688,784
60,960,175 37,978,992 895,165 478,089 4,574,896
Specialized 647 161,252,355
31,009,085 9,105,920 1,857,840
117,714,858 79,016,480 985,129 1,431,173 10,112,110 Not classified 130 6,234,929 2,899,727 790,056 81,010 2,843,080 2,157,700 47,885 5,220 439,017 1”All information resources” includes books, serial backfiles, current serial subscriptions, document delivery/interlibrary loan, preservation, and other expenditures for information resources. 2While “Level” and “Carnegie classification” are similar, there is not complete overlap in the two classifications. “Level” refers to the highest level of any degree offered by the institution. The “Carnegie classification” is based on criteria such as institutional mission and research funding in addition to highest level of degree awarded. Carnegie Classification of Institutions of Higher Education, 2005 Edition. Alexander C. McCormick. Menlo Park, CA: The Carnegie Foundation for the Advancement of Teaching, 2005. 3The number of doctoral, master’s, and bachelor’s level institutions does not sum to the total number of 4-year and above institutions because there are 4-year and above institutions that grant other degrees and are not included in the breakdown. 4Less than 4-year category refers to institutions that have at least a 2-year degree, but less than a 4-year degree (below the Baccalaureate degree). 5Full-time equivalent (FTE) enrollment of the institution is calculated by adding one-third of part-time enrollment to full-time enrollment.
SOURCE: U.S. Department of Education, National Center for Education Statistics, Academic Libraries Survey (ALS), 2012.

13
Table 10. Operating expenditures for equipment and other selected expenditures at academic libraries, by control, level, size, and Carnegie classification of institution: Fiscal year 2012
Operating expenditures
Total number of
Computer hardware Bibliographic utilities, Other operating
Institutional characteristic academic libraries and software networks, and consortia expenditures1
All U.S. academic libraries 3,793
$143,660,400 $123,649,865 $506,933,609
Control Public 1,560
90,582,709 71,924,859 282,940,568
Private 2,233
53,077,691 51,725,006 223,993,041
Level2 Total 4-year and above3 2,489
133,006,414 111,750,652 483,138,156
Doctor’s 894
108,530,716 80,531,335 422,171,105 Master’s 842
16,700,475 22,361,309 39,879,599
Bachelor’s 753
7,775,223 8,858,008 21,087,452 Less than 4-year4 1,304
10,653,986 11,899,213 23,795,453
Size (FTE enrollment)5 Less than 1,000 1,388
6,844,437 7,502,483 15,068,973
1,000 to 2,999 1,108
18,611,590 21,921,911 45,144,720 3,000 to 4,999 450
10,623,408 14,373,832 28,241,343
5,000 to 9,999 443
21,883,903 22,837,331 66,237,462 10,000 to 19,999 268
27,534,154 26,302,675 127,192,565
20,000 or more 136
58,162,908 30,711,633 225,048,546
Carnegie classification2 Doctoral/Research 285
85,243,859 56,797,369 362,639,163
Master’s I and II 638
25,443,537 29,863,669 61,149,048 Baccalaureate 566
10,406,432 14,873,795 31,598,123
Baccalaureate/Associate’s 105
1,276,004 1,275,978 2,002,093 Associate’s 1,422
11,471,684 12,880,559 27,806,912
Specialized 647
9,594,351 7,750,260 20,924,943 Not classified 130
224,533 208,235 813,327
1”Other operating expenditures’’ are all other expenditures not already reported, and include furniture and equipment except computer hardware, and any related maintenance costs. 2While “Level” and “Carnegie classification” are similar, there is not complete overlap in the two classifications. “Level” refers to the highest level of any degree offered by the institution. The “Carnegie classification” is based on criteria such as institutional mission and research funding in addition to highest level of degree awarded. Carnegie Classification of Institutions of Higher Education, 2005 Edition. Alexander C. McCormick. Menlo Park, CA: The Carnegie Foundation for the Advancement of Teaching, 2005. 3The number of doctoral, master’s, and bachelor’s level institutions does not sum to the total number of 4-year and above institutions because there are 4-year and above institutions that grant other degrees and are not included in the breakdown. 4Less than 4-year category refers to institutions that have at least a 2-year degree, but less than a 4-year degree (below the Baccalaureate degree). 5Full-time equivalent (FTE) enrollment of the institution is calculated by adding one-third of part-time enrollment to full-time enrollment. SOURCE: U.S. Department of Education, National Center for Education Statistics, Academic Libraries Survey (ALS), 2012.
14
Table 11. Percentage of academic libraries with selected electronic services, by control, level, size, and Carnegie classification of institution: Fiscal year 2012 Documents digitized by Library reference service by Technology to assist patrons Electronic theses and Institutional characteristic library staff e-mail or the Web with disabilities dissertations produced
All U.S. academic libraries 42.6 77.0 55.2 19.9
Control Public 47.4 88.4 79.2 20.1
Private 39.2 69.1 38.5 19.7
Level1 Total 4-year and above2 52.6 80.1 53.1 30.1
Doctor’s 70.6 87.7 66.2 57.5 Master’s 52.0 82.1 51.1 20.9 Bachelor’s 32.0 68.9 39.7 7.7 Less than 4-year3 23.4 71.1 59.3 0.5
Size (FTE enrollment)4 Less than 1,000 24.1 59.4 30.0 8.4
1,000 to 2,999 45.3 81.5 55.4 15.5 3,000 to 4,999 48.0 89.3 73.3 19.1 5,000 to 9,999 60.9 91.4 84.0 31.6 10,000 to 19,999 65.7 94.8 88.4 47.0 20,000 or more 86.0 97.1 91.2 83.1
Carnegie classification1 Doctoral/Research 91.2 97.2 87.7 89.1
Master’s I and II 69.6 93.7 71.3 42.6 Baccalaureate 58.5 86.4 51.6 19.1 Baccalaureate/Associate’s 18.1 63.8 34.3 1.9 Associate’s 22.4 71.8 59.3 0.6 Specialized 34.5 61.5 28.1 15.5 Not classified 14.6 54.6 27.7 7.7 1While “Level” and “Carnegie classification” are similar, there is not complete overlap in the two classifications. “Level” refers to the highest level of any degree offered by the institution. The “Carnegie classification” is based on criteria such as institutional mission and research funding in addition to highest level of degree awarded. Carnegie Classification of Institutions of Higher Education, 2005 Edition. Alexander C. McCormick. Menlo Park, CA: The Carnegie Foundation for the Advancement of Teaching, 2005. 2The number of doctoral, master’s, and bachelor’s level institutions does not sum to the total number of 4-year and above institutions because there are 4-year and above institutions that grant other degrees and are not included in the breakdown. 3Less than 4-year category refers to institutions that have at least a 2-year degree, but less than a 4-year degree (below the Baccalaureate degree). 4Full-time equivalent (FTE) enrollment of the institution is calculated by adding one-third of part-time enrollment to full-time enrollment.
NOTE: Total number of institutions responding to each question is shown in appendix A, table A-1. Data were not imputed for nonresponse. SOURCE: U.S. Department of Education, National Center for Education Statistics, Academic Libraries Survey (ALS), 2012.

15
Table 12. Percentage of academic libraries reporting information literacy activities, by control, level, size, and Table 13. Carnegie classification of institution: Fiscal year 2012
Articulated student Incorporated information
learning/student literacy into student learning/
State/jurisdiction success outcomes student success outcomes
All U.S. academic libraries 70.9 54.5
Control Public 81.3 61.5
Private 63.5 49.6
Level1 Total 4-year and above2 70.4 54.2
Doctor’s 72.5 55.6 Master’s 72.1 53.7 Bachelor’s 66.0 53.3 Less than 4-year3 71.8 55.0
Size (FTE enrollment)4 Less than 1,000 58.5 46.6
1,000 to 2,999 74.4 55.1 3,000 to 4,999 83.3 61.8 5,000 to 9,999 80.8 61.9 10,000 to 19,999 80.2 65.3 20,000 or more 76.5 61.0
Carnegie classification1 Doctoral/Research 75.8 57.2
Master’s I and II 82.1 64.7 Baccalaureate 75.4 52.7 Baccalaureate/Associate’s 64.8 52.4 Associate’s 72.2 56.2 Specialized 54.9 41.9 Not classified 55.4 52.3 1While “Level” and “Carnegie classification” are similar, there is not complete overlap in the two classifications. “Level” refers to the highest level of any degree offered by the institution. The “Carnegie classification” is based on criteria such as institutional mission and research funding in addition to highest level of degree awarded. Carnegie Classification of Institutions of Higher Education, 2005 Edition. Alexander C. McCormick. Menlo Park, CA: The Carnegie Foundation for the Advancement of Teaching, 2005. 2The number of doctoral, master’s, and bachelor’s level institutions does not sum to the total number of 4-year and above institutions because there are 4-year and above institutions that grant other degrees and are not included in the breakdown. 3Less than 4-year category refers to institutions that have at least a 2-year degree, but less than a 4-year degree (below the Baccalaureate degree). 4 Full-time equivalent (FTE) enrollment of the institution is calculated by adding one-third of part-time enrollment to full-time enrollment. NOTE: Total number of institutions responding to each question is shown in Appendix A, Table A-1. Data were not imputed for nonresponse. SOURCE: U.S. Department of Education, National Center for Education Statistics, Academic Libraries Survey (ALS), 2012.

16
Table 13. Percentage of academic libraries reporting virtual reference services, by type of virtual reference service reported, control, level, size, and Table 13. Carnegie classification of institution: Fiscal year 2012
Type of virtual reference service reported
Supported virtual
E-mail Chat reference, Chat reference, Short message service
Institutional characteristic reference services reference commercial service instant messaging applications or text messaging
All U.S. academic libraries 74.6
72.9 26.6 32.8 24.3
Control Public 86.5
84.7 35.3 41.3 30.3
Private 66.3
64.7 20.5 27.0 20.1
Level1 Total 4-year and above2 77.7
76.7 28.4 37.8 29.5
Doctor’s 85.8
85.3 36.4 53.5 39.8 Master’s 79.2
78.5 22.2 34.0 22.9
Bachelor’s 66.5
64.3 25.9 23.4 24.7 Less than 4-year3 68.6
65.8 23.1 23.5 14.2
Size (FTE enrollment)4 Less than 1,000 55.5
53.3 15.1 14.0 12.0
1,000 to 2,999 79.5
78.2 20.8 32.9 20.9 3,000 to 4,999 88.2
86.7 34.9 42.4 28.2
5,000 to 9,999 89.4
87.6 42.7 51.2 40.0 10,000 to 19,999 94.0
93.3 50.7 60.1 43.7
20,000 or more 97.1
97.1 63.2 79.4 74.3
Carnegie classification1 Doctoral/Research 97.2
96.8 54.7 76.5 64.2
Master’s I and II 92.5
92.2 39.3 54.7 37.1 Baccalaureate 83.6
82.7 17.8 36.7 25.6
Baccalaureate/Associate’s 63.8
59.0 21.0 22.9 21.9 Associate’s 69.5
66.9 25.6 23.6 16.9
Specialized 56.4
55.2 12.7 13.9 10.8 Not classified 52.3 48.5 24.6 16.2 16.2 1While “Level” and “Carnegie classification” are similar, there is not complete overlap in the two classifications. “Level” refers to the highest level of any degree offered by the institution. The “Carnegie classification” is based on criteria such as institutional mission and research funding in addition to highest level of degree awarded. Carnegie Classification of Institutions of Higher Education, 2005 Edition. Alexander C. McCormick. Menlo Park, CA: The Carnegie Foundation for the Advancement of Teaching, 2005. 2The number of doctoral, master’s, and bachelor’s level institutions does not sum to the total number of 4-year and above institutions because there are 4-year and above institutions that grant other degrees and are not included in the breakdown. 3Less than 4-year category refers to institutions that have at least a 2-year degree, but less than a 4-year degree (below the Baccalaureate degree). 4Full-time equivalent (FTE) enrollment of the institution is calculated by adding one-third of part-time enrollment to full-time enrollment. NOTE: Total number of institutions responding to each question is shown in Appendix A, Table A-1. Data were not imputed for nonresponse. SOURCE: U.S. Department of Education, National Center for Education Statistics, Academic Libraries Survey (ALS), 2012.

17
References
Data Files Phan, T., Hardesty, L., and Hug, J. (2013). Documentation for the Academic Libraries Survey (ALS) Restricted-Use Data File: 2012 (NCES 2014-040). National Center for Education Statistics, Institute of Education Sciences, U.S. Department of Education. Washington, DC. Other Information Sources Carnegie Classification of Institutions of Higher Education, 2005 Edition. Alexander C. McCormick. Menlo Park, CA: The Carnegie Foundation for the Advancement of Teaching, 2005 (http://classifications.carnegiefoundation.org/). Higher Education Directory, 2011 Edition. Falls Church, VA: Higher Education Publications, Inc. (http://www.hepinc.com).

18
This page left intentionally blank.

19
Appendix A: Technical Notes
Technical Notes
History of Academic Libraries Survey data collection From 1988 to 1998, the Academic Libraries Survey (ALS) was a part of the Integrated Postsecondary Education Data System (IPEDS). IPEDS is the U.S. Department of Education’s vehicle for collecting data from all postsecondary institutions in the United States. Topics included within IPEDS are institutional characteristics, fall enrollment, completions, finance, faculty salaries, and fall staff. Beginning in the year 2000, the ALS began collecting data independent from the IPEDS data collection; however, data from the ALS can still be linked to IPEDS data using the institution’s unique unit identification number (UNITID). IPEDS serves as the frame, or universe, of degree-granting postsecondary institutions from which eligible institutions are selected for the current ALS administration. Topics covered and time frames The tables in this publication summarize library services (including electronic services), library staff, library collections, and library expenditures for libraries in degree-granting postsecondary institutions in the 50 states and the District of Columbia. Library staff data are for the fall of 2012. Library circulation, interlibrary loans, operating expenditures, and library collections data are for fiscal year 2012.
Gate count and public services hours were counted during a typical week in the fall of 2012 that reflected a time period that was neither unusually busy nor unusually slow. A typical week did not include a time when key staff were on vacation, or days when unusual events were taking place on the campus or in the library. A typical week for data collection was chosen when the library was open during its regular hours. A typical week was defined as any seven consecutive calendar days. If waiting for a typical week in the fall of 2012 would delay the data collection, data from a typical week from the preceding fiscal year was used. If the library had data for the entire year, that number was divided by the number of weeks that the library was open.
Changes in the survey form and definitions of key terms since 2000 On an as-needed basis, the National Center for Education Statistics (NCES) revises the ALS survey form to reflect changes that have occurred in the services, collections, expenditure accounting, and staffing of academic libraries. For example, in 1996, a number of questions were added on electronic services. In 1998, a substantial number of additional changes were made, especially in the collections and expenditures sections. These changes reflect the extensive changes in library services that occurred with regard to the development of electronic media. In 2010, “reference sources per typical week” was changed to “total information services to individuals,” which is an annual figure. This was a change to the terminology to conform to the existing “information services to groups.” In 2012, several questions were removed from the survey. Current serial titles and electronic reference sources and aggregation services were removed from the library collection section. The information services to individuals questions were removed from the library services section. The five information literacy section questions were replaced with two questions involving student learning/student success outcomes. For more information about the 2012 ALS, refer to http://nces.ed.gov/surveys/libraries/.
4 5

20
Methodology Scope The ALS was fielded in the fall of 2012 as a web-based survey. This is a universe survey that collects data on libraries in degree-granting postsecondary institutions in the United States. The ALS data file and this report cover all academic libraries in degree-granting postsecondary institutions in the United States, including institutions that are Title IV program participants and branch campuses of Title IV program participating institutions.
Coverage and response rates There were a total of 3,793 degree-granting postsecondary institutions in the 50 states and the District of Columbia that had academic libraries in 2012. The response rate among these institutions was approximately 85.3 percent.
Methodological tables A-1 and A-2 present further information on response rates. The first two rows of table A-1 present the number of academic libraries and the number and percentage of respondents by level and control of institution. Row 2 shows unit response rates. The remaining rows show the number and percentage of all libraries responding for each item (i.e., overall response rates). Overall response rates represent the combined effect of unit and item nonresponse. Table A-2 shows the number and percentage of nonrespondents by control and level of institution and by state/jurisdiction (unit response rates).
Data collection procedures The U.S. Census Bureau, Governments Division collected and processed the ALS data for NCES. In 1990, an NCES/IPEDS ALS Improvement Project was begun with the assistance of the National Commission on Libraries and Information Science and the American Library Association’s Office of Research and Statistics. The project identified a librarian in each state/jurisdiction to work with IPEDS state/jurisdiction data coordinators in submitting library data to NCES. For the 1990, 1992, 1994, 1996, and 1998 data collections, many of those library representatives took major responsibility for collecting data in their respective state/jurisdiction. For the 2012 web-based data collection, state/jurisdiction-level library representatives were available to provide prompt responses from librarians and to assist in problem resolution when anomalies were discovered in responses from the academic librarians.

21
Editing and Imputation
Editing
The web-based data collection application features internal edit checks. An edit check tool alerts the respondent to questionable data via interactive “edit check warnings” during the data entry process and through edit check reports that can be viewed on the screen or printed. The edit check program enables the respondent to submit edited data to NCES, which usually requires little or no follow-up for data problems. The edit check tool includes seven types of edits:
•
•
•
•
•
•
•
Summations – Reported totals are compared with the sums of the component data items. If they are not equal, a warning message is generated.
Relational edit checks – The program compares responses entered in one section of the questionnaire with responses entered in another section of the questionnaire for consistency. For example, if a librarian reports that books and bound serials were added during the fiscal year, the program would look for some expenditure to be reported for books and bound serials. If the former is reported without the latter, an error message is generated. Another example is the number of volumes of print materials added during the fiscal year cannot exceed the total number of volumes held at the end of the fiscal year.
Range checks – An error message is generated if responses are above or below expected amounts. For example, if e-books added during the fiscal year were greater than 250,000, an error message is generated. If the reported hours of service are greater than 168 hours per week, an error message is generated.
Current year/prior year comparisons – If the current year data do not fall within the “acceptable range” for the prior reporting period, an error message is generated.
Ratios – The ratio of one item to another must not exceed a limit, such as when the ratio of program attendance to the number of presentations exceeds an upper limit and is not reasonable, an error message will be generated.
Item comparison – If one item should not exceed another, such as books added during the year should not exceed books held at the end of the year, an error message will be generated.
Missing or blank items – If an item is not reported by a respondent, such as missing total expenditures, an error message will be generated.
After responses were received, the Census Bureau reviewed the data and contacted respondents with questionable data to request verification or correction of that data. Data records were aggregated into preliminary draft tables, which were reviewed by NCES and the Census Bureau for data quality issues.

22
Imputation
When surveys are sent to the Census Bureau for processing, responses are not always given for every data item. In order to make complete datasets for constructing estimates of totals, imputation for the missing data items is necessary. This section describes the imputation methods used to fill in for the missing data.
For imputation, institutions were grouped into 27 imputation cells. The imputation cells were determined based on sector and full-time equivalent (FTE) enrollment. The sector categories used are (1) public, 4-year or above; (2) private nonprofit, 4-year or above; (3) private for profit, 4-year or above; (4) public, 2-year; (5) private nonprofit, 2-year; and (6) private for profit, 2-year. The following imputation methodologies were used to fill data for missing values:
•
•
•
•
•
If a value was missing and prior year (FY 2010 or FY 2008) data were available and were not expected to change, then the missing value was filled with the value in the prior year. For example, the number of reported Branches and Independent Libraries (Item 100) is likely to remain constant from year to year, so the prior year value was brought forward, if the current year was not reported.
If a value was missing, prior year data were available, and the value was expected to change from the prior year, then the missing value was filled with the prior year value multiplied by the median growth rate within the imputation cell. For example, the number of Full-time Librarians (Item 200, column 1) is expected to change from year to year, so this imputation method was used.
If a value was missing and prior year data were unavailable or older than FY 2008, then data were imputed using the current year median cell distribution ratio. For example, E-books Added (Item 401, column 1) was imputed using the value of E-books Held (Item 401, column 2) multiplied by the median cell distribution ratio of E-books Added to E-books Held.
If there were missing current year data that prevented the use of a current year median cell distribution ratio, then the data were imputed using the current year cell median. For example, if it was not possible to impute E-books Added using a current year median cell distribution ratio because E-books Held was missing, then E-books Added was imputed with the current year cell median.
After imputation, if a total was missing or known to need adjustment, then the total was readjusted to equal the sum of its detail items.
None of the yes/no variables (Electronic Services (Items 700-703), Information Literacy (Items 800-801), or Virtual Reference items (900-904)) were imputed.

23
Classifications used in the report The tables in this report present the data by control (public, private); level of highest degree offered—a categorization based on the IPEDS classification of the highest degree awarded by the institution (doctor’s, master’s, bachelor’s, and less than 4-year); size of FTE enrollment (less than 1,000; 1,000 to 2,999; 3,000 to 4,999; 5,000 to 9,999; 10,000 to 19,999; 20,000 or more); and the institution’s 2005 Carnegie classification. Reports prior to 2008 used the 2000 Carnegie classification and different FTE enrollment sizes. Caution on the use of data by state/jurisdiction, and by level and control of institution This is a descriptive report that focuses on information from a census of academic libraries in 2012. The presentation of numbers, proportions, and percentages is descriptive only of libraries in the period referenced. While data were imputed for nonresponse, the number of unit nonresponses can vary by state/jurisdiction and affect the reliability of the state/jurisdiction data. See methodological table A-1 for item response rates by level and control of institution. Methodological table A-2 presents the distribution of the set of unit nonrespondents by state/jurisdiction and by level and control of institution. The data user should be especially cautious in using data at a level of detail where the nonresponse rate was 15 percent or greater. Methodological table A-3 gives the number of academic libraries by state/jurisdiction, level, and control of institution.

24
Table A-1. Number and percentage of responding academic libraries, by level, control of institution, and item: 2012
Total
4-year institutions
Less than 4-year2
Public
Private
post-
Total 4-year Highest level of degree
secondary
institutions1
Doctor’s
Master’s
Bachelor’s
degree
Total
Total
Total
Total
Total
Total
Total
granting
res-
res-
res-
res-
res-
res-
res- Item institutions Percent ponding Percent ponding Percent ponding Percent ponding Percent ponding Percent ponding Percent ponding Percent
All institutions 3,793 100.0
2,489 100.0
894 100.0
842 100.0
753 100.0
1,304 100.0
1,560 100.0
2,233 100.0 Responding libraries 3,236 85.3
2,141 86.0
812 90.8
732 86.9
597 79.3
1,095 84.0
1,482 95.0
1,754 78.5
Library staff Number of FTEs3 Librarians 3,172 83.6
2,099 84.3
797 89.1
723 85.9
579 76.9
1,073 82.3
1,474 94.5
1,698 76.0
Other professional staff 3,172 83.6
2,099 84.3
797 89.1
723 85.9
579 76.9
1,073 82.3
1,473 94.4
1,699 76.1 Total librarians and
other professional staff 3,177 83.8
2,103 84.5
801 89.6
723 85.9
579 76.9
1,074 82.4
1,475 94.6
1,702 76.2 All other paid staff 3,174 83.7
2,101 84.4
800 89.5
723 85.9
578 76.8
1,073 82.3
1,474 94.5
1,700 76.1
Student assistants 3,146 82.9
2,081 83.6
792 88.6
716 85.0
573 76.1
1,065 81.7
1,464 93.8
1,682 75.3 Total FTE3staff 3,144 82.9
2,080 83.6
792 88.6
716 85.0
572 76.0
1,064 81.6
1,463 93.8
1,681 75.3
Salaries and Wages Total librarians and other professional staff 3,039 80.1
2,019 81.1
777 86.9
694 82.4
548 72.8
1,020 78.2
1,431 91.7
1,608 72.0
All other paid staff 3,103 81.8
2,056 82.6
788 88.1
706 83.8
562 74.6
1,047 80.3
1,443 92.5
1,660 74.3 Student assistants 2,990 78.8
1,988 79.9
766 85.7
684 81.2
538 71.4
1,002 76.8
1,400 89.7
1,590 71.2
Total salaries and wages 2,939 77.5
1,957 78.6
758 84.8
679 80.6
520 69.1
982 75.3
1,394 89.4
1,545 69.2 Employee fringe benefits 3,163 83.4
2,091 84.0
795 88.9
721 85.6
575 76.4
1,072 82.2
1,472 94.4
1,691 75.7
Library expenditures Total salaries and wages 2,939 77.5
1,957 78.6
758 84.8
679 80.6
520 69.1
982 75.3
1,394 89.4
1,545 69.2
Information resources: Books, serial backfiles, and other materials 3,075 81.1
2,044 82.1
779 87.1
711 84.4
554 73.6
1,031 79.1
1,447 92.8
1,628 72.9
Electronic 2,798 73.8
1,858 74.6
701 78.4
645 76.6
512 68.0
940 72.1
1,341 86.0
1,457 65.2 Audiovisual 2,909 76.7
1,923 77.3
721 80.6
668 79.3
534 70.9
986 75.6
1,371 87.9
1,538 68.9
Current serials 3,076 81.1
2,041 82.0
778 87.0
709 84.2
554 73.6
1,035 79.4
1,445 92.6
1,631 73.0 Electronic serials 2,869 75.6
1,904 76.5
727 81.3
668 79.3
509 67.6
965 74.0
1,364 87.4
1,505 67.4
Other information resources: Document delivery/interlibrary loan 3,073 81.0
2,038 81.9
774 86.6
708 84.1
556 73.8
1,035 79.4
1,439 92.2
1,634 73.2
Preservation 3,070 80.9
2,034 81.7
773 86.5
707 84.0
554 73.6
1,036 79.4
1,437 92.1
1,633 73.1 Other expenditures for
information resources 3,058 80.6
2,027 81.4
773 86.5
705 83.7
549 72.9
1,031 79.1
1,436 92.1
1,622 72.6 Operating expenditures:
Computer hardware and software 3,055 80.5
2,025 81.4
766 85.7
709 84.2
550 73.0
1,030 79.0
1,432 91.8
1,623 72.7 Bibliographic utilities, networks,
and consortia 3,061 80.7
2,029 81.5
773 86.5
707 84.0
549 72.9
1,032 79.1
1,433 91.9
1,628 72.9 All other operating expenditures4 3,053 80.5
2,024 81.3
773 86.5
704 83.6
547 72.6
1,029 78.9
1,436 92.1
1,617 72.4
Total expenditures 2,873 75.7 1,914 76.9 739 82.7 671 79.7 504 66.9 959 73.5 1,372 87.9 1,501 67.2 See notes at end of table.
25
See notes at end of table.
Table A-1. Number and percentage of responding academic libraries, by level, control of institution, and item: 2012—Continued
Total
4-year institutions
Less than 4-year2
Public
Private
post-
Total 4-year Highest level of degree
secondary
institutions1
Doctor’s
Master’s
Bachelor’s
degree
Total
Total
Total
Total
Total
Total
Total
granting
res-
res-
res-
res-
res-
res-
res- Item institutions Percent ponding Percent ponding Percent ponding Percent ponding Percent ponding Percent ponding Percent ponding Percent
Library collections Library collection entirely electronic 3,183 83.9
2,112 84.9
798 89.3
727 86.3
587 78.0
1,071 82.1
1,450 92.9
1,733 77.6
Books, serial backfiles, and other paper materials, added 3,080 81.2
2,050 82.4
774 86.6
709 84.2
567 75.3
1,030 79.0
1,420 91.0
1,660 74.3
Books, serial backfiles, and other paper materials, EOFY5 3,121 82.3
2,083 83.7
790 88.4
717 85.2
576 76.5
1,038 79.6
1,430 91.7
1,691 75.7
E-Books, added 2,994 78.9
2,012 80.8
754 84.3
701 83.3
557 74.0
982 75.3
1,368 87.7
1,626 72.8 E-Books, EOFY5 2,994 78.9
2,024 81.3
772 86.4
700 83.1
552 73.3
970 74.4
1,372 87.9
1,622 72.6
Microforms, added 2,955 77.9
1,993 80.1
752 84.1
694 82.4
547 72.6
962 73.8
1,353 86.7
1,602 71.7 Microforms, EOFY5 2,967 78.2
2,010 80.8
764 85.5
694 82.4
552 73.3
957 73.4
1,366 87.6
1,601 71.7
Audiovisual materials, added 3,046 80.3
2,028 81.5
761 85.1
704 83.6
563 74.8
1,018 78.1
1,403 89.9
1,643 73.6 Audiovisual materials, EOFY5 3,063 80.8
2,043 82.1
770 86.1
708 84.1
565 75.0
1,020 78.2
1,409 90.3
1,654 74.1
Library services Interlibrary loans provided Returnable 3,069 80.9
2,042 82.0
771 86.2
704 83.6
567 75.3
1,027 78.8
1,410 90.4
1,659 74.3
Nonreturnable6 3,071 81.0
2,043 82.1
772 86.4
703 83.5
568 75.4
1,028 78.8
1,413 90.6
1,658 74.2 Total provided 3,095 81.6
2,068 83.1
792 88.6
708 84.1
568 75.4
1,027 78.8
1,422 91.2
1,673 74.9
Interlibrary loans received Returnable 3,080 81.2
2,052 82.4
772 86.4
705 83.7
575 76.4
1,028 78.8
1,412 90.5
1,668 74.7
Nonreturnable6 3,079 81.2
2,050 82.4
772 86.4
703 83.5
575 76.4
1,029 78.9
1,413 90.6
1,666 74.6 Documents delivered from
commercial services7 3,082 81.3
2,054 82.5
772 86.4
707 84.0
575 76.4
1,028 78.8
1,410 90.4
1,672 74.9 Total received 3,102 81.8
2,075 83.4
791 88.5
708 84.1
576 76.5
1,027 78.8
1,420 91.0
1,682 75.3
General circulation transactions 3,091 81.5
2,062 82.8
784 87.7
706 83.8
572 76.0
1,029 78.9
1,419 91.0
1,672 74.9 Reserve circulation transactions 2,980 78.6
1,996 80.2
756 84.6
688 81.7
552 73.3
984 75.5
1,382 88.6
1,598 71.6
Number of presentations 3,111 82.0
2,078 83.5
794 88.8
712 84.6
572 76.0
1,033 79.2
1,429 91.6
1,682 75.3 Total attendance at all presentations 3,090 81.5
2,062 82.8
790 88.4
706 83.8
566 75.2
1,028 78.8
1,425 91.3
1,665 74.6
Total services to individuals 3,000 79.1
2,003 80.5
772 86.4
681 80.9
550 73.0
997 76.5
1,380 88.5
1,620 72.5
Library services, typical week Hours open, typical week 3,134 82.6
2,092 84.0
798 89.3
718 85.3
576 76.5
1,042 79.9
1,439 92.2
1,695 75.9
Gate count,8 typical week 3,002 79.1 1,995 80.2 757 84.7 687 81.6 551 73.2 1,007 77.2 1,385 88.8 1,617 72.4
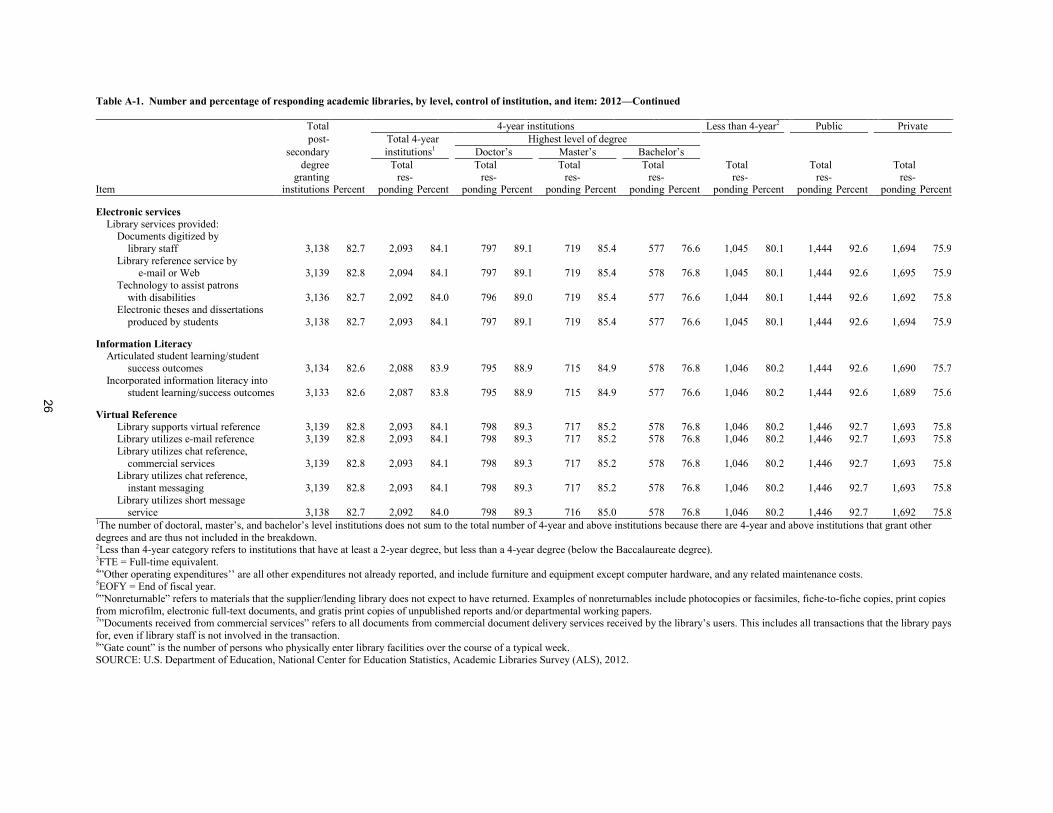
26
Table A-1. Number and percentage of responding academic libraries, by level, control of institution, and item: 2012—Continued
Total
4-year institutions
Less than 4-year2
Public
Private
post-
Total 4-year Highest level of degree
secondary
institutions1
Doctor’s
Master’s
Bachelor’s
degree
Total
Total
Total
Total
Total
Total
Total
granting
res-
res-
res-
res-
res-
res-
res- Item institutions Percent ponding Percent ponding Percent ponding Percent ponding Percent ponding Percent ponding Percent ponding Percent
Electronic services Library services provided:
Documents digitized by library staff 3,138 82.7
2,093 84.1
797 89.1
719 85.4
577 76.6
1,045 80.1
1,444 92.6
1,694 75.9
Library reference service by e-mail or Web 3,139 82.8
2,094 84.1
797 89.1
719 85.4
578 76.8
1,045 80.1
1,444 92.6
1,695 75.9
Technology to assist patrons with disabilities 3,136 82.7
2,092 84.0
796 89.0
719 85.4
577 76.6
1,044 80.1
1,444 92.6
1,692 75.8
Electronic theses and dissertations produced by students 3,138 82.7
2,093 84.1
797 89.1
719 85.4
577 76.6
1,045 80.1
1,444 92.6
1,694 75.9
Information Literacy Articulated student learning/student success outcomes 3,134 82.6
2,088 83.9
795 88.9
715 84.9
578 76.8
1,046 80.2
1,444 92.6
1,690 75.7
Incorporated information literacy into student learning/success outcomes 3,133 82.6
2,087 83.8
795 88.9
715 84.9
577 76.6
1,046 80.2
1,444 92.6
1,689 75.6
Virtual Reference Library supports virtual reference 3,139 82.8
2,093 84.1
798 89.3
717 85.2
578 76.8
1,046 80.2
1,446 92.7
1,693 75.8
Library utilizes e-mail reference 3,139 82.8
2,093 84.1
798 89.3
717 85.2
578 76.8
1,046 80.2
1,446 92.7
1,693 75.8 Library utilizes chat reference,
commercial services 3,139 82.8
2,093 84.1
798 89.3
717 85.2
578 76.8
1,046 80.2
1,446 92.7
1,693 75.8 Library utilizes chat reference,
instant messaging 3,139 82.8
2,093 84.1
798 89.3
717 85.2
578 76.8
1,046 80.2
1,446 92.7
1,693 75.8 Library utilizes short message
service 3,138 82.7
2,092 84.0
798 89.3
716 85.0
578 76.8
1,046 80.2
1,446 92.7
1,692 75.8 1The number of doctoral, master’s, and bachelor’s level institutions does not sum to the total number of 4-year and above institutions because there are 4-year and above institutions that grant other degrees and are thus not included in the breakdown. 2Less than 4-year category refers to institutions that have at least a 2-year degree, but less than a 4-year degree (below the Baccalaureate degree).
3FTE = Full-time equivalent. 4”Other operating expenditures’’ are all other expenditures not already reported, and include furniture and equipment except computer hardware, and any related maintenance costs. 5EOFY = End of fiscal year.
6”Nonreturnable” refers to materials that the supplier/lending library does not expect to have returned. Examples of nonreturnables include photocopies or facsimiles, fiche-to-fiche copies, print copies from microfilm, electronic full-text documents, and gratis print copies of unpublished reports and/or departmental working papers. 7”Documents received from commercial services” refers to all documents from commercial document delivery services received by the library’s users. This includes all transactions that the library pays for, even if library staff is not involved in the transaction. 8”Gate count” is the number of persons who physically enter library facilities over the course of a typical week. SOURCE: U.S. Department of Education, National Center for Education Statistics, Academic Libraries Survey (ALS), 2012.

27
This page left intentionally blank.

28
Table A-2. Number and percentage of nonresponding academic libraries, by level, control of institution, and state/jurisdiction: 2012
Total
4-year institutions
Less than 4-year2
Public
Private
postsecondary
Total 4-year
Highest level of degree
degree-granting
institutions1
Doctor’s
Master’s
Bachelor’s State/jurisdiction institutions Percent Number Percent Number Percent Number Percent Number Percent Number Percent Number Percent Number Percent
United States 557 14.7
348 14.0
82 9.2
110 13.1
156 20.7
209 16.0
78 5.0
479 21.5
Alabama 3 4.3
2 4.8
1 6.7
1 8.3
0 0.0
1 3.6
0 0.0
3 9.7 Alaska 2 33.3
1 25.0
0 0.0
0 0.0
1 100.0
1 50.0
1 20.0
1 100.0
Arizona 15 25.4
13 39.4
2 20.0
2 28.6
9 56.3
2 7.7
1 4.2
14 40.0 Arkansas 6 13.0
4 16.7
0 0.0
2 25.0
2 20.0
2 9.1
3 9.1
3 23.1
California 83 23.0
47 23.0
15 16.7
14 21.9
18 36.0
36 22.9
12 8.1
71 33.5
Colorado 15 24.6
7 18.9
1 7.7
2 25.0
4 25.0
8 33.3
3 11.5
12 34.3 Connecticut 3 7.3
2 7.4
0 0.0
1 16.7
1 16.7
1 7.1
1 5.6
2 8.7
Delaware 4 36.4
3 42.9
1 25.0
2 66.7
0 0.0
1 25.0
1 20.0
3 50.0 District of Columbia 5 29.4
5 29.4
2 22.2
3 42.9
0 0.0
0 0.0
1 50.0
4 26.7
Florida 43 25.4
25 20.3
2 6.9
11 28.2
12 21.8
18 39.1
0 0.0
43 33.3
Georgia 13 11.5
4 5.8
0 0.0
1 5.0
3 11.5
9 20.5
4 6.6
9 17.3 Hawaii 3 21.4
2 25.0
0 0.0
0 0.0
2 66.7
1 16.7
1 11.1
2 40.0
Idaho 1 6.7
0 0.0
0 0.0
0 0.0
0 0.0
1 25.0
0 0.0
1 12.5 Illinois 16 10.1
12 11.8
3 6.4
0 0.0
9 30.0
4 7.1
1 1.7
15 15.3
Indiana 7 8.8
4 6.6
2 11.1
1 4.2
1 5.3
3 15.8
1 3.6
6 11.5
Iowa 5 7.8
4 8.7
0 0.0
3 14.3
1 7.1
1 5.6
1 5.3
4 8.9 Kansas 6 10.5
2 6.5
1 12.5
0 0.0
1 9.1
4 15.4
3 10.0
3 11.1
Kentucky 6 9.2
4 9.1
2 13.3
1 7.1
1 6.7
2 9.5
0 0.0
6 14.6 Louisiana 11 21.6
4 12.9
1 7.1
2 18.2
1 16.7
7 35.0
1 3.6
10 43.5
Maine 1 3.6
1 5.0
0 0.0
0 0.0
1 11.1
0 0.0
1 6.7
0 0.0
Maryland 5 9.3
4 11.1
0 0.0
3 16.7
1 25.0
1 5.6
1 3.3
4 16.7 Massachusetts 12 10.3
10 10.5
6 16.7
2 5.4
2 9.1
2 9.1
2 6.7
10 11.5
Michigan 5 5.7
4 6.8
1 4.3
0 0.0
3 18.8
1 3.6
1 2.3
4 9.1 Minnesota 4 4.5
3 5.2
0 0.0
0 0.0
3 13.0
1 3.3
1 2.4
3 6.4
Mississippi 5 13.2
3 15.0
1 12.5
1 12.5
1 25.0
2 11.1
2 8.3
3 21.4
Missouri 16 15.2
11 13.9
3 10.7
2 8.7
6 21.4
5 19.2
1 3.2
15 20.3 Montana 2 9.1
0 0.0
0 0.0
0 0.0
0 0.0
2 16.7
1 5.9
1 20.0
Nebraska 6 17.1
6 24.0
1 16.7
3 20.0
2 50.0
0 0.0
0 0.0
6 28.6 Nevada 3 18.8
1 8.3
0 0.0
0 0.0
1 14.3
2 50.0
0 0.0
3 33.3
New Hampshire 2 8.0 1 5.6 0 0.0 0 0.0 1 16.7 1 14.3 1 9.1 1 7.1 See notes at end of table.

29
Table A-2. Number and percentage of nonresponding academic libraries, by level, control of institution, and state/jurisdiction: 2012—Continued
Total
4-year institutions
Less than 4-year2
Public
Private
postsecondary
Total 4-year
Highest level of degree
degree-granting
institutions1
Doctor’s
Master’s
Bachelor’s State/jurisdiction institutions Percent Number Percent Number Percent Number Percent Number Percent Number Percent Number Percent Number Percent
New Jersey 11 19.0
8 21.6
2 9.5
2 18.2
4 80.0
3 14.3
3 9.4
8 30.8 New Mexico 4 10.0
4 21.1
0 0.0
2 22.2
2 28.6
0 0.0
1 3.6
3 25.0
New York 52 19.0
46 22.7
16 20.0
16 20.3
14 31.8
6 8.5
1 1.3
51 26.3 North Carolina 6 4.3
5 6.7
1 4.5
2 8.0
2 7.1
1 1.5
1 1.3
5 7.7
North Dakota 1 5.0
1 6.7
0 0.0
0 0.0
1 11.1
0 0.0
1 7.1
0 0.0
Ohio 32 19.3
17 15.6
2 6.7
8 18.6
7 19.4
15 26.3
10 20.0
22 19.0 Oklahoma 6 11.1
3 8.1
1 9.1
0 0.0
2 15.4
3 17.6
3 10.3
3 12.0
Oregon 6 11.3
4 12.1
0 0.0
1 8.3
3 42.9
2 10.0
0 0.0
6 21.4 Pennsylvania 42 21.6
13 10.2
5 9.1
4 8.3
4 16.0
29 43.9
1 2.9
41 25.6
Rhode Island 1 7.7
1 8.3
0 0.0
0 0.0
1 100.0
0 0.0
0 0.0
1 10.0
South Carolina 8 11.3
7 15.6
2 15.4
4 25.0
1 6.3
1 3.8
2 6.1
6 15.8 South Dakota 0 0.0
0 0.0
0 0.0
0 0.0
0 0.0
0 0.0
0 0.0
0 0.0
Tennessee 7 8.5
4 6.6
1 5.0
3 13.6
0 0.0
3 14.3
0 0.0
7 11.7 Texas 26 12.9
18 15.3
3 5.6
6 20.7
9 25.7
8 9.6
0 0.0
26 26.5
Utah 5 20.8
5 26.3
0 0.0
1 12.5
4 50.0
0 0.0
0 0.0
5 33.3
Vermont 1 5.3
0 0.0
0 0.0
0 0.0
0 0.0
1 100.0
0 0.0
1 7.1 Virginia 20 19.2
12 17.4
3 12.0
1 6.3
8 28.6
8 22.9
4 10.0
16 25.0
Washington 8 10.5
3 6.7
0 0.0
0 0.0
3 16.7
5 16.1
2 4.9
6 17.1 West Virginia 3 9.7
1 4.3
0 0.0
1 8.3
0 0.0
2 25.0
0 0.0
3 21.4
Wisconsin 8 11.4
6 11.3
1 5.9
2 10.0
3 18.8
2 11.8
3 10.0
5 12.5 Wyoming 2 20.0 1 50.0 0 0.0 0 0.0 1 100.0 1 12.5 0 0.0 2 100.0 1The number of doctoral, master’s, and bachelor’s level institutions does not sum to the total number of 4-year and above institutions because there are 4-year and above institutions that grant other degrees and are not included in the breakdown. 2Less than 4-year category refers to institutions that have at least a 2-year degree, but less than a 4-year degree (below the Baccalaureate degree).
SOURCE: U.S. Department of Education, National Center for Education Statistics, Academic Libraries Survey (ALS), 2012.

30
Table A-3. Total number of academic libraries, by level, control of institution, and state/jurisdiction: 2012
Total postsecondary
4-year institutions
degree-granting
Total 4-year
Highest level of degree
Less than State/jurisdiction institutions institutions1 Doctor’s Master’s Bachelor’s 4-year2 Public Private
United States 3,793
2,489
894 842 753
1,304 1,560 2,233
Alabama 70
42
15 12 15
28 39 31 Alaska 6
4
1 2 1
2 5 1
Arizona 59
33
10 7 16
26 24 35 Arkansas 46
24
6 8 10
22 33 13
California 361
204
90 64 50
157 149 212
Colorado 61
37
13 8 16
24 26 35 Connecticut 41
27
15 6 6
14 18 23
Delaware 11
7
4 3 0
4 5 6 District of Columbia 17
17
9 7 1
0 2 15
Florida 169
123
29 39 55
46 40 129
Georgia 113
69
23 20 26
44 61 52 Hawaii 14
8
2 3 3
6 9 5
Idaho 15
11
3 2 6
4 7 8 Illinois 158
102
47 25 30
56 60 98
Indiana 80
61
18 24 19
19 28 52
Iowa 64
46
11 21 14
18 19 45 Kansas 57
31
8 12 11
26 30 27
Kentucky 65
44
15 14 15
21 24 41 Louisiana 51
31
14 11 6
20 28 23
Maine 28
20
5 6 9
8 15 13
Maryland 54
36
14 18 4
18 30 24 Massachusetts 117
95
36 37 22
22 30 87
Michigan 87
59
23 20 16
28 43 44 Minnesota 88
58
22 13 23
30 41 47
Mississippi 38
20
8 8 4
18 24 14
Missouri 105
79
28 23 28
26 31 74 Montana 22
10
2 5 3
12 17 5
Nebraska 35
25
6 15 4
10 14 21 Nevada 16
12
4 1 7
4 7 9
New Hampshire 25 18 9 3 6 7 11 14 See notes at end of table.

31
Table A-3. Total number of academic libraries, by level, control of institution, and state/jurisdiction: 2012—Continued
Total postsecondary
4-year institutions
degree-granting
Total 4-year
Highest level of degree
Less than State/jurisdiction institutions institutions1 Doctor’s Master’s Bachelor’s 4-year2 Public Private
New Jersey 58
37
21 11 5
21 32 26 New Mexico 40
19
3 9 7
21 28 12
New York 274
203
80 79 44
71 80 194 North Carolina 140
75
22 25 28
65 75 65
North Dakota 20
15
3 3 9
5 14 6
Ohio 166
109
30 43 36
57 50 116 Oklahoma 54
37
11 13 13
17 29 25
Oregon 53
33
14 12 7
20 25 28 Pennsylvania 194
128
55 48 25
66 34 160
Rhode Island 13
12
6 5 1
1 3 10
South Carolina 71
45
13 16 16
26 33 38 South Dakota 20
15
4 9 2
5 12 8
Tennessee 82
61
20 22 19
21 22 60 Texas 201
118
54 29 35
83 103 98
Utah 24
19
3 8 8
5 9 15
Vermont 19
18
3 12 3
1 5 14 Virginia 104
69
25 16 28
35 40 64
Washington 76
45
14 13 18
31 41 35 West Virginia 31
23
5 12 6
8 17 14
Wisconsin 70
53
17 20 16
17 30 40 Wyoming 10 2 1 0 1 8 8 2 1The number of doctoral, master’s, and bachelor’s level institutions does not sum to the total number of 4-year and above institutions because there are 4-year and above institutions that grant other degrees and are not included in the breakdown. 2Less than 4-year category refers to institutions that have at least a 2-year degree, but less than a 4-year degree (below the Baccalaureate degree).
SOURCE: U.S. Department of Education, National Center for Education Statistics, Academic Libraries Survey (ALS), 2012.

32
Appendix B: Glossary For a complete set of survey definitions and instructions, please refer to the instructions following the questionnaire in Appendix C. Associate’s colleges: These institutions offer associate’s degree and certificate programs but, with few exceptions, award no baccalaureate degrees. This group includes institutions where, during the period studied, bachelor’s degrees represented less than 10 percent of all undergraduate awards. Baccalaureate/associate’s colleges: These institutions are undergraduate colleges where the majority of conferrals are below the baccalaureate level (associate’s degrees and certificates). During the period studied, bachelor’s degrees accounted for at least 10 percent of undergraduate awards. Baccalaureate colleges: These institutions are primarily undergraduate colleges with major emphasis on baccalaureate programs. Bibliographic utilities, networks and consortia: Services provided by national, regional, and local bibliographic utilities networks, and consortia. Carnegie classification: A grouping of degree-granting postsecondary institutions into categories developed by the Carnegie Foundation for the Advancement of Teaching. The categorization is based on a combination of levels of degrees awarded and research funding levels. The Carnegie classification categories used are as follows: Doctoral/Research; Master’s I and II; Baccalaureate; Baccalaureate/Associates; Associates; and Specialized. For table presentation, “level I” and “level II” of the Carnegie classifications were combined. Institutions that do not have a Carnegie classification are assigned to a “not classified” category. Control (of institution): A specification of whether an institution (postsecondary) is operated by publicly elected or appointed officials (public control) or by privately elected or appointed officials and derives its major source of funds from private sources (private control) or public sources (public control). Degree-granting status: Degree-granting institutions offer an associate’s, bachelor’s, master’s, doctor’s, or a first-professional degree. Non-degree-granting institutions offer certificates or other formal awards. Doctoral/research universities: These institutions typically offer a wide range of baccalaureate programs, and they are committed to graduate education through the doctorate level. Level (of institution): A specification of whether a postsecondary education institution’s programs are 4-year or higher (4-year), 2-but-less-than 4-year (2-year), or less than 2-year. Master’s colleges and universities: These institutions typically offer a wide range of baccalaureate programs, and they are committed to providing graduate education through the master’s degree.
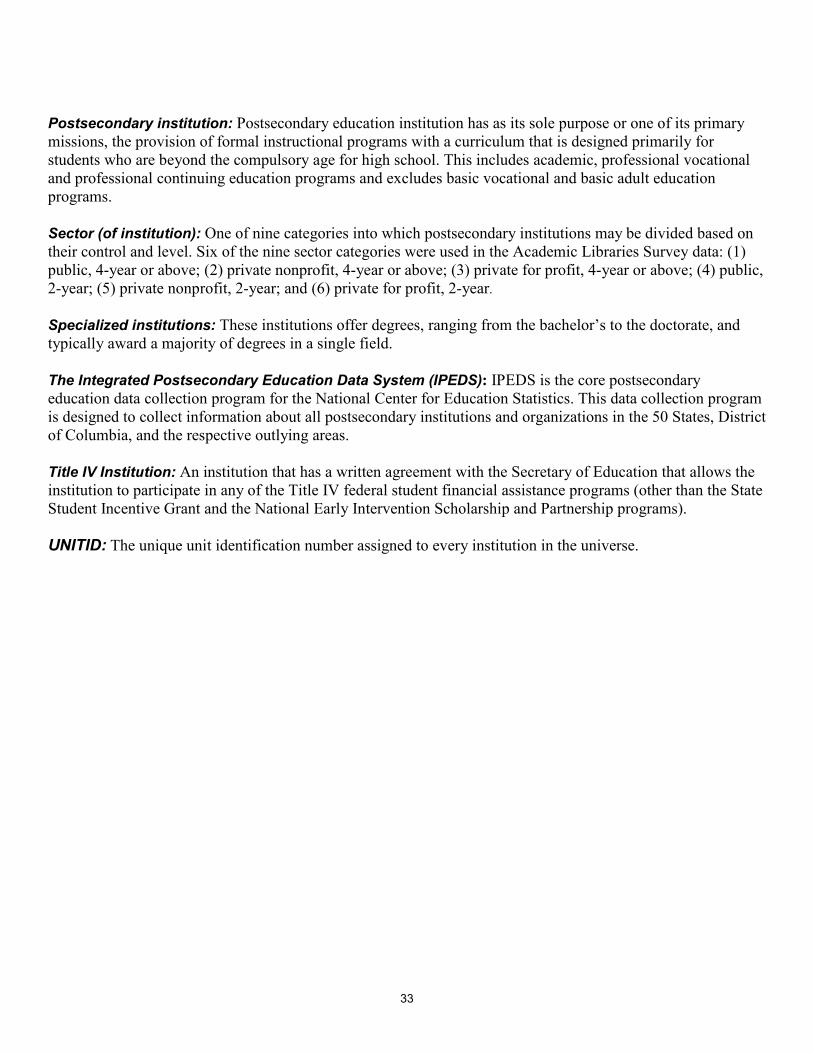
33
Postsecondary institution: Postsecondary education institution has as its sole purpose or one of its primary missions, the provision of formal instructional programs with a curriculum that is designed primarily for students who are beyond the compulsory age for high school. This includes academic, professional vocational and professional continuing education programs and excludes basic vocational and basic adult education programs. Sector (of institution): One of nine categories into which postsecondary institutions may be divided based on their control and level. Six of the nine sector categories were used in the Academic Libraries Survey data: (1) public, 4-year or above; (2) private nonprofit, 4-year or above; (3) private for profit, 4-year or above; (4) public, 2-year; (5) private nonprofit, 2-year; and (6) private for profit, 2-year. Specialized institutions: These institutions offer degrees, ranging from the bachelor’s to the doctorate, and typically award a majority of degrees in a single field. The Integrated Postsecondary Education Data System (IPEDS): IPEDS is the core postsecondary education data collection program for the National Center for Education Statistics. This data collection program is designed to collect information about all postsecondary institutions and organizations in the 50 States, District of Columbia, and the respective outlying areas. Title IV Institution: An institution that has a written agreement with the Secretary of Education that allows the institution to participate in any of the Title IV federal student financial assistance programs (other than the State Student Incentive Grant and the National Early Intervention Scholarship and Partnership programs). UNITID: The unique unit identification number assigned to every institution in the universe.

34
Appendix C: Survey Questionnaire and Instructions
SURVEY ELIGIBILITY You are eligible to complete the survey if your institution has its own library, defined as an entity that provides all of the following: a. Do your total library expenditures exceed $10,000? Yes/No b.
Do you have an organized collection of printed or other materials or a combination thereof? Yes/No
c. Do you have paid, trained library staff to provide and interpret library materials
to meet the informational, cultural, recreational, or educational needs of clientele? Yes/No d. Do you have established hours of operation during which paid, trained staff
are available to meet the informational service needs of clientele? Yes/No e. Does the library have the physical facilities necessary to support such a
collection, staff, and schedule? Yes/No
Data collected by NCES are used for statistical and directory purposes only.

35
ACADEMIC LIBRARIES SURVEY
OUTLETS & STAFF, FISCAL YEAR 2012
Item Outlets Number 100 Branch and independent libraries – Exclude main or central library ______________
(Exclude maintenance and custodial staff, volunteers and contributed services staff.)
Report FTE data to two decimals.
Fall 2012 FY 2012 Number of full-time Salaries and wages Item Staff equivalents (FTE) (whole dollars only) (1) (2) 200 Librarians _________________ 201 Other professional staff _________________ 202 Total librarians and other professional staff
(sum items 200 and 201) _________________ $_________________ 203 All other paid staff (except student assistants) _________________ $_________________ 204 Student assistants from all funding sources _________________ $_________________ 205 Total full-time equivalent (FTE) staff
(sum items 202, 203 and 204) _________________ $_________________
206 Are employee fringe benefits paid from the library budget? If no, select “N” and skip to item 300 _____ (Yes/No) 207 Employee fringe benefits (if paid from library budget) $ _______________
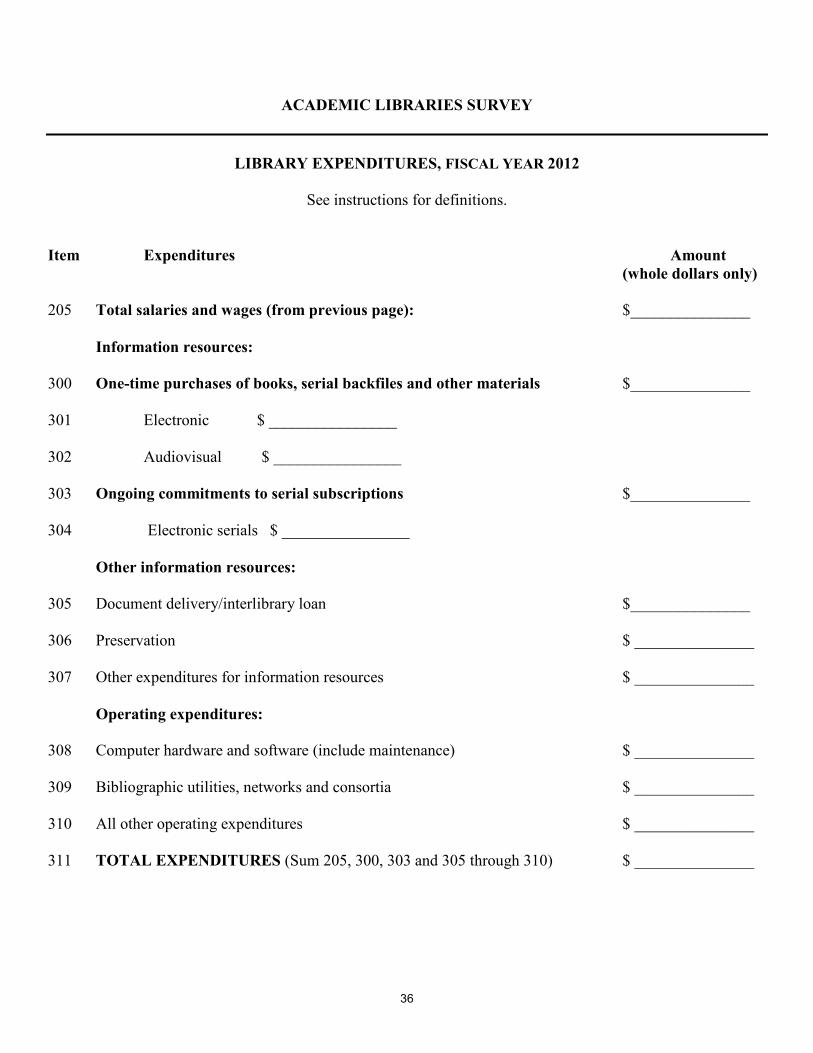
36
ACADEMIC LIBRARIES SURVEY
LIBRARY EXPENDITURES, FISCAL YEAR 2012
See instructions for definitions.
Item Expenditures Amount (whole dollars only) 205 Total salaries and wages (from previous page): $_______________ Information resources: 300 One-time purchases of books, serial backfiles and other materials $_______________ 301 Electronic $ ________________ 302 Audiovisual $ ________________ 303 Ongoing commitments to serial subscriptions $_______________ 304 Electronic serials $ ________________ Other information resources: 305 Document delivery/interlibrary loan $_______________ 306 Preservation $ _______________ 307 Other expenditures for information resources $ _______________ Operating expenditures: 308 Computer hardware and software (include maintenance) $ _______________ 309 Bibliographic utilities, networks and consortia $ _______________ 310 All other operating expenditures $ _______________ 311 TOTAL EXPENDITURES (Sum 205, 300, 303 and 305 through 310) $ _______________

37
ACADEMIC LIBRARIES SURVEY
LIBRARY COLLECTIONS, FISCAL YEAR 2012
See instructions for definitions.
Added during the Held at end of Item Collections
Fiscal Year
Fiscal Year (1) (2)
400 Books, serial backfiles and other paper
materials (include government documents) _______________ ____________
401 E-Books _______________ ____________ 402 Microforms _______________ ____________ 403 Audiovisual materials _______________ ____________ 404 Is the library collection entirely electronic? Yes/No _______

38
ACADEMIC LIBRARIES SURVEY
LIBRARY SERVICES, FISCAL YEAR 2012
See instructions for definitions.
Item Services Number Interlibrary loans and documents provided to other libraries: 500 Returnable _________ 501 Nonreturnable _________ 502 Total provided (sum of items 500 and 501) _________ Interlibrary loans and documents received: 503 Returnable _________ 504 Nonreturnable _________ 505 Documents received from commercial services _________ 506 Total received (sum of items 503, 504 and 505) _________
Circulation:
507 General circulation transactions _________ 508 Reserve circulation transactions _________

39
ACADEMIC LIBRARIES SURVEY
LIBRARY SERVICES CONT., FISCAL YEAR 2012
See instructions for definitions.
Item Services Number
Information services to groups: 509 Number of presentations _________ 510 Total attendance at all presentations _________ 511 Total information services to individuals ________
40
ACADEMIC LIBRARIES SURVEY
LIBRARY SERVICES, TYPICAL WEEK, FALL 2012
See instructions for definitions.
Number in a Item Services typical week 600 Number of weekly public service hours __________ 601 Gate count in a typical week __________
41
ACADEMIC LIBRARIES SURVEY
ELECTRONIC SERVICES, FISCAL YEAR 2012
See instructions for definitions.
Item Services Yes/No Does your library provide the following? 700 Documents digitized by the library staff ____ 701 Library reference service by e-mail or the Web ____ 702 Technology to assist patrons with disabilities ____ 703 Electronic theses and dissertations produced by your students ____

42
ACADEMIC LIBRARIES SURVEY
INFORMATION LITERACY, FISCAL YEAR 2012
See instructions for definition.
Item Yes/No
Does your postsecondary institution have the following, or has it done the following? 800 Has your postsecondary institution articulated student learning/student success outcomes? If not, select “N” and skip 801 ____ 801 Is information literacy incorporated in the institution’s student learning/student success outcomes? ____

43
ACADEMIC LIBRARIES SURVEY
VIRTUAL REFERENCE, FISCAL YEAR 2012
See instructions for definition.
Item Yes/No
900 Does your library support virtual reference services? ____ If no, select “N” and skip 901 thru 904. If yes, does your library utilize any of the following and does it collect usage statistics form any of the virtual reference utilities? 901 E-mail reference ____
902 Chat reference, commercial service
____ 903 Chat reference, instant messaging applications ____ 904 Short message service (SMS) or text messaging ____
44
INSTRUCTIONS FOR THE ACADEMIC LIBRARY SURVEY – FY 2012
GENERAL INSTRUCTIONS Please respond to each item in this survey. If the appropriate answer for an item is zero or none, use “0.” If you do not collect data for an item, provide your best estimate. PLEASE DO NOT LEAVE ITEMS BLANK. If an item is left blank, NCES will estimate a value using the average for institutions with similar characteristics. Include data for the main or central library and all branch and independent libraries that were open all or part of fiscal year 2012. LIBRARY - An entity that provides all of the following:
1. Total library expenditures exceed $10,000.
2. An organized collection of printed or other materials or a combination thereof; and
3. A paid, trained library staff to provide and interpret library materials to meet the informational, cultural, recreational, or educational needs of clientele; and
4. An established hours of operation during which paid, trained staff are available to meet the informational service needs of clientele; and
5. The physical facilities necessary to support such a collection, staff, and schedule. This includes libraries that are part of learning resource centers. Number of Public Service Outlets, Fiscal Year 2012 Branch and independent libraries (item 100) - Report the number of branch and independent libraries at your institution that were open all or part of fiscal year 2012. EXCLUDE THE MAIN OR CENTRAL LIBRARY. Branch and independent libraries are defined as auxiliary library service outlets with quarters separate from the central library of an institution, which have a basic collection of books and other materials, a regular staffing level, and an established schedule. Branch and independent libraries are administered either by the central library or, as in the case of some libraries (such as law, medical, etc.), through the administrative structure of other units within the university. Departmental study/reading rooms are not included. Include data for all branch and independent libraries on the campus. Include libraries on branch campuses (i.e., located in another community) if those campuses are registered under the same NCES UNITID number as the main campus. Library Staff, Fall 2012 and Salaries/Wages, FY 2012 Column (1), Full-time equivalent (FTE) employees (items 200-205) - Report the number of filled or temporarily vacant FTE positions during Fall 2012. To compute FTEs for part-time employees and student assistants, take the TOTAL number of hours worked per week by part-time employees and divide it by the number of hours in

45
the library’s full-time work week (e.g., 60 hours per week of part-time work divided by 40 hours per full-time week equals 1.50 FTE). Data should be reported to two decimal places. Exclude maintenance and custodial staff, volunteers, and contributed services staff, such as members of religious orders, whose services are valued by bookkeeping entries rather than by full cash transactions. Column (2), Salaries and wages (items 202-205) - Report expenditures in FY 2011 for full-time and part-time salaries and wages before deductions. Exclude employee fringe benefits provided by your institution for all regular library staff that may be reported in item 207. Librarians (item 200) - Report the total FTE of staff whose duties require professional education (the master’s degree or its equivalent) in the theoretical and scientific aspects of librarianship. Other professional staff (item 201) - Report the total FTE of staff whose duties require education and/or training in related fields (e.g., academic disciplines, archives, media, computing). Total librarians and other professional staff (item 202) - Report the sum of items 200 and 201, column 1. All other paid staff (except student assistants) (item 203) - Report the total FTE of all other library staff, including technical and clerical staff who are paid annual salaries or hourly wages. Student assistants from all funding sources (item 204) - Report the total FTE of student assistants, employed on an hourly basis. Include salaries and wages from all sources (e.g., College Work Study Program). If not available leave line blank. Total FTE staff (item 205) - Report the sum of items 202 through 204, columns 1 and 2. Employee fringe benefits (item 206) — If benefits are paid from the library budget, select “Y” and report the amount in item 207. If benefits are not paid from the library budget, select “N” and skip to item 300. Benefits (item 207) - If benefits are paid from the library budget, report the amount here. Library Expenditures, Fiscal Year 2012 Total salaries and wages (item 205) - This line will automatically be filled in from the total Salaries and Wages Expenditures from the previous section. Expenditures on information resources and operations (items 300-311) - Report funds expended by the library in fiscal year 2012 (regardless of when received) from its regular budget and from all other sources; e.g., research grants, special projects, gifts and endowments, and fees for services. If items in this section are not paid from the library budget but can be easily identified in other parts of the institution’s budget, report them here. Expenditures should be reported for the 12-month period that corresponds to your library’s fiscal year between the calendar period June 1, 2011 to September 30, 2012. All expenditures should be reported in whole dollars in the most appropriate category to provide an unduplicated count of expenditures. Exclude expenditures for new buildings and building renovation.
46
Information resources (items 300-307) - Books, serial backfiles, and other materials (one time purchases) (item 300) - Report expenditures for published materials in all formats except current subscriptions to serials. Electronic (item 301) - Report expenditures that are not current subscriptions to serials (i.e. are nonsubscription, one-time, or monographic in nature) for software and machine-readable materials considered part of the collections. Examples include serial backfiles, literature collections, and one-time costs for electronic backfiles, etc. These expenditures have already been reported as part of item 300 above. Therefore, item 301 is not added into Total Expenditures (item 311). Audiovisual (item 302) - Report expenditures for all library materials that are displayed by visual projection or magnification or through sound reproduction, or both, including graphic materials, audio materials, motion pictures, video materials, and special visual materials such as three-dimensional materials. These expenditures have already been reported as part of item 300 above. Therefore, item 302 is not added into Total Expenditures (item 311). Current serial subscriptions (ongoing commitments) (item 303) - Report expenditures for ongoing subscriptions to serials in all formats. These are publications issued in successive parts, usually at regular intervals, and, as a rule, intended to be continued indefinitely. Serials include periodicals, newspapers, annuals (reports, yearbooks, etc.), memoirs, proceedings, and transactions of societies. Electronic serials (item 304) – Report subscription expenditures (or those which are expected to be ongoing commitments) for serial publications whose primary format is electronic. Examples include paid subscriptions for electronic journals and indexes/abstracts available via the Internet, CD-ROM serials, and annual access fees. These expenditures have already been reported as part of item 303. Therefore, item 304 is not added into Total Expenditures (item 311). Other Information Resources (items 305-307) - Document delivery/interlibrary loan (item 305) - Report expenditures for document delivery and interlibrary loan services. Include fees paid for photocopies, costs of facsimile transmission, royalties and access fees paid to provide document delivery or interlibrary loan. Include fees paid to bibliographic utilities if the portion paid for interlibrary loan can be separately counted. Do not count expenditures related to transactions between the main or central library and branches reported in item 100, transactions between branches (item 100), or expenditures for on campus delivery. Preservation (item 306) - Report expenditures associated with maintaining library and archival materials for use either in their original physical form or in some other usable way. This includes but is not limited to binding and rebinding, materials conservation, deacidification, lamination, and restoration. Also, include preservation-related contracts for services (e.g. digitization). Do not include staff salaries and wages. Other expenditures for information resources (item 307) - Report any other collection expenditures not already included in items 300, 303, 305, and 306, such as expenditures for cartographic materials and manuscripts. Include copyright fees and fees for database searches, e.g. (DIALOG, Lexis-Nexis).

47
Operating Expenditures (items 308-310) - Computer hardware and software (item 308) - Report expenditures from the library budget for computer hardware and software used to support library operations, whether purchased or leased, local or remote. Include expenditures for maintenance. Include the expenditure for equipment used to run information service products when that expenditure can be separated from the price of the product. Exclude expenditures reported in item 304. Bibliographic utilities, networks, and consortia (item 309) - Report expenditures from the library operating budget for services provided by national, regional, and local bibliographic utilities, networks, and consortia. Exclude expenditures already reported on items 301, 304, and 305. All other operating expenditures (item 310) - Report all other expenditures from the library budget not already reported in items 205 through 309 except employee fringe benefits that are reported in item 207. Exclude expenditures for new buildings and building renovations. Include all expenditures for furniture and equipment except computer hardware, which should be reported in item 308. Include any related maintenance costs. Total Expenditures (item 311) - Report the sum of items 205, 300, 303, 305 through 310. Library Collections, Fiscal Year 2012 NOTE - This section of the survey collects data on selected types of material. It does not cover all materials. Column (1), Total number added during fiscal year - Report the gross number of each category added during FY 2012. Do not subtract the number withdrawn. Column (2), Total number held at end of fiscal year - Report the total number of each category held at end of FY 2012. To get this figure, take the total number held at the end of FY 2011, add the number added during FY 2012, and subtract the number withdrawn FY 2012. Books, serial backfiles and other paper materials (include government documents) (item 400) - Report the number of volumes using the ANSI/NISO Z39.7-1995 definition for volume, which is as follows: A single physical unit of any printed, typewritten, handwritten, mimeographed, or processed work, distinguished from other units by a separate binding, encasement, portfolio, or other clear distinction, which has been cataloged, classified, and made ready for use, and which is typically the unit used to charge circulation transactions. Include print photographs, duplicates and bound volumes of periodicals. For purposes of this questionnaire, unclassified bound serials arranged in alphabetical order are considered classified. Exclude microfilms, maps, nonprint materials, and uncataloged items. Include Government document volumes that are accessible through the library’s catalogs regardless of whether they are separately shelved. “Classified” includes documents arranged by Superintendent of Documents, CODOC, or similar numbers. “Cataloged” includes documents for which records are provided by the library or downloaded from other sources into the library’s card or online catalogs. E-Books (item 401) - Report the number of electronic monographs that have been cataloged by your library and are accessible through the library’s catalog.

48
Microforms (item 402) - Report units of all photographic reproduction of textual, tabular, or graphic materials reduced in size so that they can be used only with magnification. Examples of microforms are roll microfilm, microcard, microfiche, and ultrafiche. Audiovisual Materials (item 403) - Report units of all library materials that are displayed by visual projection or magnification or through sound reproduction, or both, including graphic materials, audio materials (include audio books), motion pictures, video materials, and special visual materials such as three-dimensional materials. Library Services, Fiscal Year 2012 Interlibrary loans and documents (items 500-506) – In items 500 and 501, report the number of filled requests for material provided to other libraries. In items 503 and 504, report the number of filled requests for material received from other libraries. Do not include transactions between the main or central library and branches reported in item 100, or transactions between branches (item 100). Returnables (item 500 and 503) - Report materials that the library expects to have returned. Examples of returnables include books, dissertations and theses, microfilm reels, sound recordings, and audiovisual material. Nonreturnables (item 501 and 504) - Report materials that the library does not expect to have returned. Examples of nonreturnables include photocopies or facsimiles, fiche-to-fiche copies, print copies from microfilm, electronic full-text documents, and gratis print copies of unpublished reports and/or departmental working papers. Documents delivered from commercial services (item 505) - Report the number of documents from commercial document delivery services received by your users. Count all transactions for which the library pays even if library staff is not involved in the transaction. Include documents received by regular or express mail, by fax, or in electronic form. Total loans (items 502 and 506) - Sum items 500 and 501 for item 502, and sum items 503, 504, and 505 for item 506. General circulation transactions (item 507) - Report the number of items lent from the general collection. Include both initial transactions and renewals. Reserve circulation transactions (item 508) – Report reserve transactions of all types. Include both initial transactions and renewals. Information services to groups (items 509 and 510) - Report the total number of presentations (item 509) and the total number of persons attending or served by those presentations (item 510). Information services to groups are presentations at which a staff member or person invited by a staff member provides information intended for a number of persons and planned in advance. These services may be either bibliographic instruction or library use presentations, or cultural, recreational, or educational presentations. Presentations both on and off the library premises should be included, as long as they are sponsored by the library. Self-paced tutorials and staff training should be excluded, as well as meetings sponsored by other groups using library meeting rooms. Include web-based presentations.

49
Information services to individuals (items 511) – Reference and consultation interactions are information contacts that involve the knowledge, use, recommendation, interpretation, or instruction in the use of one or more information sources by a member of the library staff. Information sources include printed and nonprinted materials, machine-readable databases (including assistance with computer searching), the Web, catalogs and other holdings records, and, through communication or referral, other libraries and institutions, and persons both inside and outside the library. Reference interactions may be in person, by phone, by e-mail, by the Web, and may take place at the reference desk or elsewhere and take less than 20 minutes to complete. Include information and referral services. Consultation interactions typically occur in person and take longer than 20 minutes to complete. If a contact includes both reference and directional services, it should be reported as one reference transaction. When a staff member utilizes information gained from a previous use of information sources to answer a question, report as a reference transaction, even if the source is not consulted again during this transaction. Do not report directional transactions here. A directional transaction is an information contact which facilitates the use of the library in which the contact occurs and which does NOT involve the knowledge, use, recommendation, interpretation, or instruction in the use of any information sources other than those which describe the library; such as schedules, floor plans, handbooks, and policy statements. Examples of directional transactions include giving instruction in locating, within the library, staff, library users, or physical features, etc., and giving assistance of a nonbibliographic nature with machines. This is a yearly figure of the reference transactions per typical week (item 602) that was reported in collections before 2010. Library Services - Typical Week, Fall 2012 Collect data during a typical week in the fall. A typical week is one that is neither unusually busy nor unusually slow. Avoid vacation periods for key staff or days when unusual events are taking place on the campus or in the library. Choose a week in which the library is open its regular hours. Include any seven consecutive calendar days. If waiting for a typical week in Fall 2012 will delay this form, please use typical week data from the preceding fiscal year. If you have data for the entire year, divide by the number of weeks that the library was open. Number of weekly public service hours (item 600) – Report an unduplicated count of the total public service hours for physical libraries per typical full-service week (i.e., no holidays or other special accommodations) across both main library and branches using the following method (corresponds to IPEDS): If a library is open from 9:00 a.m. to 5:00 p.m. Monday through Friday, it should report 40 hours per week. If several of its branches are also open during these hours, the figure remains 40 hours per week. Should Branch A also be open one evening from 7:00 p.m. to 9:00 p.m., the total hours during which users can find service somewhere within the system becomes 42 hours per week. If Branch B is open the same hours on the same evening, the count is still 42, but if Branch B is open two hours on another evening, or remains open two hours later, the total is then 44 hours per week. Exclude 24-hour unstaffed reserve or similar reading rooms. The maximum total is 168 (i.e., a staffed reading room open 7 days per week, 24 hours per day).
50
Gate count in a typical week (item 601) - Report the number of persons who physically enter library facilities in a typical week. It is understood that a single person may be counted more than once. If the library is virtual or entirely electronic, please leave the line blank. Electronic Services This section requests information about the electronic services provided by the library. The questions require a “yes” or “no” response. If the answer was “yes” at any time during the academic year, respond “yes”. Examples of Technology to assist patrons with disabilities (item 702) are TDD and specially equipped work stations. Information Literacy This section requests information about institutional support for information literacy, which includes the set of skills needed to find, retrieve, analyze, and use information, and the support of student learning outcomes. The questions require a “yes” or “no” response. Items 800 and 801 relates to activities undertaken by the postsecondary institution, not by the library. Virtual Reference (revised language 3.5.09) (from NISO Z39.7, text integrated for clarity) A virtual reference interaction is a question that is received and responded to in electronic format and conforms to reference interactions in that it is an information contact that involves the knowledge, use, commendation, interpretation, or instruction in the use of one or more information sources by a member of the library staff. Virtual reference interactions include e-mail, webform, chat, text messaging, instant messaging, or other network-based medium designed to support virtual reference. Examples of Chat reference, commercial service (item 902) are QuestionPoint and Tutor.com. Examples of Chat reference, instant messaging applications (item 904) are Meebo and Library Help.
Recommended