ACA meeting July 2009
Highlights

Small Angle Scattering (X-rays, Neutrons)
• http://en.wikipedia.org/wiki/Biological_small-angle_scattering• Don’t need crystals• Can study small proteins or HUGE complexes
– Maximum size– Radius of gyration– BUT, more is possible:
• With medium resolution scattering curves, can generate models of possible SHAPES and then on using restraints such as compactness and -ab initio
• Also can generate models of complexes when you have the component structures from X-ray or NMR, compare calculated & real scattering curves
• http://www.embl-hamburg.de/ExternalInfo/Research/Sax/atsas-online/
• Two good refs: Svergun, J. Appl. Cryst. 2006, 40, s10 - s17 Hura et al., Nature Methods 2009, 6, 606 -,612

Some examples of SAS
• SARS polyproteins• Whole virus • 400 kD protein studied by combination of
– SAXS, AUC, DLS
• Making SDS into a non-denaturing detergent by adding cosolvents - like MPD; studied a -barrel membrane protein
MPD
SDSOH
OH

Powder Diffraction from sub-micron crystals of PSI using a micro-jet
• Mark Hunter (grad. Student) with others at ALS• Filter microcrystals to size of 500 nM (<1000 unit cells)• Shoot through an aperture serially, collect scattering using long
wavelength so can get e.g. 28 Angstrom curves• Working on developing this method to higher resolution at ALS• Ref: Shapiro DA, Chapman HN, Deponte D, Doak RB, Fromme P, Hembree G,
Hunter M, Marchesini S, Schmidt K, Spence J, Starodub D, Weierstall U. Powder diffraction from a continuous microjet of submicrometer protein crystals.
J Synchrotron Radiat. 2008 Nov;15(Pt 6):593-9. Epub 2008 Oct 3.
Irimpan Mathews - SSRL
• Grow crystals directly in loops• Nextal plates


Instrumentation Session
• Pilates Detector - Swiss Light Source• http://pilatus.web.psi.ch/pilatus.htm
– Single photon counter, solid state, not a multiwire– No “dark current” or read noise– Less point spread– 4 ms dead time
• Can collect continuously; no shutter, reduces noise• Fine phi slicing - also better for noise• Commercialization of detector Dectris

Data Collection Diagnostics• James Holton:
– Discovering the Rules of Successful Protein Structure Determination with Simulated Diffraction Images
• Only 2% data collected at beamlinesbecome good structural models - why?
• “MLSFOM” - tool to simulate diffraction while varying parameters such as:– Spot shape– Mosaic spread– Beam divergence– Spectral dispersion– Point spread function– Radiation damage– Crystal size– Detector & goniometer properties
• Calculates a Correlation Coefficient with the actual data & if get >0.5, then (e.g. MAD) probably solvable
• http://bl831.als.lbl.gov/ ~jamesh/powerpoint/ACA_2009. ppt

dataset 1 2-11 12
exposure 1.0s 0.1s 1.0s
frames 100 100 x 10 100
Rmerge Ranom
I/sd
I/sd (2.0 Ǻ)
redundancy
PADFPH
FOM
FOMDM
CC(1H87)
same total dose with high and low redundancy
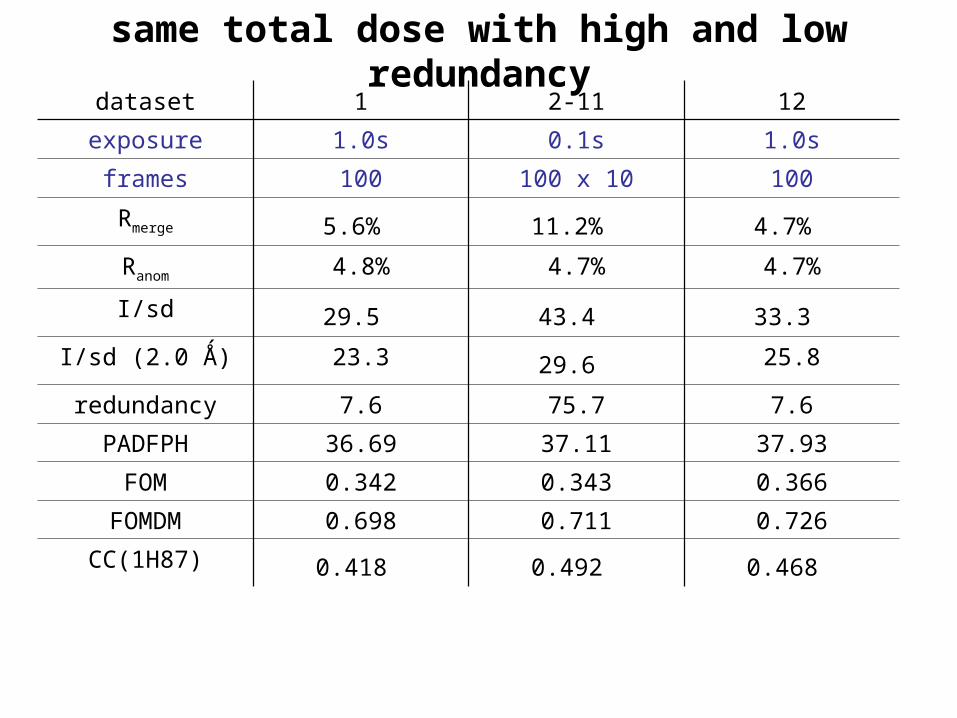
dataset 1 2-11 12
exposure 1.0s 0.1s 1.0s
frames 100 100 x 10 100
Rmerge 5.6% 11.2% 4.7% Ranom 4.8% 4.7% 4.7%
I/sd 29.5 43.4 33.3 I/sd (2.0 Ǻ) 23.3 29.6 25.8
redundancy 7.6 75.7 7.6
PADFPH 36.69 37.11 37.93
FOM 0.342 0.343 0.366
FOMDM 0.698 0.711 0.726
CC(1H87) 0.418 0.492 0.468
same total dose with high and low redundancy

dataset 1 2-11 12
exposure 1.0s 0.1s 1.0s
frames 100 100 x 10 100
Rmerge 5.6% 11.2% 4.7%
Ranom 4.8% 4.7% 4.7%
I/sd 29.5 43.4 33.3
I/sd (2.0 Ǻ) 23.3 29.6 25.8
redundancy 7.6 75.7 7.6
PADFPH 36.69 37.11 37.93
FOM 0.342 0.343 0.366
FOMDM 0.698 0.711 0.726
CC(1H87) 0.418 0.492 0.468
same total dose with high and low redundancy
Recommended