ii
ABSTRACT
Listeria monocytogenes (L. monocytogenes) is an important cause of listeriosis,
a common foodborne disease of public health importance. Ready-to-eat (RTE) foods are
known as a potential source of listeriosis. There are limited studies in the
characterisation of L. monocytogenes in Malaysia. The objectives of the study were to
determinate the prevalence of Listeria species and L. monocytogenes in RTE foods in
Malaysia and to characterise these isolates by using molecular methods.
Two hundred fifty RTE food samples, including cooked beef and beef products,
beverages, cooked chicken and chicken products, fried egg and egg products, packed
lunch, salad and vegetables, and cooked seafood and seafood products were purchased
from hawkers and hypermarkets in Kuala Lumpur and Petaling Jaya. Conventional and
molecular methods were used for the isolation of Listeria spp. and L. monocytogenes.
Overall, out of 250 RTE food samples, Listeria species were found in 52
(20.8%) samples, of which 32 (61.5%) contained L. monocytogenes. Twenty-one
(65.6%), 7 (21.9%) and 4 (12.5%) of L. monocytogenes isolates were grouped into
serogroups “1/2a, 3a”, “1/2c, 3c” and “4b, 4d, 4e”, respectively. All the L.
monocytogenes harbored virulence genes (inlA, inlB, inlC and inlJ) as confirmed by
PCR and DNA sequence analysis. PCR-RFLP of the inlA, inlB and inlC had limited
variation. Multi-drug resistance was observed in one isolate (3.1%) which belonged to
serogroup “4b, 4d, 4e”. REP-PCR, BOX-PCR, RAPD and PFGE were performed to
genetically characterise the L. monocytogenes isolates. Twenty-eight REP profiles, 31
BOX profiles, 32 RAPD profiles and 20 pulsotypes (PFGE profiles) were observed.
These L. monocytogenes isolates were classified into 8, 9, 4 and 7 distinct clusters at
80% similarity by REP-PCR, BOX-PCR, RAPD and PFGE, respectively. The
iii
discriminatory power was 0.992, 0.998, 1.000 and 0.916 for REP-PCR, BOX-PCR,
RAPD and PFGE, respectively.
In summary, the prevalence rate of serogroup “4b, 4d, 4e” indicated that RTE
foods are potential sources of listeriosis in humans and the presence of the internalin
genes and multi-drug resistant L. monocytogenes indicated that contamination of RTE
foods could be a public health concern. REP-PCR, BOX-PCR and PFGE could
distinguish the L. monocytogenes isolates with different flagella antigen groups or
serogroups.

iv
ABSTRAK
Listeria monocytogenes (L. monocytogenes) adalah punca utama listeriosis,
penyakit bawaan makanan kepentingan kesihatan awam. Makanan sedia-untuk-makan
(ready-to-eat: RTE) dikenali sebagai sumber yang berpotensi untuk listeriosis. Terdapat
kajian yang terhad dalam pencirian L. monocytogenes di Malaysia. Objektif utama
kajian ini ialah menentukan kelaziman spesies Listeria dan L. monocytogenes dalam
makanan RTE di Malaysia dan mencirikan isolat dengan menggunakan kaedah molekul.
Dua ratus lima puluh sampel makanan RTE, termasuk produk daging lembu dan
daging lembu masak, minuman, ayam masak dan produk ayam, telur goreng dan produk
telur, makanan bungkusan, salad dan sayur-sayuran, dan makanan laut masak dan
produk makanan laut yang dibeli daripada penjaja dan pasar raya besar di Kuala
Lumpur dan Petaling Jaya. Kaedah-kaedah konvensional dan molekular telah digunakan
untuk pengasingan dan pengenalpastian Listeria spp. dan L. monocytogenes.
Secara keseluruhannya, daripada 250 sampel produk makanan RTE, spesies
Listeria telah ditemui di 52 (20.8%) sampel, 32 (61.5%) yang terkandung
L.monocytogenes. Dua puluh satu (65.6%), 7 (21.9%) dan 4 (12.5%) L. monocytogenes
isolat telah masing-masing dikumpulkan ke “serogroup” “1/2a, 3a”, “1/2c, 3c” dan “4b,
4d, 4e”. Semua L. monocytogenes mengandungi gen inlA, inlB, inlC dan inlJ
sebagaimana yang disahkan oleh PCR dan analisis DNA urutan. PCR-RFLP daripada
inlA, inlB dan inlC mempunyai variasi terhad. “Multi-drug resistant” telah diperhatikan
dalam satu isolat (3.1%) L. monocytogenes dari “serogroup” “4b, 4d, 4e”. REP-PCR,
BOX-PCR, RAPD dan PFGE telah dilakukan untuk mencirikan L. monocytogenes. Dua
puluh lapan corak REP , 31 corak BOX, 32 corak RAPD dan 20 pulsotypes (corak
PFGE) telah diperhatikan. L. monocytogenes telah masing-masing dikelaskan kepada 8,
9, 4 dan 7 kelompok yang berbeza berdasarkan 80% persamaan dengan menggunakan

v
REP-PCR, BOX-PCR, RAPD dan PFGE. Kuasa diskriminasi masing-masing adalah
0.992, 0.998, 1.000 dan 0.916 untuk REP-PCR, BOX-PCR, RAPD dan PFGE.
Secara ringkasnya, kadar kelaziman “serogroup” “4b, 4d, 4e” menunjukkan
bahawa makanan RTE adalah sumber potensi listeriosis pada manusia dan kehadiran
gen internalin dan “multi-drug resistant” L. monocytogenes menunjukkan bahawa
pencemaran makanan RTE boleh menjadi satu kebimbangan kesihatan awam. REP-
PCR, BOX-PCR dan PFGE dapat membezakan L. monocytogenes dengan kumpulan
antigen flagella berbeza atau “serogroup”.

vi
ACKNOWLEDGMENT
First and foremost, I want to say thank you to my Lord and savior, for his grace
and mercies that allow me to be in this position, and for giving me the strength,
patience, and confidence to strive to complete my work.
I would like to convey my sincere appreciation to my supervisor, Professor Dr.
Thong Kwai Lin, for supervising my research and contributing me in completing the
thesis writing. Her valuable and very helpful suggestions and guides enabled me to
complete this research. Studying under her supervision was a great pleasure for me.
I would like to extend my gratitude to Dr. Chai Lay Ching and my lab-mates for
their attention and kind assistance. I enjoyed the time spent with them, and their
supports helped me a lot in completing the project.
I want to thank and acknowledge my dearest friend, Abdolhamid Daneshjoo, for
his assistance in data analysis.
Last but not the least, I would like to express my deepest appreciation to my parents and
wife for their unconditionally love and support. Their motivations and incentives
encouraged me a lot to fulfill my study. Without them none of this would have been
possible. I would like to dedicate my work to them.

vii
TABLE OF CONTENTS
ABSTRACT ......................................................................................................... ii
ABSTRAK .......................................................................................................... iv
ACKNOWLEDGMENT ................................................................................... vi
TABLE OF CONTENTS .................................................................................. vii
LIST OF FIGURES ........................................................................................... xi
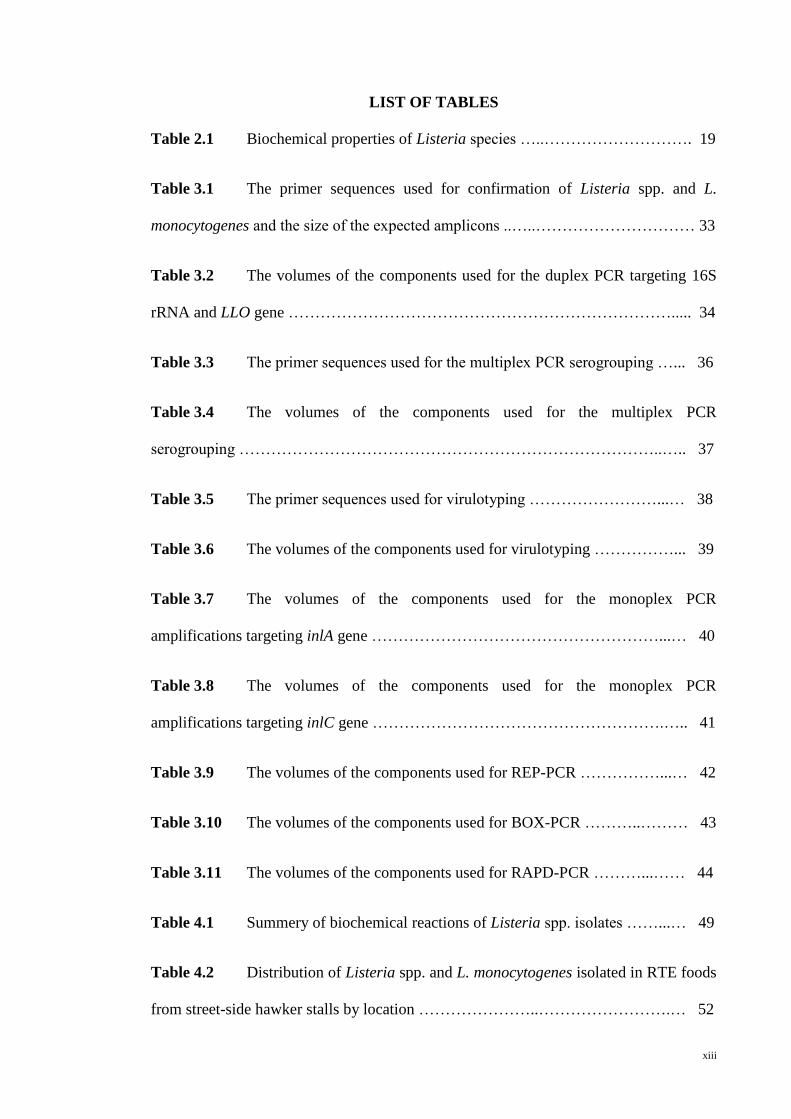
LIST OF TABLES ........................................................................................... xiii
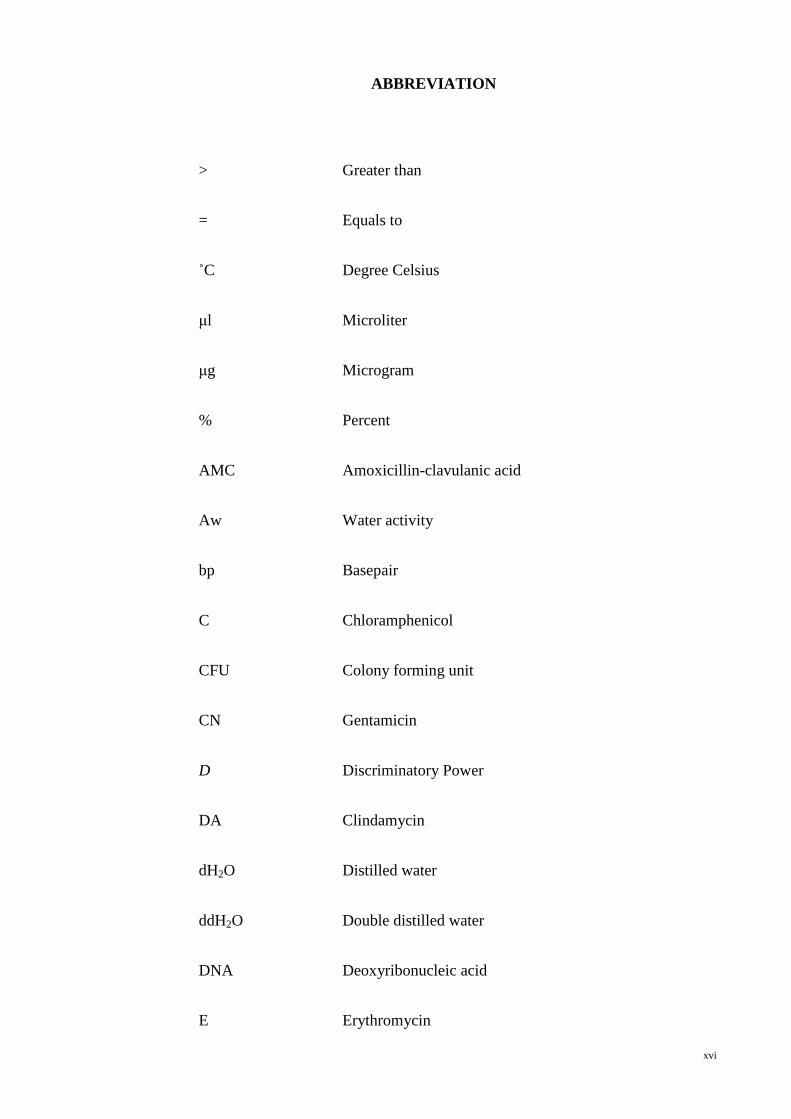
ABBREVIATION ............................................................................................ xvi
CHAPTER 1: INTRODUCTION ...................................................................... 1
CHAPTER 2: LITERATURE REVIEW .......................................................... 5
2.1 Listeria species ............................................................................................ 6
2.2 Listeria monocytogenes ............................................................................... 8
2.2.1 Internalin A, internalin B and the internalin Family .......................... 12
2.3 Listeria monocytogenes in foods ............................................................... 14
2.4 Listeriosis .................................................................................................. 14
2.5 Detection methods of L. monocytogenes and Listeria spp. ....................... 16
2.5.1 Conventional methods of detection of Listeria .................................. 16
2.5.2 Chromogenic media for detection of L. monocytogenes .................... 19
2.5.3 Molecular detection of Listeria spp. and L. monocytogenes .............. 20
2.6 Molecular subtyping methods ................................................................... 21
2.6.1 PCR-based subtyping techniques for L. monocytogenes ................... 21
viii
2.6.2 Ribotyping .......................................................................................... 24
2.6.3 Pulsed-field gel electrophoresis (PFGE) ............................................ 25
2.7 Antimicrobial susceptibility test ............................................................... 27
2.8 Treatment and prevention ......................................................................... 27
CHAPTER 3: MATERIALS AND METHODS ............................................ 29
3.1 Materials .................................................................................................... 30
3.1.1 Collection of samples ......................................................................... 30
3.1.2 Chemicals, reagents, media, buffers and solutions ............................ 30
3.2 Methods ..................................................................................................... 31
3.2.1 Isolation and identification of Listeria spp. and L. monocytogenes 31
3.2.2 Procedure for isolation of L. monocytogenes ..................................... 32
3.3 Confirmation L. monocytogenes by Polymerase Chain Reaction ............. 33
3.3.1 Preparation of DNA template for PCR .............................................. 33
3.3.2 Specific oligonucleotide primers for identification Listeria spp. and L.
monocytogenes ........................................................................................................ 33
3.3.3 Reaction mixture and cycling condition for amplification 16S rRNA
and LLO gene .......................................................................................................... 34
3.4 Rapid detection assay for Listeria spp. and L. monocytogenes by
Polymerase Chain Reaction ........................................................................................ 35
3.5 Multiplex PCR Differentiation of L. monocytogenes Serogroups ............ 36
3.6 Multiplex PCR to determine virulotypes of L. monocytogenes ................ 37
3.7 PCR-Restriction fragment length polymorphism (-RFLP) ....................... 39
3.7.1 PCR-RFLP of inlA ............................................................................. 39
ix
3.7.2 PCR-RFLP of inlC ............................................................................. 40
3.8 PCR-based Fingerprinting ......................................................................... 41
3.8.1 Repetitive Extragenic Palindromic (REP)-PCR ................................ 41
3.9.1 Preparation of DNA plugs .................................................................. 44
3.9.2 Restriction digestion .......................................................................... 45
3.9.3 Pulsed-field gel electrophoresis ......................................................... 45
3.10 Antimicrobial susceptibility testing ........................................................ 46
3.11 Data Analysis .......................................................................................... 46
CHAPTER 4: RESULTS .................................................................................. 48
4.1 Identification of Listeria spp. and L. monocytogenes isolates .................. 49
4.1.1 Identification of Listeria spp. isolates by conventional methods ....... 49
4.1.2 Confirmation of Listeria spp. and L. monocytogenes by Polymerase
Chain Reaction ........................................................................................................ 49
4.1.3 Detection of Listeria spp. and L. monocytogenes directly from foods
homogenates ............................................................................................................ 50
4.2 Distribution of Listeria species and L. monocytogenes ............................ 51
4.2.1 Distribution of Listeria spp. and L. monocytogenes isolated in RTE
foods from street-side hawker stalls ........................................................................ 51
4.2.2 Distribution of Listeria spp. and L. monocytogenes isolated in RTE
foods from hypermarkets ........................................................................................ 52
4.2.3 Distribution of Listeria spp. and L. monocytogenes isolated in RTE
foods from both Street-side hawker stalls and hypermarkets ................................. 54
4.3 Distribution of L. monocytogenes serogroups ........................................... 55
x
4.4 Antibiograms ............................................................................................. 57
4.4.1 Antibiograms of L. monocytogenes isolates....................................... 57
4.4.2 Antibiograms of the non-L. monocytogenes isolates ......................... 58
4.5 Detection of virulence genes in L. monocytogenes ................................... 62
4.6 Validation of the amplicons .................................................................. 62
4.7 PCR-Restriction fragment length polymorphism (PCR-RFLP) among
selected virulence genes .............................................................................................. 63
4.7.1 PCR-RFLP of inlA ............................................................................. 63
4.7.2 PCR-RFLP of inlC ............................................................................. 64
4.8 PCR-based genotyping of L. monocytogenes............................................ 65
4.8.1 Repetitive Extragenic Palindromic (REP)-PCR ................................ 65
4.8.2 BOX-PCR .......................................................................................... 70
4.8.3 Random Amplification of Polymorphic DNA (RAPD) ..................... 74
4.9 Pulsed Field Gel Electrophoresis (PFGE) ................................................. 78
CHAPTER 5: DISCUSSION ........................................................................... 87
CHAPTER 6:CONCLUSIONS........................................................................ 94
BIBLIOGRAPHY ............................................................................................. 96
APPENDIX ..................................................................................................... 110
xi
LIST OF FIGURES
Figure 2.1 Cellular mechanism of L. monocytogenes pathogenesis …………….. 11
Figure 4.1 The representative agarose gel picture of PCR-amplified products of
Listeria spp. and L. monocytogenes …………………………………..…................... 50
Figure 4.2 Prevalence (number of positive samples/total samples tested) of L.
monocytogenes and non-L. monocytogenes in different kinds of RTE food samples
collected from street-side hawker stalls and hypermarkets in different location of Kuala
Lumpur and Petaling Jaya .………..……………………………………………........ 55
Figure 4.3 A representative gel picture of DNA amplicons generated by multiplex
PCR for identification of L. monocytogenes serogroups ………….……………...… 56
Figure 4.4 The representative agarose gel picture of PCR-amplified products of
internalin genes ……………………………………..……………………................... 62
Figure 4.5 The representative agarose gel picture of PCR-amplified products of inlA
gene and after digestion by XbaI ……………………………………........................... 63
Figure 4.6 The representative agarose gel picture of PCR-amplified products of inlC
gene and after digestion by AluI ..…………………………………............................. 64
Figure 4.7 The representative gel picture of REP-PCR for L. monocytogenes
isolated from RTE food samples .……………………………………......................... 68
Figure 4.8 Dendrogram based on the REP-PCR patterns of L. monocytogenes
isolates. …..…………………………………….......................................................... 69
Figure 4.9 The representative gel picture of BOX-PCR for L. monocytogenes
isolated from RTE food samples .…………………………………............................. 72
xii
Figure 4.10 Dendrogram based on BOX-PCR banding patterns of L. monocytogenes
isolates ..………………………………………............................................................ 73
Figure 4.11 The representative gel photo of RAPD for L. monocytogenes isolates
isolated from RTE food samples …………………………......................................... 76
Figure 4.12 Dendrogram based on RAPD banding patterns of L.
monocytogenes…………………………………………….......................................... 77
Figure 4.13 T The representative gel photo of PFGE for L. monocytogenes isolates
isolated from RTE food samples. …………………………….................................... 81
Figure 4.14 The representative gel photo of PFGE for L. monocytogenes isolates
isolated from RTE food samples ……………………………...................................... 82
Figure 4.15 The representative gel photo of PFGE for L. monocytogenes isolates
isolated from RTE food samples …………………………......................................... 83
Figure 4.16 The representative gel photo of PFGE for L. monocytogenes isolates
isolated from RTE food samples …….……………………........................................ 84
Figure 4.17 The representative gel photo of PFGE for L. monocytogenes isolates
isolated from RTE food samples …….……………………........................................ 85
Figure 4.18 Dendrogram based on the REP-PCR patterns of L. monocytogenes
isolates .…….……………………………………….................................................... 86
xiii
LIST OF TABLES
Table 2.1 Biochemical properties of Listeria species …..………………………. 19
Table 3.1 The primer sequences used for confirmation of Listeria spp. and L.
monocytogenes and the size of the expected amplicons ..…..………………………… 33
Table 3.2 The volumes of the components used for the duplex PCR targeting 16S
rRNA and LLO gene ………………………………………………………………..... 34
Table 3.3 The primer sequences used for the multiplex PCR serogrouping …... 36
Table 3.4 The volumes of the components used for the multiplex PCR
serogrouping ……………………………………………………………………..….. 37
Table 3.5 The primer sequences used for virulotyping ……………………...… 38
Table 3.6 The volumes of the components used for virulotyping ……………... 39
Table 3.7 The volumes of the components used for the monoplex PCR
amplifications targeting inlA gene ………………………………………………...… 40
Table 3.8 The volumes of the components used for the monoplex PCR
amplifications targeting inlC gene ……………………………………………….….. 41
Table 3.9 The volumes of the components used for REP-PCR ……………...… 42
Table 3.10 The volumes of the components used for BOX-PCR ………..……… 43
Table 3.11 The volumes of the components used for RAPD-PCR ………...…… 44
Table 4.1 Summery of biochemical reactions of Listeria spp. isolates ……...… 49
Table 4.2 Distribution of Listeria spp. and L. monocytogenes isolated in RTE foods
from street-side hawker stalls by location …………………..…………………….… 52
xiv
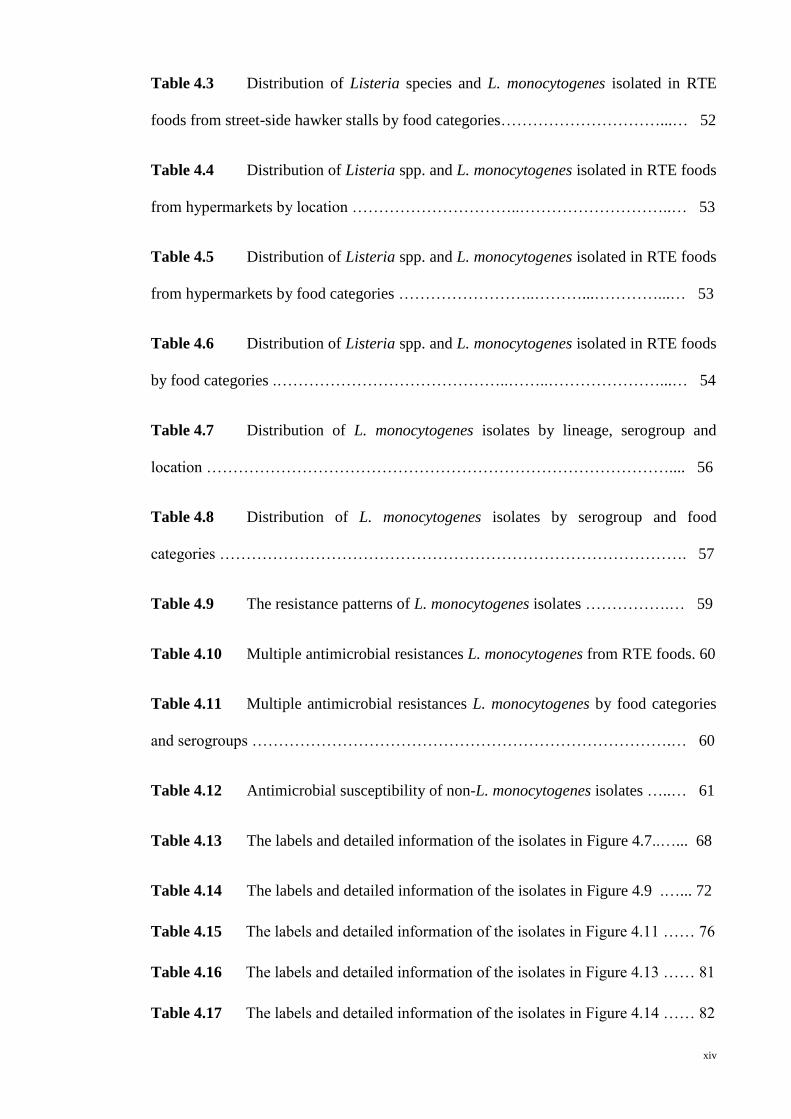
Table 4.3 Distribution of Listeria species and L. monocytogenes isolated in RTE
foods from street-side hawker stalls by food categories…………………………...… 52
Table 4.4 Distribution of Listeria spp. and L. monocytogenes isolated in RTE foods
from hypermarkets by location …………………………..………………………..… 53
Table 4.5 Distribution of Listeria spp. and L. monocytogenes isolated in RTE foods
from hypermarkets by food categories ……………………..………...…………...… 53
Table 4.6 Distribution of Listeria spp. and L. monocytogenes isolated in RTE foods
by food categories .……………………………………..……..…………………...… 54
Table 4.7 Distribution of L. monocytogenes isolates by lineage, serogroup and
location …………………………………………………………………………….... 56
Table 4.8 Distribution of L. monocytogenes isolates by serogroup and food
categories ……………………………………………………………………………. 57
Table 4.9 The resistance patterns of L. monocytogenes isolates …………….… 59
Table 4.10 Multiple antimicrobial resistances L. monocytogenes from RTE foods. 60
Table 4.11 Multiple antimicrobial resistances L. monocytogenes by food categories
and serogroups …………………………………………………………………….… 60
Table 4.12 Antimicrobial susceptibility of non-L. monocytogenes isolates …..… 61
Table 4.13 The labels and detailed information of the isolates in Figure 4.7..…... 68
Table 4.14 The labels and detailed information of the isolates in Figure 4.9 .…... 72
Table 4.15 The labels and detailed information of the isolates in Figure 4.11 …… 76
Table 4.16 The labels and detailed information of the isolates in Figure 4.13 …… 81
Table 4.17 The labels and detailed information of the isolates in Figure 4.14 …… 82

xv
Table 4.18 The labels and detailed information of the isolates in Figure 4.15 …… 83
Table 4.19 The labels and detailed information of the isolates in Figure 4.16 …… 84
Table 4.20 The labels and detailed information of the isolates in Figure 4.17 …… 85
xvi
ABBREVIATION
> Greater than
= Equals to
˚C Degree Celsius
μl Microliter
μg Microgram
% Percent
AMC Amoxicillin-clavulanic acid
Aw Water activity
bp Basepair
C Chloramphenicol
CFU Colony forming unit
CN Gentamicin
D Discriminatory Power
DA Clindamycin
dH2O Distilled water
ddH2O Double distilled water
DNA Deoxyribonucleic acid
E Erythromycin
xvii
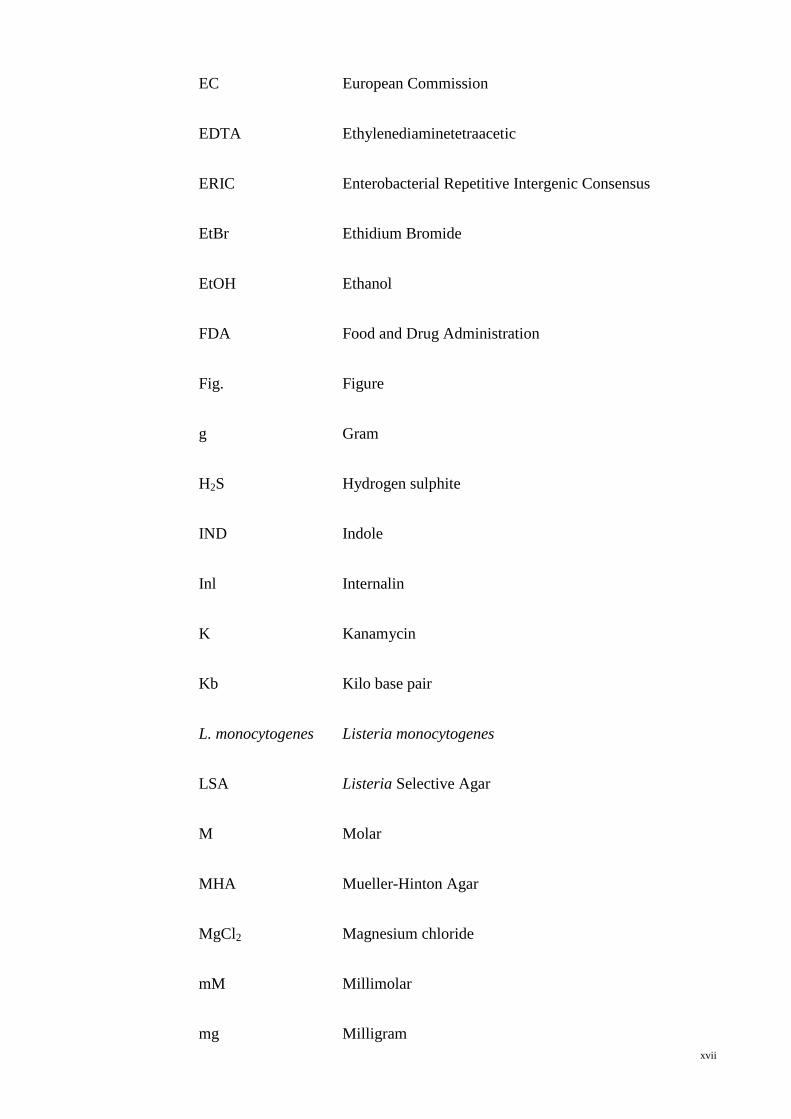
EC European Commission
EDTA Ethylenediaminetetraacetic
ERIC Enterobacterial Repetitive Intergenic Consensus
EtBr Ethidium Bromide
EtOH Ethanol
FDA Food and Drug Administration
Fig. Figure
g Gram
H2S Hydrogen sulphite
IND Indole
Inl Internalin
K Kanamycin
Kb Kilo base pair
L. monocytogenes Listeria monocytogenes
LSA Listeria Selective Agar
M Molar
MHA Mueller-Hinton Agar
MgCl2 Magnesium chloride
mM Millimolar
mg Milligram
xviii
ml Milliliter
mm Millimeter
MR Methyl Red
NaCl Sodium Chloride
No. Number
OD Optical density
P Penicillin G
PCR Polymerase Chain Reaction
PFGE Pulsed field gel electrophoresis
RD Rifampicin
Ref. Reference
REP Repetitive element sequence-based
rRNA Ribosomal ribonucleic acid
S Streptomycin
SDS Sodium dodecyl sulphate
SIM Motility test
Spp. Species
SXT Trimethoprim-sulfamethoxazole
Te Tetracycline
TBE Tris-borate-EDTA
xix
TE Tris-EDTA
Tris Tris (Hydroxymethyl) methylamine
TSA Tryptic Soy Agar
TSB Tryptic Soy Broth
TSAYE Tryptic Soy Agar with Yeast Extract
TSI Glucose
UV Ultraviolet
Va Vancomycin
VP Voges-proskaur
w/v Weight per unit volume
5’-CS 5 conserved segment
3’-CS 3 conserved segment

1
CHAPTER 1
INTRODUCTION
2
The genus Listeria comprises ten species: Listeria monocytogenes, Listeria
ivanovii, Listeria seeligeri, Listeria innocua, Listeria welshimeri, Listeria grayi,
Listeria marthii, Listeria rocourtiae, Listeria fleischmannii, and Listeria
weihenstephanensis (Halter et al., 2012). These are Gram-positive, short rods, non-
spore, able to grow from pH 4.3 to 9 (Groski, 2008), ~ 0°C to 45°C (Lou & Yousef,
1999), salt content 10% and 200 ppm NaNO2, (Wanger & McLauchlin, 2008) and
motile species are widespread in nature (Fenlon, 1985). Member of the genus Listeria is
known to have the ability to tolerate environmental stresses. Of particular concern is
that Listeria spp. is osmotically tolerant and grow at refrigerated temperatures (Endang
et al., 1998).
L. monocytogenes has emerged as a foodborne pathogen with the first confirmed
case in 1981 linked to contaminated coleslaw. It is responsible for the disease listeriosis,
which can cause severe malaise in pregnant women, new-born babies, the advanced age
and persons suffering from a weakened immune system. Without treatment, listeriosis
can develop into septicaemia, encephalitis, meningitis and meningoencephalitis as well
as stillbirths and abortion (Montville & Matthews, 2008). With a mortality rate fast
approaching 30%, it is considered to exceed those of common foodborne pathogens
such as Salmonella enteritidis, Campylobacter species and Vibrio species (Altekruse et
al., 1997; Mead et al., 1999; Montville & Matthews, 2008). L. monocytogenes is most
commonly found in vegetables, meat, dairy products, seafood products, ready to eat
(RTE) foods and especially products that are kept at refrigeration temperature as L.
monocytogenes can grow at these low temperatures (Meng & Doyle, 1997; Gugnani,
1999).
The conventional methods are the most common methods applied to detect L.
monocytogenes that rely on the use of microbiological media to selectively grow and
enumerate this pathogen. These methods are inexpensive, sensitive and provide results
3
that are both qualitative and quantitative. These methods are, however, time consuming
and labour-intensive (De Boer & Beumer, 1999). The approved methods that are
currently been using for the detection of L. monocytogenes in foods include the Federal
Drug Administration (FDA) protocol, ISO-11290-1, Netherlands Government Food
Inspection Service (NGFIS) and US Department of Agriculture-Food Safety and
Inspection Service (USDA-FSIS) methods (Churchill et al., 2006).
Recent advances in molecular genetics have led to methods targeting unique
genes for amplification and subsequent differentiation. Therefore, using a unique gene,
L. monocytogenes can be distinguished from other Listeria spp. These methods are
intrinsically more accurate and less affected by natural variation than conventional
methods and offers high specificity, sensitivity and a rapid turnover that is essential for
producers of minimally processed food products (Liu, 2006).
Various Listeria determinants have been reported to mediate bacterial adherence
into target cells and invasion. inlA, inlB, inlC, and inlJ can increase the invasion or
virulence of the pathogen in animal models or tissue cultures. (Bierne & Cossart, 2002;
Orsi et al., 2007; Sant'Ana et al., 2012). Following ingestion of contaminated food, L.
monocytogenes can be cause of infection by invading intestinal epithelial cells. The
internalin is associated with a receptor on the surface of the host for invasive process
(Dramsi et al., 1997; Gaillard et al., 1996). Intestinal epithelial cells need inlA for
internalization. For entry of L. monocytogenes to a wide range of the cell line, such as
non-epithelial cells and hepatocytes, inlB is involved (Hamon et al., 2006). On the other
hand, the presence of inlC and inlJ genes increase the pathogenicity of L.
monocytogenes and could be a rapid method to differentiate non-virulent strains of the
pathogen from virulent strains (Liu et al., 2007).
4
Studies on the genomic variation and molecular epidemiology of L.
monocytogenes often carried out to track sources and spread of the pathogen. Repetitive
Extragenic Palindromic (REP-PCR) (Liu, 2006), BOX-PCR (Miteva et al., 1998),
Random Amplification of Polymorphic DNA (RAPD) (Gravesen et al., 2000), and
Pulsed Field Gel Electrophoresis (PFGE) (Liu, 2006) are appropriate typing methods for
L. monocytogenes strains because of their reproducibility and high discriminatory
ability. They have been well utilized in order to compare strains for epidemiological
surveillance (Houhoula et al., 2012; Lukinmaa et al., 2004; Miteva et al., 1998).
Furthermore, the incidence of listeriosis cases in Malaysia is relatively unknown
as no system for reporting cases are in place. Information regarding the prevalence and
genetic diversity of this pathogen in Malaysia is also limited. Hence, to improve the
basic knowledge of the incidence and characteristics of Listeria monocytogenes, the
present study was undertaken.
The objectives of this research were:
1. To isolate and identify Listeria spp. and L. monocytogenes by conventional and
molecular methods and to determine the prevalence of L. monocytogenes in
ready to eat (RTE) foods.
2. To determine the prevalence of virulence genes, inlA, inlB, inlC, and inlJ genes
in L. monocytogenes and to determine the polymorphism of inlA and inlC
genes.
3. To determine the antimicrobial susceptibility statues of Listeria monocytogenes
4. To investigate the genetic diversity of the L. monocytogenes from different food
matrices.

5
CHAPTER 2
LITERATURE REVIEW
6
2.1 Listeria species
The history of Listeria and L. monocytogenes is relatively recent with the first
published description of the bacteria by Murray in 1926. Up to the 1970s, the
relationship of Listeria to other bacteria remained unclear. These bacteria were included
in the fourth edition of Bergey’s Manual of Determinative Bacteriology and were
included in the Corynebacteriaceae family under the genus Kurthia. Based on
morphological resemblances, Listeria was grouped in the coryneform group of bacteria,
being Gram-positive and a non-endospore-forming rod. However, with the development
and introduction of new methods and technologies such as numerical taxonomy,
chemotaxonomy, DNA/DNA hybridation and ribosomal RNA gene sequencing, the
phylogenetic position of Listeria has become clearer. During the last three decades,
information and data was accumulated and Listeria is recognized with distinctive
characteristics. It is not a coryneform bacteria, as previously thought, having a low G +
C % content, the presence of lipoteichoic acid and absence of mycolic acids (Rocourt,
1999).
The Listeria genus was for many years mono-specific containing only L.
monocytogenes, the type species. With the introduction of molecular methods, the
diversity within the genus Listeria is better understood and now only contains L.
monocytogenes, L. ivanovii, L. seeligeri, L. innocua, L. welshimeri, L. grayi, L. marthii,
L. rocourtiae, L. fleischmannii, and L. weihenstephanensis (Halter et al., 2013; Zhang et
al, 2007). L. monocytogenes is known as a pathogenic species to animals and human
while L. ivanovii is considered as a pathogenic species to animals (Bhunia, 2008).
The morphology of Listeria can be described as a small (1 - 2 µm in length and
0.5 µm in diameter), regular, Gram-positive rod with rounded ends. The cells can be
found alone or in groups, including short chains or V and Y arranged forms depending
on the growth conditions and temperature. They do not produce spores and do not form
7
capsules. The cells might sometimes be coccoid and when older, lose the ability to
retain Gram stain. The bacterial cells can then be mistaken for streptococci or
Haemophilus spp. (Jorgensen et al., 1995; Bhunia, 2008). When cultured at 20°C -
25°C, Listeria is motile due to the formation of a few eritrichous flagella. These flagella
are very weak or absent when Listeria is cultured at 37 °C (Galsworthy et al., 1990).
Listeria can be classified as facultatively anaerobic, microaerophilic, aerobic
(Seeliger, 1961). Listeria species are psychrophilic and could grow at various
temperatures (0°C - 45°C), however, grow below 0°C has been reported (Junttila et al.,
1988; Walker et al., 1990). Although, at pH7 Listeria genus shows an optimal growth,
they could growth at various pH ranges of 4.4 - 9.6 (George & Lund, 1992). At pH
values below 4.3, cells do not grow but may survive (Montville & Matthews, 2008).
Listeria cells can also tolerate a 10 % (w/v) NaCl solution and survive at even higher
concentrations (Seeliger & Jones, 1986). The survival at high salt concentrations and
low pH is strongly temperature dependent (Cole et al., 1990). Listeria species grow best
at water activity (Aw) values = 0.97, but some of isolates also grow at an Aw value
below 0.93, which is rare for foodborne pathogens. Listeria species may even survive at
Aw values 0.83 for long periods of time. It has also been shown that the heat resistance
of Listeria species increases as the Aw decreases (Farber et al., 1992; Montville &
Matthews, 2008). Having these extreme tolerances regarding pH, temperature, water
activity and salt conditions (Sleator et al., 2003; Liu et al., 2005) makes the survival of
this genus in environments. Surface water, soil, sewage, and foods have been identified
as suitable environments for the survival and subsequent isolation of Listeria species
(Liu, 2006).
8
2.2 Listeria monocytogenes
L. monocytogenes is a ubiquitous Gram-positive, psychrotrophic, non-capsule,
non-spore, (De Oliveira et al., 2010), foodborne pathogen (Aureli et al., 2000; Salamina
et al., 1996; Sim et al., 2002) that is the known cause of listeriosis (De Vasconcelos et
al., 2008). L. monocytogenes is ß-hemolytic, catalase-positive, oxidase-negative and
possesses glucose oxidase and NADH oxidase activities (Farber & Peterkin, 1991). It is
highly motile at low temperatures (up to 28°C) and less motile or non-motile at 37°C
(Kamp & Higgins, 2011). The resistant nature of L. monocytogenes is associated with
genetic determinants that encode various components of potential stress response
systems (Gandhi and Chikindas, 2007). The bacteria have been reported from
environments, soils, surface water, animal faeces, vegetation, sewage, silage (Cocolin et
al., 2005; Liu, 2008). It can also be found in the human body and in healthy humans.
One to five percent of the world’s population is reported to serve as carriers of these
bacteria (Bhunia, 2008). L. monocytogenes has been isolated from a variety of raw and
processed foods (Gugnani, 1999; Meng & Doyle, 1997). Due to the lack of good
agricultural practices, vegetables are especially prone to microbiological contamination
by the use of untreated water or contaminated organic fertilisers (Francis et al., 1999).
L. monocytogenes thrives as a saprophyte in decomposed organic material and as
an intracellular pathogen in macrophages (Liu, 2008). The transmission route for L.
monocytogenes in humans is primarily via foods, however other routes of transmission
have also been identified, including nosocomial and occupational (animal handlers can
become infected primarily by open skin wounds) (Bell and Kyriakides, 2005). It was
not until 1980s that L. monocytogenes was known as a major food-borne pathogen.
Since then numerous Listeriosis outbreaks have been documented. Outbreak
investigative efforts have led to increased understanding of this pathogen. Nonetheless
more than three decades since the first major outbreak, L. monocytogenes remains a key
9
food-safety threat due to the high case fatality rate associated with listeriosis (Scallan et
al., 2011).
Based on the somatic (O) and flagellar (H) antigens, Listeria has been divided
into number of serovars which are ascertained on the basis of unique combinations of O
and H antigens. L. monocytogenes includes thirteen distinct serovars (1/2a, 3a, 1/2b, 3b,
1/2c, 3c, 4a, 4b, 4ab, 4c, 4d, 4e, and 7). With the use of various subtyping techniques,
including serotyping, twelve serovars of the pathogen have been distributed into three
genetic lineages and or five phylogenetic groups. Lineage I separate into two
phylogenetic groups I.1 and I.2. Phylogenetic group I.1 contains the serovars “1/2a, 3a”
and phylogenetic group I.2 comprises two serovars “1/2c, 3c”. Lineage II also divide
into two phylogenetic groups which phylogenetic group II.1 contains the serovars “4b,
4d, and 4e” and phylogenetic group II.2 includes the serovars “1/2b, 3b, 7”. Lineage III
contains two serovars 4a and 4c (Doumith et al., 2004a). The lineage II is responsible
for most of human listeriosis outbreaks and has the highest pathogenic potential. Those
of lineage I have intermediate pathogenic potential and are usually isolated from
environments and food categories and those from lineage III have a low pathogenic risk,
usually are animal pathogens (Doumith et al., 2004b).
Serovars 1/2a, 1/2b and 4b have been identified as the serovars responsible for
the majority of listeriosis cases (De Vasconcelos et al., 2008; Doumith et al., 2004b;
Vines & Swaminathan, 1998). Doumith et al. (2004b) interestingly found that while
serovar 4b, from lineage II, which is considered the most virulent and responsible for
the majority of epidemic listeriosis cases, it was in fact serovar 1/2a, from lineage I that
was most frequently isolated from contaminated food. This result was in agreement with
reports by Kathariou (2002), Gray et al. (2004), Jacquet et al. (2004) and Ramaswamy
et al. (2007) and may indicate that not all food contaminated with L. monocytogenes
will evoke a listeriosis epidemic.
10
L. monocytogenes is pathogenic at the species level, but various strains display
varied virulence and pathogenic potential. There are strains that may be very virulent
and cause disease and others that are non-pathogenic and produce no apparent malaise
(Erdenlig et al., 2000; Gracieux et al., 2003; Doumith et al., 2004a). The difference
between these virulent and non-virulent strains is minimal as they possess the same
virulence gene cluster LIPI-1 (consisting of prfA, hlyA, plcA, mpI, actA, and plcB), and
all of the major virulence proteins involved in L. monocytogenes pathogenesis, but may
differ in the expression of these genes (Liu et al., 2003).
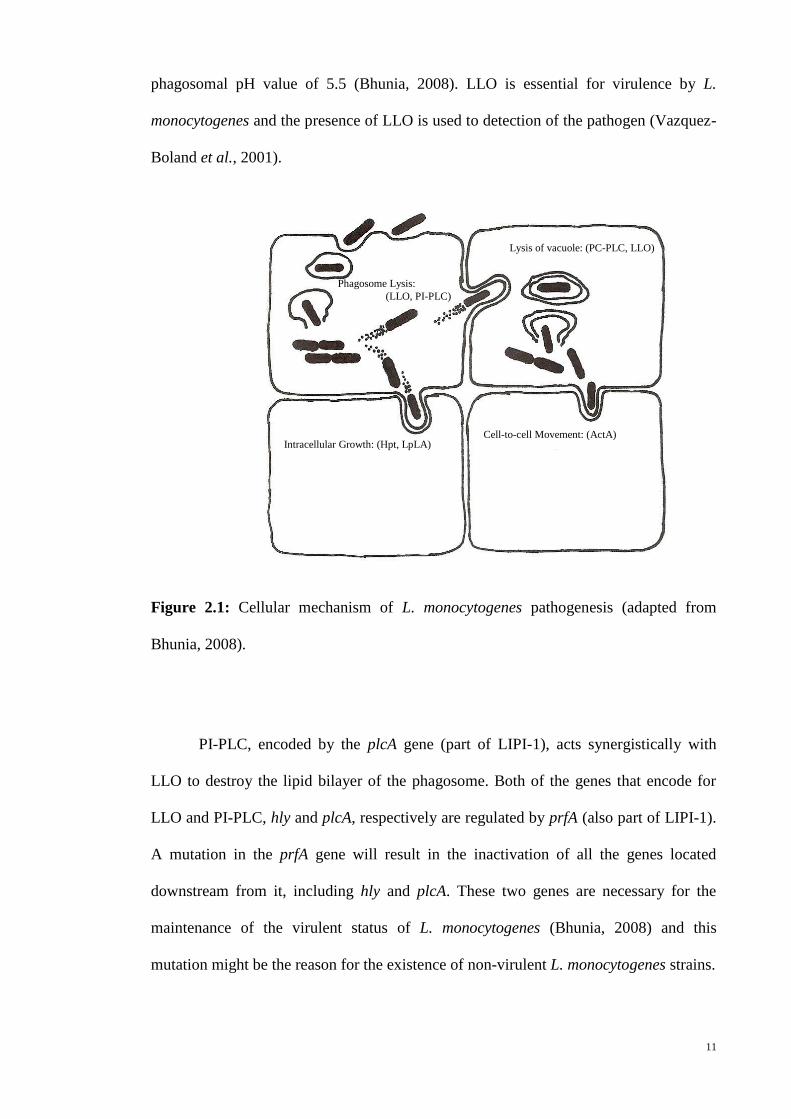
The cellular mechanism of L. monocytogenes pathogenesis can be divided into
four major steps, namely adhesion and invasion, lysis of vacuoles, intracellular growth
and cell-to-cell spread (Figure 2.1) (Bhunia, 2008). In each of these steps there are
various virulence proteins that are involved and necessary for Listeria pathogenesis. A
number of adhesion factors have been identified to be involved in the adhesion of the
bacterium to the host cell, namely internalin A (InlA), internalin B (InlB), virulence-
associated invasion protein (Vip), Listeria adhesion protein (LAP), fibronectin-binding
protein (Fbp), autolysin amidase (Ami), cell wall hydrolase (p60), lipoprotein
promoting entry (LpeA) and lipoteichoic acid (LTA).
After the bacterium has attached and entered the host cell, it is trapped inside a
vacuole (phagosome). Two virulence proteins have been identified that destroys the
phagosome and allows the bacterium to escape, namely Listeriolysin O (LLO) and
phosphatidylinositol-specific phospholipase C (PI-PLC) (Bhunia, 2008). LLO, encoded
by the hlyA gene (part of LIPI-1), is responsible for the haemolysis of blood cells and
the disruption of eukaryote membranes (Kingdon & Sword, 1970). The function of
LLO, a bacterial pore-forming hemolysin, is to lyse the membranes of phagosomal
vesicles and to facilitate the escape of L. monocytogenes into the cytoplasm of the cell
(Decatur & Portnoy, 2000). The maximum cytolytic activity of LLO coincides with the
11
Phagosome Lysis:
(LLO, PI-PLC)
Lysis of vacuole: (PC-PLC, LLO)
Cell-to-cell Movement: (ActA) Intracellular Growth: (Hpt, LpLA)
phagosomal pH value of 5.5 (Bhunia, 2008). LLO is essential for virulence by L.
monocytogenes and the presence of LLO is used to detection of the pathogen (Vazquez-
Boland et al., 2001).
Figure 2.1: Cellular mechanism of L. monocytogenes pathogenesis (adapted from
Bhunia, 2008).
PI-PLC, encoded by the plcA gene (part of LIPI-1), acts synergistically with
LLO to destroy the lipid bilayer of the phagosome. Both of the genes that encode for
LLO and PI-PLC, hly and plcA, respectively are regulated by prfA (also part of LIPI-1).
A mutation in the prfA gene will result in the inactivation of all the genes located
downstream from it, including hly and plcA. These two genes are necessary for the
maintenance of the virulent status of L. monocytogenes (Bhunia, 2008) and this
mutation might be the reason for the existence of non-virulent L. monocytogenes strains.
12
After the bacterium has escaped from the phagosome, it first multiplies before
moving into a new cell. Although several protein factors are involved during this step,
they are not regarded as major virulence proteins. Hexose phosphate translocase (Hpt)
and lipoate protein ligase (LpLA1) are expressed to utilise host-derived glucose and
lipoic acid for multiplication (Bhunia, 2008). After multiplication, the bacteria spreads
to new cells. Three virulence proteins have been identified which aids in this spread,
namely actin polymerisation protein (ActA), PC-PLC and zinc metalloprotease (MpI).
All three of the genes that encode for ActA, PC-PLC and MpI, namely actA, plcB and
mpI, are part of LIPI-1 and regulated by prfA (also part of LIPI-1). A mutation in the
prfA gene will result in the inactivation of all the genes located downstream from it,
including actA, plcB and mpI. A mutation in the actA gene itself will lead to mutant
strains that are unable to accumulate actin and, therefore, unable to infect adjacent cells.
A mutation in either the plcB or mpI genes will also lead to reduced virulence (Bhunia,
2008).
2.2.1 Internalin A, internalin B and the internalin Family
InlA and inlB are expressed from adjacent genes transcribed both independently
and biciscronically from the inlAB locus (Gaillard et al., 1991). They were identified in
a genetic screen of L. monocytogenes transposon-insertion mutants unable to invade the
enterocyte-like colon carcinoma cell line Caco-2 (Gaillard et al., 1991). In the study,
inlA was found to be necessary for attachment and invasion, and inlA was sufficient to
reconstitute invasion when expressed in the non-invasive species L. innocua. Southern
Blot analysis with an inlA-based probe suggested that inlA and inlB were members of a
larger highly homologous family (Gaillard et al., 1991). The family now includes at
least nine additional members: inlC, inlC2, inlD, inlE, inlF, inlG, inlH, inlI, and inlJ. In
addition, there are also at least 15 Internalin-like genes identified through genomic
13
analyses (Engelbrecht et al., 1996; Lingnau et al., 1996; Dramsi et al., 1997; Domann et
al., 1997; Raffelsbauer et al., 1998; Cabanes et al., 2002; Bierne et al., 2007; Bierne &
Cossart, 2007; McGann et al., 2008; Sabet et al., 2008). Only inlA and inlB are well
understood. The defining characteristic of internalins is a leucine rich repeat (LRR)
domain of 3 to 28 repeats of 22 amino acids each. Each repeat contains a short ß-strand
and a spatially larger 310-helix and each LRR wraps in a right-handed direction to stack
upon one another. The entire LRR domain takes a solenoid 'sickle' shape with parallel
stacked ß-strands forming the concave face and stacked 310-helix forming the convex
face (Marino et al., 1999, 2000; Schubert & Heinz, 2003; Bierne et al., 2007). In
addition, each repeat is rotated ~5 degrees with respect to its predecessor giving the
sickle-shaped solenoid a superhelical twist (Marino et al., 1999, 2000; Schubert et al.,
2001; Schubert et al., 2002; Schubert and Heinz, 2003; Bierne et al., 2007).
A N-terminal cap and an Ig-Like IR domain always flank the LRR domain and it
is thought that these domains stabilize the LRR domain by shielding the hydrophobic
core from an aqueous environment (Schubert and Heinz, 2003). Internalin and
internalin-like proteins all have an N-terminal signal sequence suggesting that these
proteins are processed to the bacterial surface by the general secretory pathway
(Rafelski & Theriot, 2006; Bierne et al., 2007). All but inlC, a secreted internalin, are
attached to the bacterial surface, generally through a Cterminal peptidoglycan-anchoring
sequence (e.g. LPXTG) or C-terminal domains that associate non-covalently with the
bacterial cell wall (e.g. GW domains that bind lipoteichoic acid) (Engelbrecht et al.,
1996).
14
2.3 Listeria monocytogenes in foods
In recent years, ready-to-eat (RTE) foods have been implicated in outbreaks of
listeriosis. Ready-to-eat foods, smoked fish, cooked marinated products, meat products,
and vegetables were found to be contaminated with L. monocytogenes (Meloni et al.,
2009). Numerous food surveys conducted in Malaysia had reported on the detection of
L. monocytogenes in various types of foods, including raw and RTE foods (Marian et
al., 2012), raw salad vegetables (Ponniah et al., 2010), burger patties (Wong et al.,
2012) and vegetarian burger patties (Wong et al., 2012). However, the actual incidence
of foodborne listeriosis cases in Malaysia is not known. There is no official data on food
poisoning/infection caused by L. monocytogenes in Malaysia because L. monocytogenes
is rarely tested in the food poisoning/infection cases.
2.4 Listeriosis
The first confirmed case of human listeriosis was diagnosed at the end of World
War I from a soldier suffering from meningitis. The most susceptible/highest risk group
includes pregnant women, neonates, the elderly and immuno-suppressed individuals
such as those with HIV, cancer patients receiving chemotherapy or patients receiving
treatment for organ transplantation (Vazquez-Boland et al., 2001). The initial symptoms
of human listeriosis include fatigue, chills, headache, and also gastroenteritis. Without
treatment, the disease can develop into septicaemia, abortion, meningitis, encephalitis
and finally death (Vazquez-Boland et al., 2001).
L. monocytogenes has a range of virulence factors that enables it to cross the
cerebrospinal, intestinal and placental barriers. The organism escapes the human
immune surveillance system by internalisation (moving into the cells) and then
multiplying in the cytosol of infected cells (Wiedmann, et al., 1997). Pregnant women
15
infected with L. monocytogenes may transfer the disease to their fetuses, which could
lead to abortion, stillbirth or the premature birth of an infected child (Seeliger & Jones,
1986; Spencer, 1987).
The mortality rate of infection with L. monocytogenes is approaching 30%,
which indicates a high fatality: case ratio and exceeds those of common foodborne
pathogens such as Salmonella Enteritidis, Campylobacter spp. and Vibrio spp.
(Altekruse et al., 1997; Mead et al., 1999; Montville and Matthews, 2008). The
infectious dose of L. monocytogenes is still unknown, but depends on the virulence of
the microbe, the immunological status of the human and the contaminated food. Studies
with test animals indicated that by reducing the exposure levels reduces the incidence of
clinical disease. Foods responsible for serious outbreaks all had >100 cfu g-1
L.
monocytogenes, however, more epidemiologic data is needed to accurately determine
the infectious dose (McLauchlin et al., 2004; Montville & Matthews, 2008).
As the infectious dose is still unknown, the official regulations regarding L.
monocytogenes vary among food products, as well as countries. Regulations range from
a “zero tolerance” level in the United States issued by the Food and Drug
Administration (FDA) for RTE foods (Chen et al., 2003), to an absence in 1 g in
Europe, and to less than 100 cfu g-1
in RTE foods that do not support the growth of the
pathogen at the time of consumption, also in Europe (EC, 1999; Anonymous 2005).
Listeriosis epidemics have been reported in the past years, but usually occur
sporadically with only 2 to 15 cases per million people per year (Farber & Peterkin,
1991; Jacquet et al., 1995). However, 2500 cases of human listeriosis are still reported
annually in the United States and of these cases 500 deaths have been reported (Mead et
al., 2006; Montville and Matthews, 2008). Although regulations regarding L.
monocytogenes contamination in food are implemented and strictly adhered to, the
16
major cause of listeriosis is considered to be the ingestion of contaminated food (Farber
& Peterkin, 1991). Six major outbreaks of listeriosis were reported between 1979 and
1999 in North America. The cause was the ingestion of contaminated food sources as
diverse as commercially prepared coleslaw, lettuce, carrots, pork tongue in jelly, paté,
milk that was contaminated after pasteurisation, chocolate milk, soft cheese made from
unpasteurised milk and hot dogs (Donnelly, 2001). The listeriosis outbreak due to
contaminated hot dogs was attributed to hot dog meat contamination levels of <0.3 cfu
g-1
(Donnelly, 2001). This further provides evidence for the very low, but still unknown,
infectious dose. These relatively recent listeriosis outbreaks due to contaminated food
products have highlighted the importance and necessity of continued surveillance of L.
monocytogenes in RTE foods (Farber & Peterkin, 1991; Jacquet et al., 1995; Liu et al.,
2003).
2.5 Detection methods of L. monocytogenes and Listeria spp.
To be able to distinguish L. monocytogenes from other Listeria species, a rapid,
specific and sensitive test is essential. The quick and accurate detection of L.
monocytogenes will lead to the control of the spread of this organism. Two types of
detection methods will be discussed, conventional and molecular methods.
2.5.1 Conventional methods of detection of Listeria
Listeria spp. and L. monocytogenes in food samples often grow in competition
with other non-target micro-organisms and are often injured as a result of freezing,
heating, drying, irradiation or exposure to chemicals (Bunduki et al., 1994). To be able
to detect Listeria spp. a primary and secondary enrichment procedure (half and full
strength Fraser broth) is essential to recover the sublethally injured L. monocytogenes.
17
After the food samples have been enriched various identification methods, which
generally cannot recover the sublethally injured Listeria, are used. These methods
include cultural and biochemical confirmation, ß hemolysis, the Christie Atkins Munch-
Petersen (CAMP) test and more recently chromogenic substrates.
2.5.1.1 Cultural and biochemical confirmation of Listeria spp. and L.
monocytogenes
The earliest identification methods for Listeria species relied on biochemical and
phenotypic characteristics and are still widely used. However, attempted isolation of
Listeria from non-selective media had little success as most food specimens are
naturally contaminated with large numbers of other micro-organisms and only contain a
small number of Listeria spp. (Donnelly, 1999). Inhibition of these indigenous micro-
organisms, as well as the resistance of Listeria to various antibiotics, have led to the
formulation of selective agars. Selective agents such as glycine anhydride,
phenylethanol, lithium chloride and antibiotics have been added to the media to enable
the isolation of Listeria in the presence of Gram-negative bacteria and to inhibit Gram-
positive contaminants, such as Staphylococcus and Pseudomonas. McBride Listeria
agar, LPM agar, Oxford agar, MOX agar, Listeria selective agar, and PALCAM agar
are used for the isolation of Listeria spp. (Donnelly, 1999; Adam & Moss, 2008).
The Henry technique, an oblique illumination technique was developed to
facilitate the recognition of Listeria colonies on blood-free media. Using the Henry
technique, plates are tested under obliquely transmitted white light at an angle of 45°
with a binocular scanning microscope. Listeria colonies would appear small and round
and have a blue-gray to blue-green appearance (Adams & Moss, 2008). Some media,
such as Oxford agar, incorporates aesculin and ferric ammonium citrate to produce a
18
visible colour change which would eliminate the use of the Henry technique (Adams &
Moss, 2008). Oxford agar is prepared from Columbia agar base, selective agents and
aesculin and ferric ammonium citrate, with the latter two as differential agents. The
aesculinase reaction is used to differentiate Listeria from other bacteria (Curtis et al.,
1989). The ß-D-glucosidase activity of Listeria hydrolyses aesculin, producing a black
zone surrounding typical colonies due to the formation of black iron phenolic
compounds derived from the aglucon after 48 hours of incubation (Greenwood et al.,
2005). The selective agents added to Oxford agar, namely lithium chloride,
cycloheximide, colistin sulphate, acriflavine, cefotetan and fosfomycin inhibit the
growth of other micro-organisms. Unfortunately, Enterococcus and Bacillus spp. will
also grow on these selective plates and also utilise aesculin. Further tests, therefore, are
required to conclusively identify colonies of Listeria.
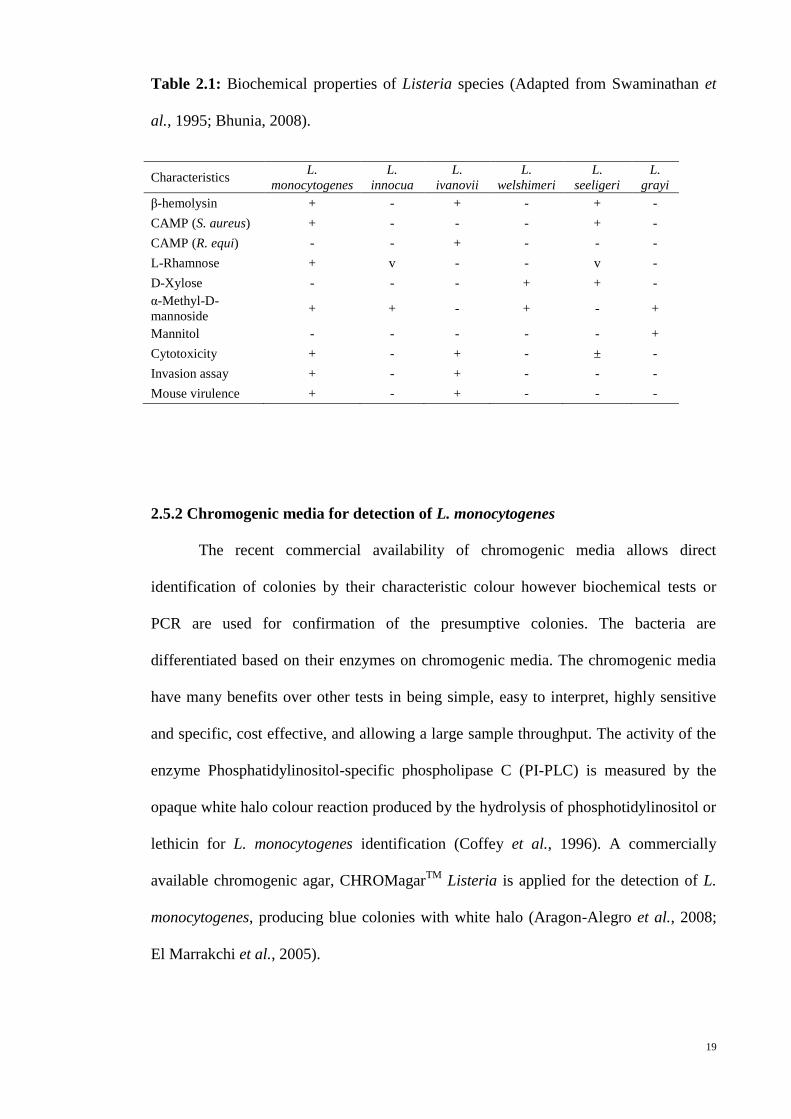
These second step tests, used to determine if suspect colonies are L.
monocytogenes, rely on the unique biochemical and ß-hemolysis characteristics of each
of the Listeria species (Table 2.1) as they all exert the same phenotype (morphology)
(Montville & Matthews, 2008). These tests include acid production from xylose,
rhamnose, mannitol and alpha-methyl-D-mannoside, ß-hemolysis and the Christie
Atkins Munch-Petersen (CAMP) test.
19
Table 2.1: Biochemical properties of Listeria species (Adapted from Swaminathan et
al., 1995; Bhunia, 2008).
Characteristics L.
monocytogenes
L.
innocua
L.
ivanovii
L.
welshimeri
L.
seeligeri
L.
grayi
β-hemolysin + - + - + -
CAMP (S. aureus) + - - - + -
CAMP (R. equi) - - + - - -
L-Rhamnose + v - - v -
D-Xylose - - - + + -
α-Methyl-D-
mannoside + + - + - +
Mannitol - - - - - +
Cytotoxicity + - + - ± -
Invasion assay + - + - - -
Mouse virulence + - + - - -
2.5.2 Chromogenic media for detection of L. monocytogenes
The recent commercial availability of chromogenic media allows direct
identification of colonies by their characteristic colour however biochemical tests or
PCR are used for confirmation of the presumptive colonies. The bacteria are
differentiated based on their enzymes on chromogenic media. The chromogenic media
have many benefits over other tests in being simple, easy to interpret, highly sensitive
and specific, cost effective, and allowing a large sample throughput. The activity of the
enzyme Phosphatidylinositol-specific phospholipase C (PI-PLC) is measured by the
opaque white halo colour reaction produced by the hydrolysis of phosphotidylinositol or
lethicin for L. monocytogenes identification (Coffey et al., 1996). A commercially
available chromogenic agar, CHROMagarTM
Listeria is applied for the detection of L.
monocytogenes, producing blue colonies with white halo (Aragon-Alegro et al., 2008;
El Marrakchi et al., 2005).
20
2.5.3 Molecular detection of Listeria spp. and L. monocytogenes
The low numbers of the Listeria spp. is one of the most important problems
encountered during detection of the pathogen in contaminated food samples (Hoffman
& Weidmann, 2001). Molecular methods have proven to be useful in detecting low
numbers of Listeria spp., due to the fact that low concentrations of DNA can be
specifically detected or amplified (Churchill et al., 2006). Molecular methods detect
differences at the DNA level and can differentiate between micro-organisms at the
genus, species and even sub-species level (Liu et al., 2003).
PCR has many advantages including high throughput processing, a level of
automation, and a relatively short reaction time. It also shows an increase in sensitivity
over culturing methods. The inability of some cells to grow in selective media due to
low numbers is also excluded as PCR amplifies the specific genetic signals from as little
as only a few cells (Shearer et al., 2001). The targets of amplification in L.
monocytogenes are listeriolysin O gene (Bessesen et al., 1990; Border et al., 1990;
Deneer and Boychuk, 1991; Furrer et al., 1991; Thomas et al., 1991; Niederhauser et
al., 1992; Wong et al., 1992), iap gene (Niederhauser et al., 1992), Dth18-gene
(Wernars et al., 1991), and 16S RNA (Border et al., 1990). Enrichment cultures were
usually obtained and cell lysed for the PCR analysis (Thomas et al., 1991; Niederhauser
et al., 1992).
21
2.6 Molecular subtyping methods
2.6.1 PCR-based subtyping techniques for L. monocytogenes
2.6.1.1 Randomly amplified polymorphic DNA (RAPD) and arbitrarily primed
PCR (AP-PCR)
Both randomly amplified polymorphic DNA (RAPD) and arbitrarily primed
PCR (AP-PCR) use low-stringency PCR amplification to generate anonymous DNA
fragments that are strain-specific. The primers applied for RAPD and AP-PCR are
single, short and of arbitrary sequence. These primers are used at relatively low
temperatures (around 36°C) during PCR, thus effectively lowering the stringency of the
primer-annealing temperature. This in turn allowing the annealing of a random primer
that shows a perfect match of two or three nucleotides between the template strand and
the 3’ end of the primer. When annealing and priming occur within a certain distance
from one another, the sequence that lies between these two sites can be amplified
(Farber & Addison, 1994; O’Donoghue et al., 1995). A comparison between strains or
isolates can only be made if the same primer is applied for all the test samples.
Otherwise, the fragments yielded would be of no importance as the amount and sizes of
the fragments would conflict because of the different primers used. The test samples
also have to be pure cultures to avoid contamination and subsequent deceiving or
misleading results (Lawrence & Gilmour, 1995). This technique has been applied to
trace the source of L. monocytogenes contamination in vegetable (Aguado et al., 2004)
and poultry (Lawrence & Gilmour, 1995) processing plants. In the year-long study by
Lawrence and Gilmour (1995), samples were taken throughout the year, cultured, and
RAPD analysis was performed on the isolates. The results indicated that there were two
strains of L. monocytogenes that remained and were persistent in the processing plant
throughout the year. They were able to determine the source of the contamination as the
22
incoming birds and also demonstrated that there are transitory strains that were isolated
which probably came from a variety of contamination sources.
In a study by Ertas and Seker (2005) the presence and genetic variation of L.
monocytogenes in fresh fish was investigated. Of the 150 fish (Capoeta capoeta umbla)
caught, only 10 fish were positive for L. monocytogenes. The genetic variation of these
10 isolates were analyzed by RAPD and two distinctive and reproducible RAPD
profiles were generated. The different band profiles indicate the feasibility that the L.
monocytogenes isolates are from different sources. However, the genetic relationship
between the isolates needed more discriminative typing techniques (Ertas & Seker,
2005).
Franciosa et al. (2001) investigated 32 L. monocytogenes strains from listeriosis
outbreaks in Italy using AP-PCR, PCR-ribotyping and infrequent-restriction-site PCR
(IRS-PCR). The discriminatory ability of the three techniques was evaluated and was
found to be 0.714, 0.690 and 0.919 for PCR-ribotyping, AP-PCR and IRS-PCR,
respectively. IRS-PCR identified three clusters among the strains of the invasive
listeriosis outbreak compared to only two clusters by PCR-ribotyping and AP-PCR
each. Within each of the two non-invasive listeriosis outbreaks, the patterns obtained
were practically identical, confirmed by all three techniques. Only IRS-PCR could
clearly discriminate between the strains of the non-invasive and the invasive listeriosis
outbreaks.
AP-PCR and RAPD are faster and cheaper than other subtyping techniques and,
therefore, especially appropriate when testing less than fifty strains (Farber & Addison,
1994; O’Donoghue et al., 1995; Louie et al., 1996). AP-PCR can also be used
effectively for microbial source tracking and the results obtained can give an indication
of contamination sites within a food processing plant (Lawrence & Gilmour, 1995;
23
Churchill et al., 2006). However, the inconsistency in the discriminatory ability is the
disadvantage (Farber & Addison, 1994; O’Donoghue et al., 1995). Franciosa et al.
(2001) reported that AP-PCR gave less discriminatory results than ribotyping for the
subtyping of L. monocytogenes isolates involved in listeriosis outbreaks.
2.6.1.2 PCR-Restriction fragment length polymorphism (PCR-RFLP) of L.
monocytogenes
This method uses restriction endonucleases to cut DNA into fragments of
different lengths to obtain different band patterns. These band patterns can then be used
to define diversities in the genetic profiles of the organism (Smith & Nelson, 1999).
When genomic DNA is digested using restriction endonucleases, separated using
electrophoresis and analysed, different electrophoretic patterns of DNA bands are
visible, with a very high number of bands. Using genomic DNA would result in a gel
containing an abundant amount of DNA bands without adequate distinction between
them. This makes the interpretation of the results very difficult (Churchill et al., 2006).
It is, therefore, preferred to use an individual gene to minimize the amount of DNA
bands visible on the gel, which will result in an easier interpretation of the different
patterns. The method is, however, time consuming due to the need for using pure
cultures (Paillard et al., 2003).
There are variations in the pathogenic L. monocytogenes isolates obtained from
food samples and this could be due to deletions of one or more genes encoding for
virulence factors (Doumith et al., 2004b). However, there are also studies which
indicated that such virulence genes were regarded as a stable part of the L.
monocytogenes genome (Jaradat et al., 2003; Doumith et al., 2004b). The point
mutations of the internalin genes could be responsible to the reduced virulence in L.
24
monocytogenes and the production of a truncated internalin gene. PCR-RFLP can be
applied to recognize the internalin genes polymorphism (Rousseaux et al., 2004).
2.6.1.3 REP-PCR
L. monocytogenes, like other prokaryotic organisms, contains a genome with
repetitive sequence elements, which are randomly dispersed throughout the genome.
They include enterobacterial repetitive intergenic consensus sequences (ERICs) which
contains 124-147 base pairs (bp) and have a highly conserved central inverted repeat
and repetitive extragenic palindromes (REPs) which contain 35-40 bp and which also
have an inverted repeat. These ERIC and REP sequences are both ideal primer binding
sites for PCR amplification and could be used for both species and strain discrimination.
REP-PCR is known as an alternative subtyping method for L. monocytogenes. It is
rapid, less expensive and has a similar level of discrimination to ribotyping and PFGE
methods (Chou & Wang, 2006; Liu, 2006).
2.6.2 Ribotyping
Polymorphisms associated with ribosomal RNA operons are detected in DNA-
DNA hybridizations employing Southern hybridization. An rRNA gene probe is
appropriately labeled and is allowed to hybridize on a nylon membrane. For the most
part EcoRI has been the preferred restriction enzyme to digest the genomic DNA of L.
monocytogenes (Graves et al., 1999). Ribotyping has been extensively employed for
subtyping L. monocytogenes (Graves et al., 1994; Bruce et al., 1995; Weidmann et al.,
1997). The Riboprinter (DuPont-Qualicon, Wilmington, DE) is an automated ribotyping
system that produces and analyzes ribotyping patterns of bacteria. Therefore, this
method has the advantage of automation and standardization. However, resolution is
25
relatively limited, and ribotyping using the Riboprinter is typically limited to reference
laboratories due to the high cost of the equipment.
2.6.3 Pulsed-field gel electrophoresis (PFGE)
PFGE is based on the RFLP method and allows the differentiation of large DNA
fragments (10 kbp – 2000 kbp). The size limit of a normal agarose gel is around 20 to
40 kilo base pairs (kb). If larger fragments are separated, they would migrate at the
same rate and be visual on the gel as a single band (Churchill et al., 2006). PFGE uses
this characteristic as a basis for further separation. Large DNA fragments takes longer
than smaller fragments to change into their elongated shapes for movement. By
changing the direction of the electric field, it allows the smaller fragments to alter their
shape faster and thus commence migration at the limiting mobility rate. By changing the
angles and times of the electrophoretic field, it allows the resolution of larger DNA
fragments (Moore & Datta, 1994; Finney, 2000).
PFGE is divided into three steps, namely the preparation of agarose plugs with
unbroken genomic DNA incorporated into it, the digestion of these plugs with
infrequently cutting restriction nucleases to produce large digested fragments (Yde &
Genicot, 2004) and the electrophoresis of these fragments using PFGE, allowing
separation of fragments ranging in size from 10,000 base pairs (10 kb) to 2 million base
pairs (2 Mb) (Smith et al., 1987; Finney, 2000). The preparation of agarose plugs
minimizes the shearing and loss of DNA, which are commonly associated with the
liquid phase phenol extraction method. The DNA is, therefore, more intact and can be
stored for longer periods. The preparation of these plugs also decreases the risk of
exposure of virulent human pathogens to laboratory workers (Nair et al., 1999).
26
Several authors have applied this technique successfully for the epidemiological
investigations of listeriosis (Brosch et al., 1991, 1994; Buchrieser et al., 1993; Nguyen
et al., 1994; Jacquet et al., 1995; Proctor et al., 1995; Louie et al., 1996). Subtypes
within isolates which is indistinguishable by other subtyping methods are identifiable by
PFGE (Buchrieser et al., 1993; Brosch et al., 1991, 1994; Jacquet et al., 1995; Louie et
al., 1996).
L. monocytogenes isolates from two listeriosis outbreaks in the United States
were subtyped by PFGE (Moore & Datta, 1994). Moore and Datta (1994) digested the
DNA with SmaI and analyzed the band patterns. They found that the two listeriosis
outbreaks were not as closely related as previous data from serotyping suggested. In
terms of banding patterns, the isolates of each individual outbreak was more closely
related to one another, than between outbreaks. However, the isolates of L.
monocytogenes had the same serotype thus, the serotyping suggested that the two
outbreaks might be clonal (Moore & Datta, 1994).
PFGE is currently regarded as the gold standard subtyping method, due to the
high discrimination of this technique, reproducibility and the fact that the method is
standardized (Gerner-Smidt et al., 2006). The advantage of PFGE being highly
reproducible permits the construction of a database based on the different band patterns
obtained. This database can then be used for surveillance and also aid in determining the
possible vehicle of transmission or infection in listeriosis outbreaks or contaminations in
processing plants (Lyytikainen et al., 2006). While PFGE has the advantage of
providing a lot of information regarding strains and their differences, it is time
consuming, requiring at least three days to obtain results (Finney, 2000).
27
2.7 Antimicrobial susceptibility test
Many antimicrobial drugs inhibit Listeria in vitro. Some literature reported that,
L. monocytogenes is susceptible to wide range of antimicrobials like ampicillin,
erythromycin, kanamycin, streptomycin, nalidixic acid and others except for
cephalosporin and fosomycin/ fluoroquinolones (Abelardo et al., 2001; Hansen et al.,
2005; Aarestrup et al., 2007). However, it has been reported that resistant L.
monocytogenes strains were found frequently from time to time, even to common
conventional drugs like clindamycin, sulfomethoxazole (Shen et al., 2006) and also to
enrofloxacin (Antunes et al., 2002). Plasmid-borne resistance to chloramphenicol,
macrolides, and tetracycline has also been identified (FDA/CFSAN, 2003).
2.8 Treatment and prevention
L. monocytogenes is a poor competitor (Desse & Taye, 2001) that does not grow
in the presence of high competitor organisms like Lactic Acid Bacteria. Some scientists
use this principle for inhibiting its growth from different food samples. Listeriosis can
be treated by using conventional antimicrobials like ampicillin and penicillin following
diagnosis. However, the antimicrobial profile of the organism at particular place, like
within the country, and at the individual level has to be known to be effective in treating
patients and in reducing blind antimicrobial treatment, which may lead to the emergence
of antimicrobial drug resistant strains of L. monocytogenes.
Antibiotic therapy is the treatment of choice in most of the complications and
the dose and duration of the treatment differ accordingly. For instance, bacteriamia
should be treated for 14 days, if the patient is immuno-competent. Similarly, meningitis
should be treated for 21 days; while endocarditis for 4-6 weeks; and brain abscess for a
minimum of 6 weeks. Ampicillin without or with gentamycin is generally considered as
28
the preferred agent but other effective agents like co-trimaxazole can be used for
empirical antimicrobial treatment (Beek et al., 2002; Hansen et al., 2005).
Preventive measures have to target the organism's nature (conditions for its
normal growth) in addition to good sanitation and adequate heat treatment of food
before consuming. Moreover, its growth (doubling time) is much related on the pH,
temperature, type of the food sample and background of the microflora present (Morrow
et al., 2004). The ability of growth on widely temperatures (1°C to 45°C) is one of the
important characters in L. monocytogenes strains. There are large strain-to-strain
variations but some strains seem to be able to grow down to about –1.5°C. The
relationship between temperature and L. monocytogenes rate of multiplication was
studied and reported that the slower rate of multiplication was observed at colder
temperatures (Johan et al., 2004). L. monocytogenes is perished by pasteurization (72 to
75°C) such as non-sporing Gram-positive pathogens (Doyle, 1999).

29
CHAPTER 3
MATERIALS AND METHODS
30
3.1 Materials
3.1.1 Collection of samples
A total of 250 RTE samples were purchased from Carrefour (Midvalley Mega
Mall), Jusco (Midvalley Mega Mall), Pasar Chow Kit at PWTC, Pasar malam PJ-17,
food stalls around University of Malaya and University LRT station. A variety of RTE
food samples were purchased, including beverages (n=5; orange-flavoured drinks),
cooked chicken and chicken products (n=60; non-spicing fried chicken heart, gizzard,
leg and breast meat, satay, sausage, etc), cooked beef and beef products (n=13; cooked
beef meat, sausage, etc), cooked egg and egg products (n=28; fried eggs and hard-boiled
eggs without the shells, etc), packed lunch (n=6), salads and vegetables (n=85; salad,
potato salad, fruit salad, cucumber, tomatoes, been sprout, lettuce, etc), cooked seafood
and seafood products (n=40; fried fish, sushi, fish role, etc) and other type of RTE foods
(n=13). Isolated Listeria spp., samples and locations of sampling are listed in
APPENDIX I.
3.1.2 Chemicals, reagents, media, buffers and solutions
Chemicals and reagents used in this study are listed in APPENDIX II. All the
media used for isolation, identification and culturing Listeria spp. and L.
monocytogenes are listed in APPENDIX III. Buffers and solutions used in this study are
listed in APPENDIX IV.
31
3.2 Methods
3.2.1 Isolation and identification of Listeria spp. and L. monocytogenes
3.2.1.1 Conventional methods
In conventional method, different enrichment and selective media could be used
for isolation and detection of Listeria spp. and L. monocytogenes and presumptive
colonies are identified by biochemical tests. For isolation of Listeria spp. and L.
monocytogenes from RTE foods three types of media (pre-enrichment medium,
enrichment medium, and selective media) were used.
3.2.1.2 Pre-enrichment media
Pre-enrichment media are non-selective and are used for growing bacteria such
as half Fraser broth (O’Grady et al., 2009) and Listeria enrichment broth (Bang et al.,
2013). Half Fraser Broth was used for the first enrichment of the samples in order to
provide a suitable situation for Listeria spp. to grow and reach to a detectable level for
the presumptive identification. A dilution of 10-1
was prepared with the samples by
combining 25 g of each RTE food 225 ml of half Fraser broth in a sterile stomacher bag.
The samples were stomached for 2 min in order to homogenize the mixture. The
solution was then incubated at 30±1°C for 24 hours.
3.2.1.3 Enrichment media
Fraser broth was used for detection of Listeria spp. A dilution of 10-1
was
prepared by adding 0.1 ml of half Fraser broth in 10 ml of Fraser broth. The broth was
then incubated for 48 hours at 37°C.
32
3.2.1.4 Selective media
Three types of selective media including CHROMagarTM
Listeria, Listeria
selective agar (LSA) and Palcam agar were used for isolation of Listeria spp. and L.
monocytogenes.
3.2.2 Procedure for isolation of L. monocytogenes
Listeria spp. were analysed according to the ISO 11290 method (Becker et al.,
2006) for detection with a two-step enrichment with half-Fraser (Oxoid, Basingstoke,
UK) and Fraser (Oxoid, Basingstoke, UK) enrichment broths. Briefly, 25 g of samples
were added to 225 ml of half Fraser broth as the first enrichment culture in stomacher
bag and were homogenized in a stomacher (Lab blender 400, Seward Medical, London,
UK) and incubated for 24 h at 30 ±1°C. A loopful of first enriched broth culture was
streaked on CHROMagarTM
Listeria and incubated for another 24-48 h at 37 °C. On the
other hand, 0.1ml of half Fraser broth was added to 10 ml of Fraser broth as a second
enrichment culture and incubated at 37 °C for 48 h. Then, a loopful of enriched Fraser
broth-culture was streaked onto LSA and PALCAM agar and incubated for 24-48 h at
37 °C. Then, presumptive colonies were re-streaked on tryptic soy agar (Oxoid,
Basingstoke, UK) with 0.6% yeast extract (Oxoid, Basingstoke, UK) (TSAYE) as a
non-selective medium and incubated at 37 °C for 24 h. The colonies from TSAYE were
confirmed using biochemical tests (Gram determination, catalase, oxidase, SIM, TSI,
indole and MR-VP) and Polymerase Chain Reaction (PCR).
33
3.3 Confirmation L. monocytogenes by Polymerase Chain Reaction
3.3.1 Preparation of DNA template for PCR
Bacterial cultures on TSAYE agar plates were used to extract crude DNA, by the
use of boiling cell extraction method. Three to 5 single pure colonies were suspended in
100 µl of double distilled water and vortexed shortly. The suspension was heated at
99°C for 10 minutes and then was chilled in ice for 10 minutes. The cell debris was
pelleted by centrifugation at 13,400 g for 2 minutes and 5 µl of clear supernatant was
used as the DNA template in a PCR.
3.3.2 Specific oligonucleotide primers for identification Listeria spp. and L.
monocytogenes
The primers used in duplex PCR targeting 16S rRNA and LLO genes were
applied to confirmation of Listeria spp. and L. monocytogenes (Rossmanith et al.,
2006). Primer sequences used in the duplex PCR and the size of the expected amplicons
are presented in Table 3.1.
Table 3.1: The primer sequences used for confirmation of Listeria spp. and L.
monocytogenes and the size of the expected amplicons.
Primers Sequence (5'-3') Target
gene Specificity
Size (bp)
U1 AGCMGCCGCGGTAATWC
16S rRNA Listeria spp.
938
LI1 CTCCATAAAGTTGACCT
LM1 CCTAAGACGCCAATCGAA
LLO L. monocytogenes
701
LM2 AAGCGCTTGCAACTGCTC
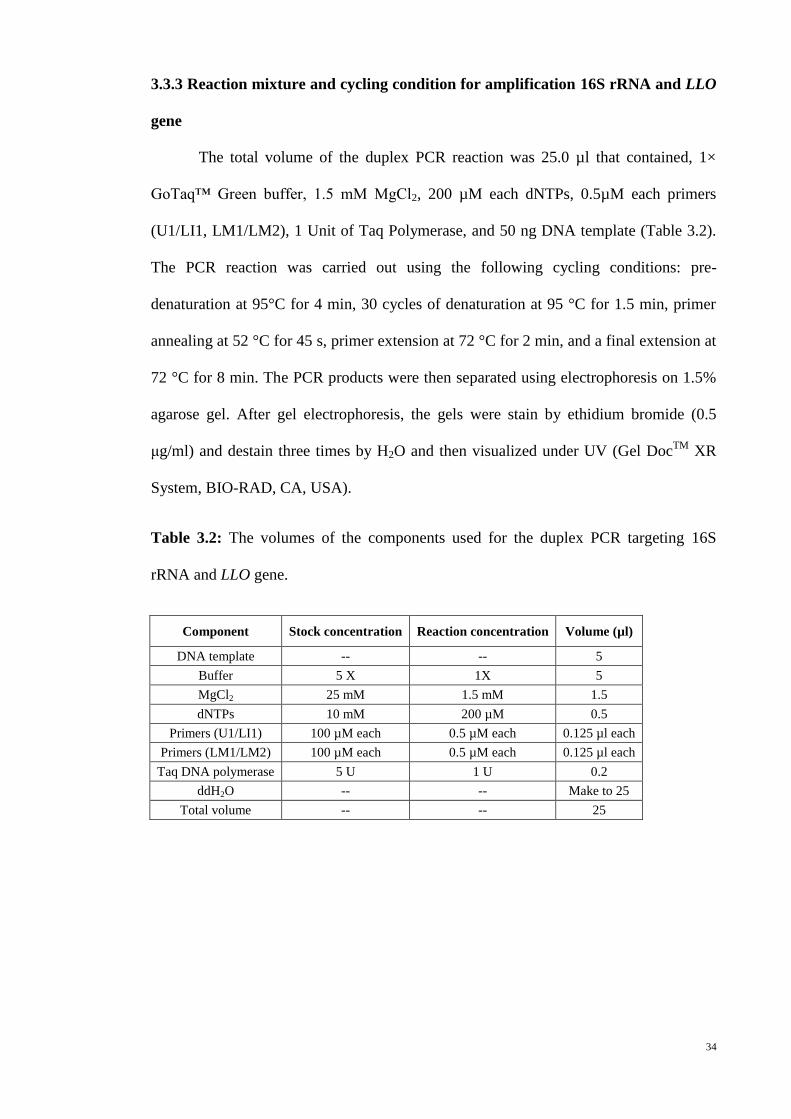
34
3.3.3 Reaction mixture and cycling condition for amplification 16S rRNA and LLO
gene
The total volume of the duplex PCR reaction was 25.0 µl that contained, 1×
GoTaq™ Green buffer, 1.5 mM MgCl2, 200 µM each dNTPs, 0.5µM each primers
(U1/LI1, LM1/LM2), 1 Unit of Taq Polymerase, and 50 ng DNA template (Table 3.2).
The PCR reaction was carried out using the following cycling conditions: pre-
denaturation at 95°C for 4 min, 30 cycles of denaturation at 95 °C for 1.5 min, primer
annealing at 52 °C for 45 s, primer extension at 72 °C for 2 min, and a final extension at
72 °C for 8 min. The PCR products were then separated using electrophoresis on 1.5%
agarose gel. After gel electrophoresis, the gels were stain by ethidium bromide (0.5
μg/ml) and destain three times by H2O and then visualized under UV (Gel DocTM
XR
System, BIO-RAD, CA, USA).
Table 3.2: The volumes of the components used for the duplex PCR targeting 16S
rRNA and LLO gene.
Component Stock concentration Reaction concentration Volume (µl)
DNA template -- -- 5
Buffer 5 X 1X 5
MgCl2 25 mM 1.5 mM 1.5
dNTPs 10 mM 200 µM 0.5
Primers (U1/LI1) 100 µM each 0.5 µM each 0.125 µl each
Primers (LM1/LM2) 100 µM each 0.5 µM each 0.125 µl each
Taq DNA polymerase 5 U 1 U 0.2
ddH2O -- -- Make to 25
Total volume -- -- 25
35
3.4 Rapid detection assay for Listeria spp. and L. monocytogenes by Polymerase
Chain Reaction
Direct PCR was performed with the crude DNA extracted from the enriched
broth cultures. Briefly, after 24 hours of incubation in first enrichment (half Fraser
broth), 1ml of first enriched broth was transferred into another test tube containing 9 ml
of second enrichment broth culture (Fraser broth). The tube was incubated at 37°C for 4
hours. DNA extraction was done by boiling method. An aliquot of 500µl of enriched
broth culture was transferred into microcentrifuge tube. The sample was centrifuged at
10,000 ×g for 5 minutes. The pellet was resuspended in 500µl of sterile distilled water.
Then, the sample was boiled for 10 minutes and after that cooled at -20°C for 10
minutes. Therefore, it was centrifuged at 10,000 ×g for 10 minutes and the supernatant
was used as DNA template in the PCR.
The nucleotide sequences of the primers used in the PCR which specifically
amplify the 938 bp region in the 16S rRNA which shows all Listeria spp. and the 701
bp region in the listeriolysin O (LLO) gene that shows L. monocytogenes (Rossmanith et
al., 2006).
The total volume of the duplex PCR reaction was 25.0 µl that contained, 1×
GoTaq™ Green buffer, 1.5 mM MgCl2, 200 µM each dNTPs, 0.5µM each primers
(U1/LI1, LM1/LM2), 1 Unit of Taq Polymerase, and 50 ng DNA template (Table 3.2).
The PCR reaction was carried out using the following cycling conditions: pre-
denaturation at 95°C for 4 min, 30 cycles of denaturation at 95 °C for 1.5 min, primer
annealing at 52 °C for 45 s, primer extension at 72 °C for 2 min, and a final extension at
72 °C for 8 min. The PCR products were then separated using electrophoresis on 1.5%
agarose gel. After gel electrophoresis, the gels were stain by ethidium bromide (0.5
μg/ml) and destain three times by H2O and then visualized under UV (Gel DocTM
XR
System, BIO-RAD, CA, USA).
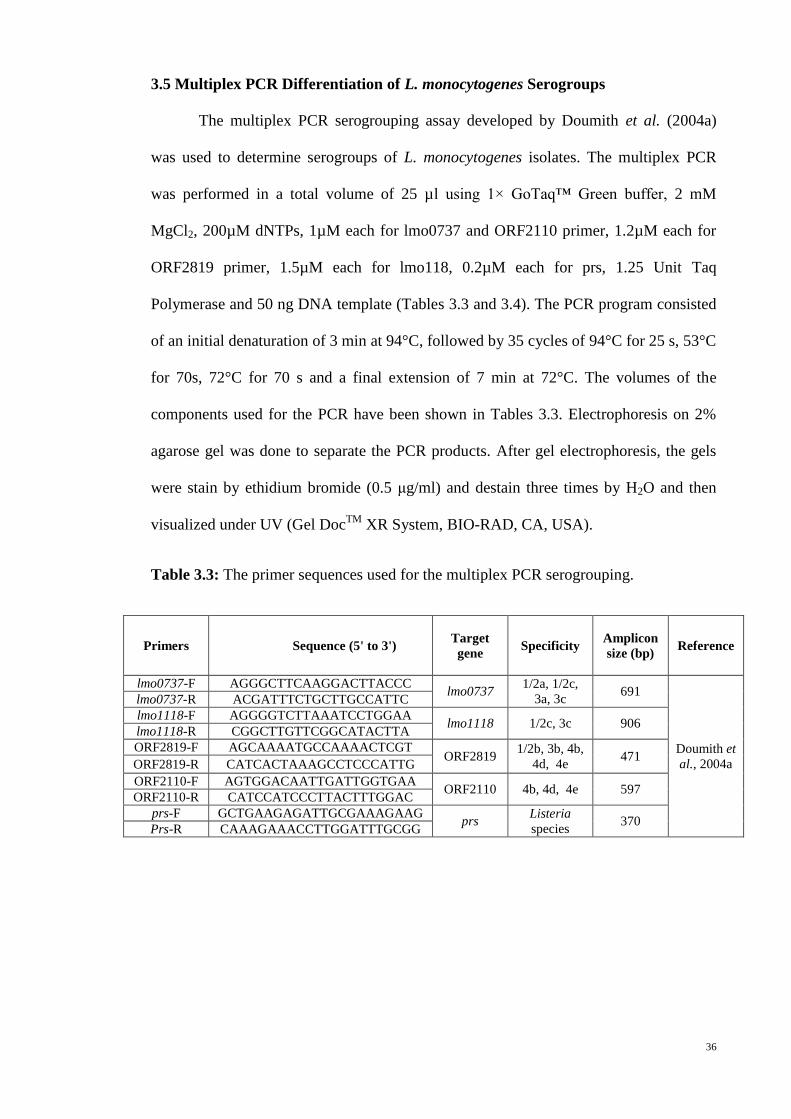
36
3.5 Multiplex PCR Differentiation of L. monocytogenes Serogroups
The multiplex PCR serogrouping assay developed by Doumith et al. (2004a)
was used to determine serogroups of L. monocytogenes isolates. The multiplex PCR
was performed in a total volume of 25 µl using 1× GoTaq™ Green buffer, 2 mM
MgCl2, 200µM dNTPs, 1µM each for lmo0737 and ORF2110 primer, 1.2µM each for
ORF2819 primer, 1.5µM each for lmo118, 0.2µM each for prs, 1.25 Unit Taq
Polymerase and 50 ng DNA template (Tables 3.3 and 3.4). The PCR program consisted
of an initial denaturation of 3 min at 94°C, followed by 35 cycles of 94°C for 25 s, 53°C
for 70s, 72°C for 70 s and a final extension of 7 min at 72°C. The volumes of the
components used for the PCR have been shown in Tables 3.3. Electrophoresis on 2%
agarose gel was done to separate the PCR products. After gel electrophoresis, the gels
were stain by ethidium bromide (0.5 μg/ml) and destain three times by H2O and then
visualized under UV (Gel DocTM
XR System, BIO-RAD, CA, USA).
Table 3.3: The primer sequences used for the multiplex PCR serogrouping.
Primers Sequence (5' to 3') Target
gene Specificity
Amplicon
size (bp) Reference
lmo0737-F AGGGCTTCAAGGACTTACCC lmo0737
1/2a, 1/2c,
3a, 3c 691
Doumith et
al., 2004a
lmo0737-R ACGATTTCTGCTTGCCATTC
lmo1118-F AGGGGTCTTAAATCCTGGAA lmo1118 1/2c, 3c 906
lmo1118-R CGGCTTGTTCGGCATACTTA
ORF2819-F AGCAAAATGCCAAAACTCGT ORF2819
1/2b, 3b, 4b,
4d, 4e 471
ORF2819-R CATCACTAAAGCCTCCCATTG
ORF2110-F AGTGGACAATTGATTGGTGAA ORF2110 4b, 4d, 4e 597
ORF2110-R CATCCATCCCTTACTTTGGAC
prs-F GCTGAAGAGATTGCGAAAGAAG prs
Listeria
species 370
Prs-R CAAAGAAACCTTGGATTTGCGG
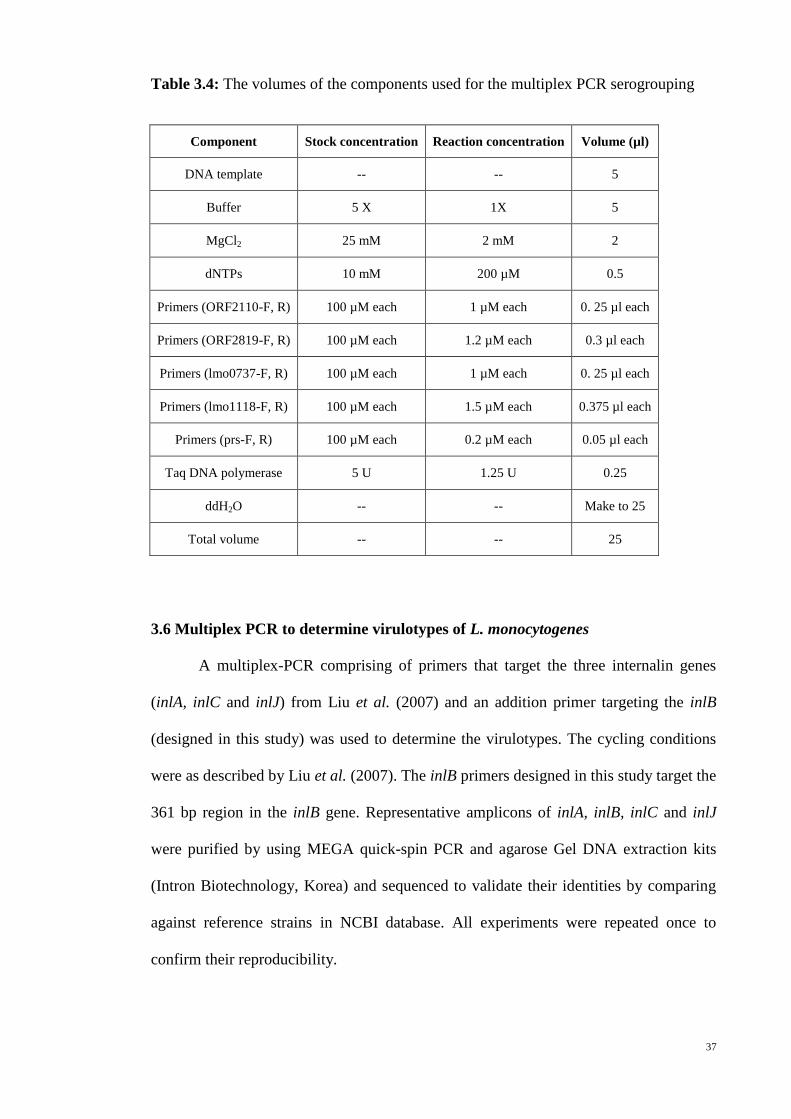
37
Table 3.4: The volumes of the components used for the multiplex PCR serogrouping
Component Stock concentration Reaction concentration Volume (µl)
DNA template -- -- 5
Buffer 5 X 1X 5
MgCl2 25 mM 2 mM 2
dNTPs 10 mM 200 µM 0.5
Primers (ORF2110-F, R) 100 µM each 1 µM each 0. 25 µl each
Primers (ORF2819-F, R) 100 µM each 1.2 µM each 0.3 µl each
Primers (lmo0737-F, R) 100 µM each 1 µM each 0. 25 µl each
Primers (lmo1118-F, R) 100 µM each 1.5 µM each 0.375 µl each
Primers (prs-F, R) 100 µM each 0.2 µM each 0.05 µl each
Taq DNA polymerase 5 U 1.25 U 0.25
ddH2O -- -- Make to 25
Total volume -- -- 25
3.6 Multiplex PCR to determine virulotypes of L. monocytogenes
A multiplex-PCR comprising of primers that target the three internalin genes
(inlA, inlC and inlJ) from Liu et al. (2007) and an addition primer targeting the inlB
(designed in this study) was used to determine the virulotypes. The cycling conditions
were as described by Liu et al. (2007). The inlB primers designed in this study target the
361 bp region in the inlB gene. Representative amplicons of inlA, inlB, inlC and inlJ
were purified by using MEGA quick-spin PCR and agarose Gel DNA extraction kits
(Intron Biotechnology, Korea) and sequenced to validate their identities by comparing
against reference strains in NCBI database. All experiments were repeated once to
confirm their reproducibility.
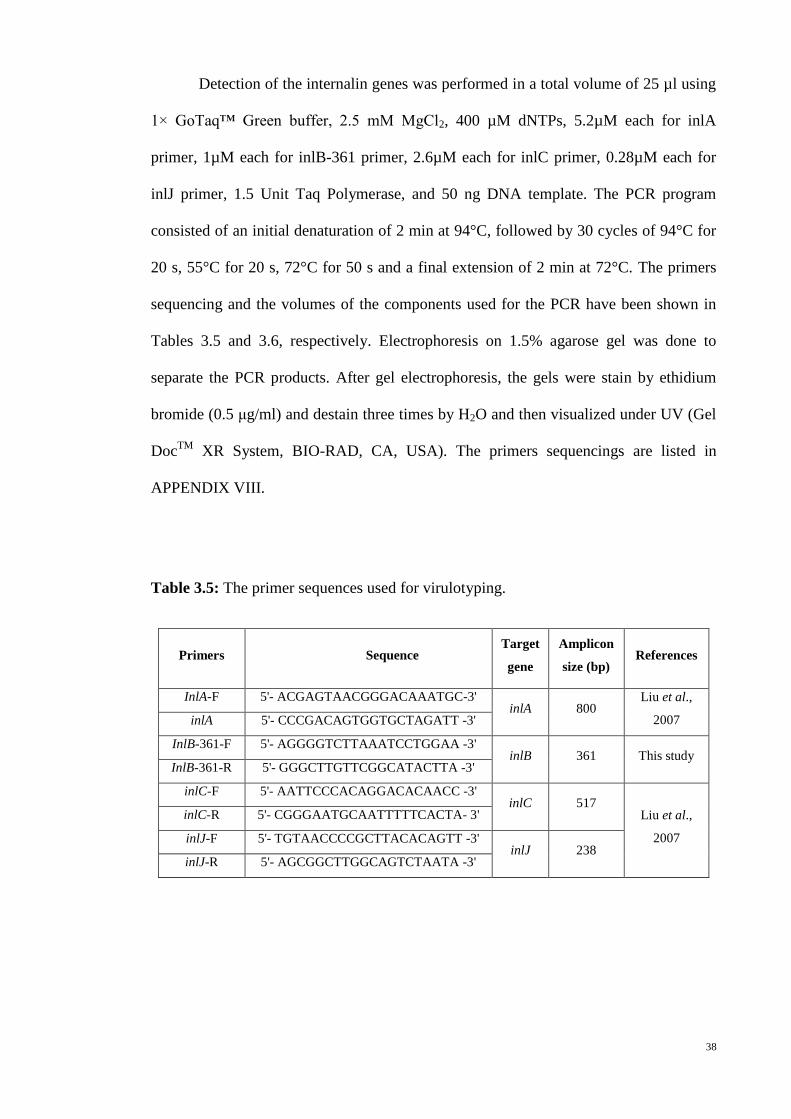
38
Detection of the internalin genes was performed in a total volume of 25 µl using
1× GoTaq™ Green buffer, 2.5 mM MgCl2, 400 µM dNTPs, 5.2µM each for inlA
primer, 1µM each for inlB-361 primer, 2.6µM each for inlC primer, 0.28µM each for
inlJ primer, 1.5 Unit Taq Polymerase, and 50 ng DNA template. The PCR program
consisted of an initial denaturation of 2 min at 94°C, followed by 30 cycles of 94°C for
20 s, 55°C for 20 s, 72°C for 50 s and a final extension of 2 min at 72°C. The primers
sequencing and the volumes of the components used for the PCR have been shown in
Tables 3.5 and 3.6, respectively. Electrophoresis on 1.5% agarose gel was done to
separate the PCR products. After gel electrophoresis, the gels were stain by ethidium
bromide (0.5 μg/ml) and destain three times by H2O and then visualized under UV (Gel
DocTM
XR System, BIO-RAD, CA, USA). The primers sequencings are listed in
APPENDIX VIII.
Table 3.5: The primer sequences used for virulotyping.
Primers Sequence Target
gene
Amplicon
size (bp) References
InlA-F 5'- ACGAGTAACGGGACAAATGC-3' inlA 800
Liu et al.,
2007 inlA 5'- CCCGACAGTGGTGCTAGATT -3'
InlB-361-F 5'- AGGGGTCTTAAATCCTGGAA -3' inlB 361 This study
InlB-361-R 5'- GGGCTTGTTCGGCATACTTA -3'
inlC-F 5'- AATTCCCACAGGACACAACC -3' inlC 517
Liu et al.,
2007
inlC-R 5'- CGGGAATGCAATTTTTCACTA- 3'
inlJ-F 5'- TGTAACCCCGCTTACACAGTT -3' inlJ 238
inlJ-R 5'- AGCGGCTTGGCAGTCTAATA -3'
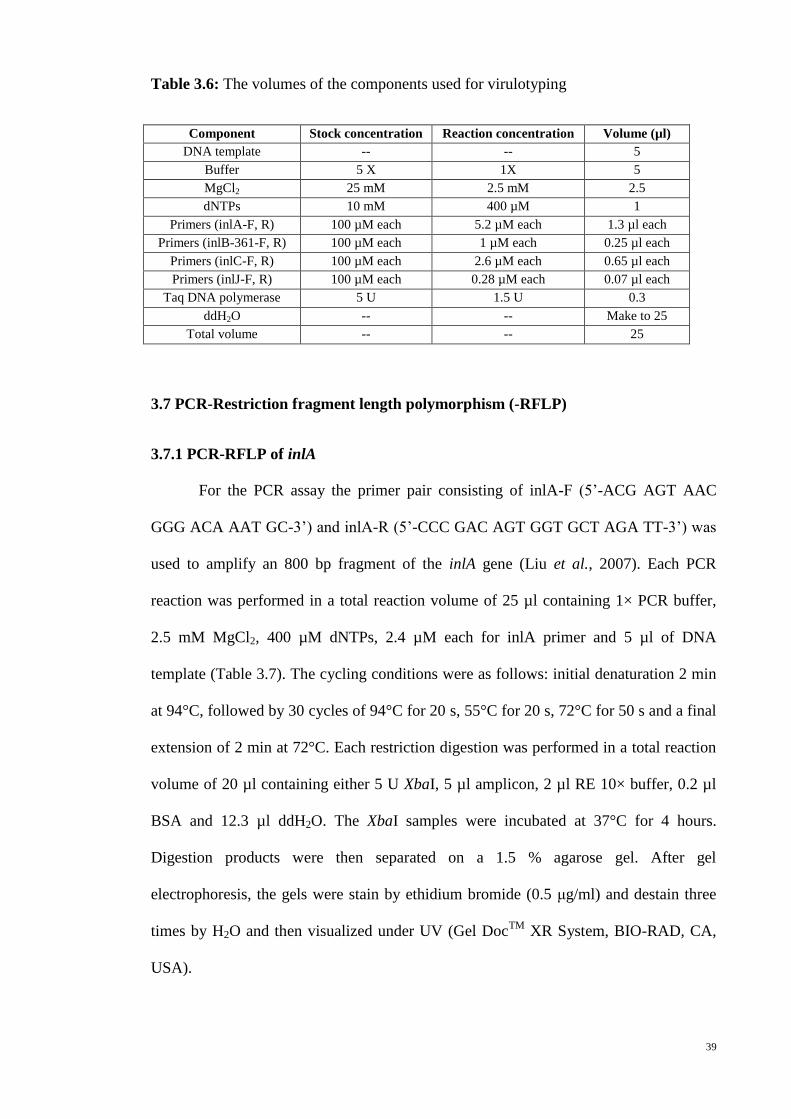
39
Table 3.6: The volumes of the components used for virulotyping
Component Stock concentration Reaction concentration Volume (µl)
DNA template -- -- 5
Buffer 5 X 1X 5
MgCl2 25 mM 2.5 mM 2.5
dNTPs 10 mM 400 µM 1
Primers (inlA-F, R) 100 µM each 5.2 µM each 1.3 µl each
Primers (inlB-361-F, R) 100 µM each 1 µM each 0.25 µl each
Primers (inlC-F, R) 100 µM each 2.6 µM each 0.65 µl each
Primers (inlJ-F, R) 100 µM each 0.28 µM each 0.07 µl each
Taq DNA polymerase 5 U 1.5 U 0.3
ddH2O -- -- Make to 25
Total volume -- -- 25
3.7 PCR-Restriction fragment length polymorphism (-RFLP)
3.7.1 PCR-RFLP of inlA
For the PCR assay the primer pair consisting of inlA-F (5’-ACG AGT AAC
GGG ACA AAT GC-3’) and inlA-R (5’-CCC GAC AGT GGT GCT AGA TT-3’) was
used to amplify an 800 bp fragment of the inlA gene (Liu et al., 2007). Each PCR
reaction was performed in a total reaction volume of 25 µl containing 1× PCR buffer,
2.5 mM MgCl2, 400 µM dNTPs, 2.4 µM each for inlA primer and 5 µl of DNA
template (Table 3.7). The cycling conditions were as follows: initial denaturation 2 min
at 94°C, followed by 30 cycles of 94°C for 20 s, 55°C for 20 s, 72°C for 50 s and a final
extension of 2 min at 72°C. Each restriction digestion was performed in a total reaction
volume of 20 µl containing either 5 U XbaI, 5 µl amplicon, 2 µl RE 10× buffer, 0.2 µl
BSA and 12.3 µl ddH2O. The XbaI samples were incubated at 37°C for 4 hours.
Digestion products were then separated on a 1.5 % agarose gel. After gel
electrophoresis, the gels were stain by ethidium bromide (0.5 μg/ml) and destain three
times by H2O and then visualized under UV (Gel DocTM
XR System, BIO-RAD, CA,
USA).
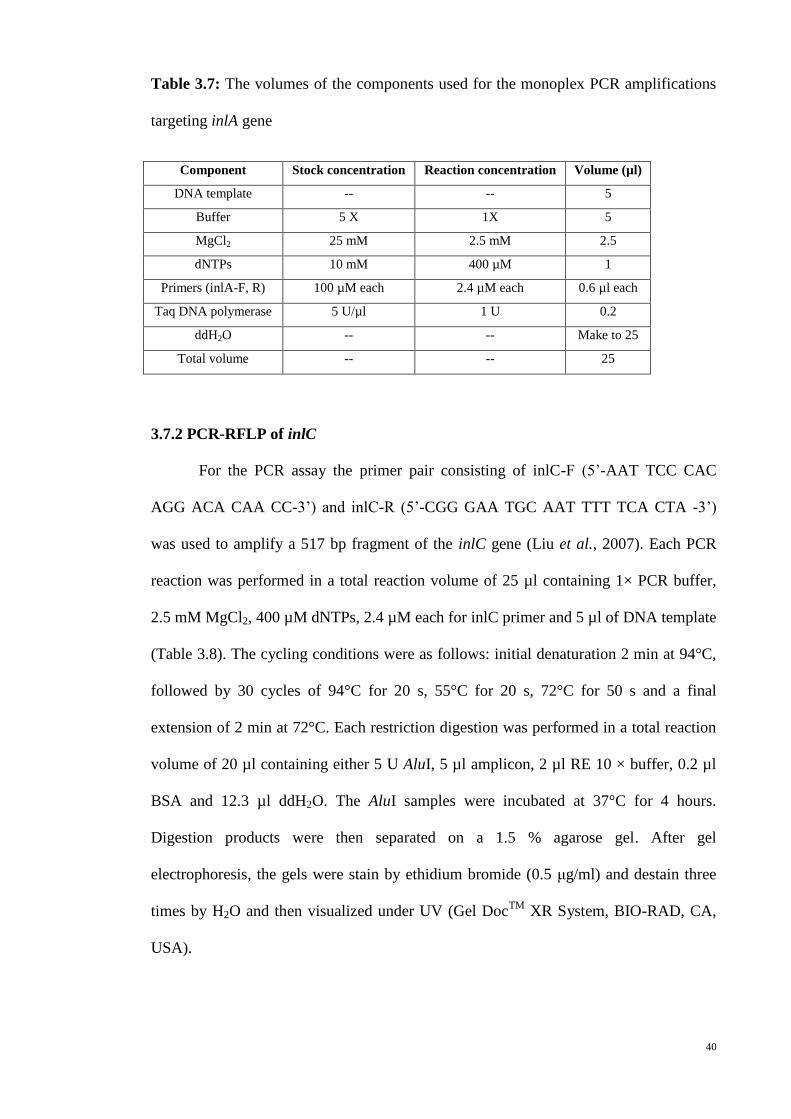
40
Table 3.7: The volumes of the components used for the monoplex PCR amplifications
targeting inlA gene
Component Stock concentration Reaction concentration Volume (µl)
DNA template -- -- 5
Buffer 5 X 1X 5
MgCl2 25 mM 2.5 mM 2.5
dNTPs 10 mM 400 µM 1
Primers (inlA-F, R) 100 µM each 2.4 µM each 0.6 µl each
Taq DNA polymerase 5 U/µl 1 U 0.2
ddH2O -- -- Make to 25
Total volume -- -- 25
3.7.2 PCR-RFLP of inlC
For the PCR assay the primer pair consisting of inlC-F (5’-AAT TCC CAC
AGG ACA CAA CC-3’) and inlC-R (5’-CGG GAA TGC AAT TTT TCA CTA -3’)
was used to amplify a 517 bp fragment of the inlC gene (Liu et al., 2007). Each PCR
reaction was performed in a total reaction volume of 25 µl containing 1× PCR buffer,
2.5 mM MgCl2, 400 µM dNTPs, 2.4 µM each for inlC primer and 5 µl of DNA template
(Table 3.8). The cycling conditions were as follows: initial denaturation 2 min at 94°C,
followed by 30 cycles of 94°C for 20 s, 55°C for 20 s, 72°C for 50 s and a final
extension of 2 min at 72°C. Each restriction digestion was performed in a total reaction
volume of 20 µl containing either 5 U AluI, 5 µl amplicon, 2 µl RE 10 × buffer, 0.2 µl
BSA and 12.3 µl ddH2O. The AluI samples were incubated at 37°C for 4 hours.
Digestion products were then separated on a 1.5 % agarose gel. After gel
electrophoresis, the gels were stain by ethidium bromide (0.5 μg/ml) and destain three
times by H2O and then visualized under UV (Gel DocTM
XR System, BIO-RAD, CA,
USA).
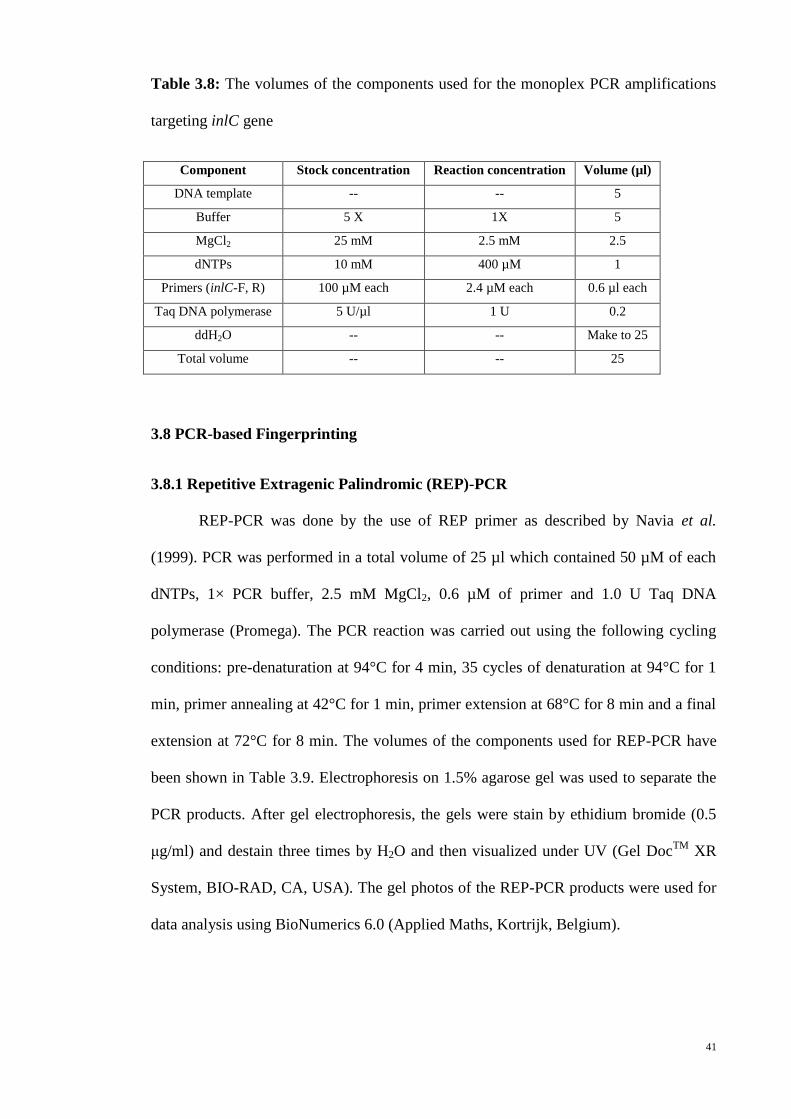
41
Table 3.8: The volumes of the components used for the monoplex PCR amplifications
targeting inlC gene
Component Stock concentration Reaction concentration Volume (µl)
DNA template -- -- 5
Buffer 5 X 1X 5
MgCl2 25 mM 2.5 mM 2.5
dNTPs 10 mM 400 µM 1
Primers (inlC-F, R) 100 µM each 2.4 µM each 0.6 µl each
Taq DNA polymerase 5 U/µl 1 U 0.2
ddH2O -- -- Make to 25
Total volume -- -- 25
3.8 PCR-based Fingerprinting
3.8.1 Repetitive Extragenic Palindromic (REP)-PCR
REP-PCR was done by the use of REP primer as described by Navia et al.
(1999). PCR was performed in a total volume of 25 µl which contained 50 µM of each
dNTPs, 1× PCR buffer, 2.5 mM MgCl2, 0.6 µM of primer and 1.0 U Taq DNA
polymerase (Promega). The PCR reaction was carried out using the following cycling
conditions: pre-denaturation at 94°C for 4 min, 35 cycles of denaturation at 94°C for 1
min, primer annealing at 42°C for 1 min, primer extension at 68°C for 8 min and a final
extension at 72°C for 8 min. The volumes of the components used for REP-PCR have
been shown in Table 3.9. Electrophoresis on 1.5% agarose gel was used to separate the
PCR products. After gel electrophoresis, the gels were stain by ethidium bromide (0.5
μg/ml) and destain three times by H2O and then visualized under UV (Gel DocTM
XR
System, BIO-RAD, CA, USA). The gel photos of the REP-PCR products were used for
data analysis using BioNumerics 6.0 (Applied Maths, Kortrijk, Belgium).
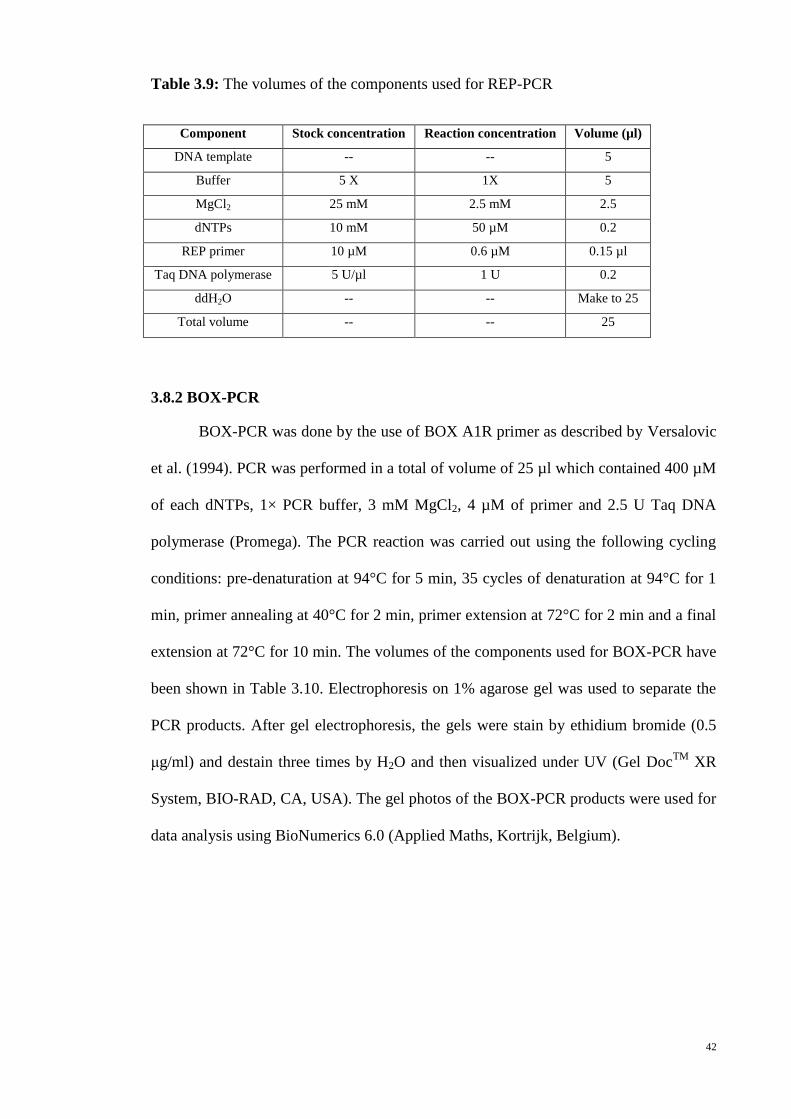
42
Table 3.9: The volumes of the components used for REP-PCR
Component Stock concentration Reaction concentration Volume (µl)
DNA template -- -- 5
Buffer 5 X 1X 5
MgCl2 25 mM 2.5 mM 2.5
dNTPs 10 mM 50 µM 0.2
REP primer 10 µM 0.6 µM 0.15 µl
Taq DNA polymerase 5 U/µl 1 U 0.2
ddH2O -- -- Make to 25
Total volume -- -- 25
3.8.2 BOX-PCR
BOX-PCR was done by the use of BOX A1R primer as described by Versalovic
et al. (1994). PCR was performed in a total of volume of 25 µl which contained 400 µM
of each dNTPs, 1× PCR buffer, 3 mM MgCl2, 4 µM of primer and 2.5 U Taq DNA
polymerase (Promega). The PCR reaction was carried out using the following cycling
conditions: pre-denaturation at 94°C for 5 min, 35 cycles of denaturation at 94°C for 1
min, primer annealing at 40°C for 2 min, primer extension at 72°C for 2 min and a final
extension at 72°C for 10 min. The volumes of the components used for BOX-PCR have
been shown in Table 3.10. Electrophoresis on 1% agarose gel was used to separate the
PCR products. After gel electrophoresis, the gels were stain by ethidium bromide (0.5
μg/ml) and destain three times by H2O and then visualized under UV (Gel DocTM
XR
System, BIO-RAD, CA, USA). The gel photos of the BOX-PCR products were used for
data analysis using BioNumerics 6.0 (Applied Maths, Kortrijk, Belgium).
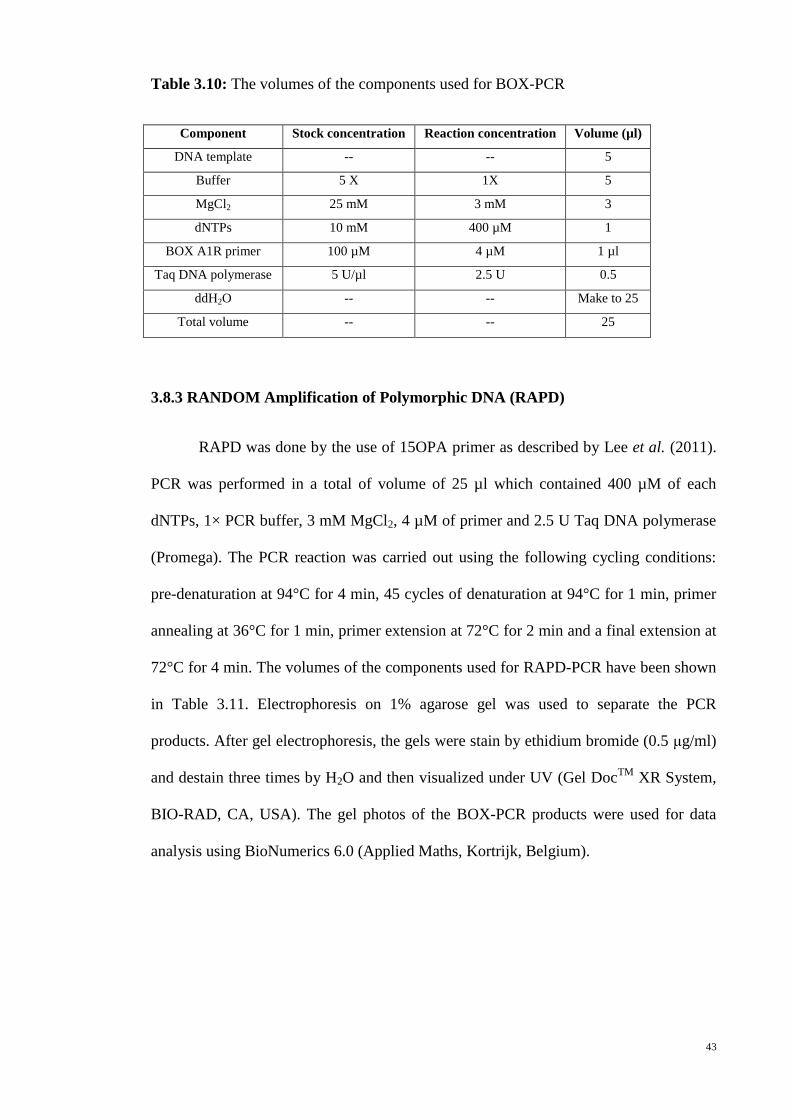
43
Table 3.10: The volumes of the components used for BOX-PCR
Component Stock concentration Reaction concentration Volume (µl)
DNA template -- -- 5
Buffer 5 X 1X 5
MgCl2 25 mM 3 mM 3
dNTPs 10 mM 400 µM 1
BOX A1R primer 100 µM 4 µM 1 µl
Taq DNA polymerase 5 U/µl 2.5 U 0.5
ddH2O -- -- Make to 25
Total volume -- -- 25
3.8.3 RANDOM Amplification of Polymorphic DNA (RAPD)
RAPD was done by the use of 15OPA primer as described by Lee et al. (2011).
PCR was performed in a total of volume of 25 µl which contained 400 µM of each
dNTPs, 1× PCR buffer, 3 mM MgCl2, 4 µM of primer and 2.5 U Taq DNA polymerase
(Promega). The PCR reaction was carried out using the following cycling conditions:
pre-denaturation at 94°C for 4 min, 45 cycles of denaturation at 94°C for 1 min, primer
annealing at 36°C for 1 min, primer extension at 72°C for 2 min and a final extension at
72°C for 4 min. The volumes of the components used for RAPD-PCR have been shown
in Table 3.11. Electrophoresis on 1% agarose gel was used to separate the PCR
products. After gel electrophoresis, the gels were stain by ethidium bromide (0.5 μg/ml)
and destain three times by H2O and then visualized under UV (Gel DocTM
XR System,
BIO-RAD, CA, USA). The gel photos of the BOX-PCR products were used for data
analysis using BioNumerics 6.0 (Applied Maths, Kortrijk, Belgium).
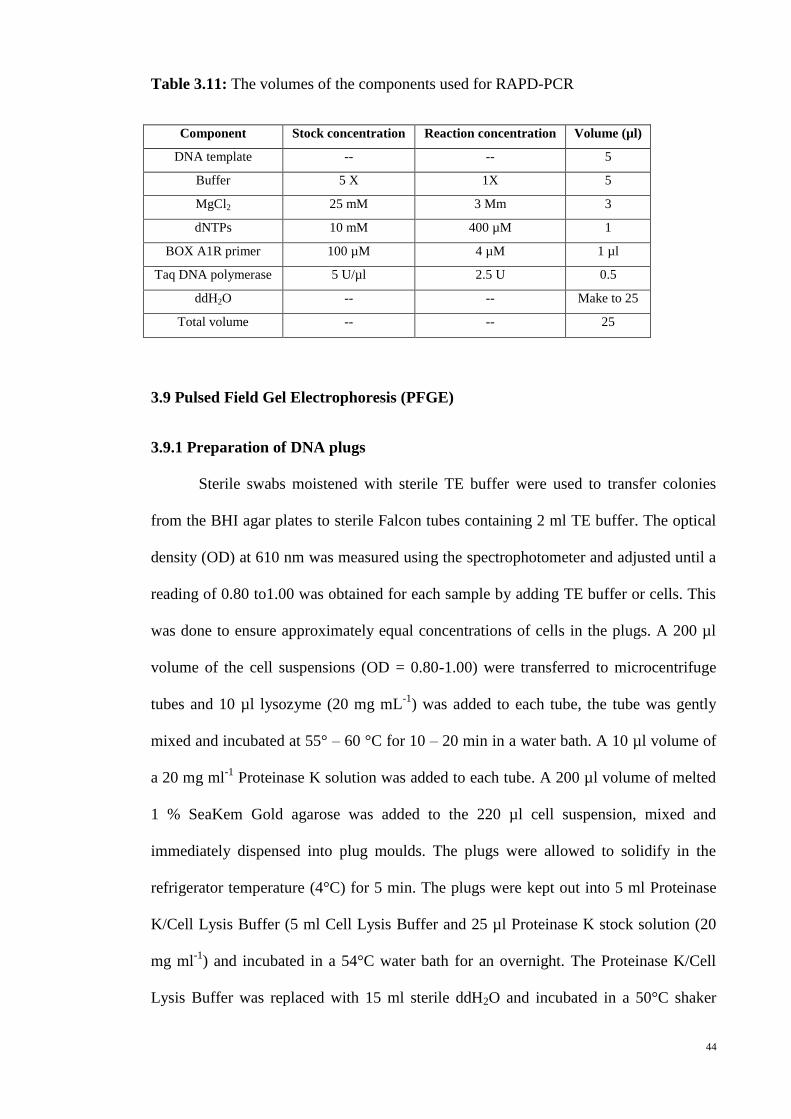
44
Table 3.11: The volumes of the components used for RAPD-PCR
Component Stock concentration Reaction concentration Volume (µl)
DNA template -- -- 5
Buffer 5 X 1X 5
MgCl2 25 mM 3 Mm 3
dNTPs 10 mM 400 µM 1
BOX A1R primer 100 µM 4 µM 1 µl
Taq DNA polymerase 5 U/µl 2.5 U 0.5
ddH2O -- -- Make to 25
Total volume -- -- 25
3.9 Pulsed Field Gel Electrophoresis (PFGE)
3.9.1 Preparation of DNA plugs
Sterile swabs moistened with sterile TE buffer were used to transfer colonies
from the BHI agar plates to sterile Falcon tubes containing 2 ml TE buffer. The optical
density (OD) at 610 nm was measured using the spectrophotometer and adjusted until a
reading of 0.80 to1.00 was obtained for each sample by adding TE buffer or cells. This
was done to ensure approximately equal concentrations of cells in the plugs. A 200 µl
volume of the cell suspensions (OD = 0.80-1.00) were transferred to microcentrifuge
tubes and 10 µl lysozyme (20 mg mL-1
) was added to each tube, the tube was gently
mixed and incubated at 55° – 60 °C for 10 – 20 min in a water bath. A 10 µl volume of
a 20 mg ml-1
Proteinase K solution was added to each tube. A 200 µl volume of melted
1 % SeaKem Gold agarose was added to the 220 µl cell suspension, mixed and
immediately dispensed into plug moulds. The plugs were allowed to solidify in the
refrigerator temperature (4°C) for 5 min. The plugs were kept out into 5 ml Proteinase
K/Cell Lysis Buffer (5 ml Cell Lysis Buffer and 25 µl Proteinase K stock solution (20
mg ml-1
) and incubated in a 54°C water bath for an overnight. The Proteinase K/Cell
Lysis Buffer was replaced with 15 ml sterile ddH2O and incubated in a 50°C shaker
45
water bath for 15 minutes. This washing procedure was repeated one more time with
ddH2O and six times with TE buffer. Plugs were then transferred to 5 ml sterile TE
buffer and stored at 4 °C.
3.9.2 Restriction digestion
A sterile scalpel was used to cut a 2.0–2.5 mm wide slice of the L.
monocytogenes embedded agarose plug. This plug was placed in a microcentrifuge tube
containing 200 µl restriction enzyme solution (20 µl 10× Restriction Buffer, 2 µl BSA,
50 U ApaI and 173 µl ddH2O) for digestion with ApaI and incubated at 37°C for an
overnight. After enzyme digestion, the restriction enzyme solution was removed and the
plugs were immediately loaded for gel electrophoresis. Salmonella H9812 was used as a
marker in PFGE. The 2.0-2.5 mm wide slice of Salmonella H9812 was placed under
200 µl restriction enzyme solution (20 µl 10 × Restriction Buffer, 2 µl BSA, 20 U XbaI
and 176 µl ddH2O) in a microcentrifuge tube for digestion with XbaI and incubated at
37°C for 2-3 hours.
3.9.3 Pulsed-field gel electrophoresis
The restricted plugs were loaded into the wells of a 1 % Sigma agarose gel with
0.5 × TBE Buffer and the wells filled with melted 1% SeaKem Gold agarose and left to
set at room temperature for 45 min. A CHEF DRIII system was used for the
electrophoretic separation. Three liters of 0.5 X TBE buffer was poured into the
chamber and allowed to cool to 14 °C. The current-switching parameters were as
follows: 4 s initial switch time, 40 s final switch time at 6 V, buffer temperature at 14
°C and a total run time of 21 hours. After electrophoresis the gel was removed and
stained in ethidium bromide for 30 minutes. The separated PFGE fragments were
46
visualized under an ultraviolet transilluminator (Gel DocTM
XR System, BIO-RAD, CA,
USA) and the captured images were used for analysis.
3.10 Antimicrobial susceptibility testing
Susceptibility tests were performed by standard disk diffusion method on
Mueller Hinton Agar (MHA), following the procedures recommended by the Clinical
and Laboratory Standards Institute (CLSI, 2010). Listeria spp. isolates were streaked on
TSAYE agar and incubated at 37°C for 24 hours. Then, several single colonies were
removed from the plate to Falcon tubes containing of sterile saline using a sterile cotton
swab. The turbidity of the colonies with sterile saline was checked for the development
of slight turbidity, against 0.5 MacFarland solutions. The cell suspension was then
transferred onto the surface of Mueller-Hinton agar and then spread evenly.
Antimicrobial discs (Oxoid Ltd, Basingstoke, UK) containing the following antibiotics
were spotted with about 3 cm interval rifampicin 5µg, clindamycin 2µg, vancomycin
30µg, streptomycin 30µg, gentamicin 10µg, tetracycline 30µg, erythromycin 30µg,
trimethoprim-sulfamethoxazole 25µg, kanamycin 30µg, amoxicillin-clavulanic acid
30µg (20/10), penicillin G 10 units, and chloramphenicol 30µg. After 16 to 18 hours of
incubation at 37°C, the zone of inhibition around each disc was measured, and the
results were interpreted as resistant, sensitive and intermediate.
3.11 Data Analysis
The banding patterns generated by RAPD, BOX-PCR and PFGE were analyzed
by using BioNumerics 6.0 (Applied Maths, Kortrijk, Belgium) based on the weighted
pair group method with the arithmetic average (UPGMA) with a position tolerance of

47
0.1. PCR fingerprints and PFGE profiles were assigned arbitrary designation, and
differences were defined by the Dice coefficient of similarity, F.
All statistical and the Spearman’s correlation analyses were performed using
SPSS 18.0 (SPSS Inc., Chicago, IL, USA).

48
CHAPTER 4
RESULTS
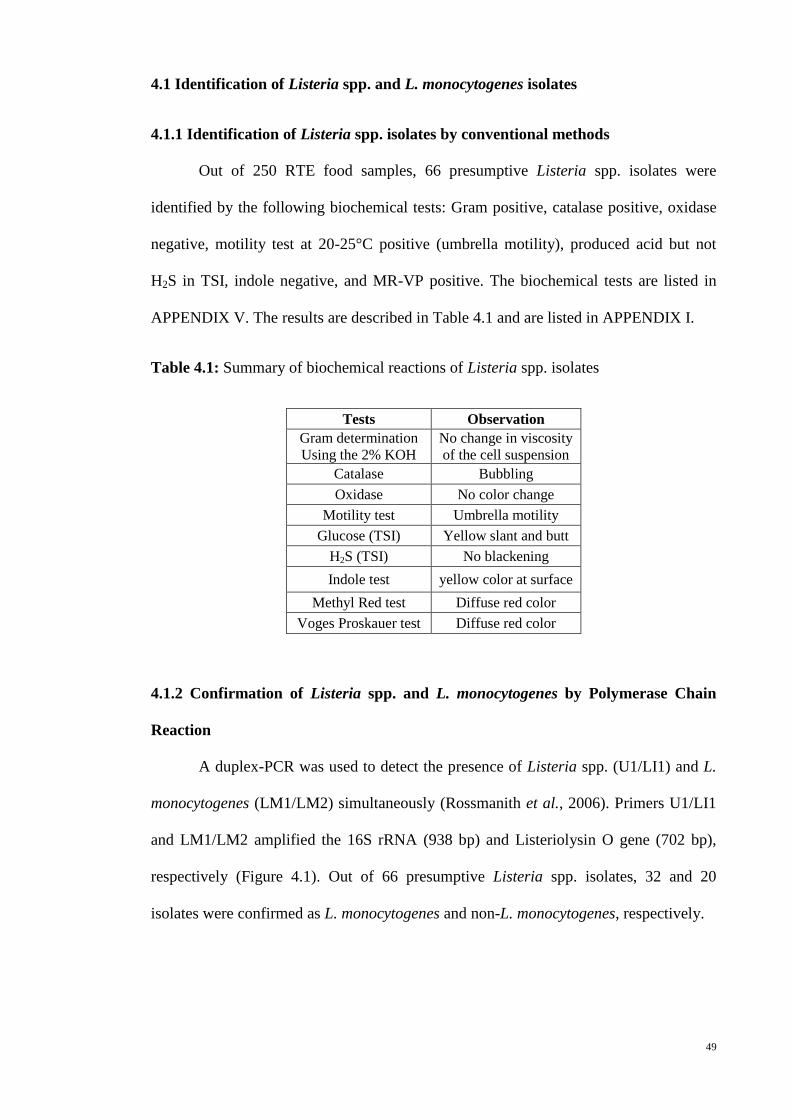
49
4.1 Identification of Listeria spp. and L. monocytogenes isolates
4.1.1 Identification of Listeria spp. isolates by conventional methods
Out of 250 RTE food samples, 66 presumptive Listeria spp. isolates were
identified by the following biochemical tests: Gram positive, catalase positive, oxidase
negative, motility test at 20-25°C positive (umbrella motility), produced acid but not
H2S in TSI, indole negative, and MR-VP positive. The biochemical tests are listed in
APPENDIX V. The results are described in Table 4.1 and are listed in APPENDIX I.
Table 4.1: Summary of biochemical reactions of Listeria spp. isolates
Tests Observation
Gram determination
Using the 2% KOH
No change in viscosity
of the cell suspension
Catalase Bubbling
Oxidase No color change
Motility test Umbrella motility
Glucose (TSI) Yellow slant and butt
H2S (TSI) No blackening
Indole test yellow color at surface
Methyl Red test Diffuse red color
Voges Proskauer test Diffuse red color
4.1.2 Confirmation of Listeria spp. and L. monocytogenes by Polymerase Chain
Reaction
A duplex-PCR was used to detect the presence of Listeria spp. (U1/LI1) and L.
monocytogenes (LM1/LM2) simultaneously (Rossmanith et al., 2006). Primers U1/LI1
and LM1/LM2 amplified the 16S rRNA (938 bp) and Listeriolysin O gene (702 bp),
respectively (Figure 4.1). Out of 66 presumptive Listeria spp. isolates, 32 and 20
isolates were confirmed as L. monocytogenes and non-L. monocytogenes, respectively.
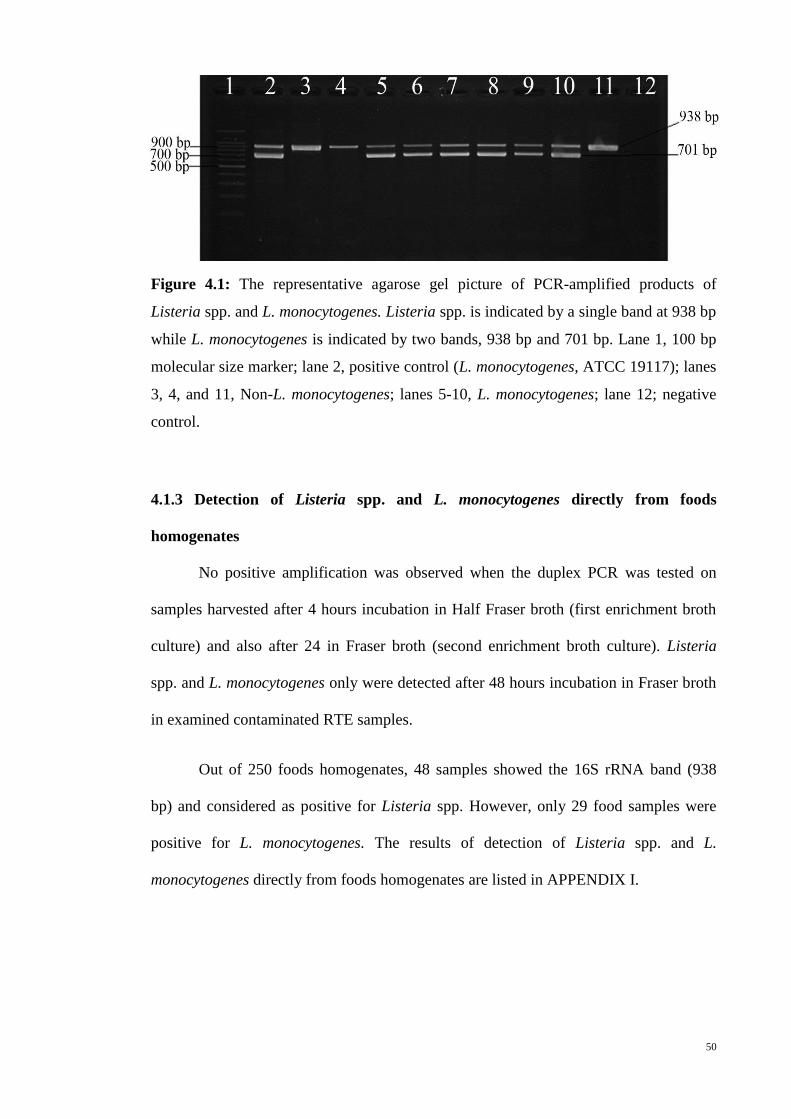
50
Figure 4.1: The representative agarose gel picture of PCR-amplified products of
Listeria spp. and L. monocytogenes. Listeria spp. is indicated by a single band at 938 bp
while L. monocytogenes is indicated by two bands, 938 bp and 701 bp. Lane 1, 100 bp
molecular size marker; lane 2, positive control (L. monocytogenes, ATCC 19117); lanes
3, 4, and 11, Non-L. monocytogenes; lanes 5-10, L. monocytogenes; lane 12; negative
control.
4.1.3 Detection of Listeria spp. and L. monocytogenes directly from foods
homogenates
No positive amplification was observed when the duplex PCR was tested on
samples harvested after 4 hours incubation in Half Fraser broth (first enrichment broth
culture) and also after 24 in Fraser broth (second enrichment broth culture). Listeria
spp. and L. monocytogenes only were detected after 48 hours incubation in Fraser broth
in examined contaminated RTE samples.
Out of 250 foods homogenates, 48 samples showed the 16S rRNA band (938
bp) and considered as positive for Listeria spp. However, only 29 food samples were
positive for L. monocytogenes. The results of detection of Listeria spp. and L.
monocytogenes directly from foods homogenates are listed in APPENDIX I.
51
4.2 Distribution of Listeria species and L. monocytogenes
4.2.1 Distribution of Listeria spp. and L. monocytogenes isolated in RTE foods from
street-side hawker stalls
Out of 250 studied RTE food samples, 155 (62%) were purchased from street-
side hawker stalls in Selangor state from November 2010 to August 2011. Forty
(25.8%) RTE foods were from Chow Kit, 75 (48.4%) from University LRT station, 20
(12.9%) were purchased from cafeterias in University of Malaya and 20 (12.9%) from
PJ17 pasar malam (Table 4.2).
Listeria species was isolated from 31 (20%) of the samples (Table 4.2). Among
these contaminated samples, 20 (64.5%) harboured L. monocytogenes. Ten (50%) of the
RTE food samples positive for L. monocytogenes were from University LRT station, 4
(20%) were from PJ17 pasar malam (night market), 4 (10%) were from Chow Kit and 2
(10%) were from location University of Malaya.
Among the studied RTE food samples which were purchased from street-side
hawker stalls, salad and vegetables showed the maximum present (24.3%) of Listeria
species. L. monocytogenes was isolated from beverages (one out of 5 samples), chicken
and chicken products (5 out of 29 samples), salads and vegetables (11 out of 70
samples), eggs and egg products (2 out of 20 samples) and seafood and seafood
products (one out of 14 sample) (Table 4.3).
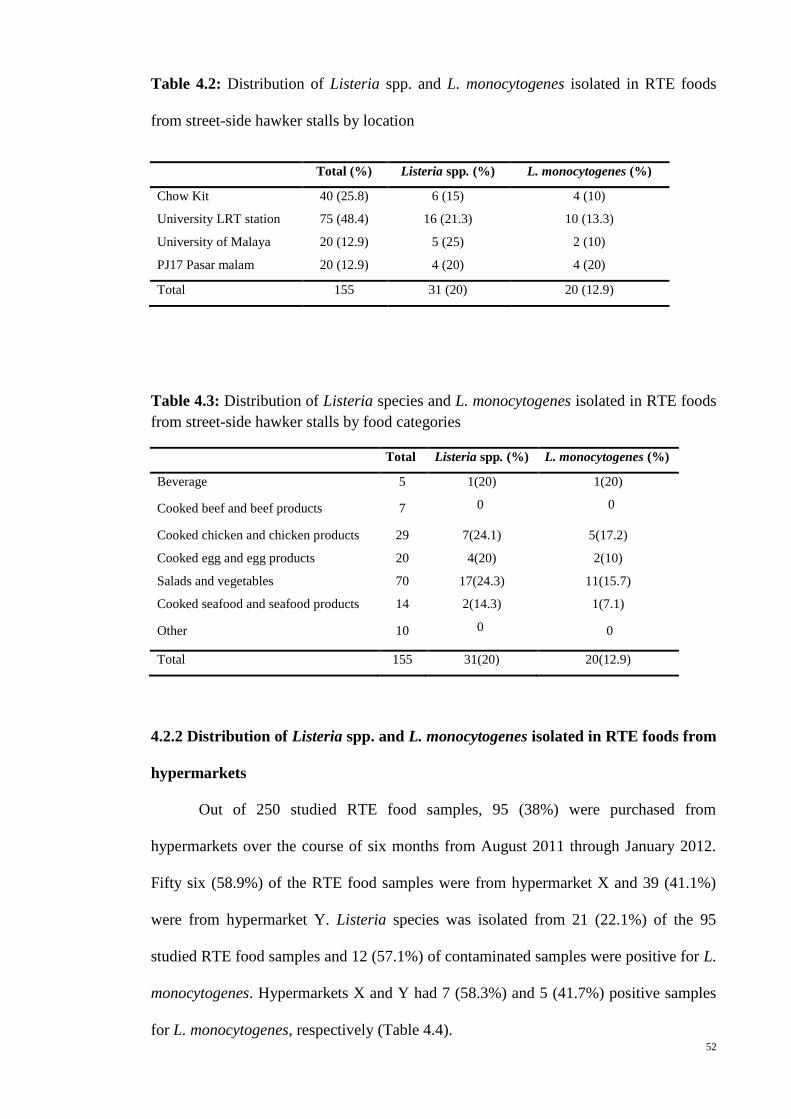
52
Table 4.2: Distribution of Listeria spp. and L. monocytogenes isolated in RTE foods
from street-side hawker stalls by location
Total (%) Listeria spp. (%) L. monocytogenes (%)
Chow Kit 40 (25.8) 6 (15) 4 (10)
University LRT station 75 (48.4) 16 (21.3) 10 (13.3)
University of Malaya 20 (12.9) 5 (25) 2 (10)
PJ17 Pasar malam 20 (12.9) 4 (20) 4 (20)
Total 155 31 (20) 20 (12.9)
Table 4.3: Distribution of Listeria species and L. monocytogenes isolated in RTE foods
from street-side hawker stalls by food categories
Total Listeria spp. (%) L. monocytogenes (%)
Beverage 5 1(20) 1(20)
Cooked beef and beef products 7 0 0
Cooked chicken and chicken products 29 7(24.1) 5(17.2)
Cooked egg and egg products 20 4(20) 2(10)
Salads and vegetables 70 17(24.3) 11(15.7)
Cooked seafood and seafood products 14 2(14.3) 1(7.1)
Other 10 0 0
Total 155 31(20) 20(12.9)
4.2.2 Distribution of Listeria spp. and L. monocytogenes isolated in RTE foods from
hypermarkets
Out of 250 studied RTE food samples, 95 (38%) were purchased from
hypermarkets over the course of six months from August 2011 through January 2012.
Fifty six (58.9%) of the RTE food samples were from hypermarket X and 39 (41.1%)
were from hypermarket Y. Listeria species was isolated from 21 (22.1%) of the 95
studied RTE food samples and 12 (57.1%) of contaminated samples were positive for L.
monocytogenes. Hypermarkets X and Y had 7 (58.3%) and 5 (41.7%) positive samples
for L. monocytogenes, respectively (Table 4.4).
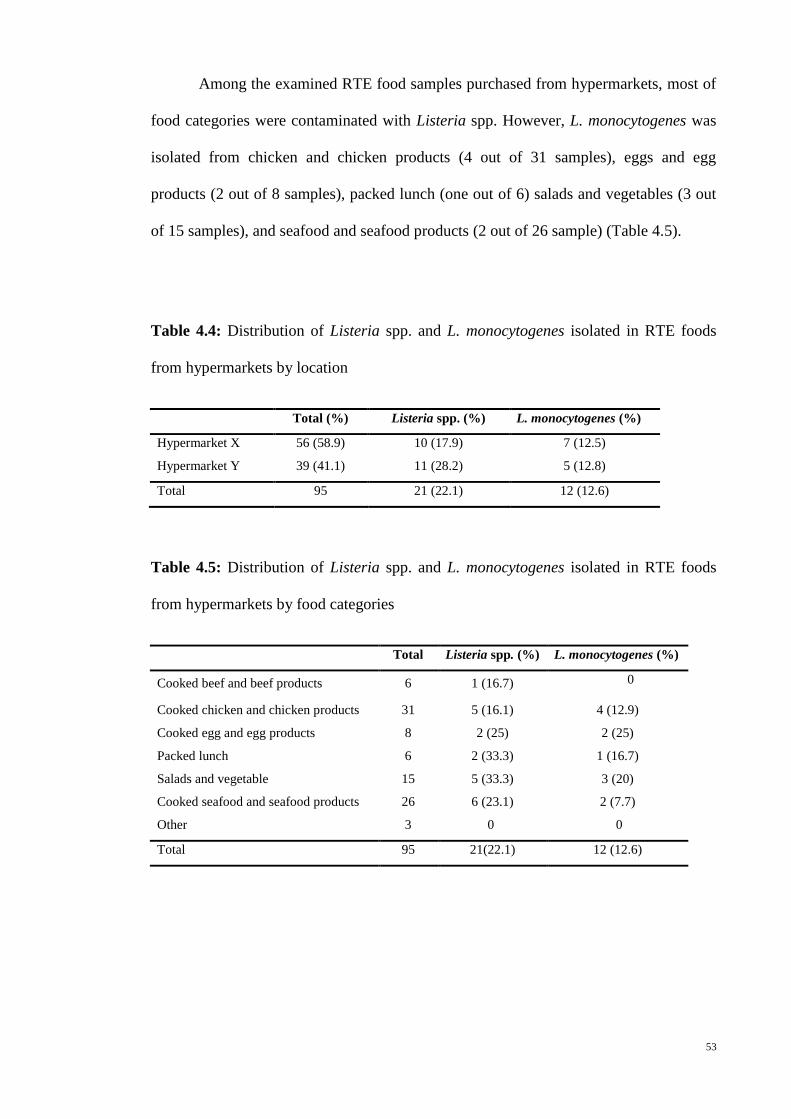
53
Among the examined RTE food samples purchased from hypermarkets, most of
food categories were contaminated with Listeria spp. However, L. monocytogenes was
isolated from chicken and chicken products (4 out of 31 samples), eggs and egg
products (2 out of 8 samples), packed lunch (one out of 6) salads and vegetables (3 out
of 15 samples), and seafood and seafood products (2 out of 26 sample) (Table 4.5).
Table 4.4: Distribution of Listeria spp. and L. monocytogenes isolated in RTE foods
from hypermarkets by location
Total (%) Listeria spp. (%) L. monocytogenes (%)
Hypermarket X 56 (58.9) 10 (17.9) 7 (12.5)
Hypermarket Y 39 (41.1) 11 (28.2) 5 (12.8)
Total 95 21 (22.1) 12 (12.6)
Table 4.5: Distribution of Listeria spp. and L. monocytogenes isolated in RTE foods
from hypermarkets by food categories
Total Listeria spp. (%) L. monocytogenes (%)
Cooked beef and beef products 6 1 (16.7) 0
Cooked chicken and chicken products 31 5 (16.1) 4 (12.9)
Cooked egg and egg products 8 2 (25) 2 (25)
Packed lunch 6 2 (33.3) 1 (16.7)
Salads and vegetable 15 5 (33.3) 3 (20)
Cooked seafood and seafood products 26 6 (23.1) 2 (7.7)
Other 3 0 0
Total 95 21(22.1) 12 (12.6)
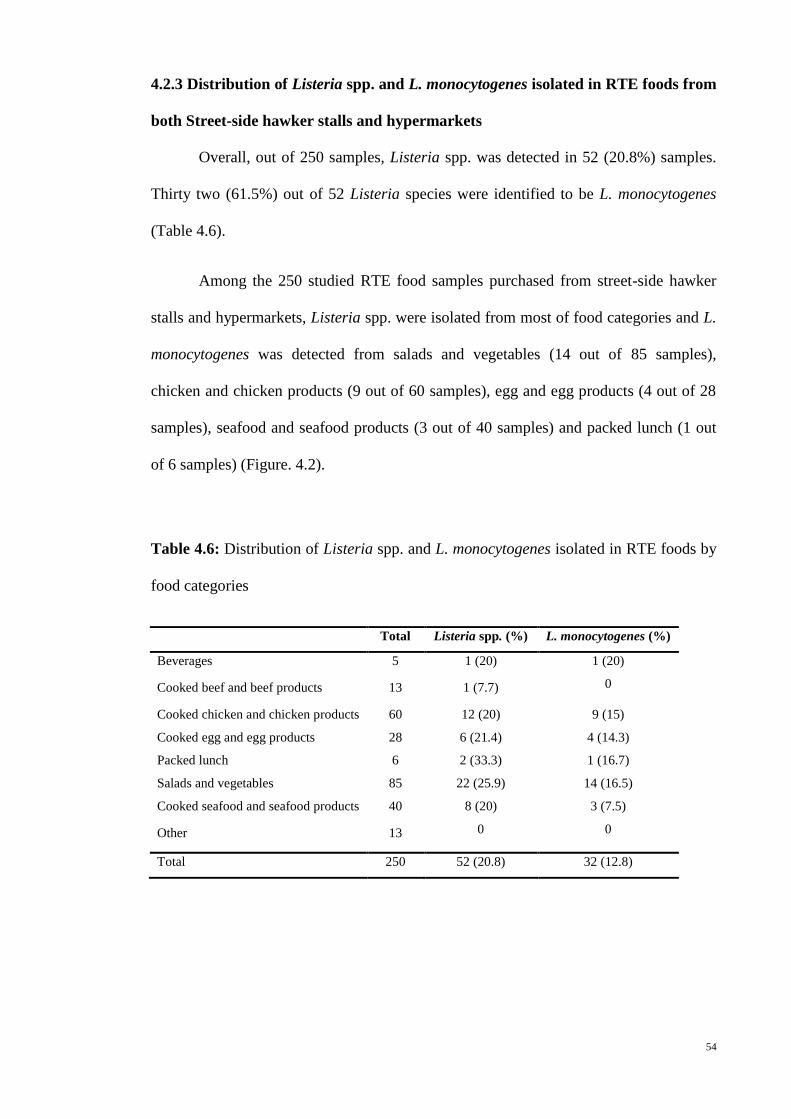
54
4.2.3 Distribution of Listeria spp. and L. monocytogenes isolated in RTE foods from
both Street-side hawker stalls and hypermarkets
Overall, out of 250 samples, Listeria spp. was detected in 52 (20.8%) samples.
Thirty two (61.5%) out of 52 Listeria species were identified to be L. monocytogenes
(Table 4.6).
Among the 250 studied RTE food samples purchased from street-side hawker
stalls and hypermarkets, Listeria spp. were isolated from most of food categories and L.
monocytogenes was detected from salads and vegetables (14 out of 85 samples),
chicken and chicken products (9 out of 60 samples), egg and egg products (4 out of 28
samples), seafood and seafood products (3 out of 40 samples) and packed lunch (1 out
of 6 samples) (Figure. 4.2).
Table 4.6: Distribution of Listeria spp. and L. monocytogenes isolated in RTE foods by
food categories
Total Listeria spp. (%) L. monocytogenes (%)
Beverages 5 1 (20) 1 (20)
Cooked beef and beef products 13 1 (7.7) 0
Cooked chicken and chicken products 60 12 (20) 9 (15)
Cooked egg and egg products 28 6 (21.4) 4 (14.3)
Packed lunch 6 2 (33.3) 1 (16.7)
Salads and vegetables 85 22 (25.9) 14 (16.5)
Cooked seafood and seafood products 40 8 (20) 3 (7.5)
Other 13 0 0
Total 250 52 (20.8) 32 (12.8)
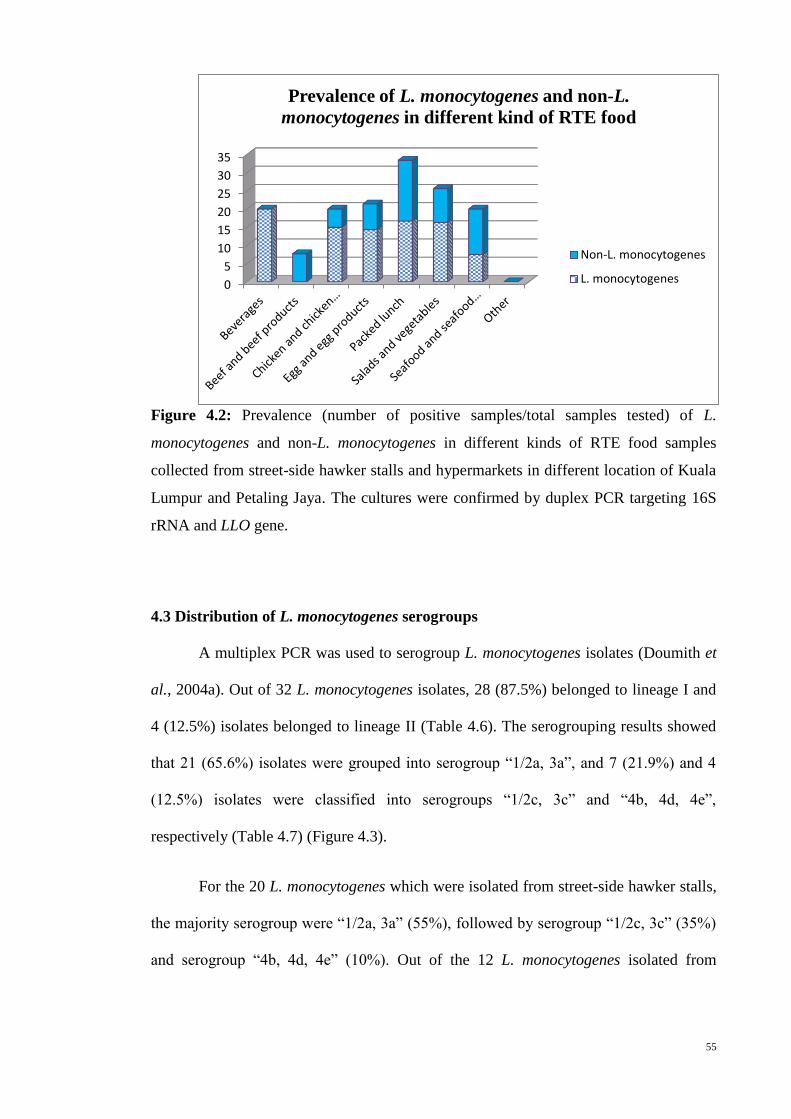
55
Figure 4.2: Prevalence (number of positive samples/total samples tested) of L.
monocytogenes and non-L. monocytogenes in different kinds of RTE food samples
collected from street-side hawker stalls and hypermarkets in different location of Kuala
Lumpur and Petaling Jaya. The cultures were confirmed by duplex PCR targeting 16S
rRNA and LLO gene.
4.3 Distribution of L. monocytogenes serogroups
A multiplex PCR was used to serogroup L. monocytogenes isolates (Doumith et
al., 2004a). Out of 32 L. monocytogenes isolates, 28 (87.5%) belonged to lineage I and
4 (12.5%) isolates belonged to lineage II (Table 4.6). The serogrouping results showed
that 21 (65.6%) isolates were grouped into serogroup “1/2a, 3a”, and 7 (21.9%) and 4
(12.5%) isolates were classified into serogroups “1/2c, 3c” and “4b, 4d, 4e”,
respectively (Table 4.7) (Figure 4.3).
For the 20 L. monocytogenes which were isolated from street-side hawker stalls,
the majority serogroup were “1/2a, 3a” (55%), followed by serogroup “1/2c, 3c” (35%)
and serogroup “4b, 4d, 4e” (10%). Out of the 12 L. monocytogenes isolated from
0
5
10
15
20
25
30
35
Prevalence of L. monocytogenes and non-L.
monocytogenes in different kind of RTE food
Non-L. monocytogenes
L. monocytogenes
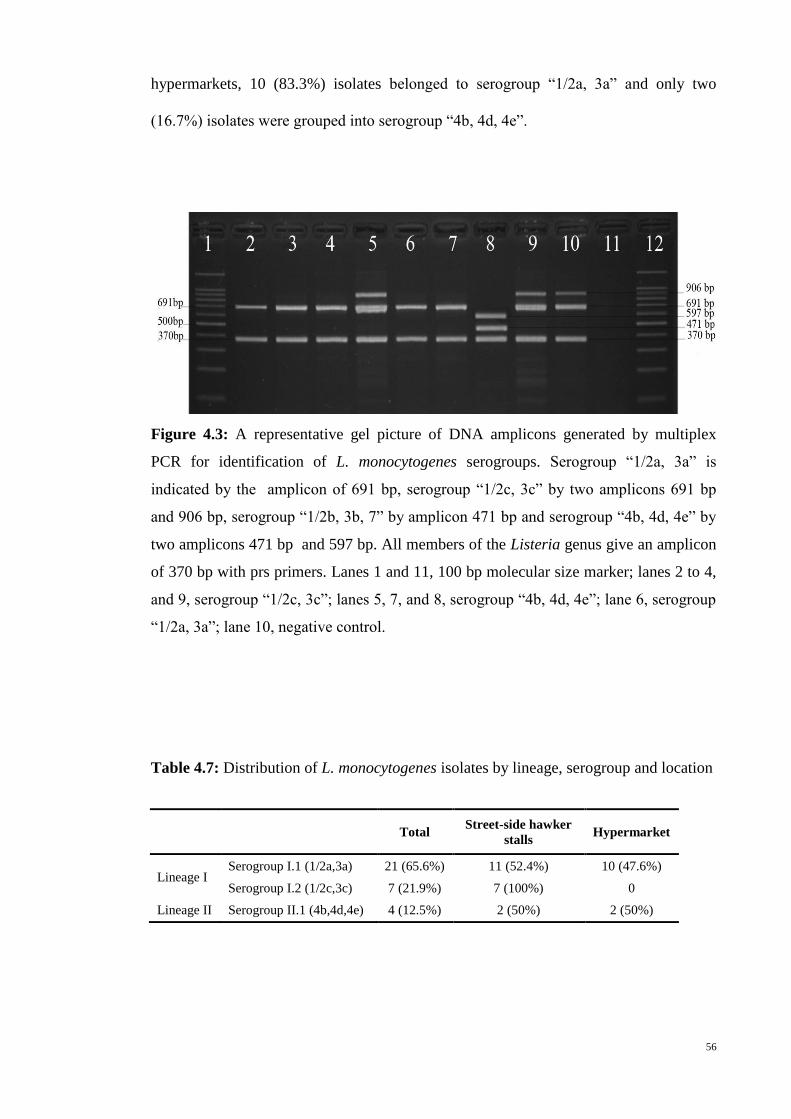
56
hypermarkets, 10 (83.3%) isolates belonged to serogroup “1/2a, 3a” and only two
(16.7%) isolates were grouped into serogroup “4b, 4d, 4e”.
Figure 4.3: A representative gel picture of DNA amplicons generated by multiplex
PCR for identification of L. monocytogenes serogroups. Serogroup “1/2a, 3a” is
indicated by the amplicon of 691 bp, serogroup “1/2c, 3c” by two amplicons 691 bp
and 906 bp, serogroup “1/2b, 3b, 7” by amplicon 471 bp and serogroup “4b, 4d, 4e” by
two amplicons 471 bp and 597 bp. All members of the Listeria genus give an amplicon
of 370 bp with prs primers. Lanes 1 and 11, 100 bp molecular size marker; lanes 2 to 4,
and 9, serogroup “1/2c, 3c”; lanes 5, 7, and 8, serogroup “4b, 4d, 4e”; lane 6, serogroup
“1/2a, 3a”; lane 10, negative control.
Table 4.7: Distribution of L. monocytogenes isolates by lineage, serogroup and location
Total Street-side hawker
stalls Hypermarket
Lineage I Serogroup I.1 (1/2a,3a) 21 (65.6%) 11 (52.4%) 10 (47.6%)
Serogroup I.2 (1/2c,3c) 7 (21.9%) 7 (100%) 0
Lineage II Serogroup II.1 (4b,4d,4e) 4 (12.5%) 2 (50%) 2 (50%)
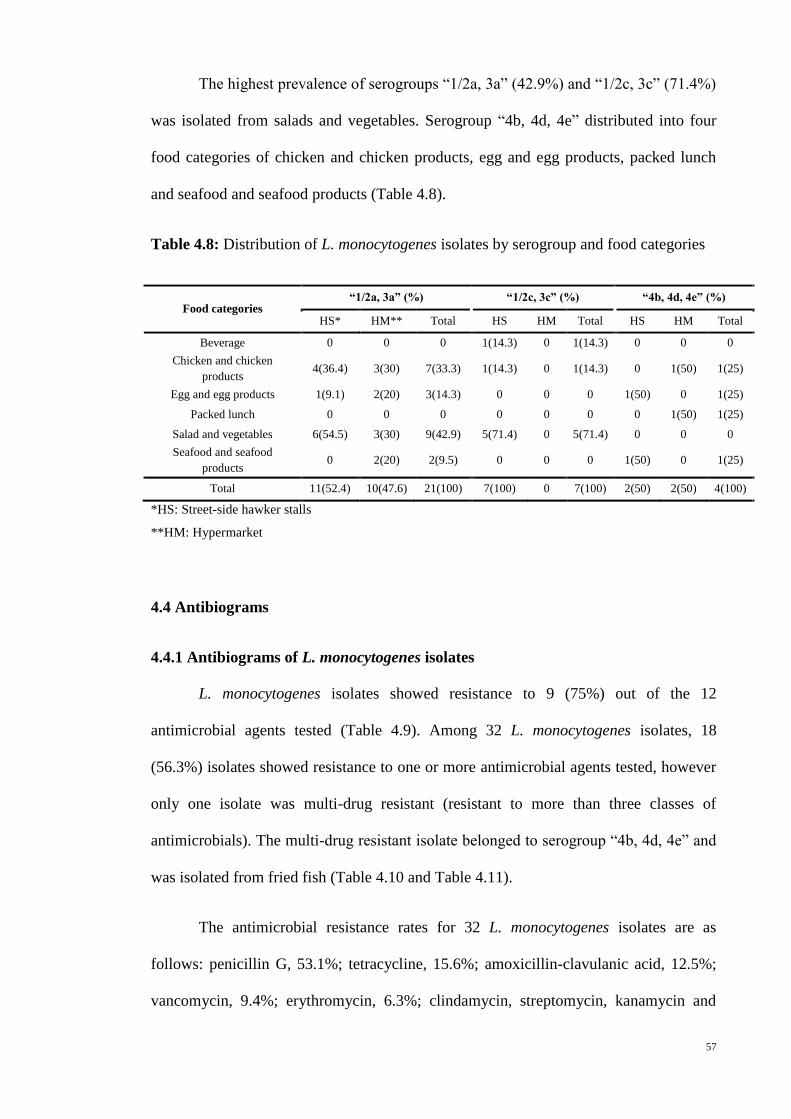
57
The highest prevalence of serogroups “1/2a, 3a” (42.9%) and “1/2c, 3c” (71.4%)
was isolated from salads and vegetables. Serogroup “4b, 4d, 4e” distributed into four
food categories of chicken and chicken products, egg and egg products, packed lunch
and seafood and seafood products (Table 4.8).
Table 4.8: Distribution of L. monocytogenes isolates by serogroup and food categories
Food categories “1/2a, 3a” (%) “1/2c, 3c” (%) “4b, 4d, 4e” (%)
HS* HM** Total HS HM Total HS HM Total
Beverage 0 0 0 1(14.3) 0 1(14.3) 0 0 0
Chicken and chicken
products 4(36.4) 3(30) 7(33.3) 1(14.3) 0 1(14.3) 0 1(50) 1(25)
Egg and egg products 1(9.1) 2(20) 3(14.3) 0 0 0 1(50) 0 1(25)
Packed lunch 0 0 0 0 0 0 0 1(50) 1(25)
Salad and vegetables 6(54.5) 3(30) 9(42.9) 5(71.4) 0 5(71.4) 0 0 0
Seafood and seafood
products 0 2(20) 2(9.5) 0 0 0 1(50) 0 1(25)
Total 11(52.4) 10(47.6) 21(100) 7(100) 0 7(100) 2(50) 2(50) 4(100)
*HS: Street-side hawker stalls
**HM: Hypermarket
4.4 Antibiograms
4.4.1 Antibiograms of L. monocytogenes isolates
L. monocytogenes isolates showed resistance to 9 (75%) out of the 12
antimicrobial agents tested (Table 4.9). Among 32 L. monocytogenes isolates, 18
(56.3%) isolates showed resistance to one or more antimicrobial agents tested, however
only one isolate was multi-drug resistant (resistant to more than three classes of
antimicrobials). The multi-drug resistant isolate belonged to serogroup “4b, 4d, 4e” and
was isolated from fried fish (Table 4.10 and Table 4.11).
The antimicrobial resistance rates for 32 L. monocytogenes isolates are as
follows: penicillin G, 53.1%; tetracycline, 15.6%; amoxicillin-clavulanic acid, 12.5%;
vancomycin, 9.4%; erythromycin, 6.3%; clindamycin, streptomycin, kanamycin and
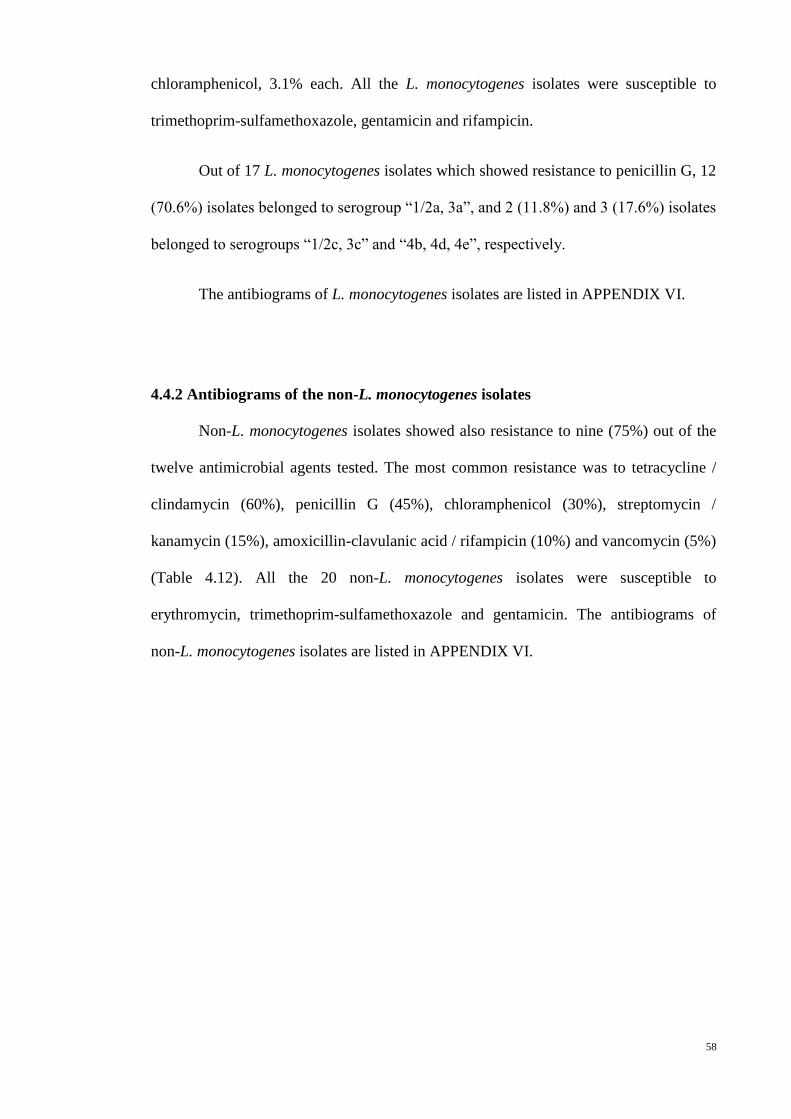
58
chloramphenicol, 3.1% each. All the L. monocytogenes isolates were susceptible to
trimethoprim-sulfamethoxazole, gentamicin and rifampicin.
Out of 17 L. monocytogenes isolates which showed resistance to penicillin G, 12
(70.6%) isolates belonged to serogroup “1/2a, 3a”, and 2 (11.8%) and 3 (17.6%) isolates
belonged to serogroups “1/2c, 3c” and “4b, 4d, 4e”, respectively.
The antibiograms of L. monocytogenes isolates are listed in APPENDIX VI.
4.4.2 Antibiograms of the non-L. monocytogenes isolates
Non-L. monocytogenes isolates showed also resistance to nine (75%) out of the
twelve antimicrobial agents tested. The most common resistance was to tetracycline /
clindamycin (60%), penicillin G (45%), chloramphenicol (30%), streptomycin /
kanamycin (15%), amoxicillin-clavulanic acid / rifampicin (10%) and vancomycin (5%)
(Table 4.12). All the 20 non-L. monocytogenes isolates were susceptible to
erythromycin, trimethoprim-sulfamethoxazole and gentamicin. The antibiograms of
non-L. monocytogenes isolates are listed in APPENDIX VI.
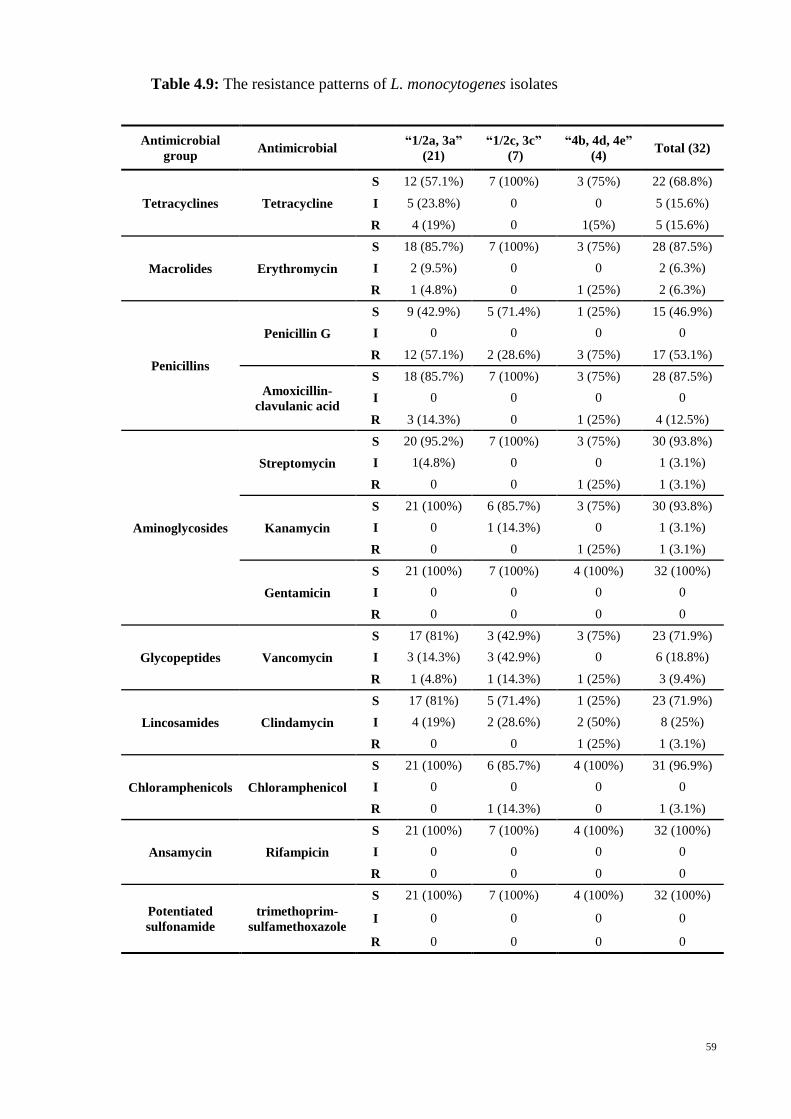
59
Table 4.9: The resistance patterns of L. monocytogenes isolates
Antimicrobial
group Antimicrobial
“1/2a, 3a”
(21)
“1/2c, 3c”
(7)
“4b, 4d, 4e”
(4) Total (32)
Tetracyclines Tetracycline
S 12 (57.1%) 7 (100%) 3 (75%) 22 (68.8%)
I 5 (23.8%) 0 0 5 (15.6%)
R 4 (19%) 0 1(5%) 5 (15.6%)
Macrolides Erythromycin
S 18 (85.7%) 7 (100%) 3 (75%) 28 (87.5%)
I 2 (9.5%) 0 0 2 (6.3%)
R 1 (4.8%) 0 1 (25%) 2 (6.3%)
Penicillins
Penicillin G
S 9 (42.9%) 5 (71.4%) 1 (25%) 15 (46.9%)
I 0 0 0 0
R 12 (57.1%) 2 (28.6%) 3 (75%) 17 (53.1%)
Amoxicillin-
clavulanic acid
S 18 (85.7%) 7 (100%) 3 (75%) 28 (87.5%)
I 0 0 0 0
R 3 (14.3%) 0 1 (25%) 4 (12.5%)
Aminoglycosides
Streptomycin
S 20 (95.2%) 7 (100%) 3 (75%) 30 (93.8%)
I 1(4.8%) 0 0 1 (3.1%)
R 0 0 1 (25%) 1 (3.1%)
Kanamycin
S 21 (100%) 6 (85.7%) 3 (75%) 30 (93.8%)
I 0 1 (14.3%) 0 1 (3.1%)
R 0 0 1 (25%) 1 (3.1%)
Gentamicin
S 21 (100%) 7 (100%) 4 (100%) 32 (100%)
I 0 0 0 0
R 0 0 0 0
Glycopeptides Vancomycin
S 17 (81%) 3 (42.9%) 3 (75%) 23 (71.9%)
I 3 (14.3%) 3 (42.9%) 0 6 (18.8%)
R 1 (4.8%) 1 (14.3%) 1 (25%) 3 (9.4%)
Lincosamides Clindamycin
S 17 (81%) 5 (71.4%) 1 (25%) 23 (71.9%)
I 4 (19%) 2 (28.6%) 2 (50%) 8 (25%)
R 0 0 1 (25%) 1 (3.1%)
Chloramphenicols Chloramphenicol
S 21 (100%) 6 (85.7%) 4 (100%) 31 (96.9%)
I 0 0 0 0
R 0 1 (14.3%) 0 1 (3.1%)
Ansamycin Rifampicin
S 21 (100%) 7 (100%) 4 (100%) 32 (100%)
I 0 0 0 0
R 0 0 0 0
Potentiated
sulfonamide
trimethoprim-
sulfamethoxazole
S 21 (100%) 7 (100%) 4 (100%) 32 (100%)
I 0 0 0 0
R 0 0 0 0
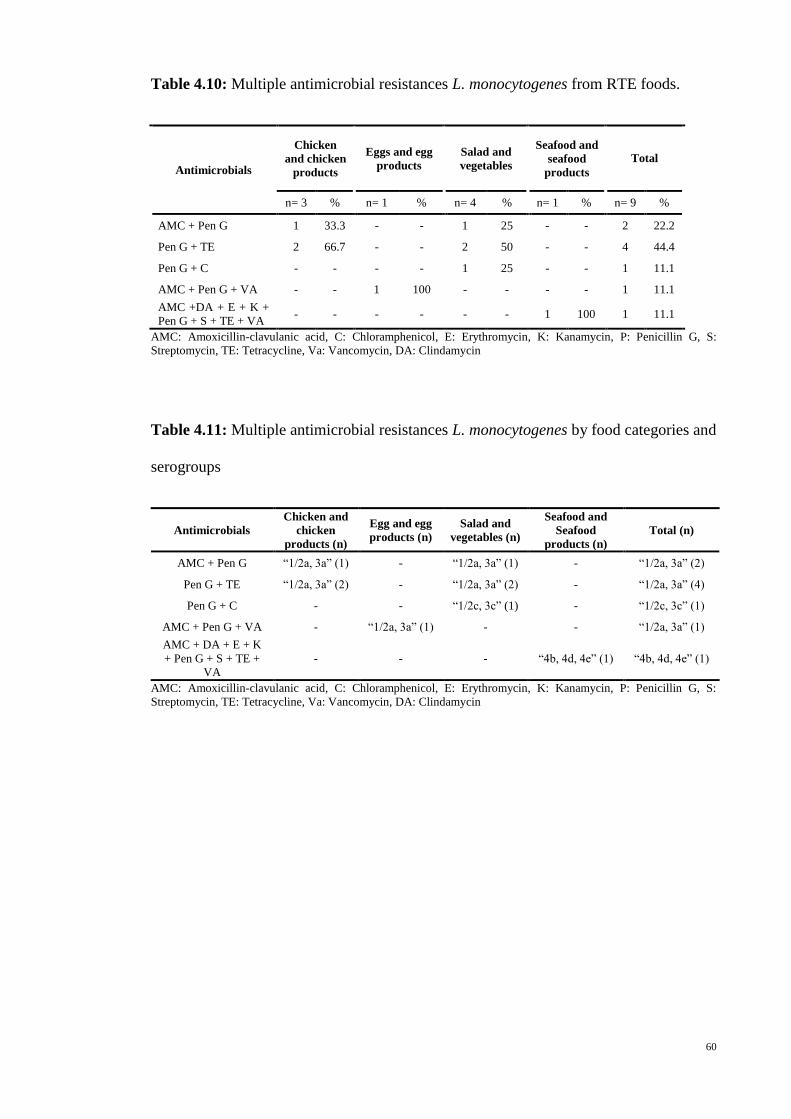
60
Table 4.10: Multiple antimicrobial resistances L. monocytogenes from RTE foods.
Antimicrobials
Chicken
and chicken
products
Eggs and egg
products
Salad and
vegetables
Seafood and
seafood
products
Total
n= 3 % n= 1 % n= 4 % n= 1 % n= 9 %
AMC + Pen G 1 33.3 - - 1 25 - - 2 22.2
Pen G + TE 2 66.7 - - 2 50 - - 4 44.4
Pen G + C - - - - 1 25 - - 1 11.1
AMC + Pen G + VA - - 1 100 - - - - 1 11.1
AMC +DA + E + K +
Pen G + S + TE + VA - - - - - - 1 100 1 11.1
AMC: Amoxicillin-clavulanic acid, C: Chloramphenicol, E: Erythromycin, K: Kanamycin, P: Penicillin G, S:
Streptomycin, TE: Tetracycline, Va: Vancomycin, DA: Clindamycin
Table 4.11: Multiple antimicrobial resistances L. monocytogenes by food categories and
serogroups
Antimicrobials
Chicken and
chicken
products (n)
Egg and egg
products (n)
Salad and
vegetables (n)
Seafood and
Seafood
products (n)
Total (n)
AMC + Pen G “1/2a, 3a” (1) - “1/2a, 3a” (1) - “1/2a, 3a” (2)
Pen G + TE “1/2a, 3a” (2) - “1/2a, 3a” (2) - “1/2a, 3a” (4)
Pen G + C - - “1/2c, 3c” (1) - “1/2c, 3c” (1)
AMC + Pen G + VA - “1/2a, 3a” (1) - - “1/2a, 3a” (1)
AMC + DA + E + K
+ Pen G + S + TE +
VA
- - - “4b, 4d, 4e” (1) “4b, 4d, 4e” (1)
AMC: Amoxicillin-clavulanic acid, C: Chloramphenicol, E: Erythromycin, K: Kanamycin, P: Penicillin G, S:
Streptomycin, TE: Tetracycline, Va: Vancomycin, DA: Clindamycin
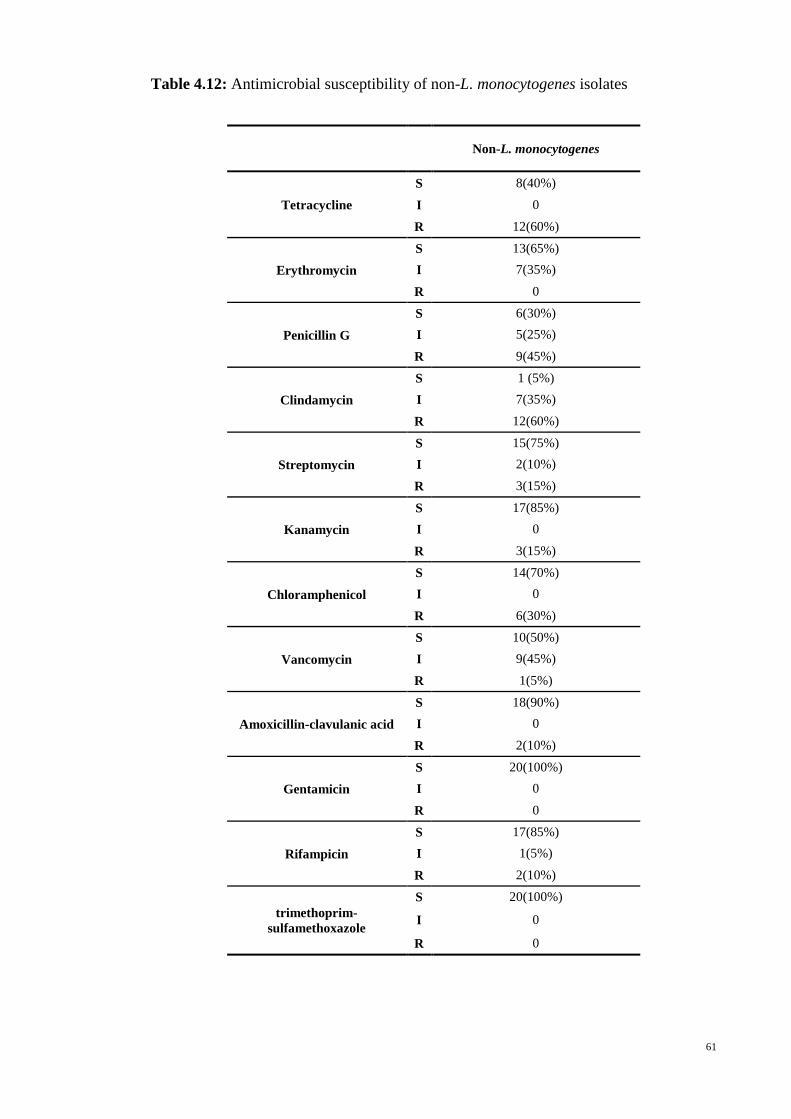
61
Table 4.12: Antimicrobial susceptibility of non-L. monocytogenes isolates
Non-L. monocytogenes
Tetracycline
S 8(40%)
I 0
R 12(60%)
Erythromycin
S 13(65%)
I 7(35%)
R 0
Penicillin G
S 6(30%)
I 5(25%)
R 9(45%)
Clindamycin
S 1 (5%)
I 7(35%)
R 12(60%)
Streptomycin
S 15(75%)
I 2(10%)
R 3(15%)
Kanamycin
S 17(85%)
I 0
R 3(15%)
Chloramphenicol
S 14(70%)
I 0
R 6(30%)
Vancomycin
S 10(50%)
I 9(45%)
R 1(5%)
Amoxicillin-clavulanic acid
S 18(90%)
I 0
R 2(10%)
Gentamicin
S 20(100%)
I 0
R 0
Rifampicin
S 17(85%)
I 1(5%)
R 2(10%)
trimethoprim-
sulfamethoxazole
S 20(100%)
I 0
R 0
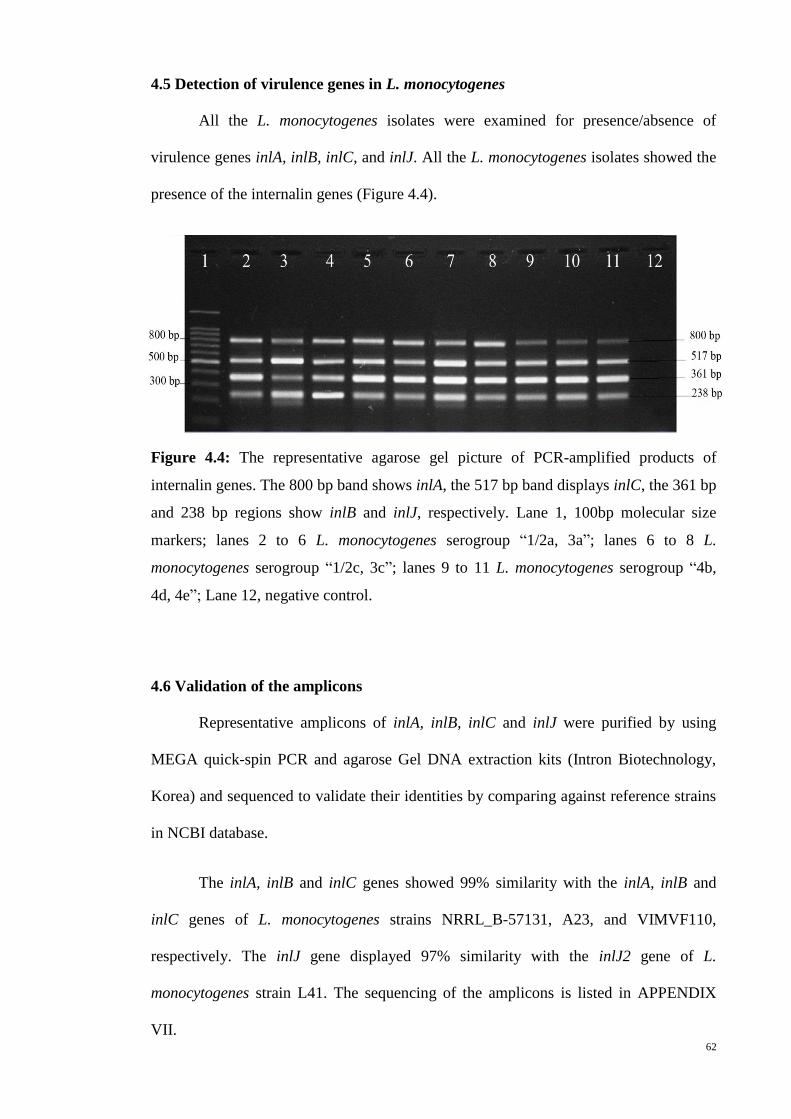
62
4.5 Detection of virulence genes in L. monocytogenes
All the L. monocytogenes isolates were examined for presence/absence of
virulence genes inlA, inlB, inlC, and inlJ. All the L. monocytogenes isolates showed the
presence of the internalin genes (Figure 4.4).
Figure 4.4: The representative agarose gel picture of PCR-amplified products of
internalin genes. The 800 bp band shows inlA, the 517 bp band displays inlC, the 361 bp
and 238 bp regions show inlB and inlJ, respectively. Lane 1, 100bp molecular size
markers; lanes 2 to 6 L. monocytogenes serogroup “1/2a, 3a”; lanes 6 to 8 L.
monocytogenes serogroup “1/2c, 3c”; lanes 9 to 11 L. monocytogenes serogroup “4b,
4d, 4e”; Lane 12, negative control.
4.6 Validation of the amplicons
Representative amplicons of inlA, inlB, inlC and inlJ were purified by using
MEGA quick-spin PCR and agarose Gel DNA extraction kits (Intron Biotechnology,
Korea) and sequenced to validate their identities by comparing against reference strains
in NCBI database.
The inlA, inlB and inlC genes showed 99% similarity with the inlA, inlB and
inlC genes of L. monocytogenes strains NRRL_B-57131, A23, and VIMVF110,
respectively. The inlJ gene displayed 97% similarity with the inlJ2 gene of L.
monocytogenes strain L41. The sequencing of the amplicons is listed in APPENDIX
VII.
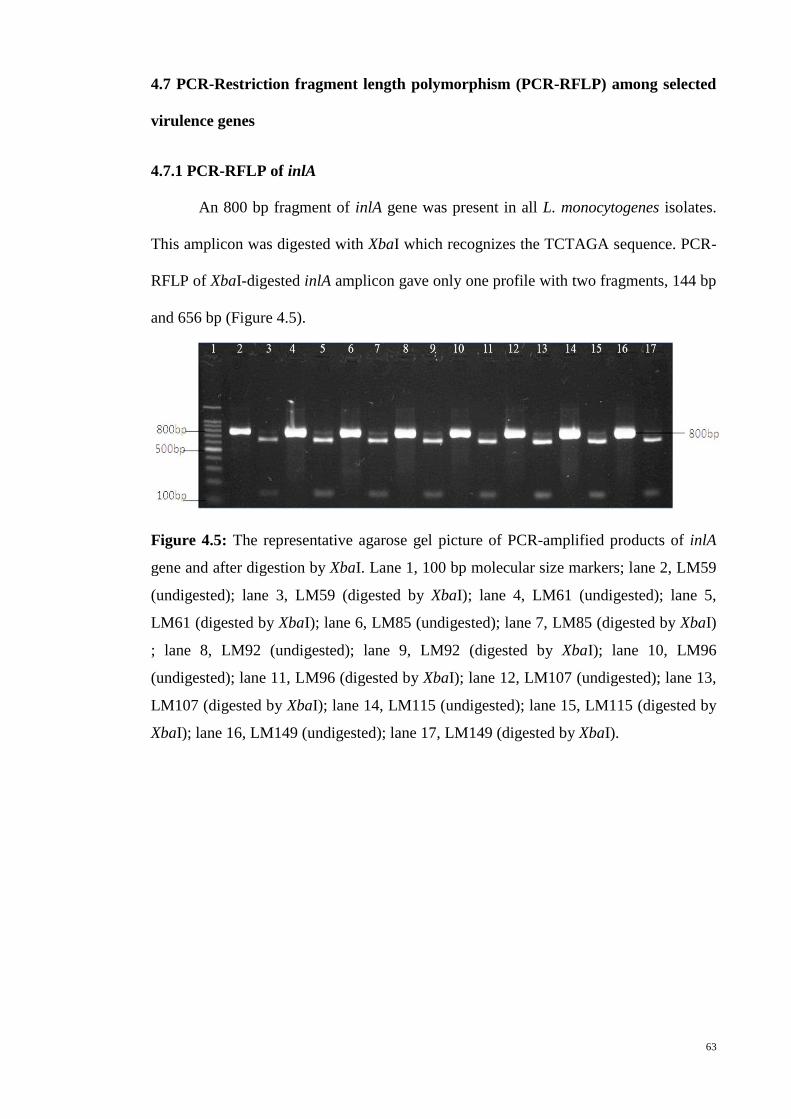
63
4.7 PCR-Restriction fragment length polymorphism (PCR-RFLP) among selected
virulence genes
4.7.1 PCR-RFLP of inlA
An 800 bp fragment of inlA gene was present in all L. monocytogenes isolates.
This amplicon was digested with XbaI which recognizes the TCTAGA sequence. PCR-
RFLP of XbaI-digested inlA amplicon gave only one profile with two fragments, 144 bp
and 656 bp (Figure 4.5).
Figure 4.5: The representative agarose gel picture of PCR-amplified products of inlA
gene and after digestion by XbaI. Lane 1, 100 bp molecular size markers; lane 2, LM59
(undigested); lane 3, LM59 (digested by XbaI); lane 4, LM61 (undigested); lane 5,
LM61 (digested by XbaI); lane 6, LM85 (undigested); lane 7, LM85 (digested by XbaI)
; lane 8, LM92 (undigested); lane 9, LM92 (digested by XbaI); lane 10, LM96
(undigested); lane 11, LM96 (digested by XbaI); lane 12, LM107 (undigested); lane 13,
LM107 (digested by XbaI); lane 14, LM115 (undigested); lane 15, LM115 (digested by
XbaI); lane 16, LM149 (undigested); lane 17, LM149 (digested by XbaI).
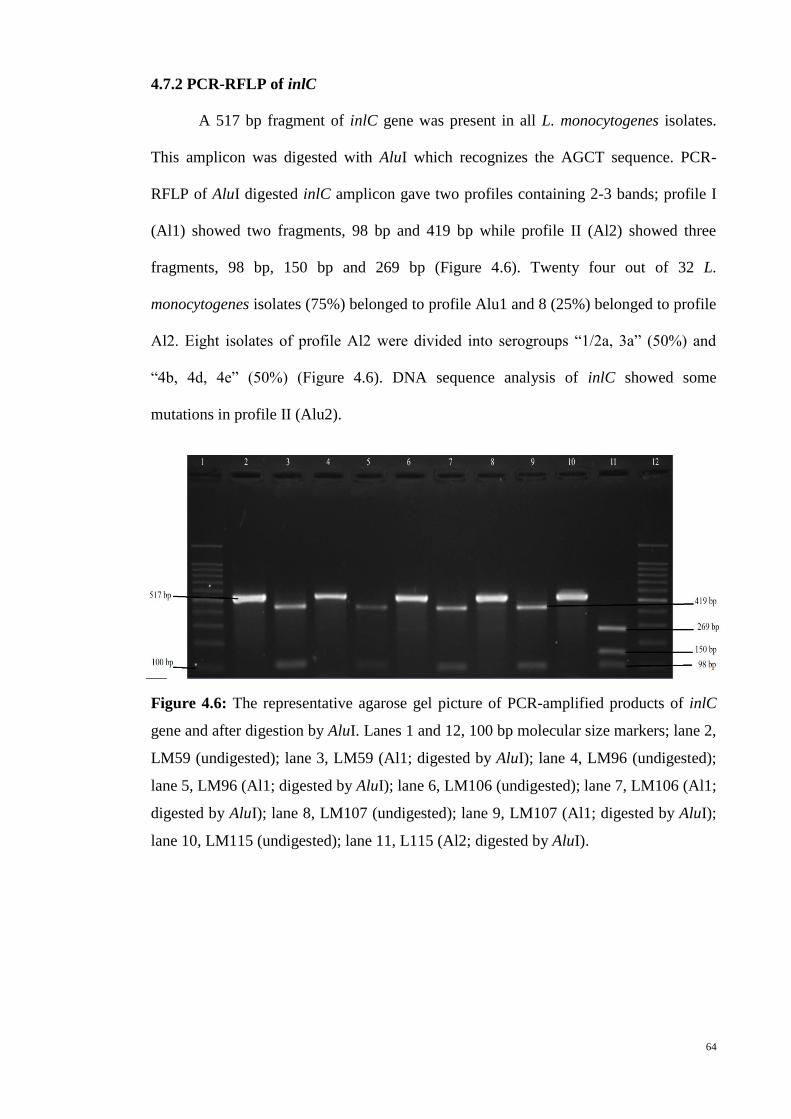
64
4.7.2 PCR-RFLP of inlC
A 517 bp fragment of inlC gene was present in all L. monocytogenes isolates.
This amplicon was digested with AluI which recognizes the AGCT sequence. PCR-
RFLP of AluI digested inlC amplicon gave two profiles containing 2-3 bands; profile I
(Al1) showed two fragments, 98 bp and 419 bp while profile II (Al2) showed three
fragments, 98 bp, 150 bp and 269 bp (Figure 4.6). Twenty four out of 32 L.
monocytogenes isolates (75%) belonged to profile Alu1 and 8 (25%) belonged to profile
Al2. Eight isolates of profile Al2 were divided into serogroups “1/2a, 3a” (50%) and
“4b, 4d, 4e” (50%) (Figure 4.6). DNA sequence analysis of inlC showed some
mutations in profile II (Alu2).
Figure 4.6: The representative agarose gel picture of PCR-amplified products of inlC
gene and after digestion by AluI. Lanes 1 and 12, 100 bp molecular size markers; lane 2,
LM59 (undigested); lane 3, LM59 (Al1; digested by AluI); lane 4, LM96 (undigested);
lane 5, LM96 (Al1; digested by AluI); lane 6, LM106 (undigested); lane 7, LM106 (Al1;
digested by AluI); lane 8, LM107 (undigested); lane 9, LM107 (Al1; digested by AluI);
lane 10, LM115 (undigested); lane 11, L115 (Al2; digested by AluI).
65
4.8 PCR-based genotyping of L. monocytogenes
4.8.1 Repetitive Extragenic Palindromic (REP)-PCR
Molecular typing was done to differentiate the isolates of L. monocytogenes
isolated from RTE food samples and also to analyze genetic variability among the
isolates. Repetitive Extragenic Palindromic (REP)-PCR was performed using REP
primer (Navia et al., 1999).
A representative gel photo of REP-PCR is in Figure 4.7. All the 32 L.
monocytogenes isolates were typeable by REP-PCR into 28 distinct REP profiles (D=
0.992). REP profiles consisted of 5 to 18 bands with size ranging from 200 to 2000 bp.
The dendrogram based on the profiles obtained by REP-PCR is shown in Figure
4.8. Thirty two isolates of L. monocytogenes were grouped into eight distinctive clusters
(based at 80% similarity) by analysis of band-based. Cluster REP-a is represented by
nine isolates. The isolates were isolated from different types of foods, at different
sampling times and locations. The isolates belonged to serogroup “1/2a, 3a”. This
cluster shows 81.6% genetic similarity. However, four isolates (LM178 and LM 197;
LM192 and LM198) showed 100% genetic similarity. Isolates LM192 and LM198 were
from the same location and date sampling times while LM178 and LM197 were from
different locations and sampling times.
Cluster REP-b contained three isolates which were isolated from different food
categories at different sampling times and locations. The isolates were “4b, 4d, 4e”. The
genetic similarity was 80% in this cluster. In this cluster, two isolates (LM150 and
LM161) displayed 100% genetic similarity. The isolates were detected from different
types of foods (chicken and chicken products and packed lunch) at the same sampling
date and location (hypermarket X).
66
Cluster REP-c included two isolates which were grouped into serogroup “1/2c,
3c”. The isolates were isolated from different types of RTE foods and at different
sampling times and locations. The isolates showed 88% genetic similarity. Two isolates
were represented in cluster REP-d. Both isolates belonged to serogroup “1/2c, 3c”. The
isolates were detected from same RTE food (salad) and at the same date of sampling
and location (Pasar malam-PJ17). The genetic similarity of this cluster was 88.9%.
Three isolates were grouped into cluster REP-e. Two isolates were “1/2c, 3c”
and one isolate was “1/2a, 3a”. The isolates were isolated from different food categories
at different sampling times and locations. The cluster showed 81% genetic similarity.
Two isolates of serogroups “1/2a, 3a” and “1/2c, 3c” were grouped into cluster
REP-f. The isolates were detected from the same RTE food category at different
sampling times and locations. The cluster showed 80% genetic similarity.
Cluster REP-g contained three isolates which were isolated from different food
categories and locations and at different dates of sampling and locations. In this cluster
all isolates were “1/2a, 3a” and displayed 83.8% genetic similarity. However two
isolates (LM44 and LM50) from the same RTE food category and the same location and
date of sampling displayed 94.1% genetic similarity in this cluster.
Five isolates of serogroup “1/2a, 3a” were grouped into cluster REP-h. The
isolates were detected from different RTE food categories at different sampling times
and hypermarkets. Cluster REP-h showed 86.6% genetic similarity. However, two
isolates of LM214 and LM231 from different types of foods at the same sampling time
and location displayed 100% genetic similarity.
Cluster analysis of the 30 REP profiles clustered the 32 isolates into 8 groups
with members of the same serogroup being clustered in the same group and only three
exceptions, isolates LM31 (“1/2a, 3a”), LM85 (“1/2c, 3c”) and LM92 (“1/2a, 3a”) were
classified into unrelated clusters (Figure 4.9). Among three serogroups, “1/2a, 3a” had
67
the biggest cluster. Out of 21 L. monocytogenes serogroup “1/2a, 3a”, 18 REP profiles
were observed in different RTE food categories. There was no similarity observed
between the REP profiles of 7 L. monocytogenes serogroup “1/2c, 3c” recovered from
RTE foods. This serogroup was more common in salad and vegetables category (5/7).
Among 4 L. monocytogenes serogroup “4b, 4d, 4e”, 3 REP profiles were detected from
different RTE food categories. There was a low genetic diversity among the L.
monocytogenes serogroup “4b, 4d, 4e” as the 4 isolates were subtyped into 3 REP
profiles and differed by < 3 bands. It shows that REP-PCR, as an efficient method of
molecular typing for L. monocytogenes isolates, was able to distinguish the isolates with
different serogroups.
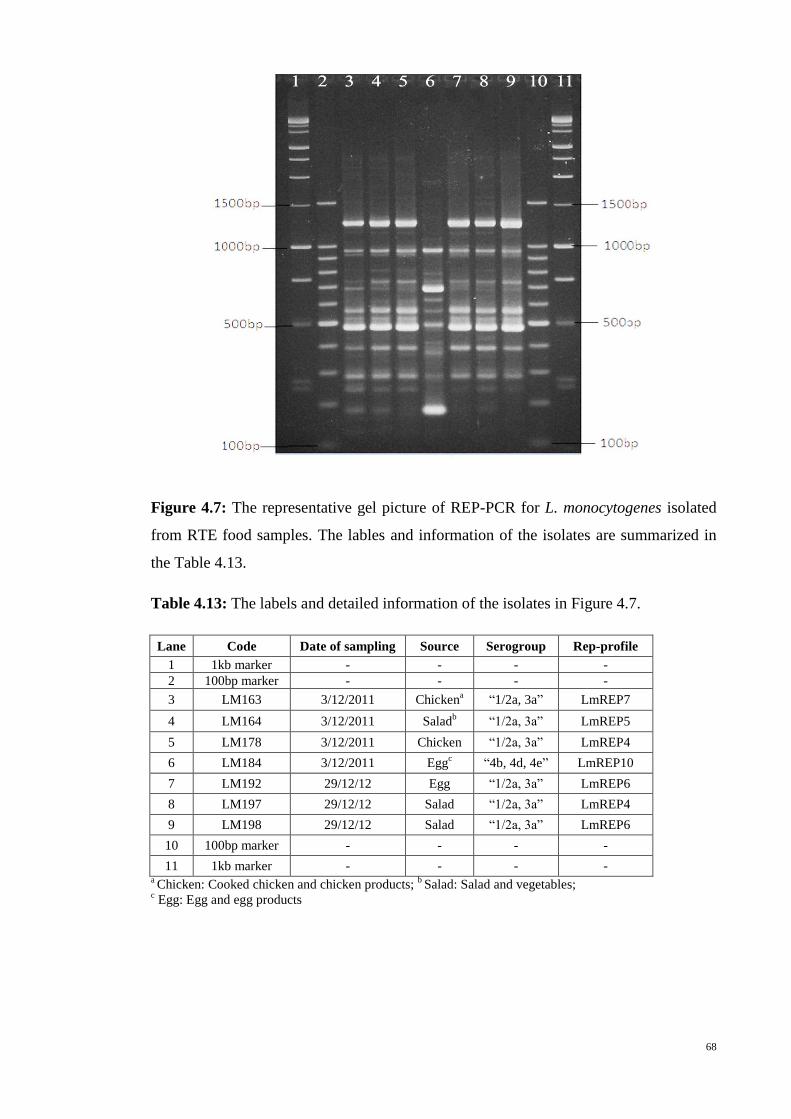
68
Figure 4.7: The representative gel picture of REP-PCR for L. monocytogenes isolated
from RTE food samples. The lables and information of the isolates are summarized in
the Table 4.13.
Table 4.13: The labels and detailed information of the isolates in Figure 4.7.
Lane Code Date of sampling Source Serogroup Rep-profile
1 1kb marker - - - -
2 100bp marker - - - -
3 LM163 3/12/2011 Chickena
“1/2a, 3a” LmREP7
4 LM164 3/12/2011 Saladb
“1/2a, 3a” LmREP5
5 LM178 3/12/2011 Chicken
“1/2a, 3a” LmREP4
6 LM184 3/12/2011 Eggc
“4b, 4d, 4e” LmREP10
7 LM192 29/12/12 Egg “1/2a, 3a” LmREP6
8 LM197 29/12/12 Salad “1/2a, 3a” LmREP4
9 LM198 29/12/12 Salad “1/2a, 3a” LmREP6
10 100bp marker - - - -
11 1kb marker - - - - a Chicken: Cooked chicken and chicken products;
b Salad: Salad and vegetables;
c Egg: Egg and egg products
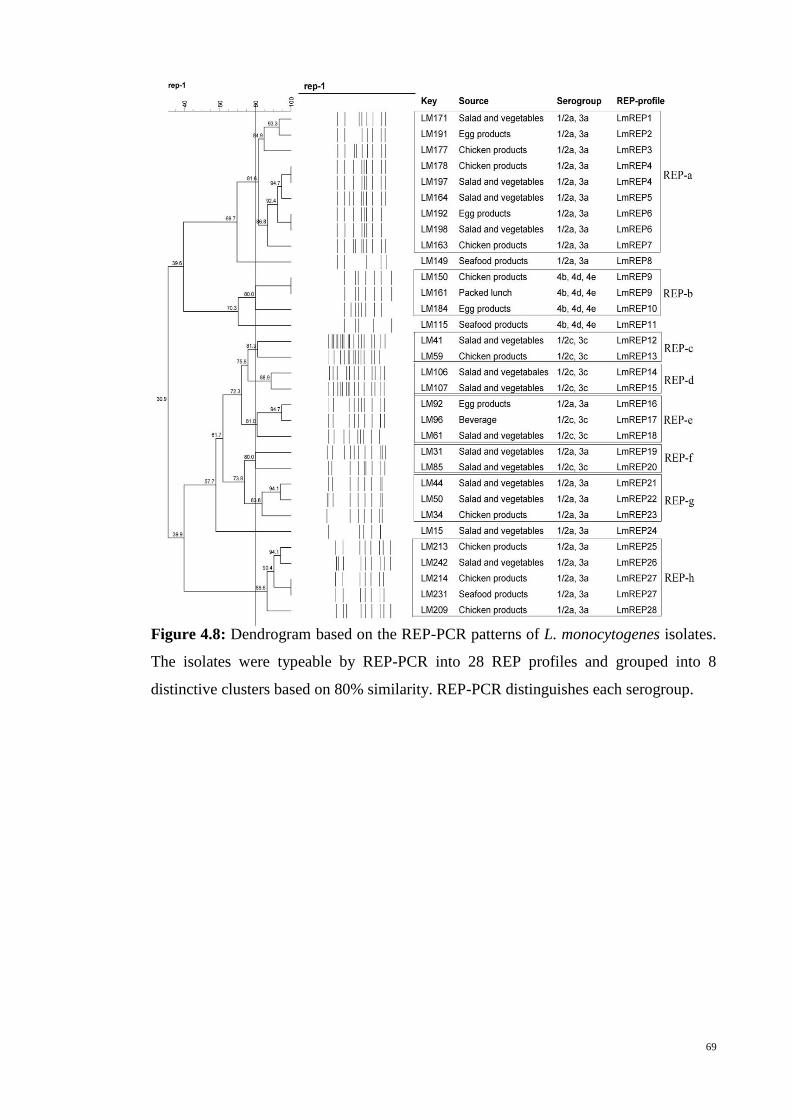
69
Figure 4.8: Dendrogram based on the REP-PCR patterns of L. monocytogenes isolates.
The isolates were typeable by REP-PCR into 28 REP profiles and grouped into 8
distinctive clusters based on 80% similarity. REP-PCR distinguishes each serogroup.
70
4.8.2 BOX-PCR
BOX-PCR was performed using BOX A1R primer (Versalovic et al., 1994). A
representative gel photo of BOX-PCR is in Figure 4.9. All the 32 L. monocytogenes
isolates were typeable by BOX-PCR into 31 distinct BOX profiles (D= 0.998). BOX
profiles consisted of 5 to 17 bands with size ranging from 200 to 2000 bp.
The dendrogram based on the profiles obtained by BOX-PCR is shown in Figure
4.10. Thirty two isolates of L. monocytogenes were grouped into nine distinctive
clusters by analysis of band-based.
Cluster BOX-I was represented by three isolates of serogroup “1/2c, 3c”. The
isolates were isolated from different food categories at the same sampling time and
location. This cluster showed 88.9% genetic similarity. However, two isolates of
LM106 and LM107 from the same RET food category displayed 100% genetic
similarity. Two isolates of serogroup “1/2a, 3a” from different types of foods were
grouped into cluster BOX-II. The isolates were isolated from the same location
(hypermarket X) and date of sampling. The cluster showed 85.7% genetic similarity.
Cluster BOX-III contained four isolates which were isolated from different RTE food
categories (three isolates from salad and vegetables and one isolate from chicken and
chicken products) at different sampling times and locations. The genetic similarity was
86.8% in this cluster. Three isolates of LM15, LM171 and LM 164 which isolated from
the same RTE food category displayed 87.5% genetic similarity.
Three isolates of serogroup “1/2c, 3c” were represented in cluster BOX-IV. The
isolates were detected from different food categories at different sampling times and
locations. The genetic similarity of this cluster was 83.3%. However, two isolates
(LM61 and LM85) which were detected from the category of salad and vegetable
showed 96.6% genetic similarity. Two isolates of serogroup “1/2a, 3a” were grouped
71
into cluster BOX-V. The cluster showed 81.8% genetic similarity. The isolates were
isolated from different food categories at different sampling times and locations.
Four isolates of serogroup “1/2a, 3a” and one isolate of serogroup “1/2c, 3c”
were grouped into cluster BOX-VI. The isolates were isolated from different types of
foods at different sampling times and locations. The cluster showed 86.7% genetic
similarity between these isolates. However, LM31 and LM34 which isolated at the same
sampling time and location displayed 97.3% genetic similarity.
Cluster BOX-VII contained two isolates of serogroup “1/2a, 3a”. The isolates
were detected from different RTE foods at different sampling times and locations. This
cluster showed a 81.2% genetic similarity. Two isolates of “1/2a, 3a” from different
types of food categories were grouped into cluster BOX-VIII. Although they isolated at
different sampling time and locations, they showed 85.7% genetic similarity. Two
isolates of serogroup “4b, 4d, 4e” from different types of RTE foods, at different
sampling times and locations were grouped into cluster BOX-VIIII. This cluster
displayed 90% genetic similarity.
Cluster analysis of the 31 BOX profiles clustered the 32 isolates into 9 groups
(based at 80% similarity) with members of the same serogroup being clustered in the
same group and only one exception, isolate LM41 (serogroup “1/2c, 3c”) was classified
into a unrelated cluster (Figure 4.11). Among three serogroups, “1/2a, 3a” had the
biggest cluster. Out of 7 L. monocytogenes serogroup “1/2c, 3c”, 6 BOX profiles were
observed in different RTE food categories. There was no similarity observed between
the BOX profiles of L. monocytogenes serogroups “1/2a, 3a” and “4b, 4d, 4e” isolates
recovered from RTE foods. Four isolates with serogroup “4b, 4d, 4e” were clustered
together by BOX-PCR (55.9% similarity). There was a low genetic diversity among the
L. monocytogenes serogroup “4b, 4d, 4e” as the 4 isolates were differed by < 3 bands. It
shows that BOX-PCR was able to differentiate the isolates with different serogroups.
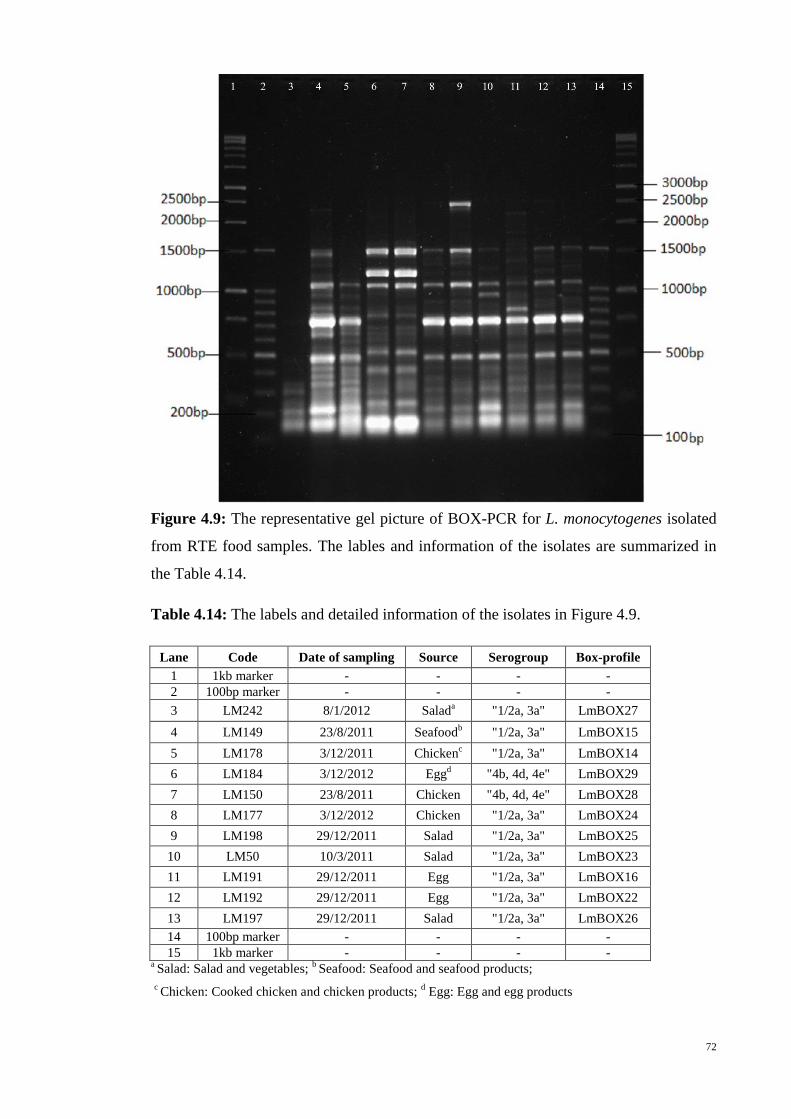
72
Figure 4.9: The representative gel picture of BOX-PCR for L. monocytogenes isolated
from RTE food samples. The lables and information of the isolates are summarized in
the Table 4.14.
Table 4.14: The labels and detailed information of the isolates in Figure 4.9.
Lane Code Date of sampling Source Serogroup Box-profile
1 1kb marker - - - -
2 100bp marker - - - -
3 LM242 8/1/2012 Salada
"1/2a, 3a" LmBOX27
4 LM149 23/8/2011 Seafoodb
"1/2a, 3a" LmBOX15
5 LM178 3/12/2011 Chickenc
"1/2a, 3a" LmBOX14
6 LM184 3/12/2012 Eggd
"4b, 4d, 4e" LmBOX29
7 LM150 23/8/2011 Chicken "4b, 4d, 4e" LmBOX28
8 LM177 3/12/2012 Chicken "1/2a, 3a" LmBOX24
9 LM198 29/12/2011 Salad "1/2a, 3a" LmBOX25
10 LM50 10/3/2011 Salad "1/2a, 3a" LmBOX23
11 LM191 29/12/2011 Egg "1/2a, 3a" LmBOX16
12 LM192 29/12/2011 Egg "1/2a, 3a" LmBOX22
13 LM197 29/12/2011 Salad "1/2a, 3a" LmBOX26
14 100bp marker - - - -
15 1kb marker - - - - a Salad: Salad and vegetables;
b Seafood: Seafood and seafood products;
c Chicken: Cooked chicken and chicken products;
d Egg: Egg and egg products
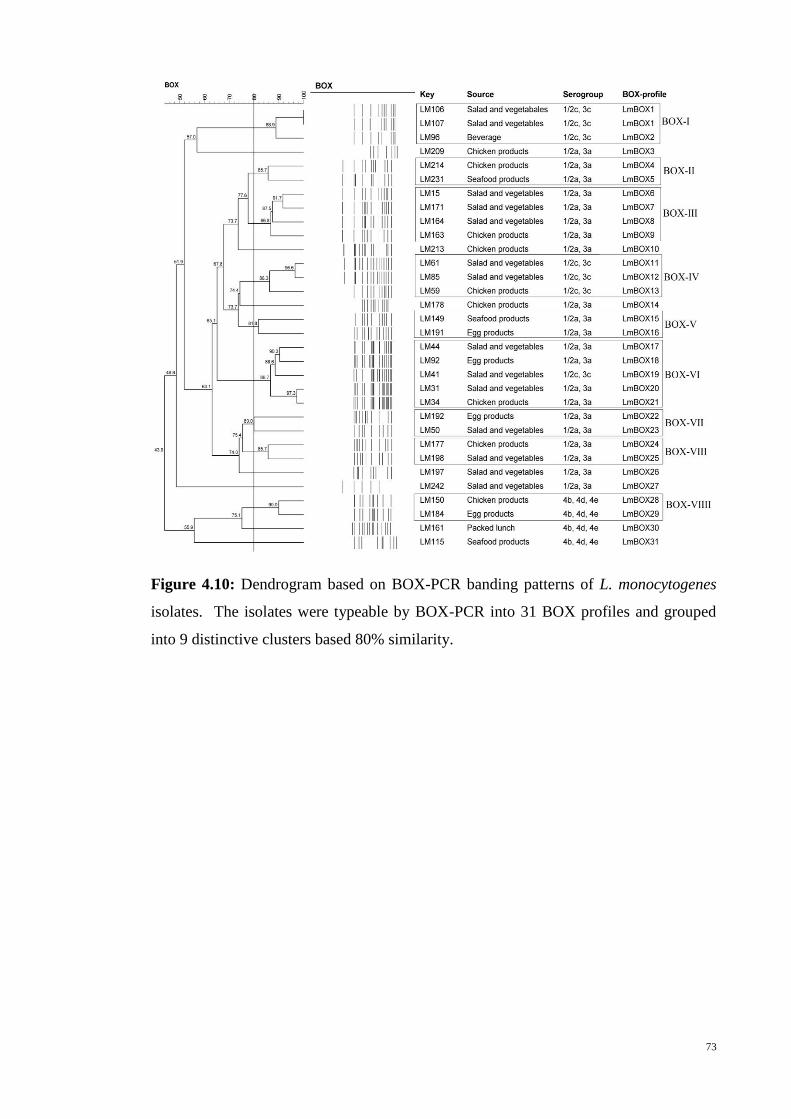
73
Figure 4.10: Dendrogram based on BOX-PCR banding patterns of L. monocytogenes
isolates. The isolates were typeable by BOX-PCR into 31 BOX profiles and grouped
into 9 distinctive clusters based 80% similarity.
74
4.8.3 Random Amplification of Polymorphic DNA (RAPD)
Random Amplification of Polymorphic DNA (RAPD) was performed using
OPA15 primer (Lee et al., 2011). A representative gel photo of RAPD has been
presented in Figure 4.11. All the 32 L. monocytogenes isolates were typeable by RAPD-
PCR into 32 distinct RAPD profiles (D= 1). RAPD profiles consisted of 3 to 12 bands
with size ranging from 200 to 2000 bp. The dendrogram based on the profiles obtained
by RAPD-PCR is shown in Figure 4.12. Thirty two isolates of L. monocytogenes were
grouped into four distinctive clusters by analysis of band-based.
Cluster RAPD-i was represented by two isolates of serogroup “1/2c, 3c”. The
isolates were isolated from the same RTE food (salad) at different sampling times and
locations. This cluster showed 80% genetic similarity.
Two isolates from the same RTE food categories (salad and vegetables) at
different sampling times and locations were grouped into cluster RAPD-ii. The isolates
belonged to serogroups “1,2a, 3a” and “1/2c, 3c”. The cluster showed 82.4% genetic
similarity.
Cluster RAPD-iii contained two isolates which were isolated from different RTE
food categories at the same sampling time and location. The isolates were “1/2c, 3c”.
The genetic similarity was 86.7% in this cluster.
Two isolates of serogroups “4b, 4d, 4e” and “1/2a, 3a” were represented in
cluster RAPD-iv. The isolates were detected from the same RTE food category (egg and
egg products) at different sampling times and locations. The genetic similarity of this
cluster was 83.3%.
Low level of similarity in the RAPD profiles of the isolates indicates a high
genetic diversity among the L. monocytogenes isolates. The RAPD profiles of LM191
(serogroup “1/2a, 3a”) and LM192 (serogroup “1/2a, 3a”), as two cases in point, which
have been isolated from a particular type of fried egg and from the same location and at

75
the same time, shared less than 21.2%. It affirms low level of genetic relatedness among
the L. monocytogenes. It is also observed in the dendrogram that there is a low level of
similarity among the isolates with the same serogroups. Two clusters included two
isolates from different serogroups (RAPD-ii and RAPD-iv). It shows that RAPD, as a
method of molecular typing for L. monocytogenes isolates, was not able to differentiate
the isolates with different serogroups.
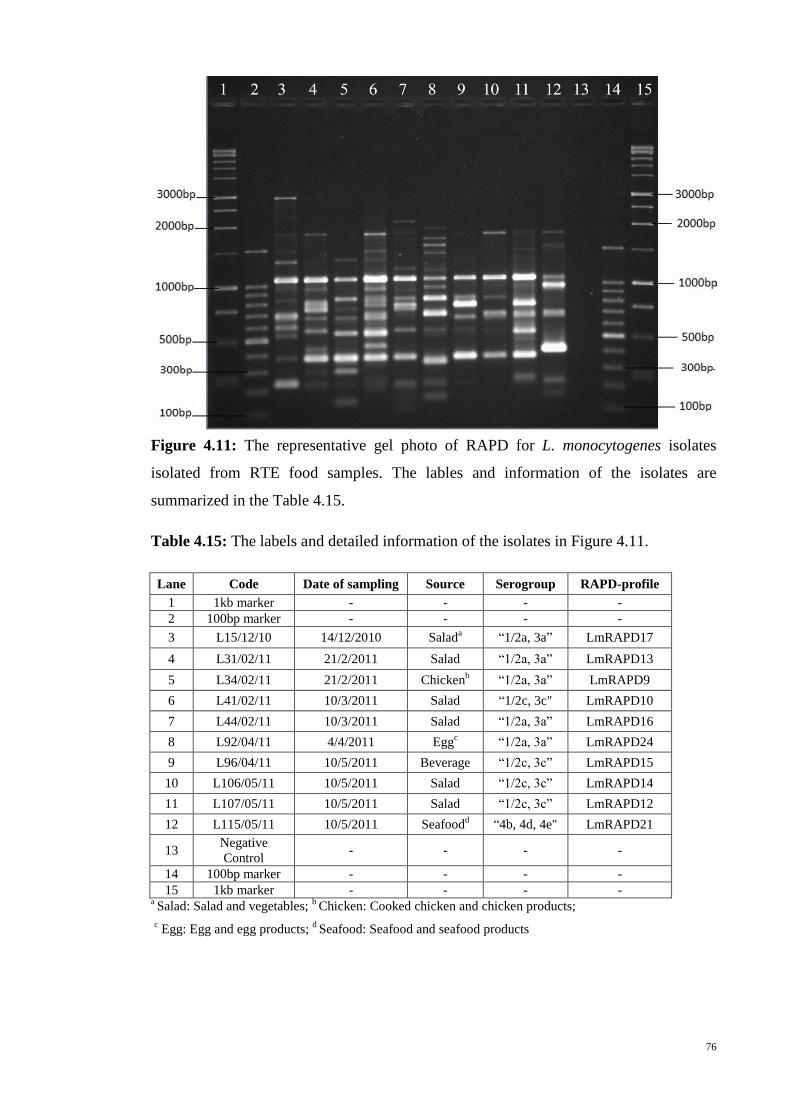
76
Figure 4.11: The representative gel photo of RAPD for L. monocytogenes isolates
isolated from RTE food samples. The lables and information of the isolates are
summarized in the Table 4.15.
Table 4.15: The labels and detailed information of the isolates in Figure 4.11.
Lane Code Date of sampling Source Serogroup RAPD-profile
1 1kb marker - - - -
2 100bp marker - - - -
3 L15/12/10 14/12/2010 Salada
“1/2a, 3a” LmRAPD17
4 L31/02/11 21/2/2011 Salad
“1/2a, 3a” LmRAPD13
5 L34/02/11 21/2/2011 Chickenb
“1/2a, 3a” LmRAPD9
6 L41/02/11 10/3/2011 Salad
“1/2c, 3c" LmRAPD10
7 L44/02/11 10/3/2011 Salad “1/2a, 3a” LmRAPD16
8 L92/04/11 4/4/2011 Eggc
“1/2a, 3a” LmRAPD24
9 L96/04/11 10/5/2011 Beverage “1/2c, 3c” LmRAPD15
10 L106/05/11 10/5/2011 Salad “1/2c, 3c” LmRAPD14
11 L107/05/11 10/5/2011 Salad “1/2c, 3c” LmRAPD12
12 L115/05/11 10/5/2011 Seafoodd
“4b, 4d, 4e" LmRAPD21
13 Negative
Control - - - -
14 100bp marker - - - -
15 1kb marker - - - - a Salad: Salad and vegetables;
b Chicken: Cooked chicken and chicken products;
c Egg: Egg and egg products;
d Seafood: Seafood and seafood products
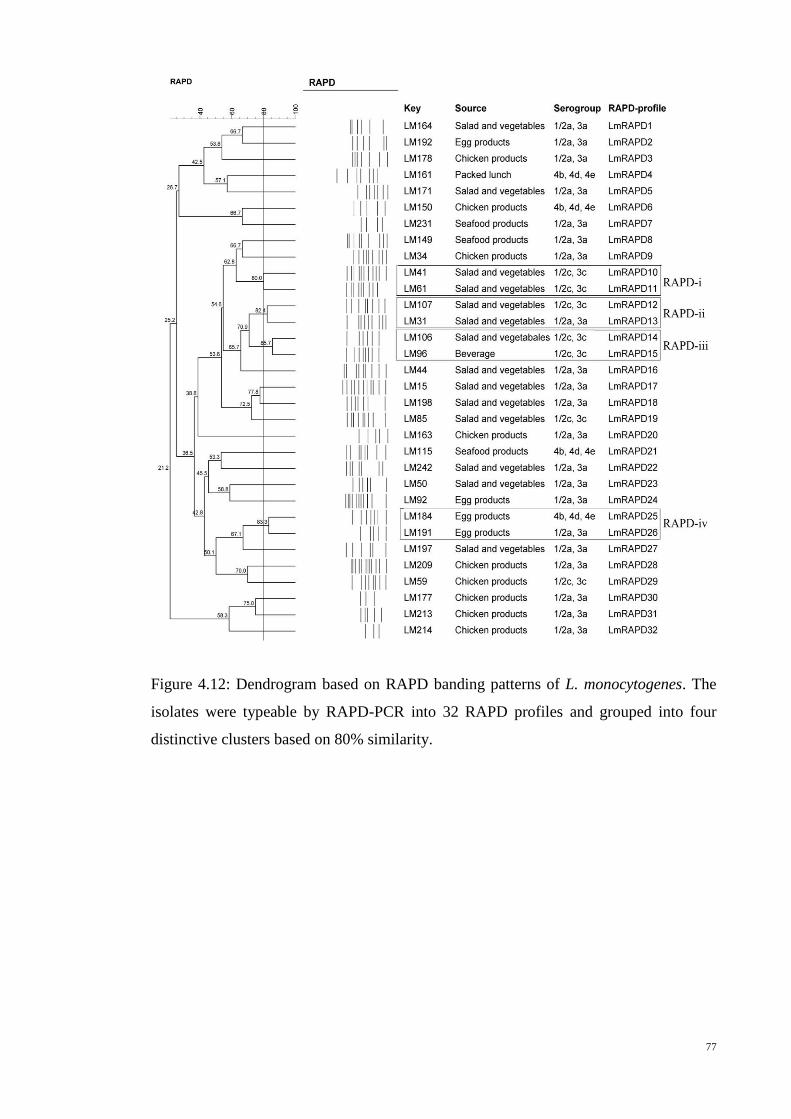
77
Figure 4.12: Dendrogram based on RAPD banding patterns of L. monocytogenes. The
isolates were typeable by RAPD-PCR into 32 RAPD profiles and grouped into four
distinctive clusters based on 80% similarity.
78
4.9 Pulsed Field Gel Electrophoresis (PFGE)
PFGE was applied to subtype L. monocytogenes isolates. All the 32 L.
monocytogenes isolates were typable by PFGE into 20 distinct PFGE profiles (D=
0.916). PFGE profiles consisted of 12 to 15 bands with size ranging from 28.8 to 668.9
kp (Figures 4.13 to 4.17).
The dendrogram based on the profiles obtained by PFGE is shown in Figure
4.18. Thirty two isolates of L. monocytogenes were grouped into seven distinctive
clusters by analysis of band-based.
Cluster PFGE-A was represented by four isolates of “1/2c, 3c”. All isolates were
detected from different types of foods at different sampling times and locations.
However, all isolates were isolated from samples which were purchased from hawker
street. This cluster showed 80% genetic similarity. Cluster PFGE-B included three
isolates which were isolated from different locations. Two isolates and one isolate
“1/2c, 3c” and “1/2a, 3a”, respectively. The genetic similarity was 90.2% in this cluster.
However two isolates of serogroup “1/2c, 3c” which isolated from the same RTE food
category (salad and vegetables) displayed 100% genetic similarity.
Two isolates of serogroup “1/2a, 3a” were grouped into cluster PFGE-C. The
isolates were detected from different food categories at the same sampling time and
location (hypermarket X). The genetic similarity was 92.9% in this cluster.
Two isolates of serogroup “1/2a, 3a” and one isolate of serogroup “1/2c, 3c”
were grouped into PFGE-D. The isolates were detected from different types of RTE
food categories at different sampling times and locations. The genetic similarity was
91.5% in this cluster.
Cluster PFGE-E contained 12 isolates of serogroup “1/2a, 3a”. The isolates were
detected from different types of foods at different dates of sampling and locations. The
79
cluster displayed 92% genetic similarity. In this cluster, 11 isolates (LM209 and
LM242; LM164, LM171, LM177, LM178, LM191, LM192, LM197, LM198 and
LM213) showed 100% genetic similarity. However these isolates were isolated from
different food categories at different sampling times and locations.
Four isolates of “1/2a, 3a” were represented in cluster PFGE-F. The isolates
were detected from different RTE food categories at different sampling times and
locations. The genetic similarity of this cluster was 80.4%. However the genetic
similarity between two isolates (LM31 and LM34) which were isolated from same food
categories at the same sampling time and location was 100%.
Four isolates of “4b, 4d, 4e” were represented in cluster pulsotype-G. These
isolates were isolated from different types of foods at different sampling times and
locations. The genetic similarity was 92.2% in this cluster. Two isolates (LM150 and
LM161) which isolated from cooked chicken heart and packed lunch at the same
sampling time and location (hypermarket X) showed 100% genetic similarity.
Cluster analysis of the 20 PFGE profiles grouped the 32 isolates into 7 clusters
(based at 80% similarity) with members of the same serogroup being cluster in the same
group and only two exceptions, isolate LM15 (serogroup “1/2a, 3a”) and LM96
(serogroup “1/2c, 3c”) were classified into unrelated clusters (Figure 4.14). Among
three serogroups, “1/2a, 3a” had the biggest cluster. Out of 21 L. monocytogenes
serogroup “1/2a, 3a”, 11 PFGE profiles were observed in different RTE food categories.
Out of 7 L. monocytogenes serogroup “1/2c, 3c”, 6 PFGE profiles were observed. Four
isolates with serogroup “4b, 4d, 4e” showed three different PFGE profiles. Low level of
similarity in the pulsotypes of the majority of the isolates indicates a high genetic
diversity among the L. monocytogenes isolates. The PFGE profiles of LM213
(serogroup “1/2a, 3a”) and LM214 (serogroup “1/2a, 3a”), as two cases in point, which

80
have been isolated from a particular type of chicken, from the same location, and at the
same time, shared less than 50.3%. It affirms low level of genetic relatedness among the
L. monocytogenes. It shows that PFGE, as an efficient method of molecular typing for
L. monocytogenes isolates, was able to distinguish the isolates with different
serogroups.
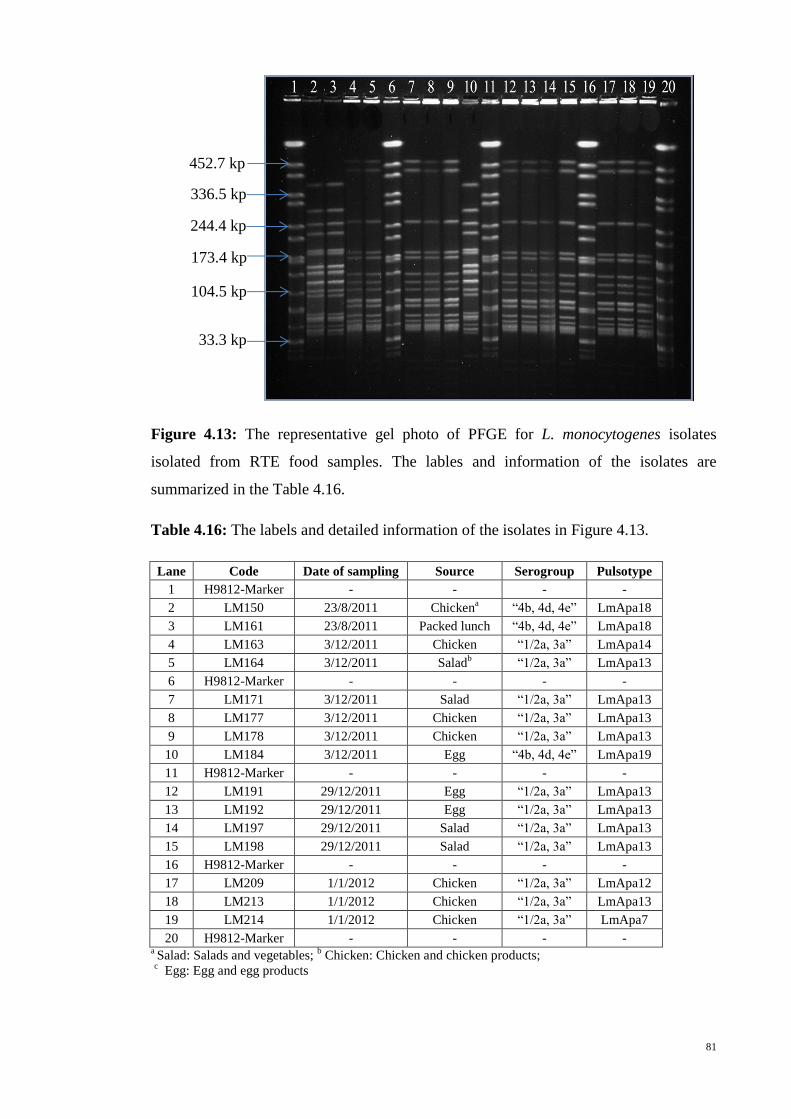
81
Figure 4.13: The representative gel photo of PFGE for L. monocytogenes isolates
isolated from RTE food samples. The lables and information of the isolates are
summarized in the Table 4.16.
Table 4.16: The labels and detailed information of the isolates in Figure 4.13.
Lane Code Date of sampling Source Serogroup Pulsotype
1 H9812-Marker - - - -
2 LM150 23/8/2011 Chickena
“4b, 4d, 4e” LmApa18
3 LM161 23/8/2011 Packed lunch “4b, 4d, 4e” LmApa18
4 LM163 3/12/2011 Chicken “1/2a, 3a” LmApa14
5 LM164 3/12/2011 Saladb “1/2a, 3a” LmApa13
6 H9812-Marker - - - -
7 LM171 3/12/2011 Salad “1/2a, 3a” LmApa13
8 LM177 3/12/2011 Chicken “1/2a, 3a” LmApa13
9 LM178 3/12/2011 Chicken “1/2a, 3a” LmApa13
10 LM184 3/12/2011 Egg “4b, 4d, 4e” LmApa19
11 H9812-Marker - - - -
12 LM191 29/12/2011 Egg “1/2a, 3a” LmApa13
13 LM192 29/12/2011 Egg “1/2a, 3a” LmApa13
14 LM197 29/12/2011 Salad “1/2a, 3a” LmApa13
15 LM198 29/12/2011 Salad “1/2a, 3a” LmApa13
16 H9812-Marker - - - -
17 LM209 1/1/2012 Chicken “1/2a, 3a” LmApa12
18 LM213 1/1/2012 Chicken “1/2a, 3a” LmApa13
19 LM214 1/1/2012 Chicken “1/2a, 3a” LmApa7
20 H9812-Marker - - - - a Salad: Salads and vegetables;
b Chicken: Chicken and chicken products;
c Egg: Egg and egg products
452.7 kp
173.4 kp
104.5 kp
33.3 kp
336.5 kp
244.4 kp
kp
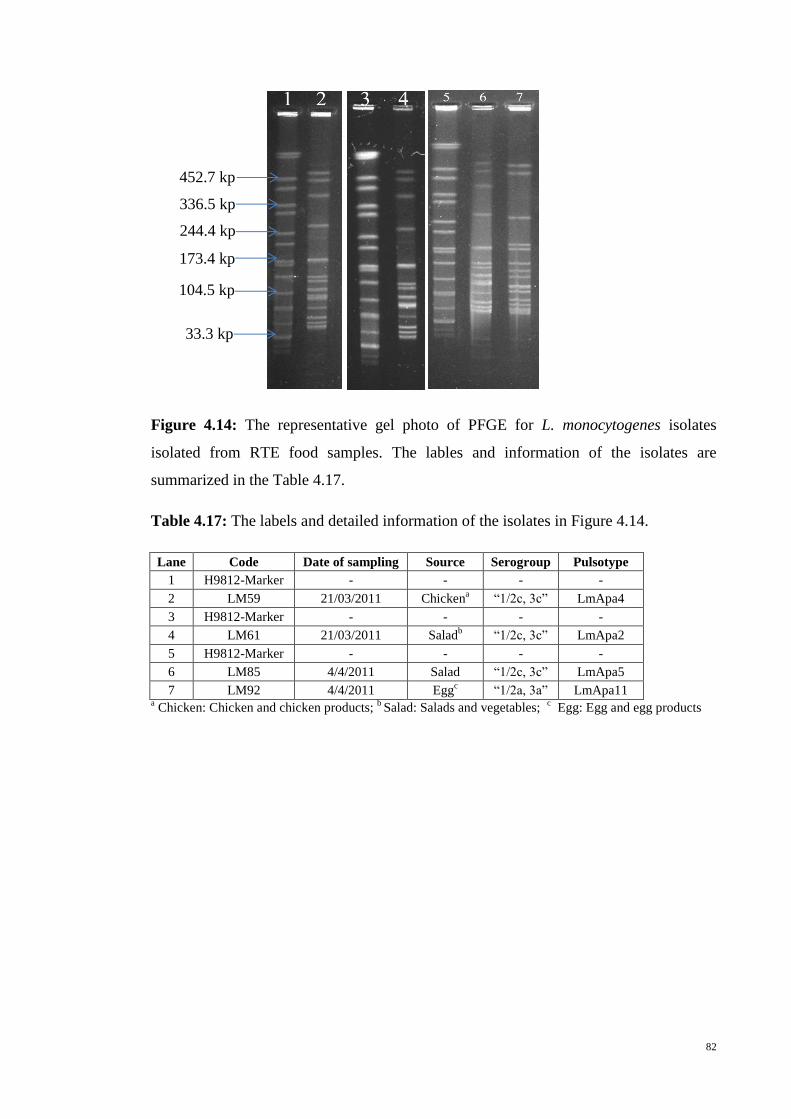
82
Figure 4.14: The representative gel photo of PFGE for L. monocytogenes isolates
isolated from RTE food samples. The lables and information of the isolates are
summarized in the Table 4.17.
Table 4.17: The labels and detailed information of the isolates in Figure 4.14.
Lane Code Date of sampling Source Serogroup Pulsotype
1 H9812-Marker - - - -
2 LM59 21/03/2011 Chickena
“1/2c, 3c” LmApa4
3 H9812-Marker - - - -
4 LM61 21/03/2011 Saladb
“1/2c, 3c” LmApa2
5 H9812-Marker - - - -
6 LM85 4/4/2011 Salad “1/2c, 3c” LmApa5
7 LM92 4/4/2011 Eggc
“1/2a, 3a” LmApa11 a Chicken: Chicken and chicken products;
b Salad: Salads and vegetables;
c Egg: Egg and egg products
452.7 kp
336.5 kp
244.4 kp
kp 173.4 kp
104.5 kp
33.3 kp
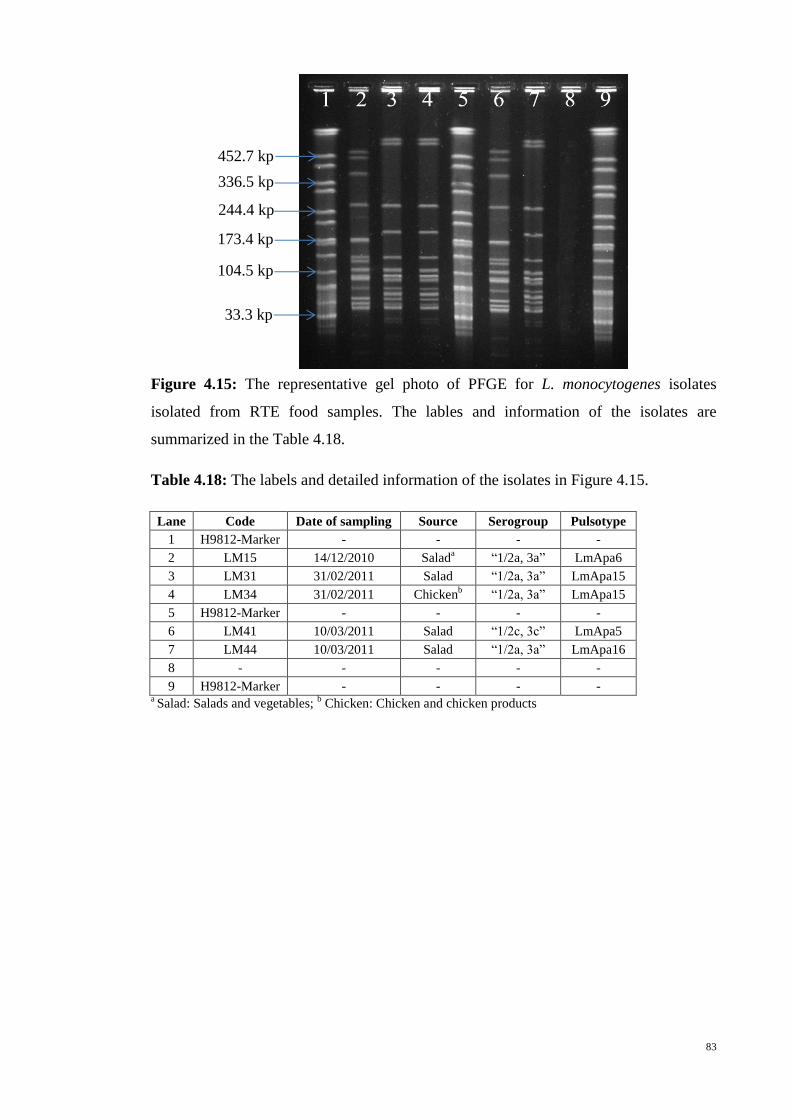
83
173.4 kp
Figure 4.15: The representative gel photo of PFGE for L. monocytogenes isolates
isolated from RTE food samples. The lables and information of the isolates are
summarized in the Table 4.18.
Table 4.18: The labels and detailed information of the isolates in Figure 4.15.
Lane Code Date of sampling Source Serogroup Pulsotype
1 H9812-Marker - - - -
2 LM15 14/12/2010 Salada
“1/2a, 3a” LmApa6
3 LM31 31/02/2011 Salad “1/2a, 3a” LmApa15
4 LM34 31/02/2011 Chickenb
“1/2a, 3a” LmApa15
5 H9812-Marker - - - -
6 LM41 10/03/2011 Salad “1/2c, 3c” LmApa5
7 LM44 10/03/2011 Salad “1/2a, 3a” LmApa16
8 - - - - -
9 H9812-Marker - - - - a Salad: Salads and vegetables;
b Chicken: Chicken and chicken products
452.7 kp
336.5 kp
244.4 kp
kp
104.5 kp
33.3 kp
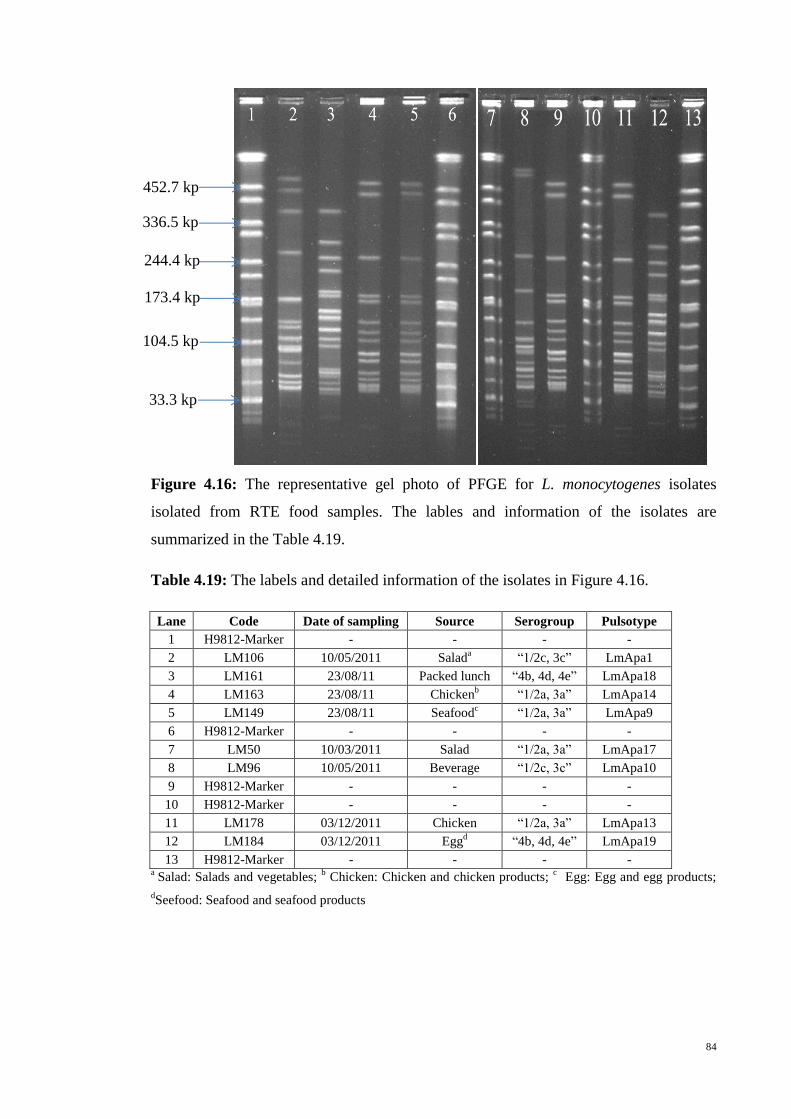
84
173.4 kp
Figure 4.16: The representative gel photo of PFGE for L. monocytogenes isolates
isolated from RTE food samples. The lables and information of the isolates are
summarized in the Table 4.19.
Table 4.19: The labels and detailed information of the isolates in Figure 4.16.
Lane Code Date of sampling Source Serogroup Pulsotype
1 H9812-Marker - - - -
2 LM106 10/05/2011 Salada
“1/2c, 3c” LmApa1
3 LM161 23/08/11 Packed lunch “4b, 4d, 4e” LmApa18
4 LM163 23/08/11 Chickenb
“1/2a, 3a” LmApa14
5 LM149 23/08/11 Seafoodc
“1/2a, 3a” LmApa9
6 H9812-Marker - - - -
7 LM50 10/03/2011 Salad “1/2a, 3a” LmApa17
8 LM96 10/05/2011 Beverage “1/2c, 3c” LmApa10
9 H9812-Marker - - - -
10 H9812-Marker - - - -
11 LM178 03/12/2011 Chicken “1/2a, 3a” LmApa13
12 LM184 03/12/2011 Eggd
“4b, 4d, 4e” LmApa19
13 H9812-Marker - - - - a
Salad: Salads and vegetables; b Chicken: Chicken and chicken products;
c Egg: Egg and egg products;
dSeefood: Seafood and seafood products
452.7 kp
336.5 kp
244.4 kp
kp
104.5 kp
33.3 kp
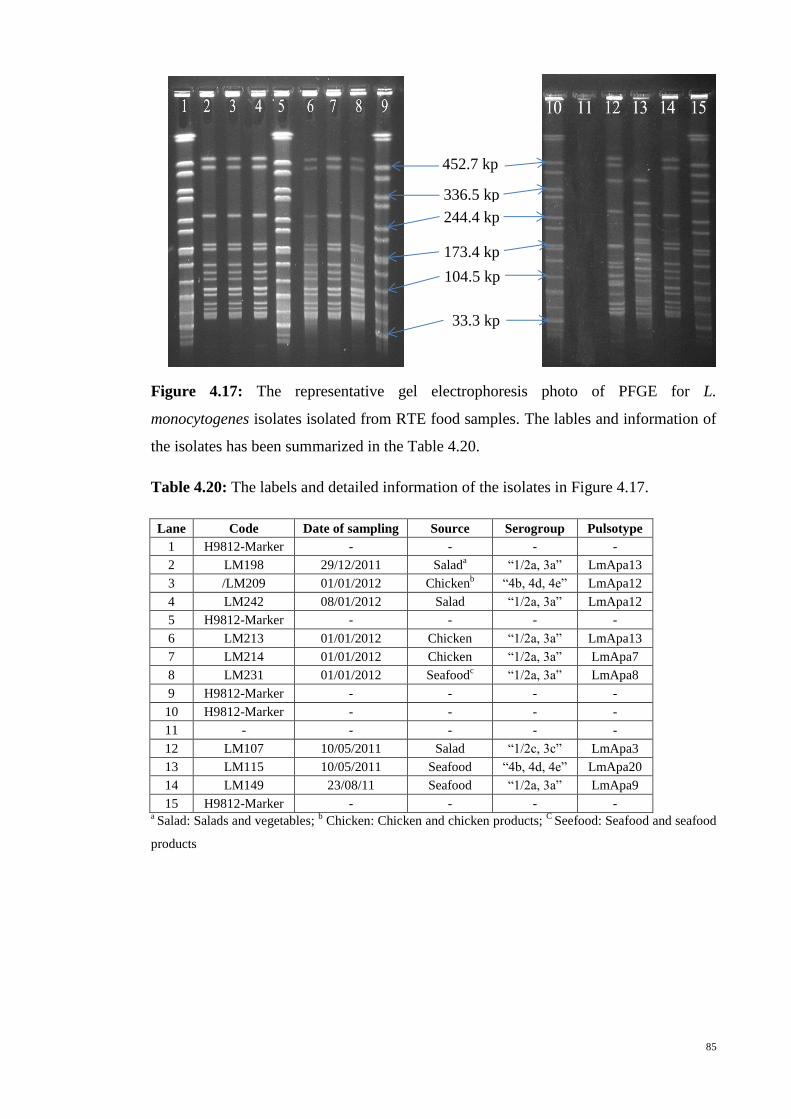
85
452.7 kp
336.5 kp
244.4 kp
kp
104.5 kp
33.3 kp
173.4 kp
Figure 4.17: The representative gel electrophoresis photo of PFGE for L.
monocytogenes isolates isolated from RTE food samples. The lables and information of
the isolates has been summarized in the Table 4.20.
Table 4.20: The labels and detailed information of the isolates in Figure 4.17.
Lane Code Date of sampling Source Serogroup Pulsotype
1 H9812-Marker - - - -
2 LM198 29/12/2011 Salada
“1/2a, 3a” LmApa13
3 /LM209 01/01/2012 Chickenb
“4b, 4d, 4e” LmApa12
4 LM242 08/01/2012 Salad “1/2a, 3a” LmApa12
5 H9812-Marker - - - -
6 LM213 01/01/2012 Chicken
“1/2a, 3a” LmApa13
7 LM214 01/01/2012 Chicken “1/2a, 3a” LmApa7
8 LM231 01/01/2012 Seafoodc
“1/2a, 3a” LmApa8
9 H9812-Marker - - - -
10 H9812-Marker - - - -
11 - - - - -
12 LM107 10/05/2011 Salad “1/2c, 3c” LmApa3
13 LM115 10/05/2011 Seafood “4b, 4d, 4e” LmApa20
14 LM149 23/08/11 Seafood
“1/2a, 3a” LmApa9
15 H9812-Marker - - - - a Salad: Salads and vegetables;
b Chicken: Chicken and chicken products;
C Seefood: Seafood and seafood
products
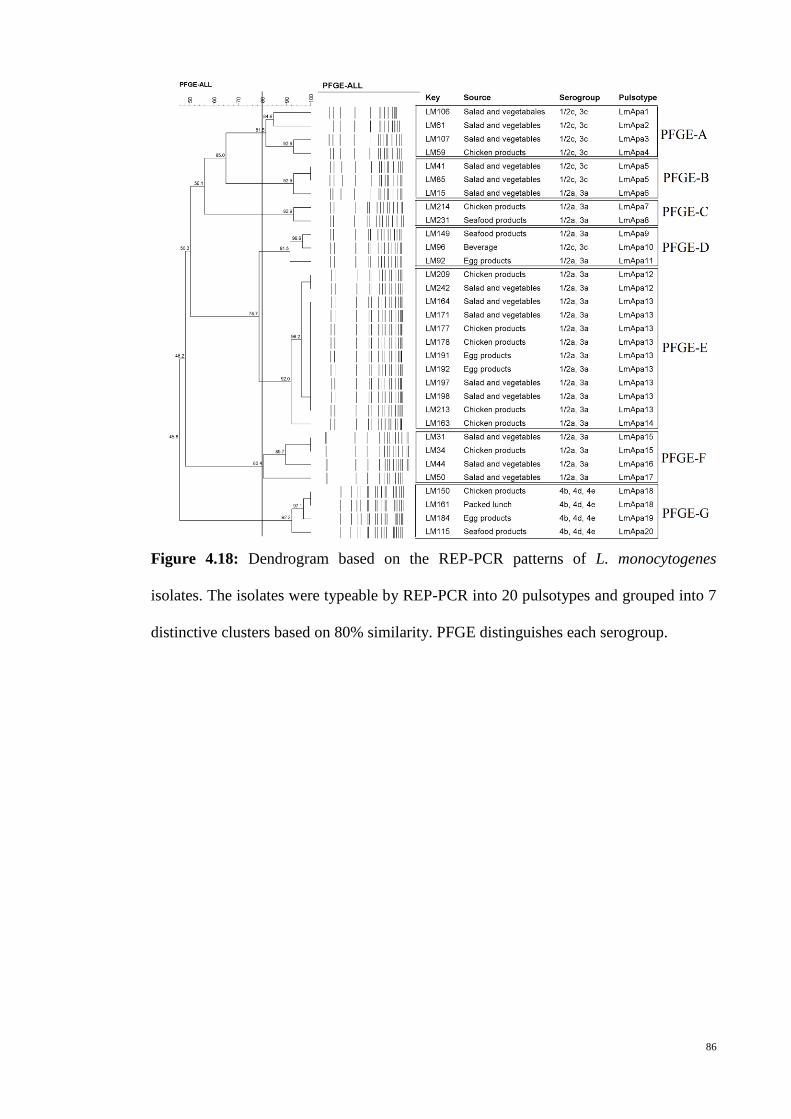
86
Figure 4.18: Dendrogram based on the REP-PCR patterns of L. monocytogenes
isolates. The isolates were typeable by REP-PCR into 20 pulsotypes and grouped into 7
distinctive clusters based on 80% similarity. PFGE distinguishes each serogroup.

87
CHAPTER 5
DISCUSSION
88
Listeria monocytogenes is an important intracellular foodborne pathogen and
causes human listeriosis worldwide. Since L. monocytogenes is transmitted through
contaminated food, the presence of the pathogen in RTE foods which are consumed
without heat treatment has public health implications.
The examination of RTE food to detect of L. monocytogenes in developed
countries is routinely carried out for surveillance of the foodborne pathogen. Colony
appearance on selective media was followed by conventional biochemical tests,
including Gram determination, catalase, oxidase, TSI, indole, SIM, and MR-VP for
detection of Listeria species. The conventional biochemical tests which used were not
able to distinguish the L. monocytogenes from non-L. monocytogenes species. Thus, for
detection of the species of the isolates, the conventional biochemical tests showed low
efficiency. However, the overall findings of these tests indicated that they can be used
for detection of Listeria at the genus level. Although the majority of the results obtained
from the biochemical tests were in agreement with the results of the duplex PCR, the
limitation of conventional methods in the detection and differentiation of Listeria at
species level, confirms that it is required to use these methods together with a molecular
method for confirmation.
Conventional methods have limitations in terms of overgrowth of other natural
flora present in RTE foods. Molecular methods as rapid detection methods have been
shown to be more sensitive and less time-consuming for L. monocytogenes detection in
foods (Ponniah et al., 2010).
The findings of this study, based on the results obtained from the culturing
method and confirmed by the duplex PCR, indicate the prevalence of L. monocytogenes
and non-L. monocytogenes species in 12.8% and 8% of RTE food samples, respectively
(Figure 4.1). Other studies in Malaysia also reported high prevalence of L.
89
monocytogenes in different kind of RTE foods. 8.6% of the raw and RTE food samples
tested by Marian et al. (2012) were found to harbour L. monocytogenes. A higher
percentage was also reported by Wong et al. (2012), in which 22.3% of frozen burger
patties collected from Selangor, Malaysia were found to harbour L. monocytogenes.
However, the high prevalence of Listeria spp. and L. monocytogenes in RTE
foods was mainly distributed in RTE food type of salad and vegetables. Both salad and
vegetables did not go through heat process. This explained why salads and vegetables
were highly contaminated with Listeria spp. and L. monocytogenes. Furthermore, salad
dressings are high in nutrients and this could encourage the growth of Listeria spp. that
was present in the salads. Ponniah et al. (2010) showed that 22.5% of the salad
vegetables were positive for L. monocytogenes. The results obtained from this study and
other relevant investigation affirms the potential of L. monocytogenes as a major
foodborne pathogen. The high prevalence of L. monocytogenes in RTE food is
considered as potentially hazardous, regarding the probability of pathogenicity among
the contaminant strains.
Three serovars 1/2a, 1/2b, and 4b are associated with most of the human
listeriosis. Serovar 4b is not the most common subtype isolated from food although it is
commonly associated with human listeriosis (50 to 70%) (Martins & Leal Germano,
2011). Thus L. monocytogenes with serovar 4b could be more virulent.
As four serovars 3a, 3b, 4d and 4e are rarely isolated from food, serogroups
“1/2a, 3a”; “1/2b, 3b”; “1/2c, 3c”; and “4b, 4d, 4e” could be recognized as 1/2a, 1/2b,
1/2c and 4b, respectively as proposed by Zhang et al. (2007). Thus, the serovars 1/2a,
1/2c and 4b are most likely associated with our local L. monocytogenes isolated from
RTE. However, the actual serovar distribution needs to be confirmed by conventional
serotyping on a larger sample size.
90
This is the first study where we could identify the different serogroups (or
serovars) of L. monocytogenes in Malaysia. The high percentage rate of serogroup
“1/2a, 3a” in this study is in agreement with other studies (Nucera et al., 2010; Yan et
al., 2010; Wang et al., 2013) which reported a high prevalence of serovar 1/2a in food
samples. The presence of epidemiological important serovars 1/2a (or 3a) and 4b (or 4d,
4e) among almost all kinds of food categories indicates possible diverse sources of
listeriosis in Selangor, Malaysia.
There have been some reports of multidrug resistant L. monocytogenes isolated
from listeriosis cases, and foods (Morvan et al., 2010; Adetunji and Isola, 2011; Bhat et
al., 2012). Generally, penicillin or ampicillin often in combination with an
aminoglycoside is chosen for medical treatment of listeriosis cases (Swaminathan &
Gerner-Smidt, 2007). L. monocytogenes isolated from food samples were sensitive to
penicillin in the most of studies. In a previous study in China, one out of 90 (1%) L.
monocytogenes isolates showed resistance to penicillin G (Yan et al., 2010). On the
other hand, Marian et al. (2012) had reported high resistance against penicillin G
(100%) from raw and ready-to-eat foods in Malaysia and also Morobe et al. (2009) have
been found high prevalence percentage of resistance to penicillin G (42%) from various
foods in Botswana, which were similar to our finding (53%). This could be attributed to
the use of this antibiotic as the first choice drug in the treatment of listeriosis (Hof,
2003; Conter et al., 2009) as well as its use in animals’ feed (Rahimi et al., 2010).
Mutations in chromosomal genes or gene transfer from transposons and plasmids of
other Gram positive bacteria could result in antimicrobial resistance in the pathogen
(Harakeh et al., 2009).
Only one isolate from a seafood sample was multidrug resistant (MDR)
(resistant to three or more classes of antimicrobial agents). Although L. monocytogenes
is known to be susceptible to a variety of antimicrobial agents (Altuntas et al., 2012),
91
the presence of MDR L. monocytogenes from food and human cases (Morvan et al.,
2010; Bhat et al., 2012) is worrisome.
The results obtained from virulotyping of L. monocytogenes isolates confirmed
the existence of inlA, inlB, inlC and inlJ genes among the local isolates. The four genes
have indispensable roles in virulence (Liu et al., 2007). The results were similar to
previous studies, which inlA, inlB, inlC and inlJ genes were positive in all or most the
examined L. monocytogenes isolates from environment (Gelbíčová, & Karpíšková.,
2012), food samples (Indrawattana et al., 2011; Lomonaco et al., 2012; Sant'Ana et al.,
2012), listeriosis cases in humans (Mammina et al., 2009) and animals (Marien et al.,
2007). Hence, the results indicate that pathogenic L. monocytogenes isolates are present
in RTE foods sold in street-side hawker stalls and hypermarkets in Malaysia and it
confirms the high risk of infection for RTE foods consumers.
The PCR-RFLP results showed that the polymorphism of inlA and inlC genes
had limited variation. There was no correlation between the source of L. monocytogenes
and PCR-RFLP profiles. These results are in agreement with an earlier finding
(Strydom et al., 2013). However, in our study, all isolates of serogroup “4b, 4d, 4e”
were grouped in one profile (Al2).
The results gained from REP-PCR, BOX-PCR and RAPD indicated genetic
diversity among food L. monocytogenes. The isolates with in the same serogroup were
grouped into the same cluster by REP-PCR and BOX-PCR. Chou and Wang (2006)
reported that L. monocytogenes isolates were classified by REP-PCR into the clusters
based on their serogroups (flagella antigen groups). In contrast, RAPD failed to group
the L. monocytogenes isolates with in the same serogroup. In earlier study, Aurora et al.
(2009) reported that different serogroups of L. monocytogenes isolates were observed
with identical RAPD profiles. This shows the low discriminatory power of RAPD.
92
Genotyping of L. monocytogenes isolates by PFGE indicated that the 32 food L.
monocytogenes isolates were genetically diverse and heterogeneous and this is in
concordance with earlier finding (Yan et al., 2010). No clear genetic relatedness was
observed among the isolates isolated from the same type of RTE food, the same location
or at the same time. However, the same serogroup isolates were classified into the same
cluster. High genetic diversity of L. monocytogenes strains had been previously reported
in other studies (Zhang et al., 2007; Nucera et al., 2010). Nucera et al. (2010) reported
164 different PFGE profiles obtained from 300 L. monocytogenes isolates. In another
study, Zhang et al. (2007) reported 120 different PFGE profiles were observed among
167 L. monocytogenes isolates.
More than half of the isolates (53.1%) with the same serogroup were grouped
into the same distinct PFGE cluster. Seventeen L. monocytogenes isolates that had
identical REP-, BOX- and RAPD- profiles were also indistinguishable by their
pulsotypes. The majority of L. monocytogenes isolates which showed same pulsotypes
were isolated from different food categories at different sampling times and location.
This could indicate persistence of this organism in this region. On the other hand, eight
L. monocytogenes isolates (LM150 and LM161; LM197 and LM178; LM192 and
LM198; LM214 and LM231) which had same REP profile were distinguishable by their
pulsotypes. These isolates were detected from different food categories but were
sampled at the same sampling times and location. This could indicate cross-
contamination of L. monocytogenes isolates between food handlers and RTE foods.
Food handlers are considered a significant route in the spread of L. monocytogenes in
foods through cross-contamination (Cocolin et al., 2009).
There was no correlation between the antibiograms with pulsotypes, PCR-
typing, PCR-RFLP profiles, and sources. As in the current study, associations between
antimicrobial susceptibility profiles, pulsotypes, PCR typing profiles, PCR-RFLP and
93
specific food types were not found for isolates of L. monocytogenes from different kind
of foods (Yan et al, 2010; Strydom et al., 2013; Wang et al., 2013). The apparent lack of
association could be due to the small sample size. Hence, for better understanding and
control of source of the pathogen contamination, a bigger sample size from wide
geographical areas and different kinds of sources be investigated in future study.
In conclusion, the genotyping data showed that the food L. monocytogenes
isolates were genetically diverse and heterogeneous. Different methods have different
levels of discriminatory powers, therefore the application of more than one subtyping
approach would provide a more accurate picture of the clonality of L. monocytogenes.
Furthermore, the presence of the epidemiologically important serovars of L.
monocytogenes 1/2a (or 3a) and 4b (or 4d, 4e) which are associated with human
listeriosisis of public health concern. Hence, surveillance programs are needed to
monitor epidemiological information on the pathogen dispersion in different sources in
Malaysia.

94
CHAPTER 6
CONCLUSIONS
95
1. The prevalence of Listeria spp. and L. monocytogenes in different kinds of RTE
foods sold in street-side hawker stalls and supermarkets in Malaysia and the
presence of serogroup 4b (or 4d, 4e) among the isolates pose a high risk of infection
for the consumers if such contaminated foods were consumed.
2. All the 32 L. monocytogenes isolates were positive for inlA, inlB, inlC and inlJ
genes. The presence of internalin genes (inlA, inlB, inlC and inlJ) in L.
monocytogenes isolates from the RTE food samples indicate the virulence potential
of the food L. monocytogenes isolates.
3. The PCR-RFLP results showed that the polymorphism of inlA and inlC genes had
limited variation. It seems, therefore, that the PCR-RFLP with these primers and
restriction endonucleases may not be sufficiently discriminative for polymorphisms
and subtyping studies.
4. The presence of multi-drug resistance and the high level of penicillin G resistance
(53.1%) could be a public health concern, because it is used in combination with
gentamicin for treatment of human listeriosis. However, all the L. monocytogenes
isolates were susceptible to gentamicin and trimethoprim-sulfamethoxazole.
5. The results obtained from REP-PCR, BOX-PCR, RAPD and PFGE indicated high
genetic diversity among the L. monocytogenes isolates. REP-PCR, BOX-PCR and
PFGE were able to distinguish isolates with different serogroups.

96
BIBLIOGRAPHY
Aarestrup, F. M., Knochel, S. & Hasman, H. (2007). Antimicrobial susceptibility of
Listeria monocytogenes from food products. Foodborne Pathogens and Disease,
4, 216-221.
Abelardo, M., Baltasar, M. & Clara, D. G. (2001). Susceptibility of Listeria
monocytogenes and Listeria innocua strains isolated from short-ripened cheeses to
some antibiotics and heavy metal salts. Food microbiology, 18, 67-73.
Adams, M. R. & Moss, M. O. (2008). Food Microbiology (3rd ed.). Cambridge: RSC
Publishing.
Adetunji,V. A. & Isola, T. O. (2011). Antibiotic resistance of Escherichia coli, Listeria
and Salmonella isolates from retail meat tables in Ibadan municipal abattoir,
Nigeria. African Journal of Biotechnology, 10, 5795-5799.
Aguado, V., Vitas, A. I. & García-Jalón, I. (2004). Characterization of Listeria
monocytogenes and Listeria innocua from a vegetable processing plant by RAPD
and REA. International Journal of Food Microbiology, 90, 341–347.
Altekruse, S. F., Cohen, M. L. & Swerdlow, D. L. (1997). Emerging foodborne
diseases. Emerging Infectious Diseases, 3, 285–293.
Altuntas, E. G., Kocan, D., Cosansu, S., Ayhan, K., Juneja, V. K. & Materon, L. (2012).
Antibiotic and bacteriocin sensitivity of Listeria monocytogenes strains Isolated
from different foods. Food and Nutrition Sciences, 3, 363-368.
Anonymous (2005). Commision regulation No. 2073/2005 on microbiological criteria
for food stuffs. Official Journal of the European Union, L388, 1–26.
Antunes, P., Reu, C., Jousa, J. C., Pestana, N. & Peixe, L. (2002). Incidence and
susceptibility to antimicrobial agents of Listeria species and Listeria
monocytogenes isolated from Poultry Carcasses in Porto, Portugal. Journal of
Food Protection, 65, 1883-93.
Aragon-Alegro, L. C., Aragon, D. C., Martinez, E. Z., Landgraf, M., Franco, B. D. G.
M. & Destro. M. T. (2008). Performance of a chromogenic medium for the
isolation of Listeria monocytogenes in food. Journal of Food Control, 19, 483–
486.
Aureli, P., Fiorucci, G. C., Caroli, D., Marchiaro, G., Novara, O., Leone, L. & Salmaso,
S. (2000). An outbreak of febrile gastroenteritis associated with corn
contaminated by Listeria monocytogenes. The New England Journal of Medicine
342, 1236–1241.
Aurora, R., Prakash, A. & Prakash, S. (2009). Genotypic characterization of Listeria
monocytogenes isolated from milk and ready-to-eat indigenous milk products.
Food Control, 20, 835-839.
Bang, J., Beuchat, L. R., Song, H., Gu, M. B., Chang, H., Kim, H. S. & Ryua, J. (2013).
International Journal of Food Microbiology, 161, 134-141.
97
Becker, B., Schuler, S., Lohneis, M., Sabrowski, A., Curtis, G. D. W. & Holzapfel, W.
H. (2006). Comparison of two chromogenic media for the detection of Listeria
monocytogenes with the plating media recommended by EN/DIN 11290-1.
International Journal of Food Microbiology, 109, 127-131.
Beek, D. D., Gans, J. D., Spanjaard, L., Vermeulen, M. & Dankert, J. (2002). Antibiotic
guidelines and antibiotic use in adult bacterial meningitis. Netherlands Journal of
Antimicrobial Chemotherapy, 49, 661-666.
Bell, C. & Kyriakides, A. (2005). Listeria: A Practical Approach to the Organism and
its Control in Foods (2sd ed.). New York: John Wiley & Sons.
Bessesen, M. T., Luo, Q., Rotbart, H. A., Blaser, M. J. & Ellison III, R. T. 1990.
Detection of Listeria monocytogenes by using the polymerase chain reaction.
Applied and Environmental Microbiology, 56, 2930-2932.
Bhat, S. A., Willayat, M. M., Roy, S. S., Bhat, M. A., Shah, S. N., Ahmed, A.,
Maqbool, S. & Ganayi, B. A. (2012). Isolation, molecular detection and
antibiogram of Listeria monocytogenes from human clinical cases and fish of
Kashmir, India. Comparative Clinical Pathology, DOI: 10.1007/s00580-012-
1462-1.
Bhunia, A. K. (2008). Foodborne microbial pathogens (pp165–182). New York:
Springer Science+Business Media.
Bierne, H., & Cossart, P. (2002). InlB, a surface protein of Listeria monocytogenes that
behaves as an invasin and a growth factor. Journal of Cell Science, 115, 3357-
3367.
Bierne, H. & Cossart, P. (2007). Listeria monocytogenes surface proteins: from genome
predictions to function. Microbiology and Molecular Biology Reviews, 71, 377-
397.
Bierne, H., Sabet, C, Personnic, N. & Cossart, P. (2007). Internalins: a complex family
of leucine-rich repeat-containing proteins in Listeria monocytogenes. Microbes
and Infection, 9, 1156-1166.
Border, P. M., Howard, J. J., Plastow, G. S. & Siggens, K. W. (1990). Detection of
Listeria species and Listeria monocytogenes using polymerase chain reaction.
Letters in Applied Microbiology, 11, 158-162.
Brosch, R., Buchrieser, C. & Rocourt, J. (1991). Subtyping of Listeria monocytogenes
serovar 4b by use of low-frequency-cleavage restriction endonucleases and
pulsed-field gel electrophoresis. Research in Microbiology, 142, 667–675.
Brosch, R., Chen, J. & Luchansky, J. B. (1994). Pulsed-field fingerprinting of Listeriae:
identification of genomic divisions for Listeria monocytogenes and their
correlation with serovars. Applied and Environmental Microbiology, 60, 2584–
2592.
Bruce, J. L., Hubner, R. J., Cole, E. M., McDowell, C. I. & Webster, J. A. (1995). Sets
of EcoRI fragments containing ribosomal RNA sequences are conserved among
different strains of Listeria monocytogenes. Proceedings of the National Academy
of Sciences USA, 92, 5229-33.
98
Buchrieser, C., Brosch, R., Catimel, B. & Rocourt, J. (1993). Pulsed-field gel
electrophoresis applied for comparing Listeria monocytogenes strains involved in
outbreaks. Canadian Journal of Microbiology, 39, 395–401.
Bunduki, M. M., Flanders, K. J. & Donnelly, C. W. (1994). Metabolic and structural
sites of damage in heat- and sanitizer-injured populations of Listeria
monocytogenes. Journal of Food Protection, 58, 410–415.
Cabanes, D., Dehoux, P., Dussurget, O., Frangeul, L. & Cossart, P. (2002). Surface
proteins and the pathogenic potential of Listeria monocytogenes. Trends in
Microbiology, 10, 238-245.
Chen, Y. H., Ross, W. H., Scott, V. N. & Gombas, D. E. (2003). Listeria
monocytogenes: Low levels equal low risk. Journal of Food Protection, 66, 570–
577.
Chou, C. H., & Wang, C. (2006). Genetic relatedness between Listeria monocytogenes
isolates from seafood and humans using PFGE and REP-PCR. International
Journal of Food Microbiology, 110, 135–148.
Churchill, R. L. T., Lee, H. & Hall, J. C. (2006). Detection of Listeria monocytogenes
and the toxin listeriolysin O in food. Journal of Microbiological Methods, 64,
141–170.
Clinical and Laboratory Standards Institute.Performance Standards for Antimicrobial
Susceptibility Testing (CLSI); Twentieth Informational Supplement.M100-
S20.Vol. 30, No. 1, 2010, 160p.
Cocolin, L., Nucera, D., Alessandria, V., Rantsiou, K., Dolci, P., Grassi, M. A.,
Lomonacob, S. & Civerab, T. (2009). Microbial ecology of gorgonzola rinds and
occurrence of different biotypes of Listeria monocytogenes. International Journal
of Food Microbiology, 133, 200-205.
Cocolin, L., Stellab, T. S., Nappic, R., Bozzettac, E., Cantonib, C. & Comi, G. (2005).
Analysis of PCR-based methods for characterization of Listeria monocytogenes
strains isolated from different sources. International Journal of Food
Microbiology, 103, 167-178.
Coffey, A., Rombouts, F. M. & Abee, T. (1996). Influence of environmental parameters
on phosphatidylcholine phospholipase C production in Listeria monocytogenes: a
convenient method to differentiate L. monocytogenes from other Listeria species.
Applied and Environmental Microbiology, 62, 1252–1256.
Cole, M. B., Jones, M. V. & Holyoak, C. (1990). The effect of pH, salt concentration
and temperature on the survival and growth of Listeria monocytogenes. Journal of
Applied Bacteriology, 69, 63–72.
Conter, M., Paludi, D., Zanardi, E., Ghidini, S., Vergara, A. & Ianieri, A. (2009).
Characterization of antimicrobial resistance of foodborne Listeria monocytogenes.
International Journal of Food Microbiology, 128, 497–500.
Curtis, G. D. W., Mitchell, R. G., King, A. F. & Griffen, E. J. (1989). A selective
differential medium for the isolation of Listeria monocytogenes. Letters in
Applied Microbiology, 8, 95–98.
99
De Boer, E. & Beumer R. R. (1999). Methodology for detection and typing of
foodborne microorganisms . International Journal of Food Microbiology, 50,
119-130.
De Oliveira, M. A., Ribeiro, E. G. A., Bergamini, A. M. M. & De Martinis, E. C. P.
(2010). Quantification of Listeria monocytogenes in minimally processed leafy
vegetables using a combined method based on enrichment and 16S rRNA real-
time PCR. Food Microbiology, 27, 19–23.
De Vasconcelos, R. M., de Almeida, A. E. C. C., Hofer, E., da Silva, N. M. M. &
Marin, V. A. (2008). Multiplex-PCR serotyping of Listeria monocytogenes
isolated from human clinical specimens. Memórias do Instituto Oswaldo Cruz,
103, 836–838.
Decatur, A. L. & Portnoy D. A. (2000). A PEST-like sequence in listeryolisin O
essential for Listeria monocytogenes pathogenicity, Science, 290, 992-5.
Deneer, H. G. & Boychuk, I. (1991). Species-specific detection of Listeria
monocytogenes by DNA amplification. Applied and Environmental Microbiology,
57, 606-609.
Desse, G. & Taye, M. (2001). Microbial load and micro flora of Cassava (Manihot
esculenta Crantz) and effect of cassava juice on some food borne pathogens.
Journal of Food Technology in Africa, 6, 21-24.
Domann, E., Zechel, S., Lingnau, A., Hain, T., Darji, A., Nichterlein, T., Wehland, J. &
Chakraborty, T. (1997). Identification and characterization of a novel PrfA
regulated gene in Listeria monocytogenes whose product, IrpA, is highly
homologous to internalin proteins, which contain leucine-rich repeats. Infection
and Immunity, 65,101-109.
Donnelly, C. W. (1999). Conventional methods to detect and isolate Listeria
monocytogenes. In E.T. Ryser & E.H. Marth (Eds.), Listeria, Listeriosis, and
Food Safety, (pp. 225–260). New York: Marcel Dekker, Inc.
Donnelly, C. W. (2001). Listeria monocytogenes: a continuing challenge. Nutrition
Reviews, 59, 183-194.
Doumith, M., Buchrieser, C., Glaser, P., Jacquet, C. & Martin P. (2004a).
Differentiation of the major Listeria monocytogenes serovars by multiplex PCR.
Journal of Clinical Microbiology, 42, 3819-3822.
Doumith, M., Cazalet, C., Simoes, N., Frangeul, L. & Jacquet, C. (2004b). New aspects
regarding evolution and virulence of Listeria monocytogenes revealed by
comparative genomics and DNA arrays. Infection and Immunity, 72, 1072-1083.
Doyle, E. M. (1999). Use of high pressure to control Listeria in meat. Retrieved from
http://www.amif.org/Listeria%20Pressure.pdf.
Dramsi, S., Dehoux, P., Lebrun, M., Goossens, P. L. & Cossart, P. (1997). Identification
of four new members of the internalin multigene family of Listeria
monocytogenes EGD. Infection and Immunity, 65, 1615-1625.
El Marrakchi A., Boum'handi, N. & Hamama, A. (2005). Performance of a new
chromogenic plating medium for the isolation of Listeria monocytogenes from
marine environments. Letters in Applied Microbiology, 40, 87-91.
100
Endang, P., Radu, S., Zaiton, H. & Rusul G. (1998). Antimicrobial drug resistance and
resistance factor transfer among Listeria species. Asian Fisheries Science, 11,
261-270.
Engelbrecht, F., Chun, S. K., Ochs, C, Hess, J., Lottspeich, F., Goebel, W. & Sokolovic,
Z. (1996). A new PrfA-regulated gene of Listeria monocytogenes encoding a
small, secreted protein which belongs to the family of internalins. Molecular
Microbiology, 27, 823-837.
Erdenlig, S., Ainsworth, A.J. & Austin, F.W. (2000). Pathogenicity and production of
virulence factors by Listeria monocytogenes isolates from channel catfish. Journal
of Food Protection, 63, 613–619.
Ertas, H. B. & Şeker, E. (2005). Isolation of Listeria monocytogenes from fish intestines
and RAPD analysis. Turkish Journal of Veterinary and Animal Sciences, 29,
1007–1011.
European Commission (EC) (1999). Opinion of the Scientific Committee on Veterinary
Measures Relating to Public Health on Listeria monocytogenes. Brussels,
Belgium: European Commission, Health and Consumer Protection Directorate
General.
Farber, J. F. & Peterkin, P. I. (1991). Listeria monocytogenes, a food-borne pathogen.
Microbiological Reviews, 55, 476–511.
Farber, J. M., Coates, F. & Daley, E. (1992). Minimum water activity requirements for
the growth of Listeria monocytogenes. Letters in Applied Microbiology, 15, 103–
105.
Farber, J., & Addison, C. (1994). RAPD typing for distinguishing species and strains in
the genus Listeria. Journal of Applied Bacteriology, 77, 242–250.
FDA/CFSAN. (2003). Detection and Enumeration of L. monocytogenes in foods.
Bacteriological Analytical Manual Online. http//www.cfsan.fda.gov.
Fenlon, D. R. (1985). Wild birds and silage as reservoirs of Listeria in the agricultural
environment. Journal of Applied Microbiology, 59, 537-543.
Finney, M. (2000). Pulsed-field gel electrophoresis. In F. M. Ausubel, R. Brent, R. E.
Kingston, D. D. Moore, J. G. Seidman, J. A. Smith, & K. Struhl (Eds.), Current
Protocols in Molecular Biology (pp. 2.5B.1–2.5B.12). Canada: Wiley and Sons.
Francis, G. A., Thomas, C. & O’Beirne, D. (1999). The microbiological safety of
minimally processed vegetables. International Journal of Food Science &
Technology, 34, 1–22.
Franciosa, G., Tartaro, S., Wedell-Neergaard, C. & Aureli, P. (2001). Characterization
of Listeria monocytogenes strains involved in invasive and noninvasive listeriosis
outbreaks by PCR-based fingerprinting techniques. Applied and Environmental
Microbiology, 67, 1793–1799.
Furrer, B., Candrian, U., Hoefelein C. & Luethy, J. (1991). Detection and identification
of Listeria monocytogenes in cooked sausage products and in milk by in vitro
amplification of haemolysin gene fragments. Journal of Applied Bacteriology, 70,
372-379.
101
Gaillard, J. L., Berche, P., Frehel, C., Gouin, E. & Cossart, P. (1991). Entry of L.
monocytogenes into cells is mediated by internalin, a repeat protein reminiscent of
surface antigens from gram-positive cocci. Cell, 65, 1127-1141.
Gaillard, J. L., Jaubert, F. & Berche, P. (1996). The inlAB locus mediates the entry of
Listeria monocytogenes into hepatocytes in vivo. The Journal of Experimental
Medicine, 183, 359-369.
Galsworthy, S. B., Girdler, S. & Koval, S. F. (1990). Chemotaxis in Listeria
monocytogenes. Acta Microbiologica Hungarica, 37, 81–85.
Gandhi, M. & Chikindas, M. L. (2007). Listeria: a foodborne pathogen that knows how
to survive. International Journal of Food Microbiology, 113, 1–15.Gelbíčová, T.
& Karpíšková, R. (2012). Outdoor environment as a Source of Listeria
monocytogenes in food chain. Czech Journal of Food Sciences, 30, 83-88.
George, S. M. & Lund, B. M. (1992). The effect of culture medium and aeration on
growth of Listeria monocytogenes at pH 4.5. Letters in Applied Microbiology, 15,
49–52.
Gerner-Smidt, P., Hise, K., Kincaid, J., Hunter, S., Rolando, S., Hyytia-Trees, Ribot, E.
M. & Swaminathan, B. (2006). PulseNet USA: a five-year update. Foodborne
Pathogens and Disease, 3, 9–19.
Gracieux, P., Roche, S. M., Pardon, P. & Velge, P. (2003). Hypovirulent Listeria
monocytogenes strains are less frequently recovered than virulent strains on
PALCAM and Rapid’L. mono media. International Journal of Food
Microbiology, 83, 133-145.
Graves, L. M., Swaminathan, B., Reeves, M. W., Hunter, S. B., Weaver, R. E.,
Plikaytis, B. D. & Schuchat, A. (1994). Comparison of ribotyping and multilocus
enzyme electrophoresis for subtyping of Listeria monocytogenes isolates. Journal
of Clinical Microbiology, 32, 2936-43.
Graves, L. M., Swaminathan, B. & Hunter, S. B. (1999). Subtyping Listeria
monocytogenes. In E. T. Ryser & E. H. Marth (Eds.), Listeria, Listeriosis, and
Food Safety, (pp. 279-99). New York: Marcel Dekker, Inc.
Gravesen, A., Jacobsen, T., Møller, P. L., Hansen, F., Larsen, A. G. & Knøchel, S.
(2000). Genotyping of Listeria monocytogenes: comparison of RAPD, ITS, and
PFGE. International Journal of Food Microbiology, 57, 43–51.
Gray, M., Zadoks, R. N., Fortes, E. D., Dogan, B., Cai, S., Chen, Y., Scott, V. N.,
Gombas, D. E., Boor, K. J. & Wiedmann, M. (2004). Listeria monocytogenes
isolates from foods and humans form distinct but overlapping populations.
Applied and Environmental Microbiology, 70, 5833–5841.
Greiffenberg, L., Goebel, W., Kim, K. S., Weiglein, I., Bubert, A., Engelbrecht, F.,
Stins, M. & Kuhn, M. (1998). Interaction of Listeria monocytogenes with human
brain microvascular endothelial cells: InlB-dependent invasion, long-term
intracellular growth, and spread from macrophages to endothelial cells. Infection
and Immunity, 66, 5260-5267.
102
Greenwood, M., Willis, C., Doswell, P., Allen, G. & Pathak, K. (2005). Evaluation of
chromogenic media for the detection of Listeria species in food. Journal of
Applied Microbiology, 99, 1340–1345.
Groski, L. (2008). Phenotypic Identification. In D. Liu (Ed.). Handbook of Listeria
monocytogenes (pp. 139-168). New York, NY: CRC Press.
Gugnani, H. C. (1999). Some emerging food and water borne pathogens. Journal of
Communicable Diseases, 31, 65–72.
Halter, E. L., Neuhaus, K. & Scherer, S. (2013). Listeria weihenstephanensis sp. nov.,
isolated from the water plant Lemna trisulca taken from a freshwater pond.
International Journal of Systematic and Evolutionary Microbiology, 63, 641-647.
Hamon, M., Bierne, H. & Cossart, P. (2006). Listeria monocytogenes: a multifaceted
model. Nature Reviews, 4, 423-434.
Hansen, J. M., Gerner-Smidt, P. & Bruun B. (2005). Antibiotic susceptibility of Listeria
moonocytogenes in Denmark 1958-2001. Acta Pathologica, Microbiologica et
Immunologica Scandinavica, 113, 31–6.
Harakeh, S., Saleh, I., Zouhairi, O., Baydoun, E., Barbour, E. & Alwan, N. (2009).
Antimicrobial resistance of Listeria monocytogenes isolated from dairy-based
food products. Science of the Total Environment, 407, 4022–4027.
Hof, H. (2003). History and epidemiology of listeriosis. FEMS Immunology and
Medical Microbiology, 35, 199-202.
Hoffman, A. D. & Weidmann, M. (2001). Comparative evaluation of culture and BAX
polymerase chain reaction-based detection methods for Listeris spp. and Listeria
monocytogenes in environmental and raw fish samples. Journal of Food
Protection, 64, 1521–1526.
Houhoula, D. P., Peirasmaki, D., Konteles, S. J., Kizis, D., Koussissis, S., Bratacos, M.,
Poggas, N., Charvalos, E., Tsakris, A., & Papaparaskevas, J. (2012). High level of
heterogeneity among Listeria monocytogenes isolates from clinical and food
origin specimens in Greece. Foodborne Pathogens and Disease, 9, 848-852.
Indrawattana, N., Nibaddhasobon, T., Sookrung, N., Chongsa-nguan, M.,
Tungtrongchitr, A., Makino, S., Tungyong, W. & Chaicumpa, W. (2011).
Prevalence of Listeria monocytogenes in raw meats marketed in Bangkok and
characterization of the isolates by phenotypic and molecular methods. Journal of
Health, Population and Nutrition, 29, 26–38.
Jacquet, C., Catimel, B., Brosch, R., Buchrieser, C., Dehaumont, P., Goulet, V.,
Lepoutre, A., & Veit, P. & Rocourt, J. (1995). Investigations related to the
epidemic strain involved in the French listeriosis outbreak in 1992. Applied and
Environmental Microbiology, 61, 2242–2246.
Jacquet, C., Doumith, M., Gordon, J. I., Matin, P. M. V., Cossat, P. & Lecerit, M.
(2004). A molecular marker for evaluating the pathogenic potential of foodborne
Listeria monocytogenes. Journal of Infectious Diseases, 189, 2094-2100.
Jaradat, Z. W., Wampler, J. W. & Bhunia, A. W. (2003). A Listeria adhesion protein
deficient Listeria monocytogenes strain shows reduced adhesion primarily to
intestinal cell lines. Medical Microbiology and Immunology, 192, 85-91.
103
Johan, V., Neveltlaan, O. & Haag, D. (2004). 2nd Informatory Note on Refrigeration
and Food Listeria monocytogenes in Refrigerated Foods. International institute of
refrigeration. Retrieved from http://www.iifiir.org.
Jorgensen, F., Stephens, P. J. & Knochel, S. (1995). The effect of osmotic shock and
subsequent adaptation on the thermotolerance and cell morphology of Listeria
monocytogenes. Journal of Applied Bacteriology, 79, 274–281.
Junttila, J. R., Niemelä, S. I. & Hirn, J. (1988). Minimum growth temperatures of
Listeria monocytogenes and non-heamolytic Listeria. Journal of Applied
Bacteriology, 65, 321–327.
Kamp, H. D. & Higgins, D. E. (2011). A Protein Thermometer Controls Temperature-
Dependent Transcription of Flagellar Motility Genes in Listeria monocytogenes.
PLoS Pathog, 7, DOI:10.1371/journal.ppat.1002153.
Kathariou, S. (2002). Listeria monocytogenes virulence and pathogenicity, a food safety
perspective. Journal of Food Protection, 65, 1811–1829.
Kingdon, G. C., & Sword, P. (1970). Effect of Listeria monocytogenes hemolysin on
phagocytic cells and lysosomes. Infection and Immunity, 1, 356–362.
Lawrence, L. M., & Gilmour, A. (1995). Characterization of Listeria monocytogenes
isolated from poultry products and from the poultry-processing environment by
random amplification of polymorphic DNA and multilocus enzyme
electrophoresis. Applied and Environmental Microbiology, 61, 2139–2144.
Lee, H. Y., Chai, L. C., Pui, C. F., Tunung, R., Wong, W. C., Shuhaimi, M., Kqueen, C.
Y., Ghazali, F. M., Nishibuchi, M. & Son, R. (2011). Using RAPD-PCR as
molecular assessment on the performance of CHROMAgar™ Listeria and
PALCAM agar on isolation of Listeria spp. and L. monocytogenes from foods.
International Food Research Journal, 18, 501-506.
Lingnau, A., Chakraborty, T., Niebuhr, K., Domann, E. & Wehland, J. (1996).
Identification and purification of novel internalin-related proteins in Listeria
monocytogenes and Listeria ivanovii. Infection and Immunity, 64, 1002-1006.
Liu, D., Ainsworth, A. J., Austin, F., W. & Lawrence, M. L. (2003). Use of PCR
primers derived from a putative transcriptional regulator gene for species-specific
determination of Listeria monocytogenes. International Journal of Food
Microbiology, 91, 297–304.
Liu, D., Lawrence, M. L., Ainsworth, A. J. & Austin, F. W. (2005). Comparative
assessment of acid, alkali and salt tolerance in Listeria monocytogenes virulent
and avirulent strains. FEMS Microbiology Letters, 243, 373–378.
Liu, D. (2006). Identification, subtyping and virulence determination of Listeria
monocytogenes, an important foodborne pathogen. Journal of Medical
Microbiology, 55, 645-659.
Liu, D., Lawrence, M. L., Austin, F. W. & Ainsworth, A. J. (2007). A multiplex PCR
for species-and virulence-specific determination of Listeria monocytogenes.
Journal of Microbiological Methods, 71, 133-140.
104
Liu, D. (2008). Epidemiology. In D. Liu (Ed.), Handbook of Listeria monocytogenes
(pp. 27-54). Boca Raton, FL: CRC Press.
Lomonaco, S., Patti, R., Knabel, S. J. & Civer, T. (2012). Detection of virulence-
associated genes and epidemic clone markers in Listeria monocytogenes isolates
from PDO Gorgonzola cheese. International Journal of Food Microbiology, 160,
76–79.
Louie, M., Jayaratne, P., Luchsinger, I., Devenish, J., Yao, J., Schlech, W. & Simor, A.
(1996). Comparison of ribotyping, arbitrarily primed PCR, and pulsed-field gel
electrophoresis for molecular typing of Listeria monocytogenes. Journal of
Clinical Microbiology, 34, 15–19.
Lou, Y. & Yousef A. E. (1999). Characteristics of Listeria monocytogenes Important to
Food Precessors. In E. T. Ryser & E. H. Marth (Eds.). Listeria, Listeriosis and
Food Safety (2th
ed.) (pp. 139-168). New York, NY: Marcel Dekker, Inc.
Lukinmaa, S., Nakari, U. M., Eklund, M. & Siitonen, A. (2004). Application of
molecular genetic methods in diagnostics and epidemiology of food-borne
bacterial pathogens. Acta Pathologica, Microbiologica et Immunologica
Scandinavica, 112, 908–929.
Lyytikainen, O., Nakari, U. M., Lukinmaa, S., Kela, E., Nguyen Tran Minh, N. &
Siitonen, A. (2006). Surveillance of listeriosis in Finland during 1995–2004.
Eurosurveillance, 11, 82–85.
Mammina, C., Aleo, A., Romani, C., Pellissier, N., Nicoletti, P., Pecile, P., Nastasi, A.
& Pontello, M. M. (2009). Characterization of Listeria monocytogenes isolates
from human listeriosis cases in Italy. Journal of Clinical Microbiology, 47, 2925-
2930.
Marian, M. N., Sharifah Aminah, S. M., Zuraini, M. I., Son, R., Maimunah, M., Lee, H.
Y., Wong, W. C. & Elexson, N. (2012). MPN-PCR detection and antimicrobial
resistance of Listeria monocytogenes isolated from raw and ready-to-eat foods in
Malaysia. Food Control, 28, 309-314.
Marien, M., Decostere, A., Werbrouck, H., Van Coillie, E., Paepe, D., Moyaert, H.,
Pasmans, F., Daminet, S. & Haesebrouck, F. (2007). Isolation of Listeria
monocytogenes from the gallbladder of a dog with liver insufficiency. Vlaams
Diergeneeskundig Tijdschrift, 76, 352-354.
Marino, M., Braun, L., Cossart, P. & Ghosh, P. (1999). Structure of the inlB leucine-
rich repeats, a domain that triggers host cell invasion by the bacterial pathogen L.
monocytogenes. Molecular Cell, 4, 1063-1072.
Marino, M., Braun, L., Cossart, P. & Ghosh, P. (2000). A framework for interpreting
the leucine-rich repeats of the Listeria internalins. Proceedings of the National
Academy of Sciences USA, 97, 8784-8788.
Martins, E. A., & Leal Germano, P. M. (2011). Listeria monocytogenes in ready-to-eat,
sliced, cooked ham and salami products, marketed in the city of São Paulo, Brazil:
Occurrence, quantification, and serotyping. Food Control, 22, 297-302.
McGann, P., Raengpradub, S., Ivanek, R., Wiedmann, M. & Boor, K. J. (2008).
Differential regulation of Listeria monocytogenes internalin and internalin-like
105
genes by sigmaB and PrfA as revealed by subgenomic microarray analyses.
Foodborne Pathogens and Disease, 5, 417-435.
McLauchlin, J., Mitchell, R. T., Smerdon, W. J. & Jewell, K. (2004). Listeria
monocytogenes and listeriosis: a review of hazard characterization for use in
microbiological assessment of foods. International Journal of Food Microbiology,
92, 15–33.
Mead, P. S., Slutsker, L., Dietz, V., McCaig, L. F., Bresee, J. S., Shapiro, C., Griffin, p.
M. & Tauxe, R. V. (1999). Food-related illness and death in the United States.
Emerging Infectious Diseases journal, 5, 607-625.
Mead, P. S., Dunne, E.F., Graves, L., Wiedmann, M., Patrick, M., Hunter, S., Salehi, E.,
Mostashari, F., Craig, A. & Mshar, P. (2006). Nationwide outbreak of listeriosis
due to contaminated meat. Epidemiology and Infection, 134, 744–751.
Meloni, D., Galluzzo, P., Mureddu, A., Piras, F., Griffiths, M. & Mazzette, R. (2009).
Listeria monocytogenes in RTE foods marketed in Italy: prevalence and
automated EcoRI ribotyping of the isolates. International Journal of Food
Microbiology, 129, 166-173.
Meng, J. & Doyle, M. P. (1997). Emerging issues in microbiological food safety.
Annual Review of Nutrition, 17, 255–275.
Miteva, V., Ivanova, I., Budakov, I., Pantev, A., Stefanova, T., Danova, S., Moncheva,
P., Mitev, V., Dousset, X. & Boyaval, P. (1998). Detection and characterization of
a novel antibacterial substance produced by a Lactobacillus delbrueckii strain
1043. Journal of Applied Microbiology, 85, 603–614.
Montville, T. J. & Matthews, K. R. (2008). Food Microbiology, An Introduction (2nd
ed.). Washington, DC: ASM Press.
Moore, M. A., & Datta, A. R. (1994). DNA fingerprinting of Listeria monocytogenes
strains by pulsed-field gel electrophoresis. Food Microbiology, 11, 31–38.
Morobe, I. C., Obi, C. L., Nyila, M. A., Gashe, B. A. & Matsheka, M. I. (2009).
Prevalence, antimicrobial resistance profiles of Listeria monocytogenes from
various foods in Gaborone, Botswana. African Journal of Biotechnology, 8, 6383-
6387.
Morrow, R. A., Harrison, M. A. & Harrison J. A. (2004). Fate of acid adapted and non
adapted E. coli, L. monocytogenes and Salmonella on ground or whole beef jerky.
Center for Food Safety, University of Georgia, Griffin, GA.
Morvan, A., Moubareck, C., Leclercq, A., Hervé-Bazin, M., Bremont, S., Lecuit, M.,
Courvalin, P. & Le Monnier, A. (2010). Antimicrobial resistance of Listeria
monocytogenes strains isolated from humans in France. Antimicrobial Agents and
Chemotherapy, 54, 2728-2731.
Nair, S., Karim, R., Cardosa, M. J., Ismail, G. & Pang, T. (1999). Convenient and
versatile DNA extraction using agarose plugs for ribotyping of problematic
bacterial species. Journal of Microbiological Methods, 38, 63–67.
Navia, M. M., Capitano, L., Ruiz, J., Vargas, M., Urassa, H., Schellemberg, D., Gascon,
J. & Vila, J. (1999). Typing and Characterization of Mechanisms of Resistance of
106
Shigella spp. Isolated from Feces of Children under 5 Years of Age from Ifakara,
Tanzania. Journal of Clinical Microbiology, 37, 3113-3117.
Nguyen, Van, J. C., Nguyien, L., Guillemain, R., Amrein, C., Buu-Hoï, A. & Gutmann,
L. (1994). Relapse of infection or reinfection by Listeria monocytogenes in a
patient with heart transplant: usefulness of pulsed-field gel electrophoresis for
diagnosis. Clinical Infectious Diseases, 19, 208–209.
Niederhauser, C., Candrian, U., Hofelein, C., Jermini, M., Buhler, H.-P. & Luthy, J.
(1992). Use of polymerase chain reaction for detection of Listeria monocytogenes
in food. Applied and Environmental Microbiology, 58, 1564-1568.
Nucera, D., Lomonaco, S., Bianchi, D. M., Decastelli, L., Grassi, M. A., Bottero, M. T.
& Civera, T. (2010). A five year surveillance report on PFGE types of Listeria
monocytogenes isolated in Italy from food and food related environments.
International Journal of Food Microbiology, 140, 271-276.
O’Donoghue, K., Bowker, K., McLauchlin, J., Reeves, D. S., Bennett, P. M. &
MacGowan, A. P. (1995). Typing of Listeria monocytogenes by random amplified
polymorphic DNA (RAPD) analysis. International Journal of Food Microbiology,
27, 245–252.
O’Grady, J., Ruttledge, M., Sedano-Balbás, S., Smith, T. J., Barry, T. & Maher, M.
Rapid detection of Listeria monocytogenes in food using culture enrichment
combined with real-time PCR. Food Microbiology, 26, 4-7.
Orsi, R., Ripoll, D., Yeung, M., Nightingale, K. & Wiedmann, M. (2007).
Recombination and positive selection contribute to evolution of Listeria
monocytogenes inlA. Microbiology, 153, 2666-2678.
Paillard, D., Dubois, V., Duran, R., Nathier, F., Guittet, C., Caumette, P. & Quentin, C.
(2003). Rapid identification of Listeria species by using restriction fragment
length polymorphism of PCR-amplified 23S rRNA gene fragments. Applied and
Environmental Microbiology, 69, 6386–6392.
Ponniah, J., Robin, T., Paie, M. S., Radu, S., Ghazali, F. M., Kqueen, C. Y., Nishibuchi,
M., Nakaguchi, Y. & Malakar, P. K. (2010). Listeria monocytogenes in raw salad
vegetables sold at retail level in Malaysia. Journal of Food Control, 21, 774–778.
Proctor, M. E., Brosch, R., Mellen, J. W., Garrett, L. A., Kaspar, C. W. & Luchansky, J.
B. (1995). Use of pulsed-field gel electrophoresis to link sporadic cases of
invasive listeriosis with recalled chocolate milk. Applied and Environmental
Microbiology, 61, 3177–3179.
Rafelski, S. M., & Theriot, J. A. (2006). Mechanism of polarization of Listeria
monocytogenes surface protein ActA. Molecular Microbiology, 59, 1262-1279.
Raffelsbauer, D., Bubert, A., Engelbrecht, F., Scheinpflug, J., Simm, A., Hess, J.,
Kaufmann, S. H. E. & Goebel, W. (1998). The gene cluster inlC2DE of Listeria
monocytogenes contains additional new internalin genes and is important for
virulence in mice. Molecular Genetics and Genomics, 260, 144-158.
Rahimi, E., Ameri, M. & Momtaz, H. (2010). Prevalence and antimicrobial resistance of
Listeria species isolated from milk and dairy products in Iran. Food Control, 21,
1448–1452.
107
Ramaswamy, V., Cresence, V. M., Rejitha, J. S., Lekshmi, M. U., Dharsana, K. S.,
Prasad, S. P. & Vijila, H. M. (2007). Listeria: review of epidemiology and
pathogenesis. Journal of Microbiology, Immunology and Infection, 40, 4-13.
Rocourt, J. (1999). The genus Listeria and Listeria monocytogenes: phylogenetic
position, taxonomy, and identification. In E. T. Ryser & E. H. Marth (Eds.).
Listeria, Listeriosis and Food Safety (2th ed.) (pp. 1-12). New York, NY: Marcel
Dekker, Inc.
Rossmanith, P., Krassnig, M., Wagner, M. & Hein, I. (2006). Detection of Listeria
monocytogenes in food using a combined enrichment/real-time PCR method
targeting the prfA gene. Research in Microbiology, 157, 763-771.
Rousseaux, S., Olier, M., Lemaître, J. P., Piveteau, P. & Guzzo, J. (2004). Use of PCR-
restriction fragment length polymorphism of inlA for rapid screening of Listeria
monocytogenes strains deficient in the ability to invade Caco-2 cells. Applied and
Environmental Microbiology, 70, 2180-2185.
Sabet, C., Toledo-Arana, A., Personnic, N., Lecuit, M., Dubrac, S., Poupel, O., Gouin,
E., Nahori, M. A., Cossart, P. & Bierne, H. (2008). The Listeria monocytogenes
virulence factor InlJ is specifically expressed in vivo and behaves as an adhesin.
Infection and Immunity, 76, 1368-1378.
Salamina, G., Dalle Donne, E., Niccolini, A., Poda, G., Cesaroni, D., Bucci, M., Fini,
R., Maldini, M., Schuchat, A. & Salmaso, S. (1996). A foodborne outbreak of
gastroenteritis involving Listeria monocytogenes. Epidemiology and Infection,
117, 429–436.
Sant'Ana, A. S., Igarashi, M. C., Landgraf, M., Destro, M. T. & Franco, B. D. G. M.
(2012). Prevalence, populations and pheno-and genotypic characteristics of
Listeria monocytogenes isolated from ready-to-eat vegetables marketed in São
Paulo, Brazil. International Journal of Food Microbiology, 155, 1-9.
Scallan, E, Hoekstra, R. M., Angulo, F. J., Tauxe, R. V., Widdowson, M. A., Roy, S. L.,
Jones, J. L. & Griffin, P. M. (2011). Foodborne illness acquired in the United
States-major pathogens. Emerging Infectious Diseases journal, 17, 7-15.
Schubert, W. D., Gobel, G., Diepholz, M., Darji, A., Kloer, D., Hain, T., Chakraborty,
T., Wehland, J., Domann, E. & Heinz, D. W. (2001). Internalins from the human
pathogen Listeria monocytogenes combine three distinct folds into a contiguous
internalin domain. Journal of Molecular Biology, 312, 783-794.
Schubert, W. D., Urbanke, C., Ziehm, T., Beier, V., Machner, M. P., Domann, E.,
Wehland, J., Chakraborty, T. & Heinz, D. W. (2002). Structure of internalin, a
major invasion protein of Listeria monocytogenes, in complex with its human
receptor E-cadherin. Cell, 111, 825-836.
Schubert, W. D., & Heinz, D. W. (2003). Structural aspects of adhesion to and invasion
of host cells by the human pathogen Listeria monocytogenes. Chembiochem, 4,
1285-1291.
Seeliger, H. P. R. (1961). Listeriosis. Basel: Karger.
108
Seeliger, H. P. R. & Jones, D. (1986). Genus Listeria Pirie 1940. In P. H. A., Sneath, N.
S., Mair, M. E., Sharpe & J. G., Holt (Eds.), Bergey’s Manual of Systematic
Bacteriology (Vol. 2) (pp. 1235-1245). Baltimore: Williams & Wilkins.
Shearer, A. E. H., Strapp, C. M. & Joerger, R. D. (2001). Evaluation of a polymerase
chain reaction-based system for detection of Salmonella enteritidis, Escherichia
coli O157:H7, Listeria spp. and Listeria monocytogenes on fresh fruits and
vegetables. Journal of Food Protection, 64, 788-795.
Shen, Y., Liu, Y., Zhang, Y., Cripe, J., Conway, W., Meng, J., Hall, G. & Bhagwat, A.
A. (2006). Isolation and Characterization of Listeria monocytogenes isolates from
Ready-To-Eat Foods in Florida. Applied and Environmental Microbiology, 72,
5073-5076.
Sim, J., Hood, D., Finnie, L., Wilson, M., Graham, C., Brett, M. & Hudson, J. A.
(2002). Series of incidents of Listeria monocytogenes non-invasive febrile
gastroenteritis involving ready-to-eat meats. Letters in Applied Microbiology, 35,
409-413.
Sleator, R. D., Gahan, C. G. M. & Hill, C. (2003). A postgenomic appraisal of
osmotolerance in Listeria monocytogenes. Applied and Environmental
Microbiology, 69, 1-9.
Smith, A., & Nelson, R. J. (1999). Capillary electrophoresis of DNA. In F.M. Ausubel,
R. Brent, R. E. Kingston, D. D. Moore, J. G. Seidman, J. A. Smith & K. Struhl
(Eds.), Molecular Biology (2.8.1–2.8.17). Canada: John Wiley and Sons Inc.
Smith, C. L., Lawrance, S. K., Gillespie, G. A., Cantor, C. R., Weissman, S. M. &
Collins, F. S. (1987). Strategies for mapping and cloning macroregions of
mammalian genomes. Methods in Enzymology, 151, 461-489.
Spencer, J. A. D. (1987). Perinatal listeriosis. British Medical Journal, 295, 349.
Strydom, A., Bester, I. M., Cameron, M., Franz C. M. A. P. & Witthuhn, R. C. (2013).
Subtyping of Listeria monocytogenes isolated from a South African avocado
processing facility using PCR-RFLP and PFGE. Food Control, 31, 274-279.
Swaminathan, B., & Gerner-Smidt, P. (2007). The epidemiology of human listeriosis.
Microbes and Infection, 9, 1236-1243.
Thomas, E. J. G., King, R. K., Burchak, J. & Gannon, V. P. J. (1991). Sensitive and
specific detection of Listeria monocytogenes in milk and ground beef with the
polymerase chain reaction. Applied and Environmental Microbiology, 57, 2576-
2580.
Vazquez-Boland, J. A., Kuhn, M., Berche, P., Chakraborty, T., Dominguez-Bernal, G.,
Goebel, W., González-Zorn, B., Wehland J. & Kreft, J. (2001). Listeria
pathogenesis and molecular virulence determinants. Clinical Microbiology
Reviews, 14, 584-640.
Versalovic, J., Schneider, M., de Bruijn, F. J. & Lupski, J. R. (1994). Genomic
fingerprinting of bacteria using repetitive sequence-based polymerase chain
reaction. Methods in Molecular and Cellular Biology, 5, 25-40.
109
Vines, A. & Swaminathan, B. (1998). Identification and characterization of nucleotide
sequence differences in three virulence-associated genes of Listeria
monocytogenes strains representing clinically important serotypes. Current
Microbiology, 36, 309-318.
Walker, S. J., Archer, P. & Banks, J. G. (1990). Growth of Listeria monocytogenes at
refrigeration temperatures. Journal of Applied Bacteriology, 68, 157-162.
Wang, X. M., Lü, X. F., Yin, L., Liu, H. F., Zhang, W. J., Si, W., Yu, S. Y., Shao, M. L.
& Liu, S. G. (2013). Occurrence and antimicrobial susceptibility of Listeria
monocytogenes isolates from retail raw foods. Food Control, 32, 153-158.
Wanger, M. & McLauchlin, J. (2008). Biology. In D. Liu (Ed.). Handbook of Listeria
monocytogenes (pp. 139-168). New York, NY: CRC Press.
Wernars, K., Heuvelman, C. J., Chakraborty, T. & Notermans, S. H. W. (1991). Use of
the polymerase chain reacgion for direct detection of Listeria monocytogenes in
soft cheese. Journal of Applied Bacteriology, 70, 121-126.
Wiedmann, M., Bruce, J. L., Keating, C., Johnson, A. E., McDonough, P. L. & Batt, C.
A. (1997). Ribotypes and virulence gene polymorphisms suggest three distinct
Listeria monocytogenes lineages with differences in pathogenic potential.
Infection and Immunity, 65, 2707-2716.
Wong, H. C., Chao, W. L. & Yu, C. M. (1992). Detection of Listeria monocytogenes by
non-radioactive RNA probe and polymerase chain reaction. Chinese Journal of
Microbiology and Immunology, 25, 101-107.
Wong, W. C., Pui, C. F., Tunung, R., Cheah, Y. K., Nakaguchi. Y., Nishibuchi, M. &
Son, R. (2012). Prevalence of Listeria monocytogenes in frozen burger patties in
Malaysia. International Food Research Journal, 19, 1751-1756.
Yde, M. & Genicot, A. (2004). Use of PFGE to characterize clonal relationships among
Belgian clinical isolates of Listeria monocytogenes. Journal of Medical
Microbiology, 53, 399-402.
Yan, H., Neogi, S. B., Mo, Z., Guan, W., Shen, Z., Zhang, S., Li, L., Yamasaki, S., Shi,
L. & Zhong, N. (2010). Prevalence and characterization of antimicrobial
resistance of foodborne Listeria monocytogenes isolates in Hebei province of
Northern China, 2005–2007. International Journal of Food Microbiology, 144,
310-316.
Zhang, Y., Yeh, E., Hall, G., Cripe, J., Bhagwat, A. A. & Meng, J. (2007).
Characterization of Listeria monocytogenes isolated from retail foods.
International Journal of Food Microbiology 113, 47-53.
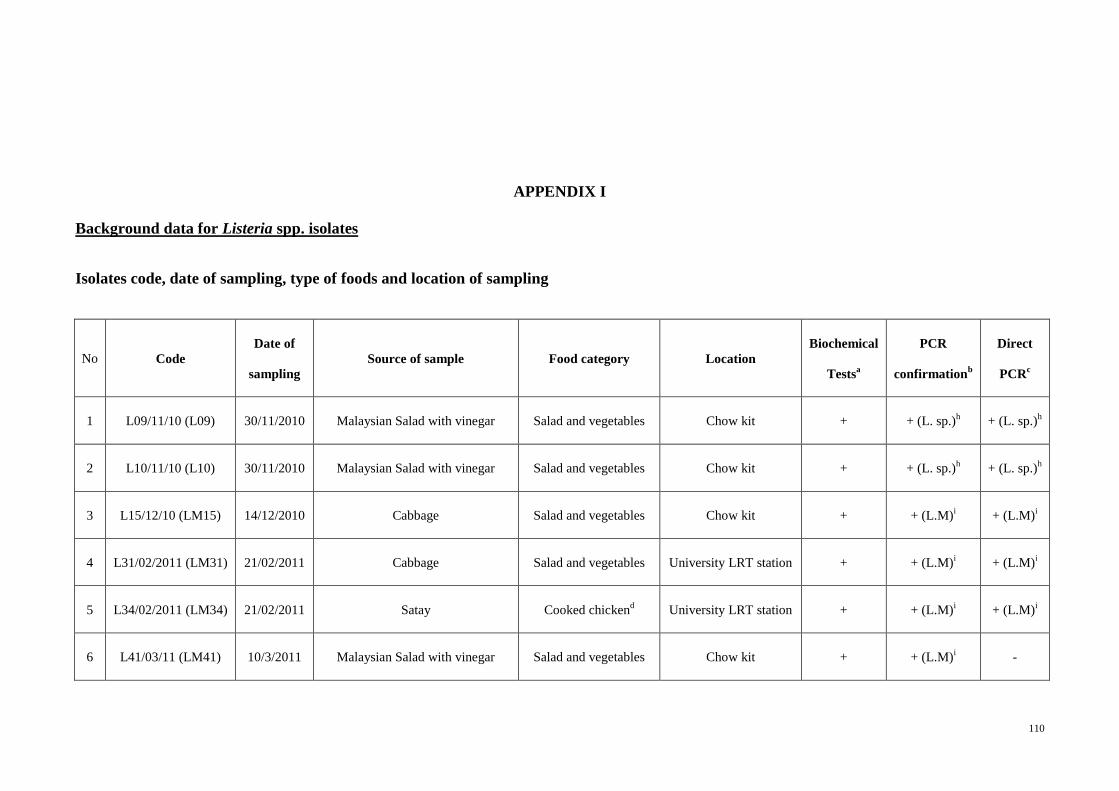
110
APPENDIX I
Background data for Listeria spp. isolates
Isolates code, date of sampling, type of foods and location of sampling
No Code
Date of
sampling
Source of sample Food category Location
Biochemical
Testsa
PCR
confirmationb
Direct
PCRc
1 L09/11/10 (L09) 30/11/2010 Malaysian Salad with vinegar Salad and vegetables Chow kit + + (L. sp.)h
+ (L. sp.)h
2 L10/11/10 (L10) 30/11/2010 Malaysian Salad with vinegar Salad and vegetables Chow kit + + (L. sp.)h
+ (L. sp.)h
3 L15/12/10 (LM15) 14/12/2010 Cabbage Salad and vegetables Chow kit + + (L.M)i
+ (L.M)i
4 L31/02/2011 (LM31) 21/02/2011 Cabbage Salad and vegetables University LRT station + + (L.M)i
+ (L.M)i
5 L34/02/2011 (LM34) 21/02/2011 Satay Cooked chickend
University LRT station + + (L.M)i
+ (L.M)i
6 L41/03/11 (LM41) 10/3/2011 Malaysian Salad with vinegar Salad and vegetables Chow kit + + (L.M)i
-
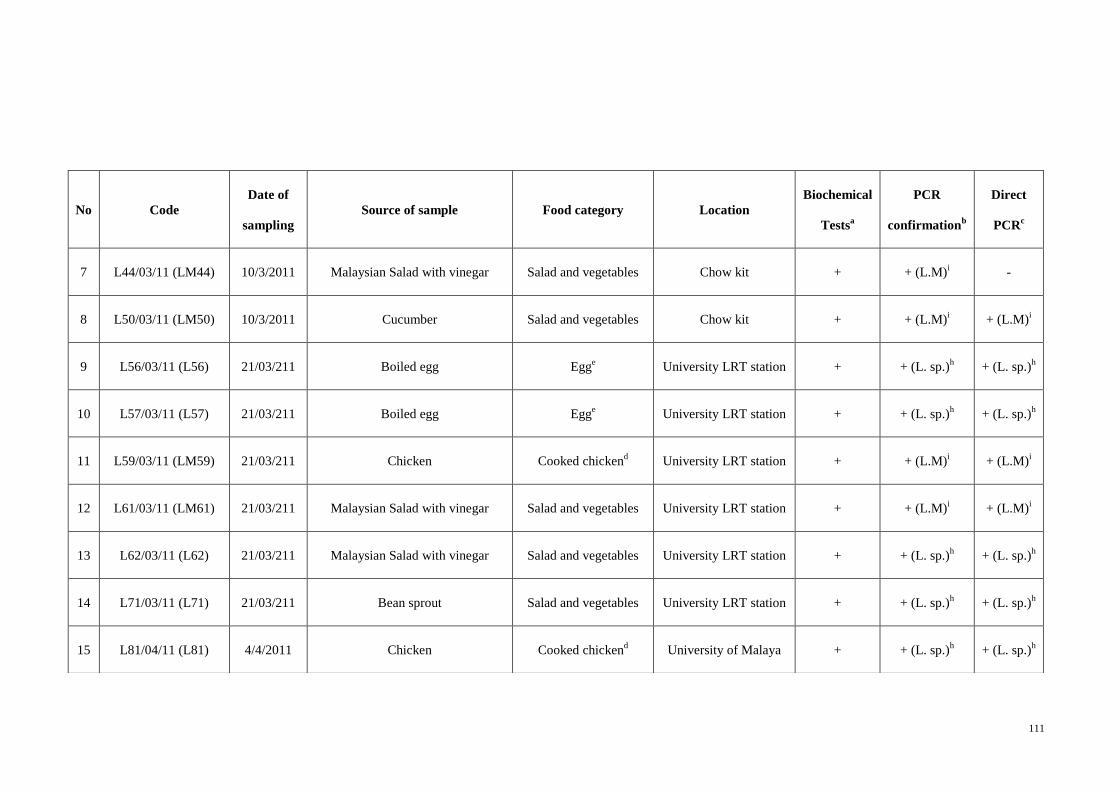
111
No Code
Date of
sampling
Source of sample Food category Location
Biochemical
Testsa
PCR
confirmationb
Direct
PCRc
7 L44/03/11 (LM44) 10/3/2011 Malaysian Salad with vinegar Salad and vegetables Chow kit + + (L.M)i
-
8 L50/03/11 (LM50) 10/3/2011 Cucumber Salad and vegetables Chow kit + + (L.M)i
+ (L.M)i
9 L56/03/11 (L56) 21/03/211 Boiled egg Egge
University LRT station + + (L. sp.)h
+ (L. sp.)h
10 L57/03/11 (L57) 21/03/211 Boiled egg Egge University LRT station + + (L. sp.)
h + (L. sp.)
h
11 L59/03/11 (LM59) 21/03/211 Chicken Cooked chickend University LRT station + + (L.M)
i + (L.M)
i
12 L61/03/11 (LM61) 21/03/211 Malaysian Salad with vinegar Salad and vegetables University LRT station + + (L.M)i
+ (L.M)i
13 L62/03/11 (L62) 21/03/211 Malaysian Salad with vinegar Salad and vegetables University LRT station + + (L. sp.)h
+ (L. sp.)h
14 L71/03/11 (L71) 21/03/211 Bean sprout Salad and vegetables University LRT station + + (L. sp.)h
+ (L. sp.)h
15 L81/04/11 (L81) 4/4/2011 Chicken Cooked chickend University of Malaya + + (L. sp.)
h + (L. sp.)
h
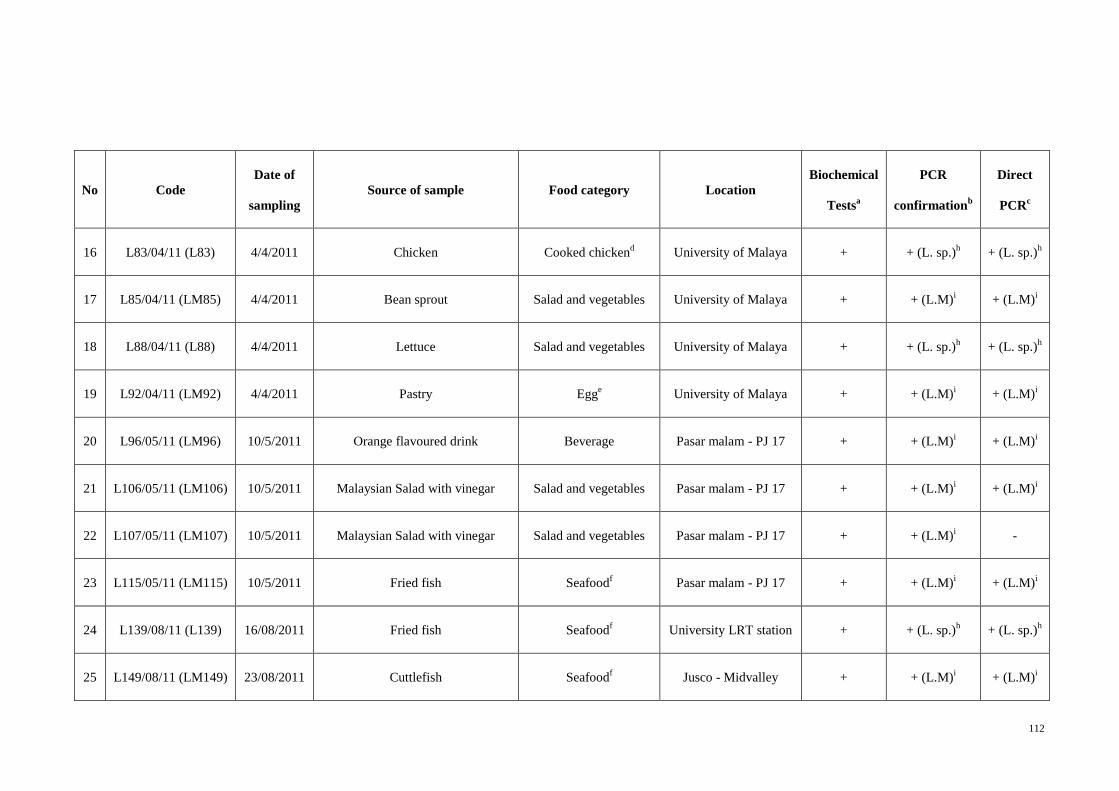
112
No Code
Date of
sampling
Source of sample Food category Location
Biochemical
Testsa
PCR
confirmationb
Direct
PCRc
16 L83/04/11 (L83) 4/4/2011 Chicken Cooked chickend University of Malaya + + (L. sp.)
h + (L. sp.)
h
17 L85/04/11 (LM85) 4/4/2011 Bean sprout Salad and vegetables University of Malaya + + (L.M)i
+ (L.M)i
18 L88/04/11 (L88) 4/4/2011 Lettuce Salad and vegetables University of Malaya + + (L. sp.)h
+ (L. sp.)h
19 L92/04/11 (LM92) 4/4/2011 Pastry Egge University of Malaya + + (L.M)
i + (L.M)
i
20 L96/05/11 (LM96) 10/5/2011 Orange flavoured drink Beverage Pasar malam - PJ 17 + + (L.M)i
+ (L.M)i
21 L106/05/11 (LM106) 10/5/2011 Malaysian Salad with vinegar Salad and vegetables Pasar malam - PJ 17 + + (L.M)i
+ (L.M)i
22 L107/05/11 (LM107) 10/5/2011 Malaysian Salad with vinegar Salad and vegetables Pasar malam - PJ 17 + + (L.M)i
-
23 L115/05/11 (LM115) 10/5/2011 Fried fish Seafoodf
Pasar malam - PJ 17 + + (L.M)i
+ (L.M)i
24 L139/08/11 (L139) 16/08/2011 Fried fish Seafoodf University LRT station + + (L. sp.)
h + (L. sp.)
h
25 L149/08/11 (LM149) 23/08/2011 Cuttlefish Seafoodf Jusco - Midvalley + + (L.M)
i + (L.M)
i
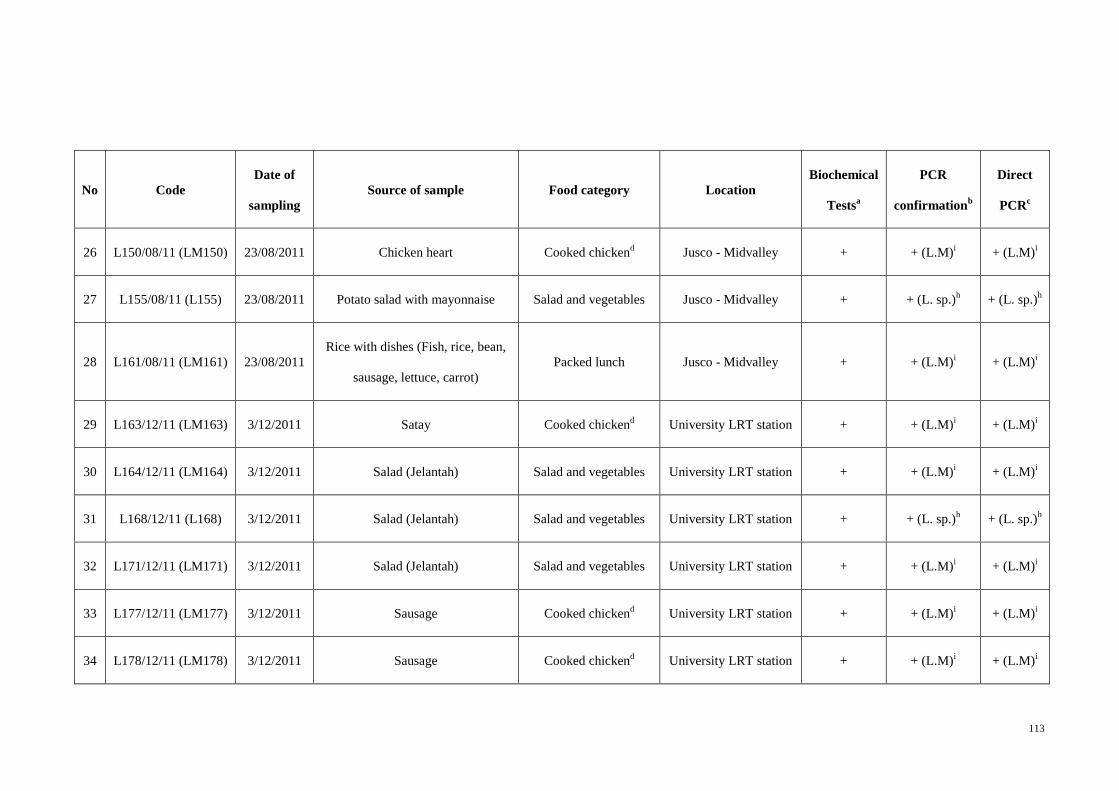
113
No Code
Date of
sampling
Source of sample Food category Location
Biochemical
Testsa
PCR
confirmationb
Direct
PCRc
26 L150/08/11 (LM150) 23/08/2011 Chicken heart Cooked chickend Jusco - Midvalley + + (L.M)
i + (L.M)
i
27 L155/08/11 (L155) 23/08/2011 Potato salad with mayonnaise Salad and vegetables Jusco - Midvalley + + (L. sp.)h
+ (L. sp.)h
28 L161/08/11 (LM161) 23/08/2011
Rice with dishes (Fish, rice, bean,
sausage, lettuce, carrot)
Packed lunch Jusco - Midvalley + + (L.M)i
+ (L.M)i
29 L163/12/11 (LM163) 3/12/2011 Satay Cooked chickend University LRT station + + (L.M)
i + (L.M)
i
30 L164/12/11 (LM164) 3/12/2011 Salad (Jelantah) Salad and vegetables University LRT station + + (L.M)i
+ (L.M)i
31 L168/12/11 (L168) 3/12/2011 Salad (Jelantah) Salad and vegetables University LRT station + + (L. sp.)h
+ (L. sp.)h
32 L171/12/11 (LM171) 3/12/2011 Salad (Jelantah) Salad and vegetables University LRT station + + (L.M)i
+ (L.M)i
33 L177/12/11 (LM177) 3/12/2011 Sausage Cooked chickend University LRT station + + (L.M)
i + (L.M)
i
34 L178/12/11 (LM178) 3/12/2011 Sausage Cooked chickend University LRT station + + (L.M)
i + (L.M)
i
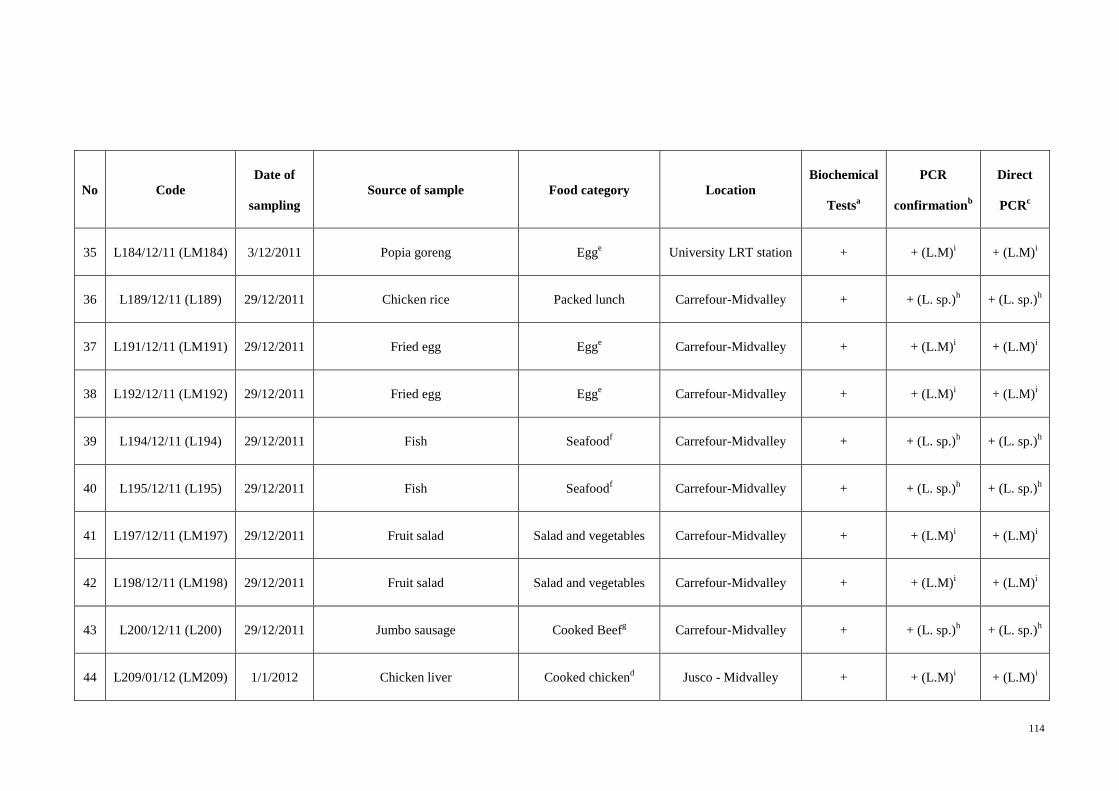
114
No Code
Date of
sampling
Source of sample Food category Location
Biochemical
Testsa
PCR
confirmationb
Direct
PCRc
35 L184/12/11 (LM184) 3/12/2011 Popia goreng Egge University LRT station + + (L.M)
i + (L.M)
i
36 L189/12/11 (L189) 29/12/2011 Chicken rice Packed lunch Carrefour-Midvalley + + (L. sp.)h
+ (L. sp.)h
37 L191/12/11 (LM191) 29/12/2011 Fried egg Egge Carrefour-Midvalley + + (L.M)
i + (L.M)
i
38 L192/12/11 (LM192) 29/12/2011 Fried egg Egge Carrefour-Midvalley + + (L.M)
i + (L.M)
i
39 L194/12/11 (L194) 29/12/2011 Fish Seafoodf Carrefour-Midvalley + + (L. sp.)
h + (L. sp.)
h
40 L195/12/11 (L195) 29/12/2011 Fish Seafoodf Carrefour-Midvalley + + (L. sp.)
h + (L. sp.)
h
41 L197/12/11 (LM197) 29/12/2011 Fruit salad Salad and vegetables Carrefour-Midvalley + + (L.M)i
+ (L.M)i
42 L198/12/11 (LM198) 29/12/2011 Fruit salad Salad and vegetables Carrefour-Midvalley + + (L.M)i
+ (L.M)i
43 L200/12/11 (L200) 29/12/2011 Jumbo sausage Cooked Beefg
Carrefour-Midvalley + + (L. sp.)h
+ (L. sp.)h
44 L209/01/12 (LM209) 1/1/2012 Chicken liver Cooked chickend Jusco - Midvalley + + (L.M)
i + (L.M)
i
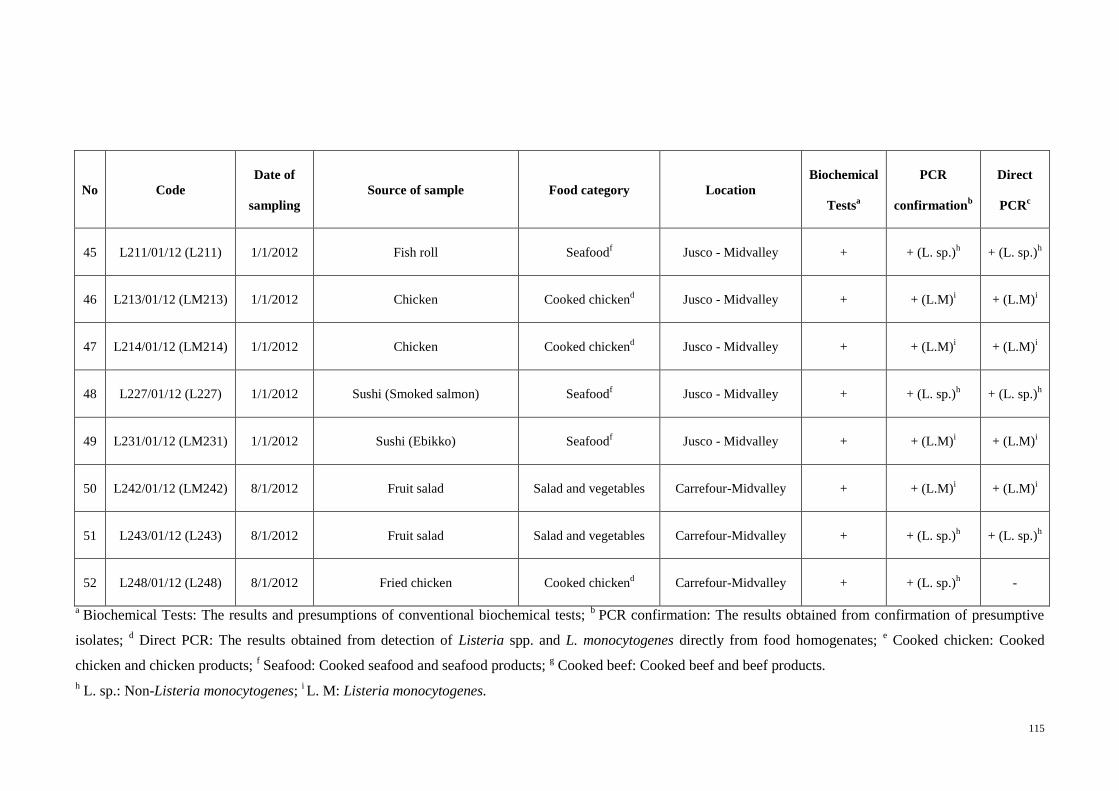
115
No Code
Date of
sampling
Source of sample Food category Location
Biochemical
Testsa
PCR
confirmationb
Direct
PCRc
45 L211/01/12 (L211) 1/1/2012 Fish roll Seafoodf Jusco - Midvalley + + (L. sp.)
h + (L. sp.)
h
46 L213/01/12 (LM213) 1/1/2012 Chicken Cooked chickend Jusco - Midvalley + + (L.M)
i + (L.M)
i
47 L214/01/12 (LM214) 1/1/2012 Chicken Cooked chickend Jusco - Midvalley + + (L.M)
i + (L.M)
i
48 L227/01/12 (L227) 1/1/2012 Sushi (Smoked salmon) Seafoodf Jusco - Midvalley + + (L. sp.)
h + (L. sp.)
h
49 L231/01/12 (LM231) 1/1/2012 Sushi (Ebikko) Seafoodf Jusco - Midvalley + + (L.M)
i + (L.M)
i
50 L242/01/12 (LM242) 8/1/2012 Fruit salad Salad and vegetables Carrefour-Midvalley + + (L.M)i
+ (L.M)i
51 L243/01/12 (L243) 8/1/2012 Fruit salad Salad and vegetables Carrefour-Midvalley + + (L. sp.)h
+ (L. sp.)h
52 L248/01/12 (L248) 8/1/2012 Fried chicken Cooked chickend Carrefour-Midvalley + + (L. sp.)
h -
a Biochemical Tests: The results and presumptions of conventional biochemical tests;
b PCR confirmation: The results obtained from confirmation of presumptive
isolates; d Direct PCR: The results obtained from detection of Listeria spp. and L. monocytogenes directly from food homogenates;
e Cooked chicken: Cooked
chicken and chicken products; f Seafood: Cooked seafood and seafood products;
g Cooked beef: Cooked beef and beef products.
h L. sp.: Non-Listeria monocytogenes;
i L. M: Listeria monocytogenes.
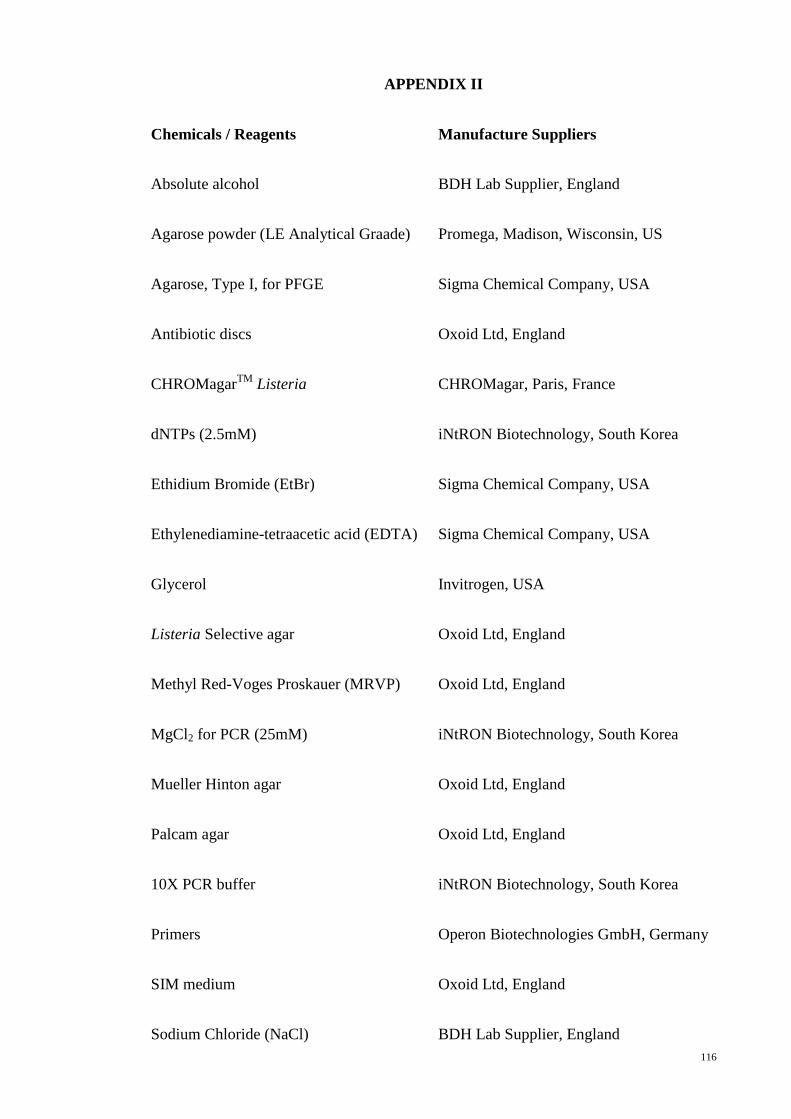
116
APPENDIX II
Chemicals / Reagents Manufacture Suppliers
Absolute alcohol BDH Lab Supplier, England
Agarose powder (LE Analytical Graade) Promega, Madison, Wisconsin, US
Agarose, Type I, for PFGE Sigma Chemical Company, USA
Antibiotic discs Oxoid Ltd, England
CHROMagarTM
Listeria CHROMagar, Paris, France
dNTPs (2.5mM) iNtRON Biotechnology, South Korea
Ethidium Bromide (EtBr) Sigma Chemical Company, USA
Ethylenediamine-tetraacetic acid (EDTA) Sigma Chemical Company, USA
Glycerol Invitrogen, USA
Listeria Selective agar Oxoid Ltd, England
Methyl Red-Voges Proskauer (MRVP) Oxoid Ltd, England
MgCl2 for PCR (25mM) iNtRON Biotechnology, South Korea
Mueller Hinton agar Oxoid Ltd, England
Palcam agar Oxoid Ltd, England
10X PCR buffer iNtRON Biotechnology, South Korea
Primers Operon Biotechnologies GmbH, Germany
SIM medium Oxoid Ltd, England
Sodium Chloride (NaCl) BDH Lab Supplier, England
117
Triple Suger Iron Agar (TSI) Oxoid Ltd, England
Trypticase Soy Agar Difco, Becton, Dickinson, USA
Yeast Extract Oxoid Ltd, England
Enzymes and Proteinase Manufacture Supplier
Proteinase K Promega, Madison, Wisconsin, USA
Taq DNA polymerase iNtRON Biotechnology, South Korea
AluI Promega, Madison, Wisconsin, USA
XbaI Promega, Madison, Wisconsin, USA
MboI Promega, Madison, Wisconsin, USA
DNA Ladders and Commercial kit Manufacturer Supplier
100 bp molecular size marker Promega, Madison, Wisconsin, USA
1 kb molecular size marker Fermentas, Vilnius, Lithuania
Gel Extraction Kit iNtRON Biotechnology, South Korea
1% SeaKem Gold (SKG) Agarose
Seakem Gold (SKG) agarose 0.2 g
TE buffer 20.0 ml
0.2 g of SeaKem Gold Agarose powder suspended with 20 ml of TE buffer. Then, it
was boiled to dissolve completely.
118
Agarose gel (1%) for PCR
Agarose gel (Promega) 0.32 g
0.5X TBE buffer 32 ml
The agarose mixture was heated slowly until the agarose particles completely dissolved.
Then it was kept in water bath equilibrated to 55-60˚C before pour for casting the gel.
Agarose gel (1%) for PFGE
Agarose gel (Promega) 1.5 g
0.5X TBE buffer 150 ml
The agarose mixture was heated slowly until the agarose particles completely dissolved.
Then it was kept in water bath equilibrated to 55-60˚C before pour for casting the gel.
119
APPENDIX III
Media for bacteria growth
Enrichment Media
Half Fraser Broth
Fraser broth 12.9 g
Distilled water 225 ml
Half Fraser Broth Supplement
Half Fraser Supplement (SR0166E) 1 vial
Ethanol/Sterile distilled water (1:1) 4 ml
The media was autoclaved at 121˚C for 15min. It was then cooled down to 45˚C. Four
ml of sterile distilled water/ ethanol (1:1) were added to one vial of the Half Fraser
supplement (SR0166E), then the prepared supplement was mixed with the media. The
prepared media were kept in dark at the refrigeration temperature (4˚C).
Fraser Broth
Fraser broth 28.7 g
Distilled water 500 g
Fraser Broth Supplement
Half Fraser Supplement (SR0156) 1 vial
Ethanol/Sterile distilled water (1:1) 5 ml
120
The media was autoclaved at 121˚C for 15min. It was then cooled down to 45˚C. Five
ml of sterile distilled water/ ethanol (1:1) were added to one vial of Fraser selective
supplement (SR0156), then the prepared supplement was mixed with the media. The
prepared media were kept in dark at the refrigeration temperature (4˚C).
Selective Media
CHROMagarTM
Listeria
The Agar was suspended in the proportion 51.5 g/L in distilled water. The media was
then autoclaved at 121˚C for 15min. It was then cooled down in a water bath to 47±2˚C.
Nine g of CHROMagarTM
Listeria supplement was suspended in 40 ml of sterile water.
Finally, the supplement was aseptically added to CHROMagarTM
Listeria and was
mixed gently. The prepared media was dispensed into plates and were kept in dark at
the refrigeration temperature (at 4 ˚C).
Listeria Selective Agar (LSA)
Listeria Selective Agar Base 27.75 g
Distilled water 500 ml
Listeria Selective Supplement
Listeria Selective Supplement (SR0140) 1 vial
Ethanol/Sterile distilled water (1:1) 5 ml
The media was autoclaved at 121˚C for 15min. It was then cooled down to 45˚C. Five
ml of sterile distilled water/ ethanol (1:1) were added to one vial of Listeria selective
121
supplement (SR0140), and then the prepared supplement was mixed with the media.
After that the media was dispensed into plates and the plates were kept in dark at the
refrigeration temperature (4˚C).
PALCAM agar
PALCAM agar base 34.5 g
Distilled water 500 ml
PALCAM Selective Supplement
PALCAM Selective Supplement (SR150E) 1 vial
Sterile distilled water 2 ml
The media was autoclaved at 121˚C for 15min. It was then cooled down to 45˚C. Two
ml of sterile distilled water were added to one vial of PALCAM selective supplement
(SR0150), and then the prepared supplement was mixed with the media. After that the
media was dispensed into plates and the plates were kept in dark at the refrigeration
temperature (4˚C).
122
Non-selective Medium
Trypticase Soy Agar with 0.6% yeast extract agar (TSAYE):
Trypticase Soy Agar 40.0 g
Yeast Extract 6 g
Distilled water 1 L
The media was autoclaved at 121˚C for 15min. It was cooled down to 45-50˚C and was
dispensed into plates. The plates were kept at the refrigerator temperature (at 4 ˚C).
Brain Heart Infusion Agar
BHI agar 52 g
Distilled water 1 L
The suspension was gently brought to boil to dissolve completely. It was then
autoclaved at 121˚C for 15min. It was cooled down to 45-50˚C and was dispensed into
plates. The plates were kept at the refrigerator temperature (at 4˚C).
Mueller Hinton Agar
MH agar 21.0 g
Distilled water 1 L
The media was then autoclaved at 121˚C for 15min. It was cooled down to 45-50˚C and
was dispensed into plates. The plates were kept at the refrigerator temperature (at 4 ˚C).
123
APPENDIX IV
50% Glycerol
Ultra pure glycerol 50 ml
ddH2O 50 ml
The mixture was sterilized by autoclave at 121˚C for 15 min and stored at room
temperature.
0.85% Saline
NaCl 0.85 g
ddH2O 100 ml
NaCl was weighted and mixed with 100 ml of ddH2O. Next, it was sterilized by
autoclace and stored at room temperature.
Ethidium Bromide
Ethidium Bromide 30 μl
dH2O 300 ml
This solution was stored in a dark bottle at room temperature, and diluted to 0.5 μg/ml
with distilled water before used.
124
10X Tris-borated EDTA (TBE), pH 8.3
Trizma base 121.2 g
Orthoboric/Boric acid 61.8 g
EDTA 0.745 g
dH2O 1000 ml
The above ingredients were dissolved in 500 ml of deionised water by stirring on the
heated stirrer plate. pH was adjusted to 8.3 and top up to 1000 ml and autoclaved at
121˚C; 15 psi for 15 min.
0.5X Tris-borate EDTA (TBE)
10X TBE 50 ml
dH2O 950 ml
100 ml of 10X TBE was aliquoted into clean sterile glassware and top up to 1000 ml by
using the deionised water.
1M Tris, pH 8.0 (Molecular weight = 121.14 g)
Tris 36.342 g
dH2O 250 ml
36.342 g of Tris powder were dissolved in 250 ml of deionised water by stirring on the
heated stirrer plate. pH was adjusted to 8.0 and top up to 300 ml and autoclaved at
121˚C; 15 psi for 15 min.
125
0.5 M EDTA, pH 8.0 (Molecular weight = 372.24 g)
EDTA 55.83 g
dH2O 250 ml
55.83 g of EDTA powder were dissolved in 250 ml of deionised water by stirring on the
heated stirrer plate. pH was adjusted to 8.0 and top up to 300 ml and autoclaved at
121˚C; 15 psi for 15 min.
Tris-EDTA (TE) buffer (10 mM Tris; 1 mM EDTA; pH 8.0)
1M Tris, pH 8.0 10 ml
0.5M EDTA, pH 8.0 2 ml
Top up with deionised water to 1000 ml, and autoclaved 121˚C; 15 psi for 15 min.
Cell Suspension Buffer (100 mM Tris; 100 mM EDTA; pH 8.0
1M Tris, pH 8.0 10 ml
0.5M EDTA, pH 8.0 20 ml
Top up with deionised water to 100 ml
Autoclaved 121˚C; 15 psi for 15 min.
126
10% Sarcosyl (N-Lauryl-Sarcosine, Sodium Salt) (Molecular weight = 293.39 g)
Sodium N-Lauryl-Sarcosinate solution 10 ml
Top up with deionised water to 100 ml
Autoclaved 121˚C; 15 psi for 15 min.
Cell Lysis Buffer (50mM Tris; 50mM EDTA; pH 8.0; 1% Sarcosine)
1M Tris, pH 8.0 25 ml
0.5M EDTA, pH 8.0 50 ml
10% Sarcosyl (N-Lauryl-Sarcosine, Sodium Salt) 50 ml
Top up with deionised water to 500 ml
Autoclaved 121˚C; 15 psi for 15 min.
Proteinase K 20 mg/ml
Proteinase K powder 200 mg
Deionised water 10 ml
127
APPENDIX V
Biochemical Tests
Gram determination
The reaction between 3% KOH and a single colony of the bacteria is evaluated. After 60
seconds, when the loop is lifted, Gram positive bacteria (negative KOH reaction) do not
show change in viscosity of the cell suspension.
Catalase Test
A single colony is mixed with a drop of 3% hydrogen peroxide on a slide. Listeria spp.
is catalase positive so will produce immediate bubbling.
Oxidase Test
N, N, N’, N’-tetra-methyl-p-phenylenediamine dihydrochloride (≥95%) powder.
Triple Sugar Iron (TxSI)
TSI Agar 5.5 g
ddH2O 100 ml
Ten ml of the media was dispensed into each test tube. The tubes were autoclaved at
121˚C for 15 min and they were then put slant to harden.
128
Sulfur reduction – Indol – Motility (SIM) Test
SIM powder was added to distilled water as recommended by the manufacturer and was
boiled to dissolve. It was dispensed into sterile universal bottles and the bottles were
then autoclaved for 15 min at 121˚C. They were left on the bench at room temperature
to harden.
The Methyl Red (MR) and Voges-Proskauer (VP) Tests
MR-VP powder was added into distilled water following the guidelines and was boiled
to dissolve, then was dispensed into test tubes (5ml / test tube) and the tubes were
autoclaved for 15 min at 121˚C.
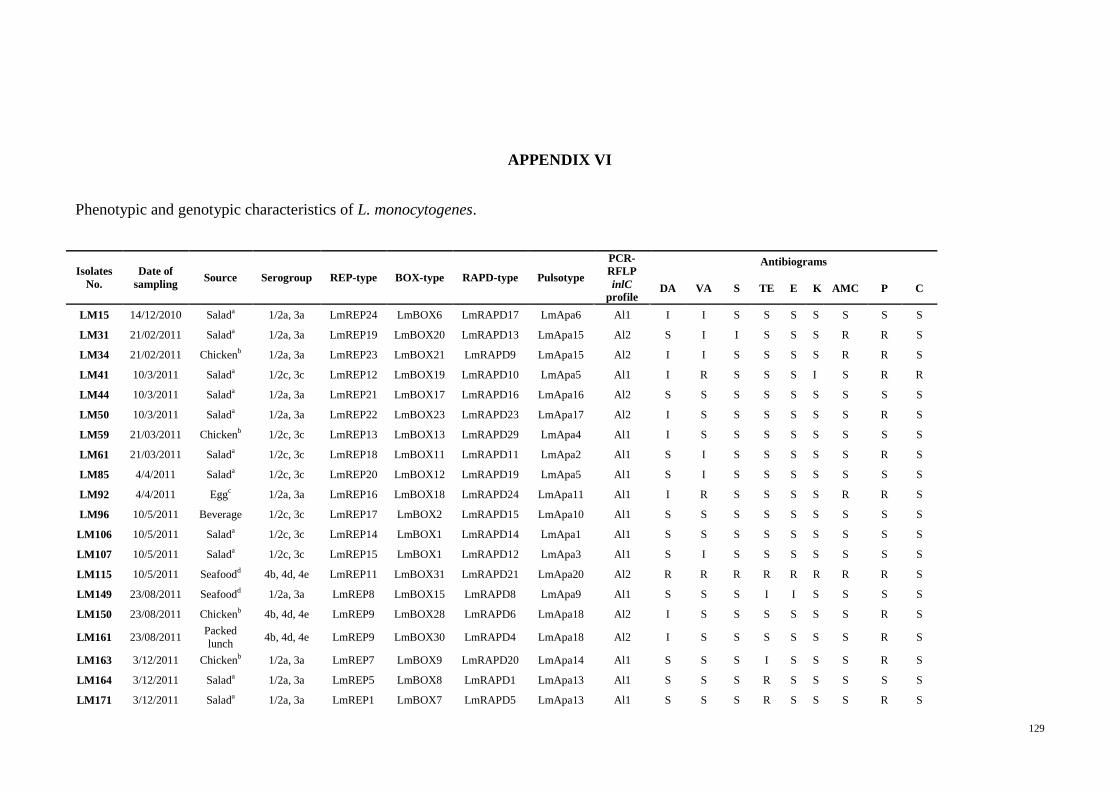
129
APPENDIX VI
Phenotypic and genotypic characteristics of L. monocytogenes.
Isolates
No.
Date of
sampling Source Serogroup REP-type BOX-type RAPD-type Pulsotype
PCR-
RFLP
inlC
profile
Antibiograms
DA VA S TE E K AMC P C
LM15 14/12/2010 Salada 1/2a, 3a LmREP24 LmBOX6 LmRAPD17 LmApa6 Al1 I I S S S S S S S
LM31 21/02/2011 Salada 1/2a, 3a LmREP19 LmBOX20 LmRAPD13 LmApa15 Al2 S I I S S S R R S
LM34 21/02/2011 Chickenb 1/2a, 3a LmREP23 LmBOX21 LmRAPD9 LmApa15 Al2 I I S S S S R R S
LM41 10/3/2011 Salada 1/2c, 3c LmREP12 LmBOX19 LmRAPD10 LmApa5 Al1 I R S S S I S R R
LM44 10/3/2011 Salada 1/2a, 3a LmREP21 LmBOX17 LmRAPD16 LmApa16 Al2 S S S S S S S S S
LM50 10/3/2011 Salada 1/2a, 3a LmREP22 LmBOX23 LmRAPD23 LmApa17 Al2 I S S S S S S R S
LM59 21/03/2011 Chickenb 1/2c, 3c LmREP13 LmBOX13 LmRAPD29 LmApa4 Al1 I S S S S S S S S
LM61 21/03/2011 Salada 1/2c, 3c LmREP18 LmBOX11 LmRAPD11 LmApa2 Al1 S I S S S S S R S
LM85 4/4/2011 Salada 1/2c, 3c LmREP20 LmBOX12 LmRAPD19 LmApa5 Al1 S I S S S S S S S
LM92 4/4/2011 Eggc 1/2a, 3a LmREP16 LmBOX18 LmRAPD24 LmApa11 Al1 I R S S S S R R S
LM96 10/5/2011 Beverage 1/2c, 3c LmREP17 LmBOX2 LmRAPD15 LmApa10 Al1 S S S S S S S S S
LM106 10/5/2011 Salada 1/2c, 3c LmREP14 LmBOX1 LmRAPD14 LmApa1 Al1 S S S S S S S S S
LM107 10/5/2011 Salada 1/2c, 3c LmREP15 LmBOX1 LmRAPD12 LmApa3 Al1 S I S S S S S S S
LM115 10/5/2011 Seafoodd 4b, 4d, 4e LmREP11 LmBOX31 LmRAPD21 LmApa20 Al2 R R R R R R R R S
LM149 23/08/2011 Seafoodd 1/2a, 3a LmREP8 LmBOX15 LmRAPD8 LmApa9 Al1 S S S I I S S S S
LM150 23/08/2011 Chickenb 4b, 4d, 4e LmREP9 LmBOX28 LmRAPD6 LmApa18 Al2 I S S S S S S R S
LM161 23/08/2011 Packed
lunch 4b, 4d, 4e LmREP9 LmBOX30 LmRAPD4 LmApa18 Al2 I S S S S S S R S
LM163 3/12/2011 Chickenb 1/2a, 3a LmREP7 LmBOX9 LmRAPD20 LmApa14 Al1 S S S I S S S R S
LM164 3/12/2011 Salada 1/2a, 3a LmREP5 LmBOX8 LmRAPD1 LmApa13 Al1 S S S R S S S S S
LM171 3/12/2011 Salada 1/2a, 3a LmREP1 LmBOX7 LmRAPD5 LmApa13 Al1 S S S R S S S R S
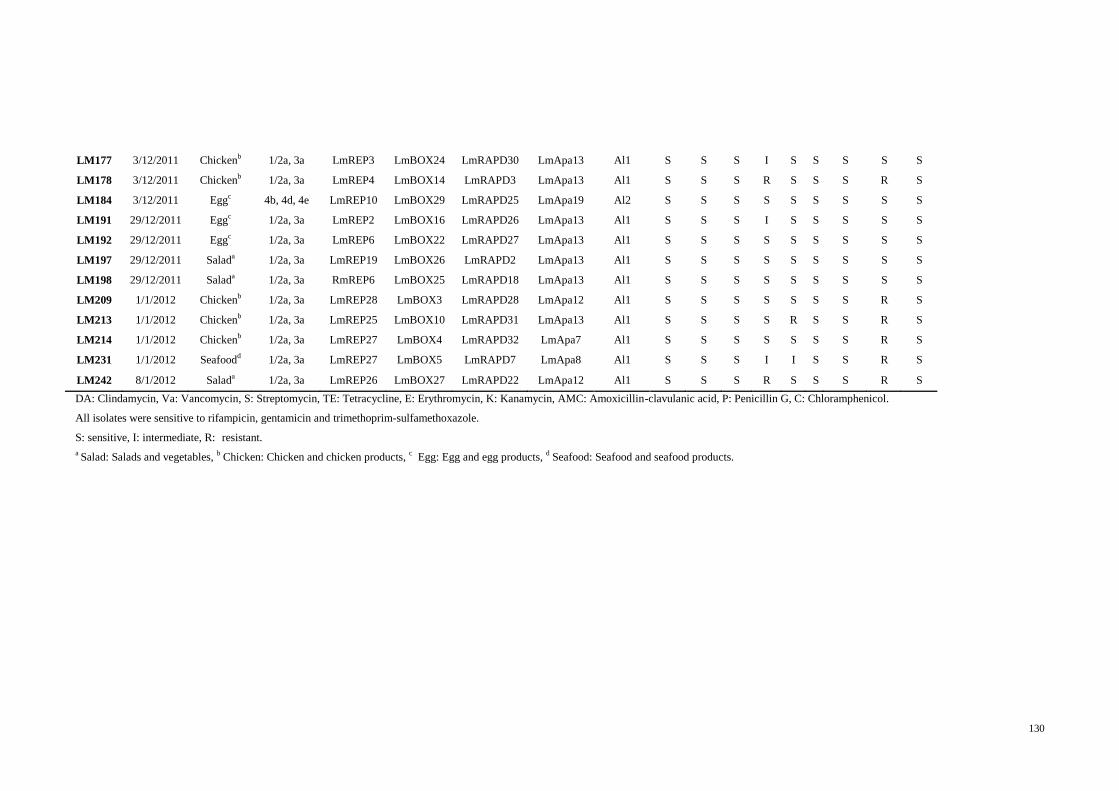
130
LM177 3/12/2011 Chickenb 1/2a, 3a LmREP3 LmBOX24 LmRAPD30 LmApa13 Al1 S S S I S S S S S
LM178 3/12/2011 Chickenb 1/2a, 3a LmREP4 LmBOX14 LmRAPD3 LmApa13 Al1 S S S R S S S R S
LM184 3/12/2011 Eggc 4b, 4d, 4e LmREP10 LmBOX29 LmRAPD25 LmApa19 Al2 S S S S S S S S S
LM191 29/12/2011 Eggc 1/2a, 3a LmREP2 LmBOX16 LmRAPD26 LmApa13 Al1 S S S I S S S S S
LM192 29/12/2011 Eggc 1/2a, 3a LmREP6 LmBOX22 LmRAPD27 LmApa13 Al1 S S S S S S S S S
LM197 29/12/2011 Salada 1/2a, 3a LmREP19 LmBOX26 LmRAPD2 LmApa13 Al1 S S S S S S S S S
LM198 29/12/2011 Salada 1/2a, 3a RmREP6 LmBOX25 LmRAPD18 LmApa13 Al1 S S S S S S S S S
LM209 1/1/2012 Chickenb 1/2a, 3a LmREP28 LmBOX3 LmRAPD28 LmApa12 Al1 S S S S S S S R S
LM213 1/1/2012 Chickenb 1/2a, 3a LmREP25 LmBOX10 LmRAPD31 LmApa13 Al1 S S S S R S S R S
LM214 1/1/2012 Chickenb 1/2a, 3a LmREP27 LmBOX4 LmRAPD32 LmApa7 Al1 S S S S S S S R S
LM231 1/1/2012 Seafoodd 1/2a, 3a LmREP27 LmBOX5 LmRAPD7 LmApa8 Al1 S S S I I S S R S
LM242 8/1/2012 Salada 1/2a, 3a LmREP26 LmBOX27 LmRAPD22 LmApa12 Al1 S S S R S S S R S
DA: Clindamycin, Va: Vancomycin, S: Streptomycin, TE: Tetracycline, E: Erythromycin, K: Kanamycin, AMC: Amoxicillin-clavulanic acid, P: Penicillin G, C: Chloramphenicol.
All isolates were sensitive to rifampicin, gentamicin and trimethoprim-sulfamethoxazole.
S: sensitive, I: intermediate, R: resistant.
a Salad: Salads and vegetables,
b Chicken: Chicken and chicken products,
c Egg: Egg and egg products,
d Seafood: Seafood and seafood products.
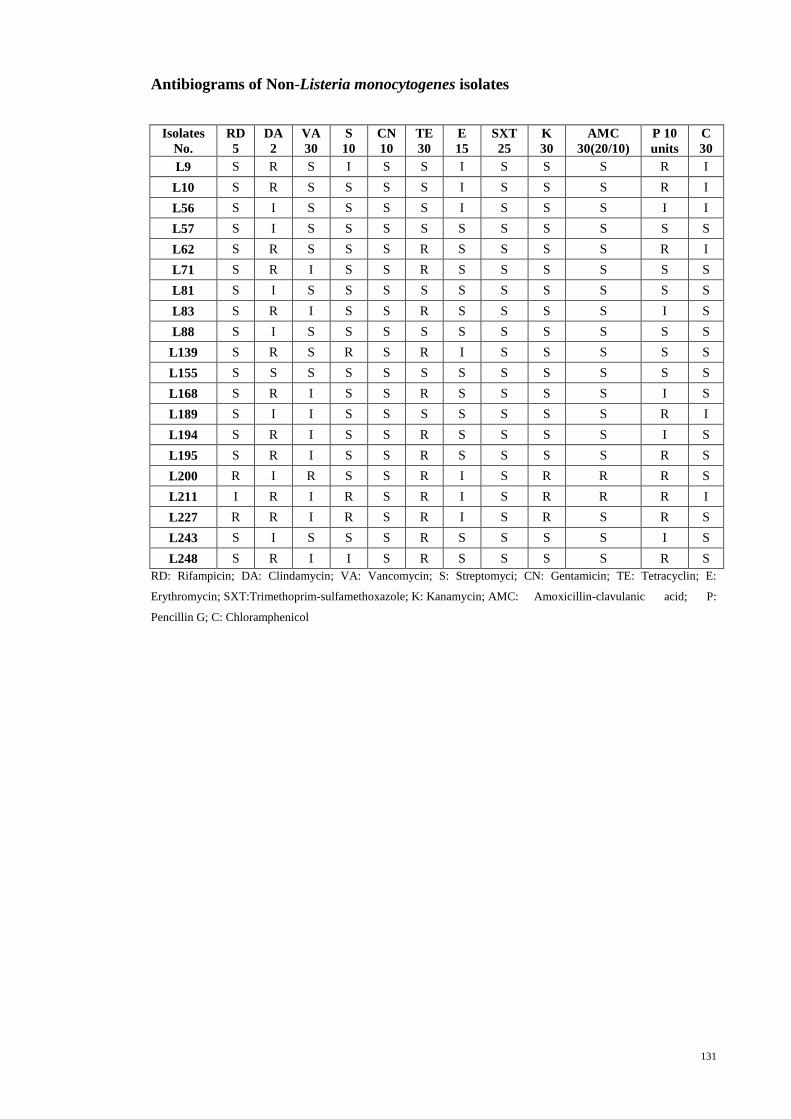
131
Antibiograms of Non-Listeria monocytogenes isolates
Isolates
No.
RD
5
DA
2
VA
30
S
10
CN
10
TE
30
E
15
SXT
25
K
30
AMC
30(20/10)
P 10
units
C
30
L9 S R S I S S I S S S R I
L10 S R S S S S I S S S R I
L56 S I S S S S I S S S I I
L57 S I S S S S S S S S S S
L62 S R S S S R S S S S R I
L71 S R I S S R S S S S S S
L81 S I S S S S S S S S S S
L83 S R I S S R S S S S I S
L88 S I S S S S S S S S S S
L139 S R S R S R I S S S S S
L155 S S S S S S S S S S S S
L168 S R I S S R S S S S I S
L189 S I I S S S S S S S R I
L194 S R I S S R S S S S I S
L195 S R I S S R S S S S R S
L200 R I R S S R I S R R R S
L211 I R I R S R I S R R R I
L227 R R I R S R I S R S R S
L243 S I S S S R S S S S I S
L248 S R I I S R S S S S R S
RD: Rifampicin; DA: Clindamycin; VA: Vancomycin; S: Streptomyci; CN: Gentamicin; TE: Tetracyclin; E:
Erythromycin; SXT:Trimethoprim-sulfamethoxazole; K: Kanamycin; AMC: Amoxicillin-clavulanic acid; P:
Pencillin G; C: Chloramphenicol
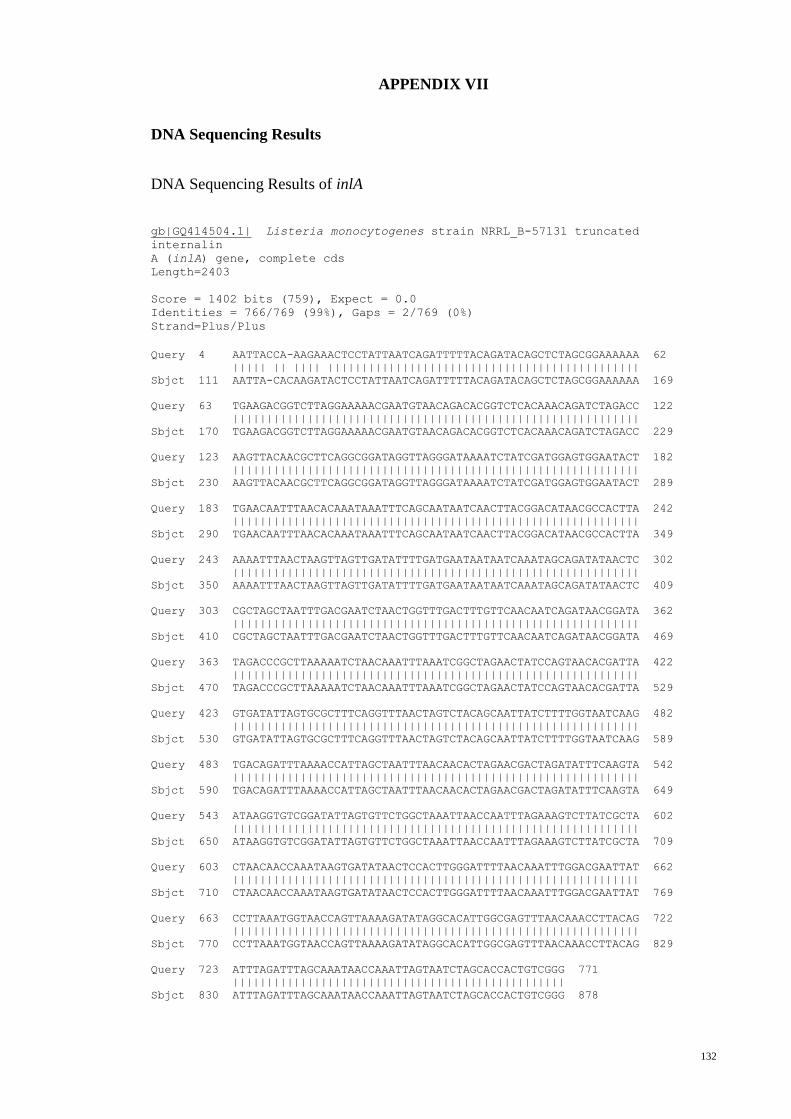
132
APPENDIX VII
DNA Sequencing Results
DNA Sequencing Results of inlA
gb|GQ414504.1| Listeria monocytogenes strain NRRL_B-57131 truncated
internalin
A (inlA) gene, complete cds
Length=2403
Score = 1402 bits (759), Expect = 0.0
Identities = 766/769 (99%), Gaps = 2/769 (0%)
Strand=Plus/Plus
Query 4 AATTACCA-AAGAAACTCCTATTAATCAGATTTTTACAGATACAGCTCTAGCGGAAAAAA 62
||||| || |||| ||||||||||||||||||||||||||||||||||||||||||||||
Sbjct 111 AATTA-CACAAGATACTCCTATTAATCAGATTTTTACAGATACAGCTCTAGCGGAAAAAA 169
Query 63 TGAAGACGGTCTTAGGAAAAACGAATGTAACAGACACGGTCTCACAAACAGATCTAGACC 122
||||||||||||||||||||||||||||||||||||||||||||||||||||||||||||
Sbjct 170 TGAAGACGGTCTTAGGAAAAACGAATGTAACAGACACGGTCTCACAAACAGATCTAGACC 229
Query 123 AAGTTACAACGCTTCAGGCGGATAGGTTAGGGATAAAATCTATCGATGGAGTGGAATACT 182
||||||||||||||||||||||||||||||||||||||||||||||||||||||||||||
Sbjct 230 AAGTTACAACGCTTCAGGCGGATAGGTTAGGGATAAAATCTATCGATGGAGTGGAATACT 289
Query 183 TGAACAATTTAACACAAATAAATTTCAGCAATAATCAACTTACGGACATAACGCCACTTA 242
||||||||||||||||||||||||||||||||||||||||||||||||||||||||||||
Sbjct 290 TGAACAATTTAACACAAATAAATTTCAGCAATAATCAACTTACGGACATAACGCCACTTA 349
Query 243 AAAATTTAACTAAGTTAGTTGATATTTTGATGAATAATAATCAAATAGCAGATATAACTC 302
||||||||||||||||||||||||||||||||||||||||||||||||||||||||||||
Sbjct 350 AAAATTTAACTAAGTTAGTTGATATTTTGATGAATAATAATCAAATAGCAGATATAACTC 409
Query 303 CGCTAGCTAATTTGACGAATCTAACTGGTTTGACTTTGTTCAACAATCAGATAACGGATA 362
||||||||||||||||||||||||||||||||||||||||||||||||||||||||||||
Sbjct 410 CGCTAGCTAATTTGACGAATCTAACTGGTTTGACTTTGTTCAACAATCAGATAACGGATA 469
Query 363 TAGACCCGCTTAAAAATCTAACAAATTTAAATCGGCTAGAACTATCCAGTAACACGATTA 422
||||||||||||||||||||||||||||||||||||||||||||||||||||||||||||
Sbjct 470 TAGACCCGCTTAAAAATCTAACAAATTTAAATCGGCTAGAACTATCCAGTAACACGATTA 529
Query 423 GTGATATTAGTGCGCTTTCAGGTTTAACTAGTCTACAGCAATTATCTTTTGGTAATCAAG 482
||||||||||||||||||||||||||||||||||||||||||||||||||||||||||||
Sbjct 530 GTGATATTAGTGCGCTTTCAGGTTTAACTAGTCTACAGCAATTATCTTTTGGTAATCAAG 589
Query 483 TGACAGATTTAAAACCATTAGCTAATTTAACAACACTAGAACGACTAGATATTTCAAGTA 542
||||||||||||||||||||||||||||||||||||||||||||||||||||||||||||
Sbjct 590 TGACAGATTTAAAACCATTAGCTAATTTAACAACACTAGAACGACTAGATATTTCAAGTA 649
Query 543 ATAAGGTGTCGGATATTAGTGTTCTGGCTAAATTAACCAATTTAGAAAGTCTTATCGCTA 602
||||||||||||||||||||||||||||||||||||||||||||||||||||||||||||
Sbjct 650 ATAAGGTGTCGGATATTAGTGTTCTGGCTAAATTAACCAATTTAGAAAGTCTTATCGCTA 709
Query 603 CTAACAACCAAATAAGTGATATAACTCCACTTGGGATTTTAACAAATTTGGACGAATTAT 662
||||||||||||||||||||||||||||||||||||||||||||||||||||||||||||
Sbjct 710 CTAACAACCAAATAAGTGATATAACTCCACTTGGGATTTTAACAAATTTGGACGAATTAT 769
Query 663 CCTTAAATGGTAACCAGTTAAAAGATATAGGCACATTGGCGAGTTTAACAAACCTTACAG 722
||||||||||||||||||||||||||||||||||||||||||||||||||||||||||||
Sbjct 770 CCTTAAATGGTAACCAGTTAAAAGATATAGGCACATTGGCGAGTTTAACAAACCTTACAG 829
Query 723 ATTTAGATTTAGCAAATAACCAAATTAGTAATCTAGCACCACTGTCGGG 771
|||||||||||||||||||||||||||||||||||||||||||||||||
Sbjct 830 ATTTAGATTTAGCAAATAACCAAATTAGTAATCTAGCACCACTGTCGGG 878
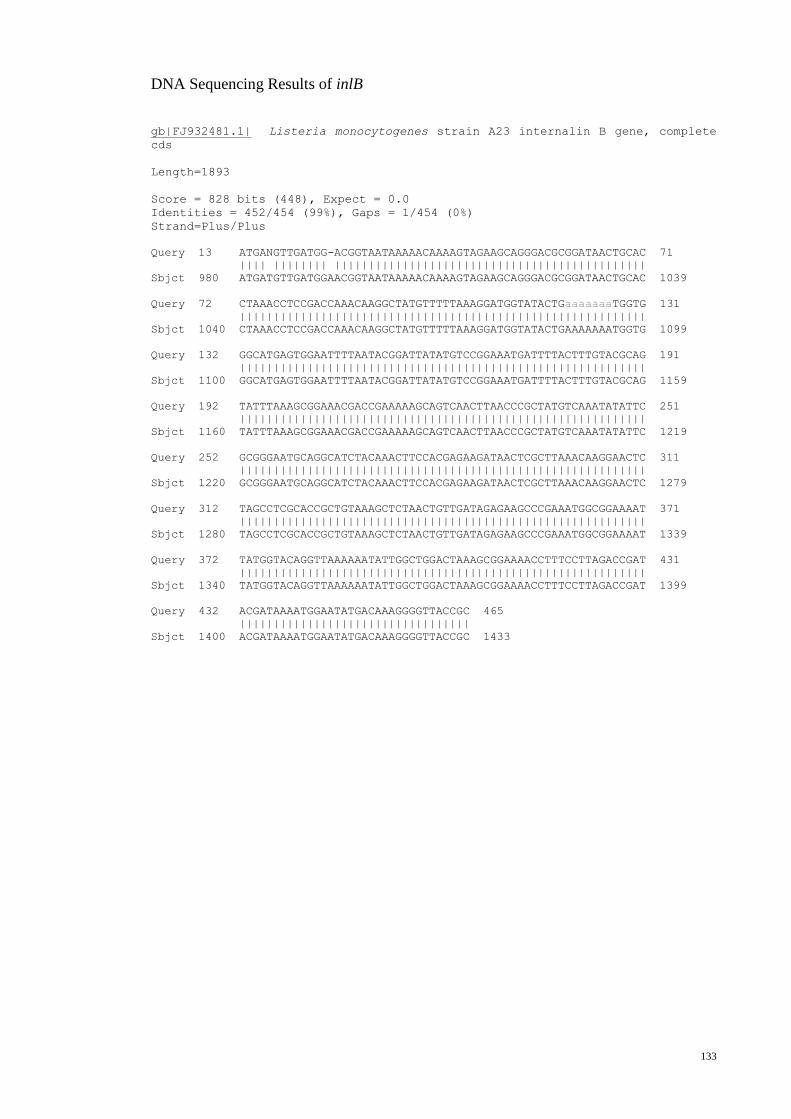
133
DNA Sequencing Results of inlB
gb|FJ932481.1| Listeria monocytogenes strain A23 internalin B gene, complete
cds
Length=1893
Score = 828 bits (448), Expect = 0.0
Identities = 452/454 (99%), Gaps = 1/454 (0%)
Strand=Plus/Plus
Query 13 ATGANGTTGATGG-ACGGTAATAAAAACAAAAGTAGAAGCAGGGACGCGGATAACTGCAC 71
|||| |||||||| ||||||||||||||||||||||||||||||||||||||||||||||
Sbjct 980 ATGATGTTGATGGAACGGTAATAAAAACAAAAGTAGAAGCAGGGACGCGGATAACTGCAC 1039
Query 72 CTAAACCTCCGACCAAACAAGGCTATGTTTTTAAAGGATGGTATACTGaaaaaaaTGGTG 131
||||||||||||||||||||||||||||||||||||||||||||||||||||||||||||
Sbjct 1040 CTAAACCTCCGACCAAACAAGGCTATGTTTTTAAAGGATGGTATACTGAAAAAAATGGTG 1099
Query 132 GGCATGAGTGGAATTTTAATACGGATTATATGTCCGGAAATGATTTTACTTTGTACGCAG 191
||||||||||||||||||||||||||||||||||||||||||||||||||||||||||||
Sbjct 1100 GGCATGAGTGGAATTTTAATACGGATTATATGTCCGGAAATGATTTTACTTTGTACGCAG 1159
Query 192 TATTTAAAGCGGAAACGACCGAAAAAGCAGTCAACTTAACCCGCTATGTCAAATATATTC 251
||||||||||||||||||||||||||||||||||||||||||||||||||||||||||||
Sbjct 1160 TATTTAAAGCGGAAACGACCGAAAAAGCAGTCAACTTAACCCGCTATGTCAAATATATTC 1219
Query 252 GCGGGAATGCAGGCATCTACAAACTTCCACGAGAAGATAACTCGCTTAAACAAGGAACTC 311
||||||||||||||||||||||||||||||||||||||||||||||||||||||||||||
Sbjct 1220 GCGGGAATGCAGGCATCTACAAACTTCCACGAGAAGATAACTCGCTTAAACAAGGAACTC 1279
Query 312 TAGCCTCGCACCGCTGTAAAGCTCTAACTGTTGATAGAGAAGCCCGAAATGGCGGAAAAT 371
||||||||||||||||||||||||||||||||||||||||||||||||||||||||||||
Sbjct 1280 TAGCCTCGCACCGCTGTAAAGCTCTAACTGTTGATAGAGAAGCCCGAAATGGCGGAAAAT 1339
Query 372 TATGGTACAGGTTAAAAAATATTGGCTGGACTAAAGCGGAAAACCTTTCCTTAGACCGAT 431
||||||||||||||||||||||||||||||||||||||||||||||||||||||||||||
Sbjct 1340 TATGGTACAGGTTAAAAAATATTGGCTGGACTAAAGCGGAAAACCTTTCCTTAGACCGAT 1399
Query 432 ACGATAAAATGGAATATGACAAAGGGGTTACCGC 465
||||||||||||||||||||||||||||||||||
Sbjct 1400 ACGATAAAATGGAATATGACAAAGGGGTTACCGC 1433
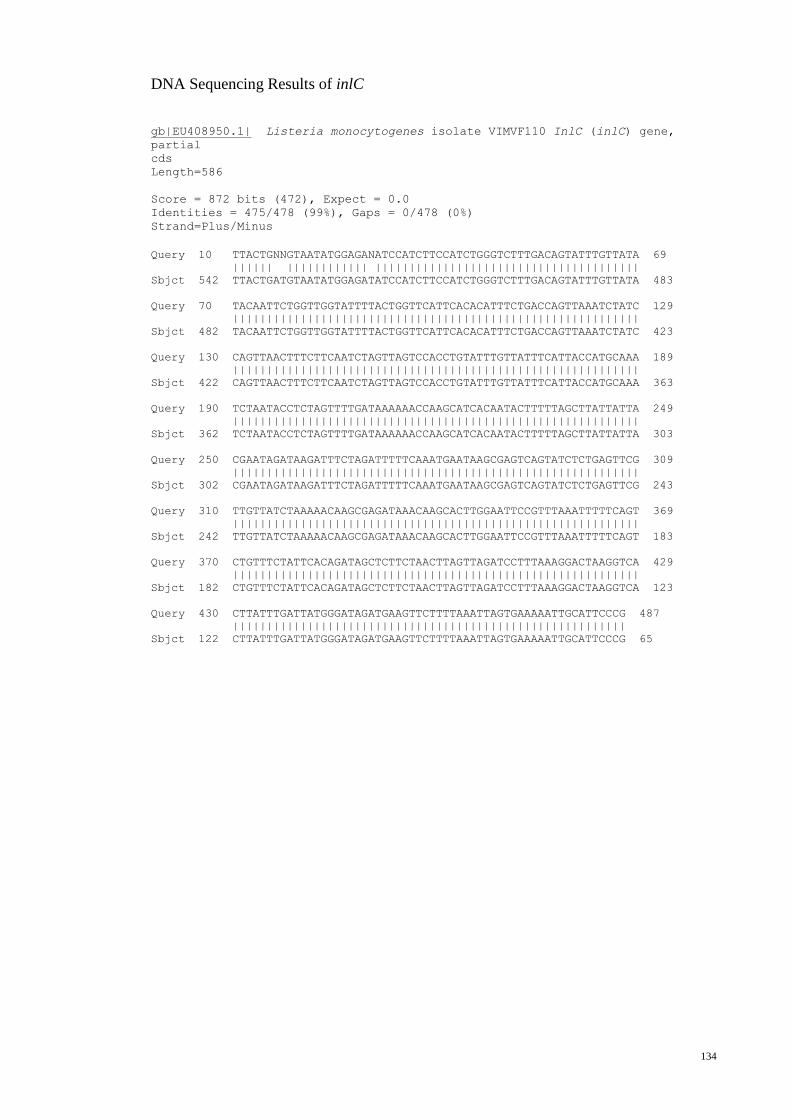
134
DNA Sequencing Results of inlC
gb|EU408950.1| Listeria monocytogenes isolate VIMVF110 InlC (inlC) gene,
partial
cds
Length=586
Score = 872 bits (472), Expect = 0.0
Identities = 475/478 (99%), Gaps = 0/478 (0%)
Strand=Plus/Minus
Query 10 TTACTGNNGTAATATGGAGANATCCATCTTCCATCTGGGTCTTTGACAGTATTTGTTATA 69
|||||| |||||||||||| |||||||||||||||||||||||||||||||||||||||
Sbjct 542 TTACTGATGTAATATGGAGATATCCATCTTCCATCTGGGTCTTTGACAGTATTTGTTATA 483
Query 70 TACAATTCTGGTTGGTATTTTACTGGTTCATTCACACATTTCTGACCAGTTAAATCTATC 129
||||||||||||||||||||||||||||||||||||||||||||||||||||||||||||
Sbjct 482 TACAATTCTGGTTGGTATTTTACTGGTTCATTCACACATTTCTGACCAGTTAAATCTATC 423
Query 130 CAGTTAACTTTCTTCAATCTAGTTAGTCCACCTGTATTTGTTATTTCATTACCATGCAAA 189
||||||||||||||||||||||||||||||||||||||||||||||||||||||||||||
Sbjct 422 CAGTTAACTTTCTTCAATCTAGTTAGTCCACCTGTATTTGTTATTTCATTACCATGCAAA 363
Query 190 TCTAATACCTCTAGTTTTGATAAAAAACCAAGCATCACAATACTTTTTAGCTTATTATTA 249
||||||||||||||||||||||||||||||||||||||||||||||||||||||||||||
Sbjct 362 TCTAATACCTCTAGTTTTGATAAAAAACCAAGCATCACAATACTTTTTAGCTTATTATTA 303
Query 250 CGAATAGATAAGATTTCTAGATTTTTCAAATGAATAAGCGAGTCAGTATCTCTGAGTTCG 309
||||||||||||||||||||||||||||||||||||||||||||||||||||||||||||
Sbjct 302 CGAATAGATAAGATTTCTAGATTTTTCAAATGAATAAGCGAGTCAGTATCTCTGAGTTCG 243
Query 310 TTGTTATCTAAAAACAAGCGAGATAAACAAGCACTTGGAATTCCGTTTAAATTTTTCAGT 369
||||||||||||||||||||||||||||||||||||||||||||||||||||||||||||
Sbjct 242 TTGTTATCTAAAAACAAGCGAGATAAACAAGCACTTGGAATTCCGTTTAAATTTTTCAGT 183
Query 370 CTGTTTCTATTCACAGATAGCTCTTCTAACTTAGTTAGATCCTTTAAAGGACTAAGGTCA 429
||||||||||||||||||||||||||||||||||||||||||||||||||||||||||||
Sbjct 182 CTGTTTCTATTCACAGATAGCTCTTCTAACTTAGTTAGATCCTTTAAAGGACTAAGGTCA 123
Query 430 CTTATTTGATTATGGGATAGATGAAGTTCTTTTAAATTAGTGAAAAATTGCATTCCCG 487
||||||||||||||||||||||||||||||||||||||||||||||||||||||||||
Sbjct 122 CTTATTTGATTATGGGATAGATGAAGTTCTTTTAAATTAGTGAAAAATTGCATTCCCG 65
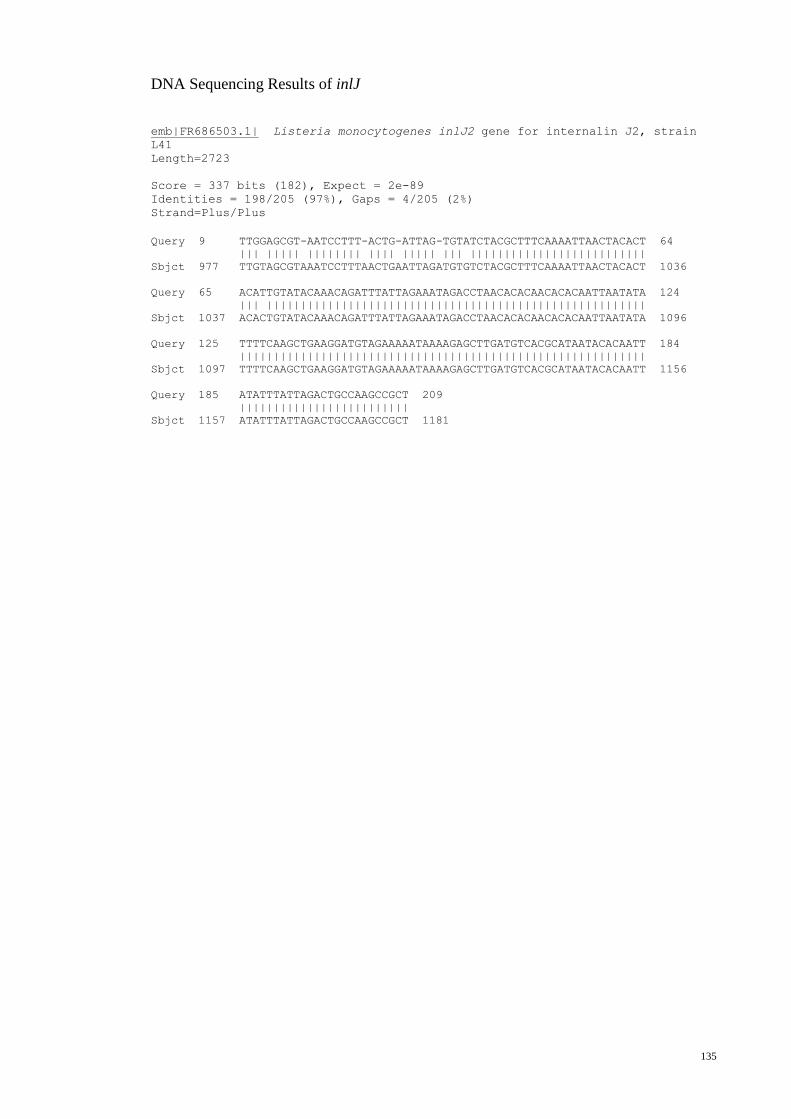
135
DNA Sequencing Results of inlJ
emb|FR686503.1| Listeria monocytogenes inlJ2 gene for internalin J2, strain
L41
Length=2723
Score = 337 bits (182), Expect = 2e-89
Identities = 198/205 (97%), Gaps = 4/205 (2%)
Strand=Plus/Plus
Query 9 TTGGAGCGT-AATCCTTT-ACTG-ATTAG-TGTATCTACGCTTTCAAAATTAACTACACT 64
||| ||||| |||||||| |||| ||||| ||| ||||||||||||||||||||||||||
Sbjct 977 TTGTAGCGTAAATCCTTTAACTGAATTAGATGTGTCTACGCTTTCAAAATTAACTACACT 1036
Query 65 ACATTGTATACAAACAGATTTATTAGAAATAGACCTAACACACAACACACAATTAATATA 124
||| ||||||||||||||||||||||||||||||||||||||||||||||||||||||||
Sbjct 1037 ACACTGTATACAAACAGATTTATTAGAAATAGACCTAACACACAACACACAATTAATATA 1096
Query 125 TTTTCAAGCTGAAGGATGTAGAAAAATAAAAGAGCTTGATGTCACGCATAATACACAATT 184
||||||||||||||||||||||||||||||||||||||||||||||||||||||||||||
Sbjct 1097 TTTTCAAGCTGAAGGATGTAGAAAAATAAAAGAGCTTGATGTCACGCATAATACACAATT 1156
Query 185 ATATTTATTAGACTGCCAAGCCGCT 209
|||||||||||||||||||||||||
Sbjct 1157 ATATTTATTAGACTGCCAAGCCGCT 1181
136
APPENDIX VIII
PUBLICATIONS
Jamali H., Chai L.C. & Thong K.L. (2013). “Detection and isolation of Listeria spp.
and Listeria monocytogenes in ready-to-eat foods with various selective culture media”.
Food Control, 32: 19-24.
Manuscript in submission:
Jamali, H., Lim, K.T. & Kwai Lin Thong. Genotypic Characterization and
Antimicrobial Resistance of Listeria monocytogenes from Ready- to- Eat Foods. Under
review.
PRESENTATIONS
Jamali H., Chai L.C. & Thong K.L. “Evaluation of different culture media for
detection of Listeria monocytogenes”. International Congress of the Malaysian
Society for Microbiology, 2011, Penang, Malaysia.
Jamali H., Chai L.C. & Thong K.L. “Listeria monocytogenes from ready-to-eat
foods sold wet markets in Malaysia”. National Postgraduate Seminar, 2012,
University of Malaya, Kuala Lumpur, Malaysia.
Jamali H., & Thong K.L. “Genetic characterization and diversity of Listeria
monocytogenes isolated from ready- to- eat foods”. Malaysia Society for Molecular
Biology & Biotechnology (MSMBB 20th), 2013, University of Malaya, Kuala
Lumpur, Malaysia.
Recommended


![TMT-Based Quantitative Proteomic Analysis of Intestinal … · 21-06-2020 · Listeria monocytogenes is a gram-positive foodborne pathogen, which can lead to . 33 . listeriosis [1]](https://img.pdfslide.us/doc/110x75/5f106ac77e708231d44901b4/tmt-based-quantitative-proteomic-analysis-of-intestinal-21-06-2020-listeria-monocytogenes.jpg)