This report highlights results from the Fall 2010 Beginning of Grade New England Common Assessment Program (NECAP) tests. The NECAP tests are administered to students in Maine, New Hampshire, Rhode Island, and Vermont as part of each state’s statewide assessment program. NECAP test results are used primarily for school improvement and accountability. Achievement level results are used in the state accountability system required under No Child Left Behind (NCLB). More detailed school and district results are used by schools to help improve curriculum and instruction. Individual student results are used to support information gathered through classroom instruction and assessments.
NECAP tests in reading and mathematics are administered to students in grades 3 through 8 and writing tests are administered to students in grades 5 and 8. The NECAP tests are designed to measure student performance on grade level expectations (GLE) developed and adopted by the four states. Specifi cally, the tests are designed to measure the content and skills that students are expected to have as they begin the school year in their current grade—in other words, the content and skills that students have learned through the end of the previous grade.
Each test contains a mix of multiple-choice and constructed-response questions. Constructed-response questions require students to develop their own answers to
questions. On the mathematics test, students may be required
to provide the correct answer to a computation
or word problem, draw or interpret a chart or graph, or explain how they solved a problem. On the reading test, students may be
required to make a list or write a few paragraphs to
answer a question related to a literary or informational
passage. On the writing test, students are required to provide
a single extended response of 1–3 pages and three shorter responses to questions measuring different types of writing.
This report contains a variety of school- and/or district-, and state-level assessment results for the NECAP tests administered at a grade level. Achievement level distributions and mean scaled scores are provided for all students tested as well as for subgroups of students classifi ed by demographics or program participation. The report also contains comparative information on school and district performance on subtopics within each content area tested.
In addition to this report of grade level results, schools and districts will also receive Summary Reports, Item Analysis Reports, Released Item support materials, and student-level data fi les containing NECAP results. Together, these reports and data constitute a rich source of information to support local decisions in curriculum, instruction, assessment, and professional development. Over time, this information can also strengthen schools’ and districts’ evaluation of their ongoing improvement efforts.
About The New England Common Assessment Program
Fall 2010Beginning of Grade 6
NECAP Tests
Grade 6 Students in 2010-2011
State Results
State: Rhode Island
Grade Level Summary Report
Fall 2010 - Beginning of Grade 6 NECAP TestsGrade 6 Students in 2010-2011
State:
Rhode Island
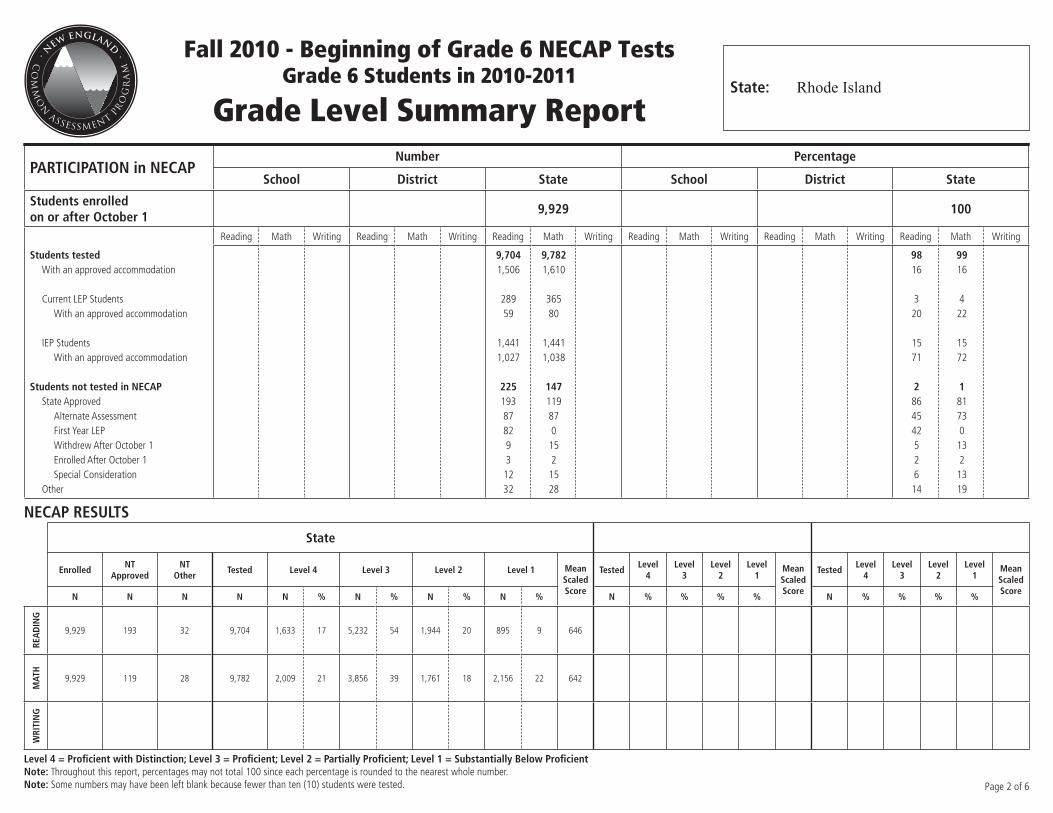
PARTICIPATION in NECAPNumber Percentage
School District State School District State
Students enrolled on or after October 1
9,929 100
Students testedWith an approved accommodation
Current LEP StudentsWith an approved accommodation
IEP StudentsWith an approved accommodation
Students not tested in NECAPState Approved
Alternate AssessmentFirst Year LEPWithdrew After October 1Enrolled After October 1Special Consideration
Other
Reading Math Writing Reading Math Writing Reading Math Writing Reading Math Writing Reading Math Writing Reading Math Writing
9,704 9,782 98 991,506 1,610 16 16
289 365 3 459 80 20 22
1,441 1,441 15 151,027 1,038 71 72
225 147 2 1193 119 86 8187 87 45 7382 0 42 09 15 5 133 2 2 2
12 15 6 1332 28 14 19
Level 4 = Profi cient with Distinction; Level 3 = Profi cient; Level 2 = Partially Profi cient; Level 1 = Substantially Below Profi cient Note: Throughout this report, percentages may not total 100 since each percentage is rounded to the nearest whole number.Note: Some numbers may have been left blank because fewer than ten (10) students were tested.
State
Enrolled NT
Approved NT
Other Tested Level 4 Level 3 Level 2 Level 1 Mean
ScaledScore
TestedLevel
4Level
3Level
2Level
1MeanScaledScore
TestedLevel
4Level
3Level
2Level
1MeanScaledScore
N N N N N % N % N % N % N % % % % N % % % %
REA
DIN
G
9,929 193 32 9,704 1,633 17 5,232 54 1,944 20 895 9 646
MAT
H
9,929 119 28 9,782 2,009 21 3,856 39 1,761 18 2,156 22 642
WRI
TIN
G
NECAP RESULTS
Page 2 of 6
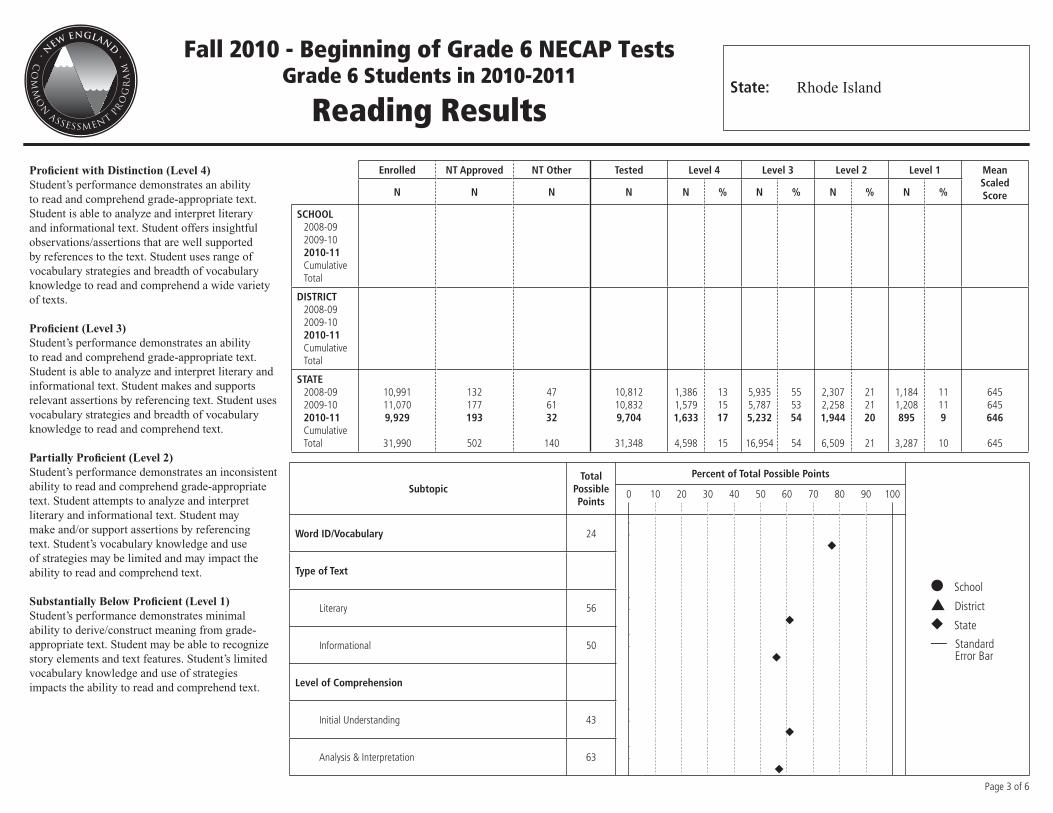
Reading Results
SubtopicTotal
Possible Points
Percent of Total Possible Points
● School
▲ District
◆ State
— Standard Error Bar
0 10 20 30 40 50 60 70 80 90 100
Word ID/Vocabulary 24
Type of Text
Literary 56
Informational 50
Level of Comprehension
Initial Understanding 43
Analysis & Interpretation 63
◆
Profi cient with Distinction (Level 4)Student’s performance demonstrates an ability to read and comprehend grade-appropriate text. Student is able to analyze and interpret literary and informational text. Student offers insightful observations/assertions that are well supported by references to the text. Student uses range of vocabulary strategies and breadth of vocabulary knowledge to read and comprehend a wide variety of texts.
Profi cient (Level 3)Student’s performance demonstrates an ability to read and comprehend grade-appropriate text. Student is able to analyze and interpret literary and informational text. Student makes and supports relevant assertions by referencing text. Student uses vocabulary strategies and breadth of vocabulary knowledge to read and comprehend text.
Partially Profi cient (Level 2)Student’s performance demonstrates an inconsistent ability to read and comprehend grade-appropriate text. Student attempts to analyze and interpret literary and informational text. Student may make and/or support assertions by referencing text. Student’s vocabulary knowledge and use of strategies may be limited and may impact the ability to read and comprehend text.
Substantially Below Profi cient (Level 1)Student’s performance demonstrates minimal ability to derive/construct meaning from grade-appropriate text. Student may be able to recognize story elements and text features. Student’s limited vocabulary knowledge and use of strategies impacts the ability to read and comprehend text.
◆
◆
◆
◆
State:
Rhode Island
Fall 2010 - Beginning of Grade 6 NECAP TestsGrade 6 Students in 2010-2011
Page 3 of 6
Enrolled NT Approved NT Other Tested Level 4 Level 3 Level 2 Level 1 Mean Scaled ScoreN N N N N % N % N % N %
SCHOOL2008-092009-102010-11CumulativeTotal
DISTRICT2008-092009-102010-11CumulativeTotal
STATE2008-092009-102010-11CumulativeTotal
10,99111,0709,929
31,990
132177193
502
476132
140
10,81210,8329,704
31,348
1,3861,5791,633
4,598
131517
15
5,9355,7875,232
16,954
555354
54
2,3072,2581,944
6,509
212120
21
1,1841,208895
3,287
11119
10
645645646
645
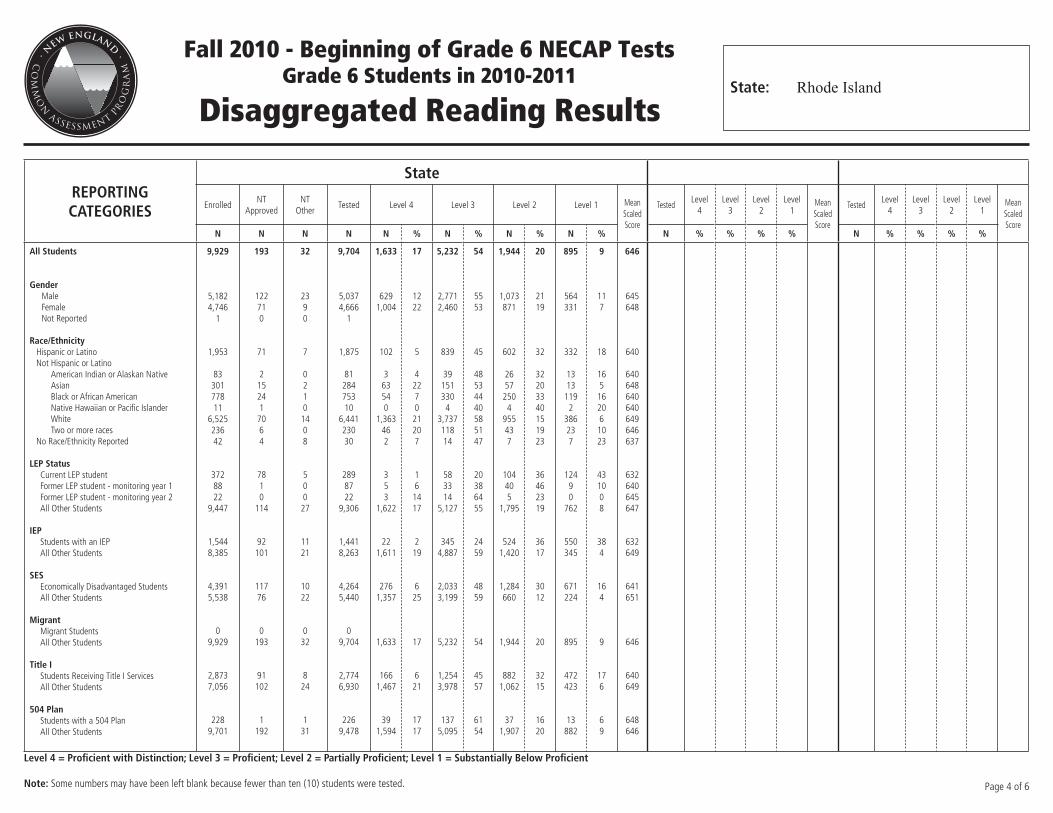
Disaggregated Reading Results
REPORTING CATEGORIES
State
EnrolledNT
ApprovedNT
OtherTested Level 4 Level 3 Level 2 Level 1 Mean
ScaledScore
TestedLevel
4Level
3Level
2Level
1MeanScaledScore
TestedLevel
4Level
3Level
2Level
1MeanScaledScore
N N N N N % N % N % N % N % % % % N % % % %
All Students
GenderMaleFemaleNot Reported
Race/EthnicityHispanic or LatinoNot Hispanic or Latino
American Indian or Alaskan NativeAsianBlack or African AmericanNative Hawaiian or Pacifi c Islander WhiteTwo or more races
No Race/Ethnicity Reported
LEP StatusCurrent LEP studentFormer LEP student - monitoring year 1Former LEP student - monitoring year 2All Other Students
IEPStudents with an IEPAll Other Students
SESEconomically Disadvantaged StudentsAll Other Students
MigrantMigrant StudentsAll Other Students
Title IStudents Receiving Title I ServicesAll Other Students
504 PlanStudents with a 504 PlanAll Other Students
9,929
5,1824,746
1
1,953
8330177811
6,52523642
3728822
9,447
1,5448,385
4,3915,538
09,929
2,8737,056
2289,701
193
122710
71
2152417064
7810
114
92101
11776
0193
91102
1192
32
2390
7
0210
1408
500
27
1121
1022
032
824
131
9,704
5,0374,666
1
1,875
8128475310
6,44123030
2898722
9,306
1,4418,263
4,2645,440
09,704
2,7746,930
2269,478
1,633
6291,004
102
363540
1,363462
353
1,622
221,611
2761,357
1,633
1661,467
391,594
17
1222
5
42270
21207
16
1417
219
625
17
621
1717
5,232
2,7712,460
839
391513304
3,73711814
583314
5,127
3454,887
2,0333,199
5,232
1,2543,978
1375,095
54
5553
45
48534440585147
20386455
2459
4859
54
4557
6154
1,944
1,073871
602
2657
2504
955437
104405
1,795
5241,420
1,284660
1,944
8821,062
371,907
20
2119
32
32203340151923
36462319
3617
3012
20
3215
1620
895
564331
332
13131192
386237
12490
762
550345
671224
895
472423
13882
9
117
18
165
16206
1023
431008
384
164
9
176
69
646
645648
640
640648640640649646637
632640645647
632649
641651
646
640649
648646
Page 4 of 6
State:
Rhode Island
Fall 2010 - Beginning of Grade 6 NECAP TestsGrade 6 Students in 2010-2011
Level 4 = Profi cient with Distinction; Level 3 = Profi cient; Level 2 = Partially Profi cient; Level 1 = Substantially Below Profi cient
Note: Some numbers may have been left blank because fewer than ten (10) students were tested.
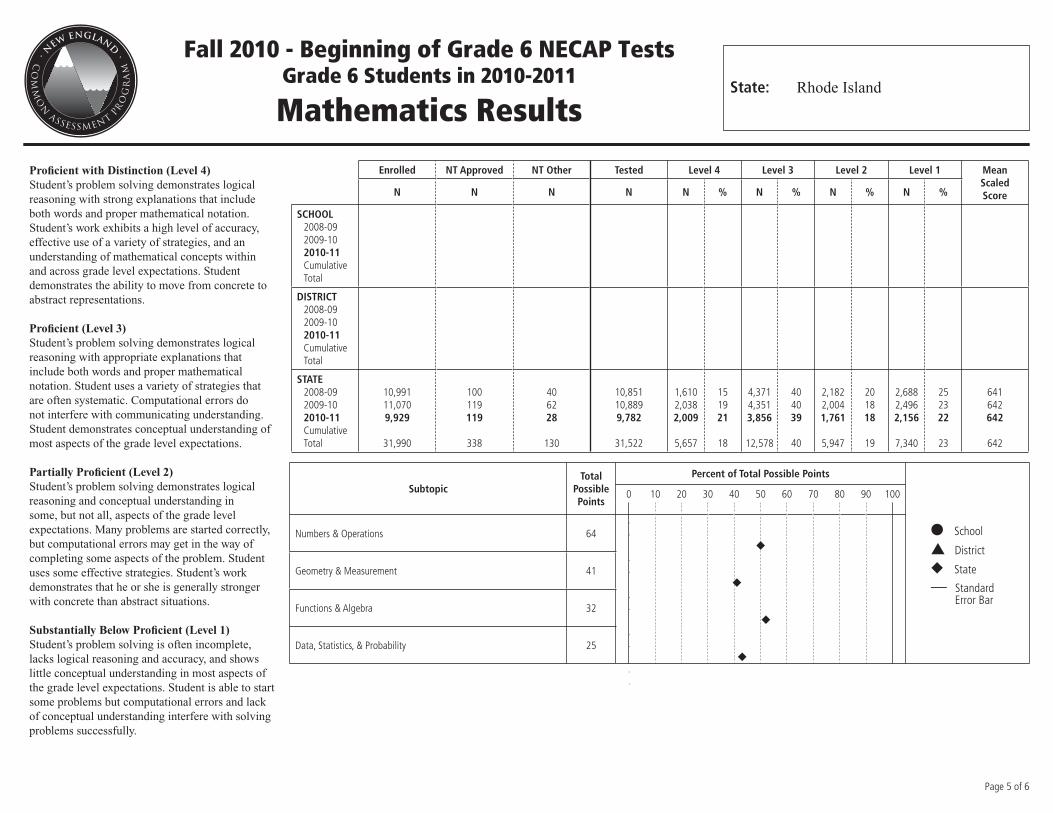
Mathematics Results
Page 5 of 6
Fall 2010 - Beginning of Grade 6 NECAP TestsGrade 6 Students in 2010-2011
SubtopicTotal
Possible Points
Percent of Total Possible Points
● School
▲ District
◆ State
— Standard Error Bar
0 10 20 30 40 50 60 70 80 90 100
Numbers & Operations 64
Geometry & Measurement 41
Functions & Algebra 32
Data, Statistics, & Probability 25
◆
◆
◆
◆
Profi cient with Distinction (Level 4)Student’s problem solving demonstrates logical reasoning with strong explanations that include both words and proper mathematical notation. Student’s work exhibits a high level of accuracy, effective use of a variety of strategies, and an understanding of mathematical concepts within and across grade level expectations. Student demonstrates the ability to move from concrete to abstract representations.
Profi cient (Level 3)Student’s problem solving demonstrates logical reasoning with appropriate explanations that include both words and proper mathematical notation. Student uses a variety of strategies that are often systematic. Computational errors do not interfere with communicating understanding. Student demonstrates conceptual understanding of most aspects of the grade level expectations.
Partially Profi cient (Level 2)Student’s problem solving demonstrates logical reasoning and conceptual understanding in some, but not all, aspects of the grade level expectations. Many problems are started correctly, but computational errors may get in the way of completing some aspects of the problem. Student uses some effective strategies. Student’s work demonstrates that he or she is generally stronger with concrete than abstract situations.
Substantially Below Profi cient (Level 1)Student’s problem solving is often incomplete, lacks logical reasoning and accuracy, and shows little conceptual understanding in most aspects of the grade level expectations. Student is able to start some problems but computational errors and lack of conceptual understanding interfere with solving problems successfully.
State:
Rhode Island
Enrolled NT Approved NT Other Tested Level 4 Level 3 Level 2 Level 1 Mean Scaled ScoreN N N N N % N % N % N %
SCHOOL2008-092009-102010-11CumulativeTotal
DISTRICT2008-092009-102010-11CumulativeTotal
STATE2008-092009-102010-11CumulativeTotal
10,99111,0709,929
31,990
100119119
338
406228
130
10,85110,8899,782
31,522
1,6102,0382,009
5,657
151921
18
4,3714,3513,856
12,578
404039
40
2,1822,0041,761
5,947
201818
19
2,6882,4962,156
7,340
252322
23
641642642
642
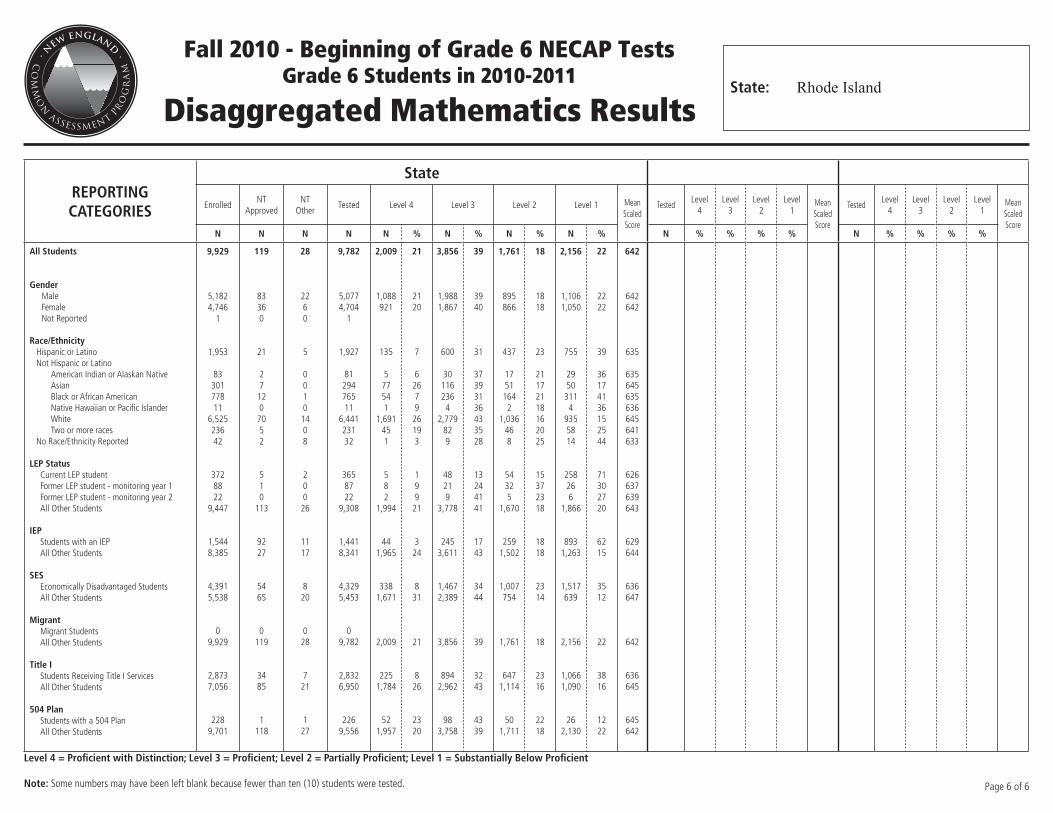
Disaggregated Mathematics Results
REPORTING CATEGORIES
State
EnrolledNT
ApprovedNT
OtherTested Level 4 Level 3 Level 2 Level 1 Mean
ScaledScore
TestedLevel
4Level
3Level
2Level
1MeanScaledScore
TestedLevel
4Level
3Level
2Level
1MeanScaledScore
N N N N N % N % N % N % N % % % % N % % % %
All Students
GenderMaleFemaleNot Reported
Race/EthnicityHispanic or LatinoNot Hispanic or Latino
American Indian or Alaskan NativeAsianBlack or African AmericanNative Hawaiian or Pacifi c Islander WhiteTwo or more races
No Race/Ethnicity Reported
LEP StatusCurrent LEP studentFormer LEP student - monitoring year 1Former LEP student - monitoring year 2All Other Students
IEPStudents with an IEPAll Other Students
SESEconomically Disadvantaged StudentsAll Other Students
MigrantMigrant StudentsAll Other Students
Title IStudents Receiving Title I ServicesAll Other Students
504 PlanStudents with a 504 PlanAll Other Students
9,929
5,1824,746
1
1,953
8330177811
6,52523642
3728822
9,447
1,5448,385
4,3915,538
09,929
2,8737,056
2289,701
119
83360
21
271207052
510
113
9227
5465
0119
3485
1118
28
2260
5
0010
1408
200
26
1117
820
028
721
127
9,782
5,0774,704
1
1,927
8129476511
6,44123132
3658722
9,308
1,4418,341
4,3295,453
09,782
2,8326,950
2269,556
2,009
1,088921
135
577541
1,691451
582
1,994
441,965
3381,671
2,009
2251,784
521,957
21
2120
7
62679
26193
199
21
324
831
21
826
2320
3,856
1,9881,867
600
301162364
2,779829
48219
3,778
2453,611
1,4672,389
3,856
8942,962
983,758
39
3940
31
37393136433528
13244141
1743
3444
39
3243
4339
1,761
895866
437
1751
1642
1,036468
54325
1,670
2591,502
1,007754
1,761
6471,114
501,711
18
1818
23
21172118162025
15372318
1818
2314
18
2316
2218
2,156
1,1061,050
755
29503114
9355814
258266
1,866
8931,263
1,517639
2,156
1,0661,090
262,130
22
2222
39
36174136152544
71302720
6215
3512
22
3816
1222
642
642642
635
635645635636645641633
626637639643
629644
636647
642
636645
645642
Page 6 of 6
State:
Rhode Island
Fall 2010 - Beginning of Grade 6 NECAP TestsGrade 6 Students in 2010-2011
Level 4 = Profi cient with Distinction; Level 3 = Profi cient; Level 2 = Partially Profi cient; Level 1 = Substantially Below Profi cient
Note: Some numbers may have been left blank because fewer than ten (10) students were tested.
Recommended