Ability of firms to adjust to higher energy
costs
Non-confidential Executive Summary
31 October 2011

4th Floor, South Office Tower, Hatfield Plaza, 1122 Burnett Street, Hatfield, Pretoria, 0083, South Africa
PO Box 95838, Waterkloof, 0145, South Africa
Tel +27 (0)12 362 0025 | Fax +27 (0)12 362 0210 | Email [email protected] | www.dnaeconomics.com
Company Registration: 2001/023453/07│Directors: Elias Masilela, Matthew Stern, Trurman Zuma
ACKNOWLEDGEMENTS
This non-confidential executive summary is based on a report commissioned by the National Treasury. We
would like to express our appreciation to the National Treasury for the advice and assistance provided over
the course of this study. In particular, we would like to thank Konstantin Makrelov and Witness Simbanegavi
for their extensive feedback and support, and Frank Flatters, Rob Davies, David Faulkner and Cecil Morden
for additional input. The study team also would like to thank Business Unity South Africa and Dr Laurraine
Lotter for input and facilitating contact with the firms surveyed as part of the study, and TNS Research
Surveys for conducting the surveys. Finally, we would like to thank the representatives of the firms that
participated in the study for their time and insights.
AUTHORS
DNA Economics: Brent Cloete, Stephen Chisadza and Yash Ramkolowan
The Green House: Brett Cohen, Kyle Mason-Jones and Cornelia Ras

Report Prepared for the National Treasury
Non-confidential Executive Summary: Ability of Firms to Adjust to Higher Energy Costs
i
EXECUTIVE SUMMARY
The South African economy is one of the most carbon-intensive in the world. In order to maintain economic
competitiveness in an increasingly carbon-constrained global environment, the South African Government is
in the process of initiating various measures to support the country’s transition to a lower-carbon economy.
This includes putting in place energy efficiency plans and providing incentives for investment in clean energy;
adjusting electricity tariffs to reflect the true cost of generation; and committing to the use of regulatory and
economic instruments to stabilise greenhouse gas emissions over the medium-to long-term. Together, these
initiatives have and will continue to contribute to rising absolute levels and a changing structure of energy
costs.
The impact of South Africa’s energy efficiency and climate change mitigation plans – in aggregate and
differentially across firms and sectors – will depend largely upon the ability of South African firms, the
dominant users of energy (and in particular electricity), to increase their energy efficiency through changes in
production methods, output mixes and investments in new technologies and processes. At present, little is
known of the past and likely response of business in South Africa to higher energy costs.1 This information
asymmetry makes policy planning, implementation and evaluation difficult.
The main purpose of this study is to fill some of these gaps to enable government to make better-informed
policy decisions. The information on which this report is based was gathered through a combination of
desktop research, a firm-level survey and face-to-face interviews with selected companies. The survey was
restricted to 32 large firms and nine case studies were prepared based on the company interviews.2 The
report focuses on the behaviour of these firms before and after the major electricity price increases that
followed the local energy crisis in 2007-2008.3 Firms were also asked about their plans for the period up to
2020.
The main findings from the survey and the case studies are summarised below.
1 The ways in which firms adapt to higher energy costs involve consideration of short and long-term strategic options, their
own circumstances (age of existing equipment, availability and cost of finance, market forecasts, competition in local and international markets, etc), expectations and uncertainties about the future path of electricity prices, security of supply, future regulatory and fiscal environments, etc. In light of all these varied considerations, firms are likely to vary widely in the types and timing of their response to increased energy prices. 2 33 firms provided questionnaires. 32 questionnaires were sufficiently detailed to be included in the overall sample
analysed. Because of confidentiality requirements, three of these questionnaires could not be used for sub-sector level analysis. Nine of the firms that submitted questionnaires formed the basis of detailed case studies. While an attempt was made to include a range of sectors in the analysis, the bulk of respondents were large industrial or mining firms. A number of firms declined to participate in the study. It is possible that this could have led to a selection bias in the analysis if firms that participated were more proactive in adapting to rising energy prices than firms that did not. But it is not possible to know whether this (or the opposite) is the case. 3 The study period coincides with a period of relatively subdued economic activity globally, and electricity rationing was
implemented during and following the local energy crisis. This impacted energy use since some firms operated at below full capacity.

Report Prepared for the National Treasury
Non-confidential Executive Summary: Ability of Firms to Adjust to Higher Energy Costs
ii
Overview of importance and structure of energy costs
South African sectors differ widely in energy intensities. Service industries are much less energy intensive
than manufacturing and mining. However, most of the 15 sectors surveyed experienced an increase in
energy costs as a percentage of operational costs from 2007 to 2010. Nine sectors experienced increases of
more than 25% from 2007 to 2010, and four had increases in excess of 40%. Only three sectors managed to
reduce their energy costs as a percentage of operating costs over this period.4
Grid electricity accounts for the largest share of overall energy costs in most sectors. In a number of sectors,
however, coal also constitutes a significant cost. When the cost of coal used as a process input (rather than
an energy source) is included, coal costs outweigh electricity expenditures in sectors like ferro-alloys, iron and
steel, and petrochemicals. On average the cost of electricity has risen faster than that of other energy carriers
from 2007 to 2010, though the actual increase incurred by firms varies significantly. The largest increase in
average unit costs of electricity5 (166%) was experienced by sectors purchasing electricity from a municipality,
while the smallest increase (31%) was experienced by sectors purchasing electricity directly from Eskom. In
those sectors where electricity was purchased from both Eskom and municipalities, the price of electricity
sourced from municipalities increased faster than that sourced from Eskom. However, in just one of these
sectors was the difference in average unit cost increases larger than 10 percentage points.
Mitigating rising energy costs
The study covers a relatively short adjustment period (after the recent energy crisis) and many of the
adaptation options available to firms take time to implement. A number of sectors also use coal as a
significant process input. It is typically much more difficult to reduce the amount of coal used as a process
input than coal used as an energy source since the latter is impacted by energy efficiency activities while the
former is not. However, the survey indicates that firms in all sectors have already undertaken a wide variety of
measures to conserve on energy uses in response to rising prices and security of supply concerns. Some
have reported significant new investments to achieve this. The number of mitigation options implemented for
the first time in the areas of energy efficiency, renewable energy and fuel switching all increased significantly
in the period 2008-2010 compared to 2005-2007. However, firms are at different stages of rolling out energy
efficiency technologies, with some relatively further advanced than others. A number of firms are planning to
implement certain energy efficiency options for the first time in the period 2011-2015. As a result of differences
in cost structures and patterns of investments6, however, it is to be expected that firms in different (and even
the same) industry will not all adapt to rising energy prices at the same pace.
4 Energy carriers other than electricity, which on average experienced lower price increases over the study period,
contributed a significant portion of the energy costs of both sectors that reduced their energy intensity. The sector for which energy intensity remained constant both invested significantly in energy efficiency measures and experienced a structural change to the composition of its energy costs as a result of changing operations. 5 The actual price paid for electricity in a sector. This cost varies between sectors because of differing tariff plans, penalties,
volumes of electricity used, usage patterns, etc. Firms with long-term supply agreements were not included in this analysis. 6 Reason for differing cost structures include differences in plant designs, age and size, and raw material inputs and
product portfolios.

Report Prepared for the National Treasury
Non-confidential Executive Summary: Ability of Firms to Adjust to Higher Energy Costs
iii
Energy efficiency
The study assesses energy efficiency investments made by firms against a range of available options, and
documents the reasons why firms did not implement certain options. All sectors and firms7 surveyed have
implemented or investigated a wide range of energy savings. With the possible exception of the iron and steel
sector, very few of the available options in each sector were not considered. Moreover, the case study
interviews reveal that many additional energy efficiency interventions are integrated into the firms’ day-to-day
operational expenditures, and are not reported as investments. The total value of energy efficiency investment
reported in the survey is therefore likely to underestimate the actual amount of funds committed to energy
efficiency projects.
The cost of implementing energy efficiency projects (investment cost in relation to energy savings) was found
to vary significantly – from R177 to R7 992 per MWh saved per annum – both between and within sectors.
Figure 1 Energy efficiency investments and energy savings over time
Cost considerations were found to have been the primary driver of energy efficiency investments, with
sustainability concerns being an important supporting factor. Security of supply was the third most prevalent
reason put forward for engaging in energy efficiency activities.8
7 There was only one firm that had not implemented a range of options. That firm had, however, registered CDM projects.
8 There is some ambiguity in these answers, since the issue of cost and security supply are interlinked during energy
shortages (price is often used as a way of rationing electricity).
-
1 000
2 000
3 000
4 000
5 000
6 000
7 000
8 000
0
500
1 000
1 500
2 000
2 500
3 000
3 500
2005-2007 2008-2010 2011-2015
Ra
nd
millio
ns
MW
h t
ho
us
an
ds
Electricity savings per annum Other energy savings per annum
Investment - Secondary axis

Report Prepared for the National Treasury
Non-confidential Executive Summary: Ability of Firms to Adjust to Higher Energy Costs
iv
Figure 2 Energy efficiency drivers
Renewable energy
While the number of energy efficiency options implemented for the first time is expected to decline in 2011-
2015 relative to 2008-2010, and the number of fuel switching options implemented for the first time is not
expected to change much, firms anticipate a sharp increase in the number of renewable energy projects to be
implemented for the first time in 2011-2015. Moreover, the renewable energy technologies considered (2011-
2015) and implemented (2008-2010) span an increasingly diverse range of options.
Figure 3 Investment in renewable energy and energy generated by period
-
200
400
600
800
1 000
1 200
1 400
1 600
-
1 000
2 000
3 000
4 000
5 000
6 000
7 000
8 000
9 000
2005-2007 2008-2010 2011-2015
Ra
nd
millio
ns
MW
h t
ho
us
an
ds
Other energy generated p.a Electricity generated p.a.
Investment - Secondary axis
0
5
10
15
20
25
30
35
Efficiency/cost reduction
Sustainability concerns
Energy security Escalating energy costs
SA energy savings/legal compliance
Nu
mb
er
of
res
po
ns
es
First reason Second reason Third reason
Report Prepared for the National Treasury
Non-confidential Executive Summary: Ability of Firms to Adjust to Higher Energy Costs
v
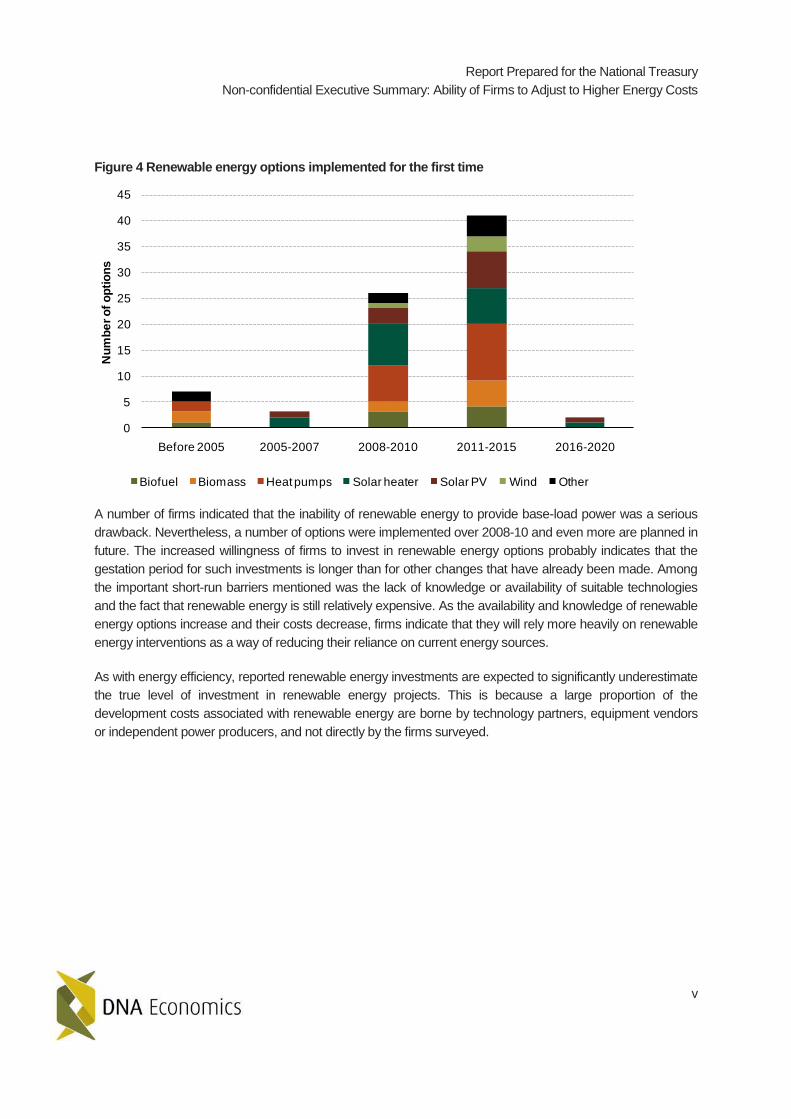
Figure 4 Renewable energy options implemented for the first time
A number of firms indicated that the inability of renewable energy to provide base-load power was a serious
drawback. Nevertheless, a number of options were implemented over 2008-10 and even more are planned in
future. The increased willingness of firms to invest in renewable energy options probably indicates that the
gestation period for such investments is longer than for other changes that have already been made. Among
the important short-run barriers mentioned was the lack of knowledge or availability of suitable technologies
and the fact that renewable energy is still relatively expensive. As the availability and knowledge of renewable
energy options increase and their costs decrease, firms indicate that they will rely more heavily on renewable
energy interventions as a way of reducing their reliance on current energy sources.
As with energy efficiency, reported renewable energy investments are expected to significantly underestimate
the true level of investment in renewable energy projects. This is because a large proportion of the
development costs associated with renewable energy are borne by technology partners, equipment vendors
or independent power producers, and not directly by the firms surveyed.
0
5
10
15
20
25
30
35
40
45
Before 2005 2005-2007 2008-2010 2011-2015 2016-2020
Nu
mb
er
of
op
tio
ns
Biofuel Biomass Heat pumps Solar heater Solar PV Wind Other

Report Prepared for the National Treasury
Non-confidential Executive Summary: Ability of Firms to Adjust to Higher Energy Costs
vi
Figure 5 Renewable energy drivers
The three most popular reasons mentioned for engaging in energy efficiency projects also apply to renewable
energy. However, whereas efficiency/cost considerations remain the most cited primary reason for investing
in energy efficiency, sustainability concerns were mentioned most overall.9
Fuel switching and new onsite generation capacity
Relatively few fuel switching options (compared to energy efficiency and renewable energy options) were
implemented for the first time over the study period (7 before 2005, 2 in 2005-2007, and 10 each in 2008-
2010 and 2011-2015). The case study analysis indicated that most firms have few fuel switching options
available to them. Fuel switching investments and energy savings from fuel switching are therefore
concentrated in a small number of sectors. The energy savings from fuel switching projects, however, can be
significant – and this explains the relatively large size of investment directed towards few fuel switching
projects.
In general, there seems to have been a switch away from grid electricity towards low-carbon fuel sources
(gas, waste, biomass). In both the 2008-2010 and 2011-2015 periods, only one instance of a firm switching
(or planning to switch) to coal from electricity was reported. In the first period two firms switched from
9The relatively high current cost of most forms of renewable energy, coupled with the limited success firms in most sectors
have had with renewable energy to date, probably accounts for the differing importance attached to the drivers of renewable energy investment. Renewable energy projects may thus to date have been used largely for signalling attention to sustainability issues, although the expected increased in uptake of renewable energies in future may indicate that this is changing. Despite being relatively more expensive than most other forms of energy at present, it also became apparent during the case interviews that some firms were interested in renewable energy as a way of gaining control of energy input costs in future.
0
5
10
15
20
25
30
35
Eff
icie
ncy/c
ost
red
uctio
n
Esca
latin
g
en
erg
y c
osts
En
erg
y s
ecu
rity
Su
sta
ina
bility
co
nce
rns
SA
en
erg
y
sa
vin
gs/le
ga
l co
mp
lia
nce
Oth
er
Nu
mb
er
of
res
po
ns
es
First reason Second reason Third reason
Report Prepared for the National Treasury
Non-confidential Executive Summary: Ability of Firms to Adjust to Higher Energy Costs
vii
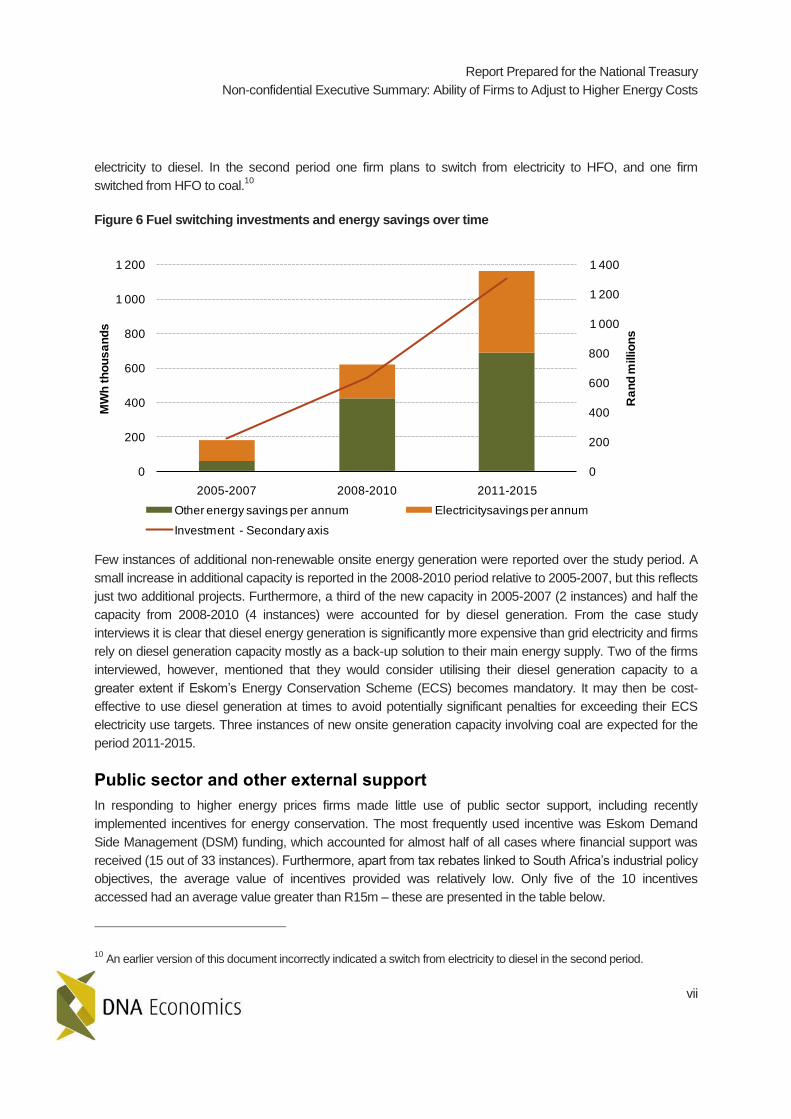
electricity to diesel. In the second period one firm plans to switch from electricity to HFO, and one firm
switched from HFO to coal.10
Figure 6 Fuel switching investments and energy savings over time
0
200
400
600
800
1 000
1 200
1 400
0
200
400
600
800
1 000
1 200
2005-2007 2008-2010 2011-2015
Ra
nd
millio
ns
MW
h t
ho
us
an
ds
Other energy savings per annum Electricitysavings per annum
Investment - Secondary axis
Few instances of additional non-renewable onsite energy generation were reported over the study period. A
small increase in additional capacity is reported in the 2008-2010 period relative to 2005-2007, but this reflects
just two additional projects. Furthermore, a third of the new capacity in 2005-2007 (2 instances) and half the
capacity from 2008-2010 (4 instances) were accounted for by diesel generation. From the case study
interviews it is clear that diesel energy generation is significantly more expensive than grid electricity and firms
rely on diesel generation capacity mostly as a back-up solution to their main energy supply. Two of the firms
interviewed, however, mentioned that they would consider utilising their diesel generation capacity to a
greater extent if Eskom’s Energy Conservation Scheme (ECS) becomes mandatory. It may then be cost-
effective to use diesel generation at times to avoid potentially significant penalties for exceeding their ECS
electricity use targets. Three instances of new onsite generation capacity involving coal are expected for the
period 2011-2015.
Public sector and other external support
In responding to higher energy prices firms made little use of public sector support, including recently
implemented incentives for energy conservation. The most frequently used incentive was Eskom Demand
Side Management (DSM) funding, which accounted for almost half of all cases where financial support was
received (15 out of 33 instances). Furthermore, apart from tax rebates linked to South Africa’s industrial policy
objectives, the average value of incentives provided was relatively low. Only five of the 10 incentives
accessed had an average value greater than R15m – these are presented in the table below.
10 An earlier version of this document incorrectly indicated a switch from electricity to diesel in the second period.

Report Prepared for the National Treasury
Non-confidential Executive Summary: Ability of Firms to Adjust to Higher Energy Costs
viii
Table 1 Most popular incentives to support energy-related projects (Rand millions)
Incentive Total Average Accessed
Investments that correspond to industrial policy objectives (Section 12 I of of ITA) 650 325 2
Tax allowance of 150% linked to research and development (R&D) spend (Section 11 D of ITA) 152 51 3
Critical Infrastructure Programme (CIP) 238 61 4
Eskom Demand Side Management (DSM) funding 805 54 15
Clean Development Mechanism (CDM) funding 166 41 4
While undoubtedly influencing behaviour in individual instances, public sector subsidies and incentives clearly
have been much less important than recent changes in energy (and especially electricity) prices in shaping
firm behaviour. Firms have responded by attempting to use energy more efficiently. The response to higher
energy prices suggest that economic instruments are likely to be effective in forcing firms to take account of
the externality costs related to energy supply. The selective use of targeted support mechanisms, however,
may enable firms to implement energy-related projects faster than relying on price increases alone.11
Research and development
Relatively low levels of investment in energy-related R&D were reported. Whereas overall R&D expenditure
appears to be increasing fast, it is concentrated in a few individual firms. Reported R&D investments,
however, are expected to significantly underestimate the true amount of funds spent. This is because a
significant proportion of R&D costs are being carried by energy services companies (ESCOs), equipment
providers and technology partners. Firms tend to spend the bulk of their R&D funds on process innovation or
optimisation which indirectly increases energy efficiency through general increases in the resource efficiency
of production processes. During the case study interviews, however, a number of firms indicated that they are
either developing or trying to customise innovative energy-related technologies that could significantly reduce
their energy intensity if successful. Local firms have also developed, or customised for local use, innovative
energy or environmentally friendly technologies.12
11 Based on survey responses, DSM funding, in particular, did seem to incentivise firms to implement energy-related
mitigation projects earlier than would have been the case in the absence of DSM funding. 12
Two notable examples are Xstrata Alloys’ patented Premus technology, which is widely regarded as the most energy-efficient technology for the production of ferro-alloy internationally, and ArcelorMittal’s Saldanha steel mill, which is recognised as a leader in emissions control and environmental management as a result of combining two existing technologies into an environmentally friendly process.

Report Prepared for the National Treasury
Non-confidential Executive Summary: Ability of Firms to Adjust to Higher Energy Costs
ix
Local energy performance placed within an international context
In order to assess the energy efficiency of South African industry, the energy intensity of a number of focus
sectors in 2010 was compared to international benchmarks.13
In some sectors, however, suitable international
benchmarks could not be found. In the platinum sector, for instance, South Africa dominates global production
with no true comparator available, while South African gold mines are significantly deeper than international
gold mining operations, rendering direct comparison of energy intensity senseless. In these cases
comparisons between the energy intensity of local firms were provided. Where suitable international
benchmarks were identified, energy intensity indicators for most local sectors compared favourably to the
international benchmarks used. Only two focus sectors, iron and steel and liquid fuels, potentially lagged
international energy efficiency trends.
CO2 Emissions
There is a very close link between energy use and CO2 emissions in South Africa.14
This begs the question -
what impact did the measures outlined above to adapt to higher energy prices have on CO2 emissions? The
survey responses provide an indicative trajectory for industrial CO2 emissions in South Africa.15
In order to consistently compare average emissions between periods the sample of firms reporting CO2
emissions was divided into groups according to the number of periods for which the firms reported
emissions.16
In 2010, the 24 firms in the 2007-2010 sample accounted for roughly 27% of South Africa’s total
estimated emissions from all sources17
, the 2007-2015 sample for roughly 19% and the 2007-2020 sample
around 15%.
The trend in emissions between samples is relatively constant, so only the sample stretching to 2020 is
considered. After a reduction in average emissions of 5% between 2007 and 2010, emissions are projected to
increase from 2010 onwards and average emissions are expected to rise to a level 42% higher than 2007
levels in 2020. This trend is very sensitive to the presence of one large emitter in the sample. If this single
13 Energy intensity figures (GJ/unit of output) were calculated based on the energy carrier usage data and output figures
provided. The calorific content of fuels (based on IPCC guidelines) was used to convert physical usage data to energy use data. 14
In a number of sectors (like non-ferrous metals (aluminium), ferro-alloys, iron and steel, and petrochemicals) a significant proportion of emissions are related to the use of coal as a process input or reductant rather than an energy source. Coal as
an energy source, however, also contributes significant to CO2 emissions. 15
As a result of a number of firms reporting their greenhouse gas emissions in CO2 equivalent while others reported their
emissions in straight CO2 emissions, the emphasis should be on the trend rather than the absolute level of average CO2 emissions. 16
Reported emissions for first year and second year only; reported emissions for first, second and third year [thus removing firms from the first group that did not report emissions for third year]; and reported emissions for all four years. The number of firms included in each group is indicated as N. Comparing the performance of the different groups over time eliminates the risk that average emissions may deviate over time because the composition of the firms reporting emissions changes. 17
Based on estimated total emissions of 500 mtCO2-e provided in the Carbon Disclosure Project 2010: South Africa JSE 100 report. Reported emissions include scope 2 emissions (i.e. emissions associated with use of electricity) for most (although not all) firms and thus captures some of Eskom’s emissions related to the supply of electricity to the sample firms.

Report Prepared for the National Treasury
Non-confidential Executive Summary: Ability of Firms to Adjust to Higher Energy Costs
x
emitter is removed, the average emissions of the 10 remaining firms is around 20% higher than 2007 levels in
2020.18
Figure 7 Average CO2 emissions per period
While the analysis did not attempt to isolate the impact of energy efficiency projects from those arising from
external factors, such as the recent global financial crisis, the mitigation activities of firms highlighted in this
study are expected to have had a desirable impact on greenhouse gas emissions by reducing overall energy
demand and eliciting interest in renewable energy sources.19
18 The trend in average emissions remains constant between the samples after the large emitter is removed.
19 While this certainly provides an incentive in the right direction, it does not necessarily eliminate the case for an economic
instrument that distinguishes properly between the carbon intensities of different sources of energy and different means of electricity generation. Energy cost increases driven by supply-demand factors or the cost of generation/production also does not account for the climate change externality inherent in greenhouse gas emissions. The relative attractiveness of the three new coal-fired electricity generation projects expected for the period 2011-2015 indentified in the survey compared to renewable energy, for instance, will be effected by carbon pricing. Given that cost considerations are unlikely to be the only factors driving these projects, however, it is not a foregone conclusion that the presence of a carbon price would prevent these projects from proceeding.
0
1
2
3
4
5
6
7
8
9
10
11
2007 2010 2015 2020
To
nn
es
millio
ns
2007-2010 N=24 2007-2015 N=15 2007-2020 N=11
Report Prepared for the National Treasury
Non-confidential Executive Summary: Ability of Firms to Adjust to Higher Energy Costs
xi
Conclusion
In the relatively short period since the onslaught of sharply increased energy costs, all of the sectors analysed
in this study have undertaken a wide variety of measures to conserve on energy use in response to rising
prices and security of supply concerns. Some have reported significant new investments to achieve this. All
sectors reported adopting energy-saving measures they had not employed previously. The principal reason
given for undertaking these energy-saving investments was to minimize the cost-raising impacts of price
increases and thus ensure financial survival. A smaller number of firms mentioned energy security as an
important motivation. Most of the energy savings from new energy efficiency investments arose from reduced
electricity consumption, whereas renewable energy and fuel switching projects mostly generated non-
electricity energy savings.20
Rising energy prices also appear to have sparked considerable interest in renewable energy. Firms reported
exploring and implementing a wide range of renewable energy options, most of which centered on non-
electricity uses, especially in a few key mining sectors. Rising energy prices have therefore likely had a
desirable impact on greenhouse gas emissions. With the exception of Eskom’s Demand Side Management
(DSM) programme, firms reported very little use of available incentives for energy-related projects. Increases
in electricity and other energy prices have thus provided a strong incentive on their own for firms to adapt to
increased energy costs.
Longer-term adjustments to the new world of higher real energy prices are difficult to predict. As might be
expected, firms initially focused on options that are the easiest, least cost and quickest to implement. Many
firms indicate that they are reaching the end of such “easy” adjustments, and so in future we are likely to see
structural adjustments as firms and investors adapt to the new energy environment. Given that the most
significant opportunities for increasing energy efficiency exist when new plants are designed, or when major
pieces of machinery are periodically replaced, the price elasticity of electricity and other energy carriers are
expected to increase over time. But where firms are part of multinational groups of companies, for instance,
the decision to close down non-economically viable installations and invest in new installations are taken
separately. It is thus not a certainty that production facilities that are closed down in South Africa as a result of
rising energy/carbon costs will be replaced with energy/carbon-efficient production facilities in South Africa.
20 The widely differing conditions identified between sectors, and often also within sectors (both in terms of energy issues
and available mitigation options), indicate that there would be value in supplementing thinking about energy-related issues at an aggregate level with detailed sector- and even plant-level analysis. Regular interaction with individual firms could thus prove useful in expanding the picture regarding the ability of South Africa firms to adapt to increasing energy costs provided in this report.

DNA is an independent research company. Opinions expressed in DNA research reflect the views
of DNA staff, and are not necessarily representative of the views of the commissioning party. Every
effort is made to ensure that the data, secondary research and other sources referenced in this
research are complete, accurate and unbiased, but DNA accepts no responsibility for any errors or
omissions in such references. If you are not the intended recipient of this report please refrain from
reading, storing or distributing it.
Recommended