WILLIAM J. VAUGHN and J. D. DUNN
A Study of Job Satisfaction
In Six University Libraries
The Job Descriptive Index (JDI) was administered to the employees (N = 265) of six university libraries. A comparative analysis of job satisfaction in the six libraries was prepared using library subgroup~ ing as the principle of stratification. Also, a comparative analysis of job satisfaction in the six libraries was made using the five ]DI dimensions, plus the ]DI total, as the principle of stratification. In one library a comparative analysis of job satisfaction was conducted using six department subgroupings within the library as the principle of stratification. No particular library scored either consistently higher or lower than the others on all dimensions. Similar results were found when comparisons among departments of a particular library were made.
JN THIS STUDY a model for conducting job satisfaction research in on-going organizations is suggested. Specific attention is given to the following questions: ( 1) How can job satisfaction be measured? ( 2) What are the major pitfalls likely to be encountered by those who conduct such research? ( 3) How can job satisfaction data, once obtained, be analyzed and interpreted by management?
Job satisfaction is the feeling an employee has about his pay, his work, his promotion opportunities, his co-workers, and his supervisor. An employee's feel-
William ]. Vaughn is head, Department of Management & Marketing, at HardinSimmons University. ]. D. Dunn is professor of business administration at North T exas State University, Denton. The research for this paper was funde.d by a North Texas State University Faculty Research Grant to Dr. Dunn.
The authors are indebted for technical assistance to Richard Harris, Jerry Waldon, Frank Walker, and Steve Minnis of the NTSU Computer Center.
ings about each of these items can be indexed; a numerical value can be assigned to each; and a grand total can be computed. From a managerial perspective, however, it is advisable to examine each element of satisfaction separately. As this study will suggest, the determinants of each element of satisfaction as well as their consequences appear to be different.
An example will illustrate this concept. Assume that satisfaction with pay can be measured on a scale of values such as that in Figure 1. Further assume
I I -5 -4 - 3 -2 -1 0 + 1 +2 +3 +4 +5
Fig. 1 A Hypothetical Scale for Measuring
Job Satisfaction
that a particular employee's satisfaction with pay is indexed and is· found to be - 5. Satisfaction with supervision, on the other hand, let us say, is found to be +5. By adding these two values one would arrive .at a zero global measure. From a
I 163
164 I College & Research Libraries • May 1974
managerial perspective, does it make sense to do this? Are those matters that cause satisfaction with pay different from those matters that cause satisfaction with supervision? Very probably they are. Cost-of-living, going wage rates in a particular labor market, the expectations or aspirations of an employee, and wage structures within an organization are a few examples, drawn from a list of many factors, that influence feelings about pay. The technical ability of a supervisor, his human relations skills, and his administrative ability are a few qualities that influence satisfaction with supervision. By following a similar process of reasoning one could catalog the determinants of other discriminable dim·ensions of job sati~faction, i.e., promotion, work itself, and feelings about co-workers. If these factors each have a unique set of determinants, then each aspect of job satisfaction should be indexed separately.
Are the consequences of employee satisfaction with pay, promotion, supervision, work, and co-workers also likely to be different? Again, the answer is, "probably so." The above example can be used again to illustrate why this is true. The negative feelings about pay expressed by the employee in the above example tend to cause him to have a propensity to leave the organization. His positive feelings about supervision, on
the other hand, tend to counteract this feeling about pay. His positive feeling about supervision tends to keep him in the organization. In fact, he may feel that his supervisor will very soon do something about his pay. If he believes strongly that a pay increase is likely to come soon, his feelings about pay will perhaps have no overt behavioral consequences at all.
After making this observation, however, it is important to point out that indexing the satisfaction an employee has about his job and cataloging the determinants and consequences of these feelings is a complex process. Before undertaking such a project, management would do well to consider these questions: How can employee satisfaction with a job be measured? Is there a relation between managerial performance and employee satisfaction? Is there arelation between employee satisfaction and employee productivity? What influence does employee satisfaction have upon organizational effectiveness? The hypothesis upon which the research in this study was built is shown in Figure 2.
Managerial performance (see Figure 2) does influence employee job satisfaction. As mentioned earlier, one discriminable aspect of employee satisfaction is the feeling an employee has about his supervisor. Managerial performance
Fig. 2 The Theoretical Model
,-i
also has a direct -influence upon employee performance (productivity). How this is done is not clear, but in Figure 2 the idea is illustrated by the arrow moving directly from managerial performance to employee productivity.
Some aspects of managerial performance (for example, key decisions on plant ·expansion and output levels) impinge directly upon organizational effectiveness. Evidence to support this assumption is seen in the widespread practice of removing the managerial cadre when an organization does not function properly.
Organizational effectiveness,. as the term is used here, is the extent to which an organization is accomplishing its objectives without depleting its human, financial, and material resources. An organization is a group of people in a structured situation working together toward a specified goal. Organizations may be analyzed by using either a macro or micro level of analysis. In large organizations it is often advisable to study the job satisfaction of a part of the organization rather than the whole.
The influence of employee productivity upon organizational effectiveness is direct. The influence of employee satisfaction upon organizational effectiveness, in contrast, is not so readily seen. Correlations between satisfaction and performance (productivity) have been found to be low in many studies, suggesting that one does not cause the other. On the other hand, correlations between employee satisfaction and turnover have been found to be high and positive. Dissatisfied employees may be exceedingly high in productivity while they are on the job; however, often dissatisfied employees adopt either a "fight" or "Hight" pattern of behavior. They leave the organization if alternatives are available, or they stay with the organization and "fight" it. "Fight" patterns of behavior are illustrated by the strike, slowdown, or by more subtle means such
Job Satisfaction I 165
as the failure to commit one's maximum efforts in support of the organization's goals.
The remaining portion of this paper will deal with the subject of employee satisfaction. How can it be measured, or indexed? What are some of the pitfalls likely to be encountered in the process of measuring satisfaction? Once obtained, how can job satisfaction data be analyzed?
THE SAMPLE STUDIED
The universe of this study was comprised of six organizations, specifically, six university libraries, situated within a fifty-mile radius of the center of the Dallas-Fort Worth metropolitan region. The research effort was sponsored by six libraries of the Interuniversity Council, an organization comprised of fourteen universities. The following libraries participated in this study: University of Texas at Arlington, North Texas State University, Southern Methodist University, Texas Christian University, University of Dallas, and East Texas State University. The numbers of full-time employees in each of these libraries who participated in this study are shown in Table I.
INDEXING EMPLOYEE SATISFACTION
:Many instruments for measuring job satisfaction have been devised. When selecting such an instrument, the following criteria can be used:
I. It should index the several dimensions of job satisfaction rather than an "over-all" (global) dimension.
2. It should apply to a wide variety of jobs.
3. It should be sensitive to variations in attitude.
4. The instrument used should be of such a nature (interesting, realistic, and varied) that the scale will evoke cooperation from both management and employees.
166 I College & Research Libraries • May 1974
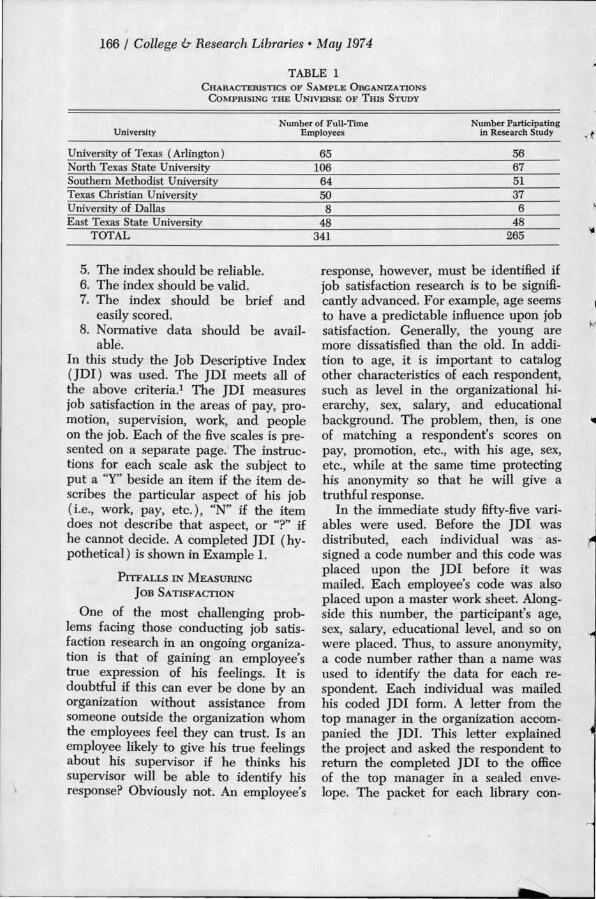
TABLE 1 CHARACTERISTICS OF SAMPLE 0RGANIZA TIONS
CoMPRISING THE UNIVERSE OF Tms STUDY
University Number of Full-Time
Employees Number Participating
in Research Study
University of Texas (Arlington) North Texas State University Southern Methodist University Texas Christian University University of Dallas East Texas State University
TOTAL
5. The index should be reliable. 6. The index should be valid. 7. The index should be brief and
easily scored. 8. Normative data should be avail-
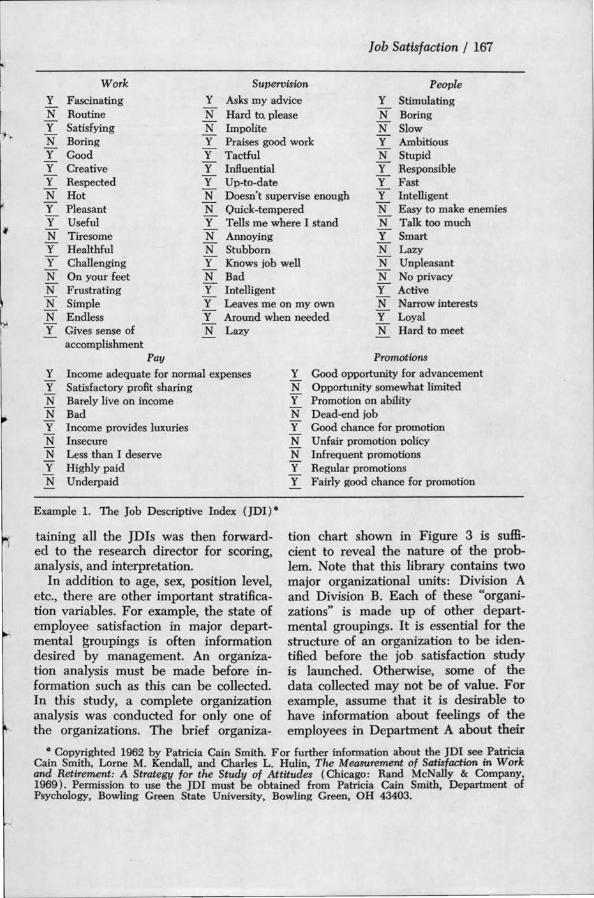
able. In this study the Job Descriptive Index (JDI) was used. The JDI m·eets all of the above criteria.1 The JDI measures job satisfaction in the areas of pay, promotion, supervision, work, and people on the job. Each of the five scales is presented on a separate page. ' The instructions for each scale ask the subject to put a "Y" beside an item if the item describes the particular aspect of his job (i.e., work, pay, etc.), "N" if the item does not describe that aspect, or "?" if he cannot decide. A completed JDI (hypothetical) is shown in Example 1.
PITFALLS IN MEASURING
JOB SATISFACTION
One of the most challenging problems facing those conducting job satisfaction research in an ongoing organization is that of gaining an employee's true expression of his feelings. It is doubtful if this can ever be done by an organization without assistance from someone outside the organization whom the employees feel they can trust. Is an employee likely to give his true feelings about his supervisor if he thinks his supervisor will be able to identify his response? Obviously not. An employee's
65 56 106 67
64 51 50 37 8 6
48 48 341 265
response, however, must be identified if job satisfaction research is to be significantly advanced. For example, age seems to have a predictable influence upon job satisfaction. Generally, the young are more dissatisfied than the old. In addition to age, it is important to catalog other characteristics of each respondent, such as level in the organizational hierarchy, sex, salary, and educational background. The problem, then, is one of matching a respondent's scores on pay, promotion, etc., with his age, sex, etc., while at the same time protecting his anonymity so that he will give a truthful response.
In the immediate study fifty-five variables were used. Before the JDI was distributed, each individual was - assigned a code number and this code was placed upon the JDI before it was mailed. Each employee's code was also placed upon a master work sheet. Alongside this number, the · participant's age, sex, salary, educational level, and so on were placed. Thus, to assure anonymity, a code number rather than a name was used to identify the data for each respondent. Each individual was mailed his coded JDI form. A letter from the top manager in the organization accompanied the JD I. This letter explained the project and asked the respondent to return the completed JDI to the office of the top manager in a sealed envelope. The packet for each library con-
k
Job Satisfaction I 167
Work Supervision People y Fascinating y Asks my advice y Stimulating N Routine N Hard to. please N Boring y Satisfying N Impolite N Slow N Boring y Praises good work y Ambitious y Good y Tactful N Stupid y Creative y Influential y Responsible y Respected y Up-to-date y Fast N Hot N Doesn't supervise enough y Intelligent y Pleasant N Quick -tempered N Easy to make enemies y Useful y Tells me where I stand N Talk too much N Tiresome N Annoying y Smart y Healthful N Stubborn N Lazy y Challenging y Knows job well N Unpleasant N On your feet N Bad N No privacy N Frustrating y Intelligent y Active N Simple y Leaves me on my own N Narrow interests N Endless y Around when needed y Loyal y Gives sense of N Lazy
accomplishment Pay
y Income adequate for normal expenses Y Satisfactory profit sharing N Barely live on income N Bad y N N y
Income provides luxuries Insecure Less than I deserve Highly paid
N Underpaid
Example 1. The Job Descriptive Index (JDI) 0
taining all the JDis was then forwarded to the research director for scoring, .analysis, and interpretation.
In addition to age, sex, position level, etc., there are other important stratification variables. For example, the state of employee satisfaction in major departmental ~roupings is often information desired by management. An organization analysis must be made before information such as this can be collected. In this study, a complete organization analy~is was conducted for only one of the organizations. The brief organiza-
N Hard to meet
Promotions
Y Good opportunity for advancement N Opportunity somewhat limited Y Promotion on ability N Dead-end job Y Good chance for promotion N Unfair promotion policy N Infrequent promotions Y Regular promotions Y Fairly good chance for promotion
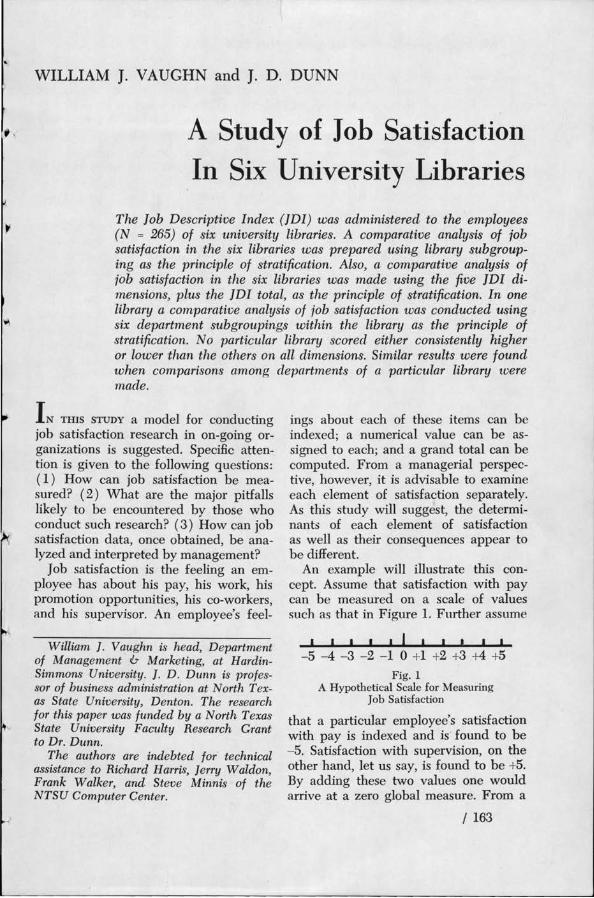
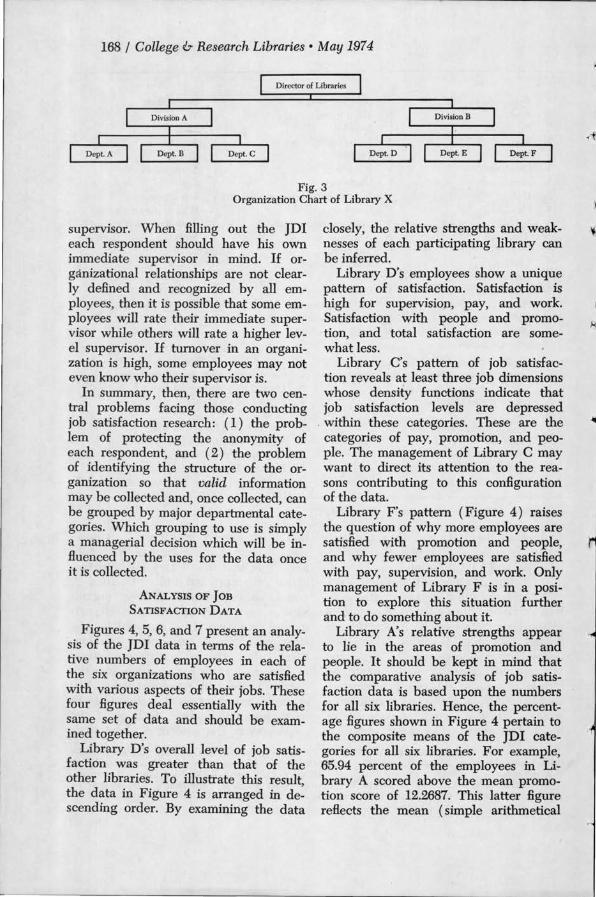
tion chart shown in Figure 3 is sufficient to reveal the nature of the problem. Note that this library contains two major organizational units: Division A and Division B. Each of these "organizations" is made up of other departmental groupings. It is essential for the structure of an organization to be identified before the job satisfaction study is launched. Otherwise, some of the data collected may not be of value. For example, assume that it is desirable to have information about feelings of the employees in Department A about their
° Copyrighted 1962 by Patricia Cain Smith. For further information about the JDI see Patricia Cain Smith, Lome M. Kendall, and Charles L. Hulin, The Measurement of Satisfaction in Work and Retirement: A Strategy for the Study of Attitudes (Chicago: Rand McNally & Company, 1969). Permission to use the JDI must be obtained from Patricia Cain Smith, Department of Psychology, Bowling Green State University, Bowling Green, OH 43403.
168 I College & Research Libraries • May 1974
Director of Libraries
Fig. 3 Organization Chart of Library X
supervisor. When filling out the JDI each respondent should have his own immediate supervisor in mind. If organizational relationships are not clearly defined and recognized by all employees, then it is possible that some employees will rate their immediate supervisor while others will rate a higher level supervisor. If turnover in .an organization is high, some employees may not even know who their supervisor is.
In summary, then, there are two central problems facing those conducting job satisfaction research: ( 1) the problem of protecting the anonymity of each respondent, and ( 2) the problem of identifying the structure of the organization so that valid information may be collected and, once collected, can be grouped by major departmental categories. Which grouping to use is simply a managerial decision which will be influenced by the uses for the data once it is collected.
ANALYSIS OF JoB
SATISFACI'ION DATA
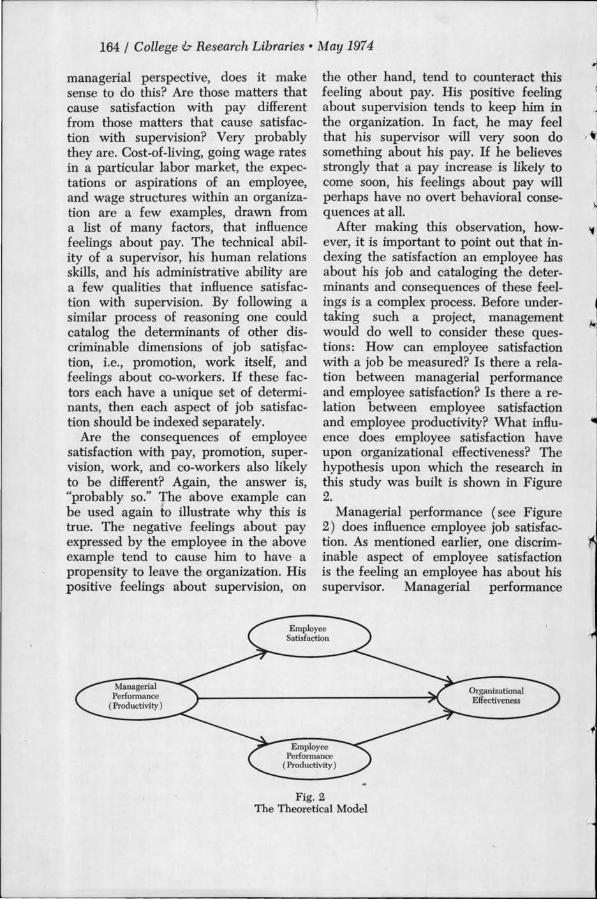
Figures 4, 5, 6, and 7 present an analysis of the JDI data in terms of the relative numbers of employees in each of the six organizations who are satisfied with various aspects of their jobs. These four figures deal essentially with the same set of data and should be examined together.
Library D's overall level of job satisfaction was greater than that of the other libraries. To illustrate this result, the data in Figure 4 is arranged in descending order. By examining the data
closely, the relative strengths and weaknesses of each participating library can be inferred.
Library D's employees show a unique pattern of satisfaction. Satisfaction is high for supervisiop, pay, and work. Satisfaction with people and promotion, and total satisfaction are somewhat less.
Library C' s pattern of job satisfaction reveals at least three job dimensions whose density functions indicate that job satisfaction levels are depressed
. within these categories. These are the categories of pay, promotion, and people. The management of Library C may want to direct its attention to the reasons contributing to this configuration of the data.
Library F' s pattern ( Figure 4) raises the question of why more employees are satisfied with promotion and people, and why fewer employees are satisfied with pay, supervision, and work. Only management of Library F is in a position to explore this situation further and to do something about it.
Library A's relative strengths appear to lie in the areas of promotion and people. It should be kept in mind that the comparative analysis of job satisfaction data is based upon the numbers for all six libraries. Hence, the percentage figures shown in Figure 4 pertain to the composite means of the JDI categories for all six libraries. For example, 65.94 percent of the employees in Library A scored above the mean promotion score of 12.2687. This latter figure reflects the mean ( simple arithmetical
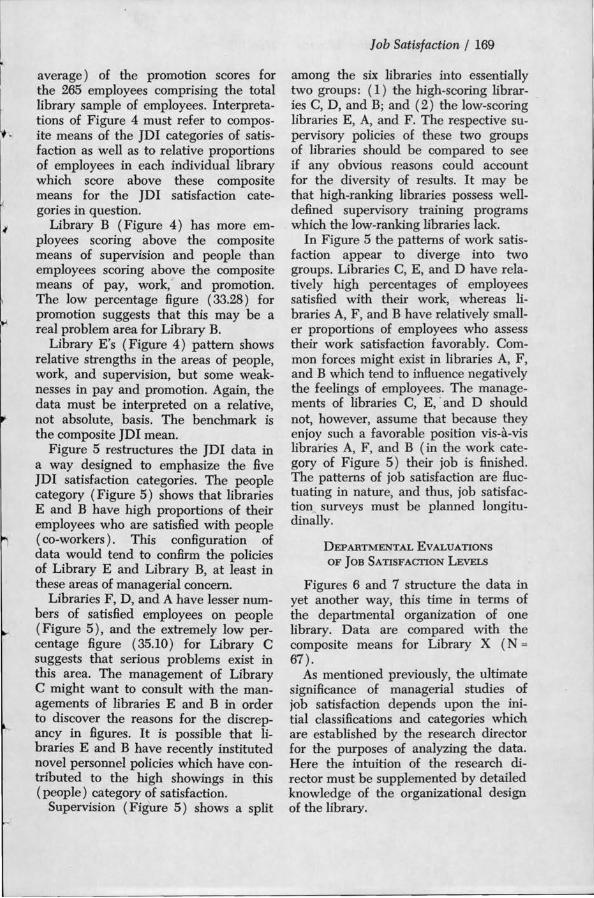
average) of the promotion scores for the 265 employees comprising the total library sample of employees. Interpretations of Figure 4 must refer to composite means of the JDI categories of satisfaction as well as to relative proportions of employees in each individual library which score above these composite means for the JDI satisfaction categories in question.
Library B (Figure 4) has more employees scoring above the composite means of supervision and people than employees scoring above the composite means of pay, work, and promotion. The low percentage figure ( 33.28) for promotion suggests that this may be a real problem area for Library B.
Library E' s (Figure 4) pattern shows relative strengths in the areas of people, work, and supervision, but some weaknesses in pay and promotion. Again, the data must be interpreted on a relative, not absolute, basis. The benchmark is the composite JDI mean.
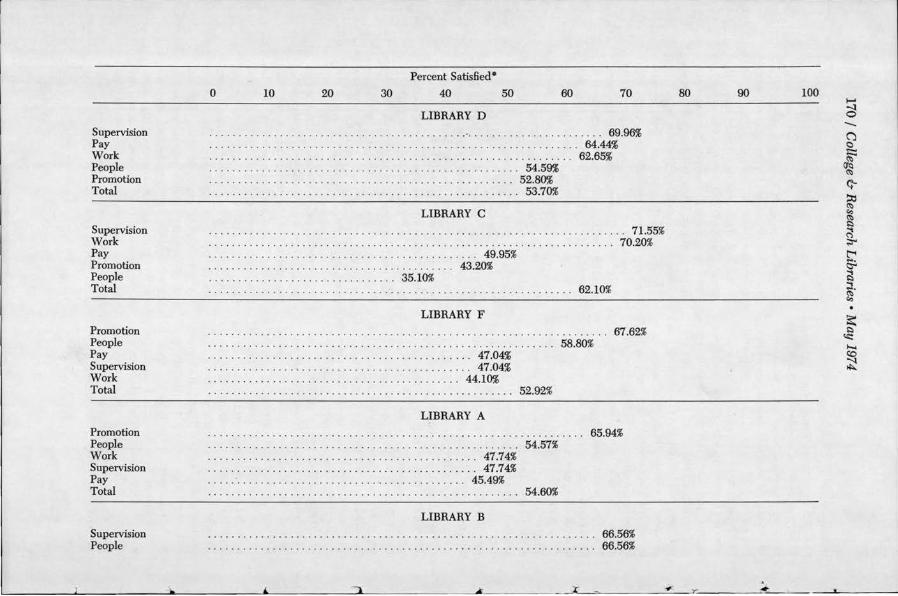
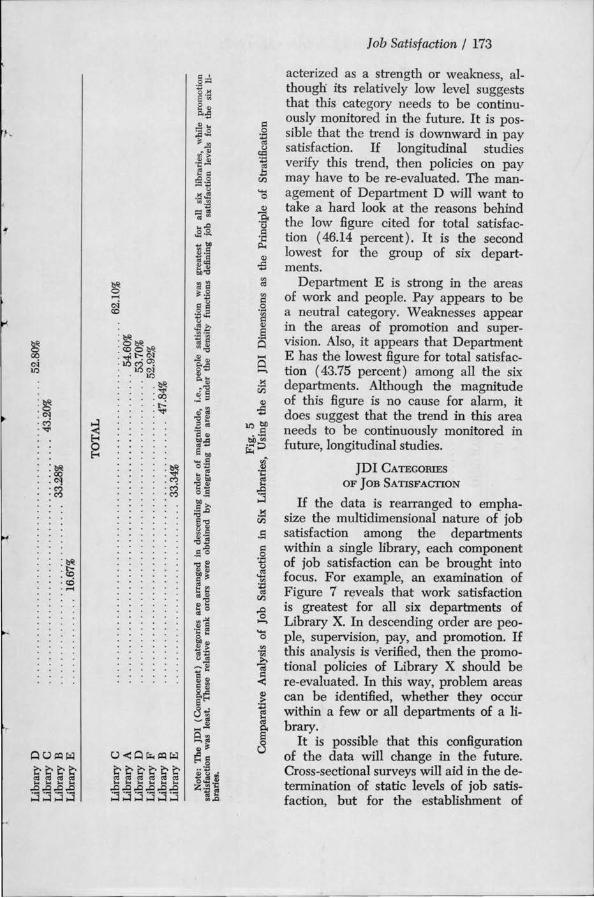
Figure 5 restructures the JDI data in a way designed to emphasize the five JDI satisfaction categories. The people category (Figure 5) shows that libraries E and B have high proportions of their employees who are satisfied with people (co-workers). This configuration of data would tend to confirm the policies of Library E and Library B, at least in these areas of managerial concern.
Libraries F, D, and A have lesser numbers of satisfied employees on people (Figure 5), and the extremely low percentage figure ( 35.10) for Library C suggests that serious problems exist in this area. The management of Library C might want to consult with the managements of libraries E and B in order to discover the reasons for the discrepancy in figures. It is possible that libraries E and B have recently instituted novel personnel policies which have contributed to the high showings in this (people) category of satisfaction.
Supervision (Figure 5) shows a split
Job Satisfaction I 169
among the six libraries into essentially two groups: ( 1) the high-scoring libraries C, D, and B; and ( 2) the low-scoring libraries E, A, and F. The respective supervisory policies of these two groups of libraries should be compared to see if any obvious reasons could account for the diversity of results. It may be that high-ranking libraries possess welldefined supervisory training programs which the low-ranking libraries lack.
In Figure 5 the patterns of work satisfaction appear to diverge into two groups. Libraries C, E, and D have relatively high percentages of employees satisfied with their work, whereas libraries A, F, and B have relatively smaller proportions of employees who assess their work satisfaction favorably. Common forces might exist in libraries A, F, and B which tend to influence negatively the feelings of employees. The managements of libraries C, E, · and D should not, however, assume that because they enjoy such a favorable position vis-a-vis libraries A, F, and B (in the work category of Figure 5) their job is finished. The patterns of job satisfaction are fluctuating in nature, and thus, job satisfaction surveys must be planned longitudinally.
DEPARTMENTAL EVALUATIONS
OF JoB SATISFACTION LEVELS
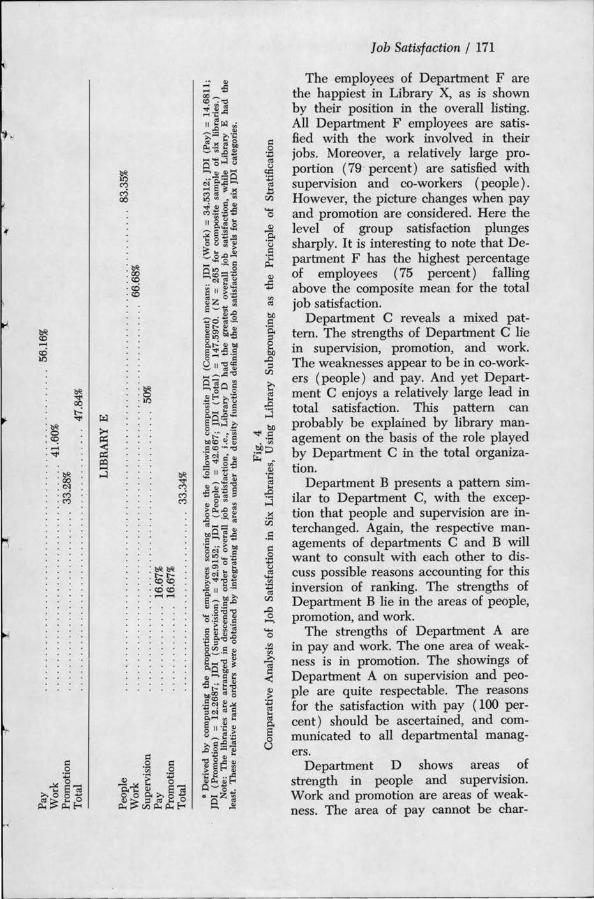
Figures 6 and 7 structure the data in yet another way, this time in terms of the departmental organization of one library. Data are compared with the composite means for Library X ( N = 67).
As mentioned previously, the ultimate significance of managerial studies of job satisfaction depends upon the initial classifications and categories which are established by the research director for the purposes of analyzing the data. Here the intuition of the research director must be supplemented by detailed knowledge of the organizational design of the library.
Supervision Pay Work People Promotion Total
Supervision Work Pay Promotion People Total
Promotion People Pay Supervision Work Total
Promotion People Work Supervision Pay Total
Supervision People
Percent Satisfied 0
0 10 20 30 40 50 60 70
LIBRARY D
... .. . . ..... . . .. .... . .... . ........... . ..... . -....................... 69.96%
..... . ............ . .. . .................................. . . . .. . . 64.44%
............... . ... . .................... .. . . ............ .. .. . . 62.65%
.. . ... . .. . .......... . .. . ... . . . ............... .. ...... 54.59%
.. . ... . ............................................. 52.80%
........................ . ..... .. . .. ....... . .. .. ...... 53.70%
LIBRARY C
. . . . .. . ... . . . .... . .. . . . .... . .... . ............. . .... .. ................. . 71 .55%
.. . ... . .. . ..... . . . .. ... ............. . ....... . . . . .. .... . ... . .. .. . . .... 70.20%
...... . .................. .. ... . .. . ..... . ... . .. 49.95%
... . ...... . ......................... . ..... 43.20% . ... .. .. . ....................... 35.10%
LIBRARY F
...... .. ............... .. . . . . ....... . ... .. . .. 47.04%
.... ........ ... ... . . . ..... . .. . ... .. ....... . .. 47.04%
. ......... . .. . ............................. 44.10%
LIBRARY A
. .. ..... . ............ . .. . . . ........ . .......... 47.74%
.................... . .... ... ..... . .. .. ..... . .. 47.74%
.. . . . · . . ...... . ...... . ... . .... ..... . ... . ...... 45.49%
LIBRARY B
52.92%
54.57%
54.60%
62.10%
67.62% 58.80%
65.94%
66.56% 66.56%
80 90 100 1-' -t 0 -(')
~ ~
()'Q ~
G-:;:x:, ~ c:, ~ ~
~ ~
t""t & ""i ~ ""i ..... ~ c:,
s:: ~ N c:o ~
: ~ : ~ · ....-I · -.:t'
: ~ " C\1 : c.; · c-:l
: ~ : <:O · 1:0 · <:0
: ~ · l.t:)
..... 0
Job Satisfaction I 171
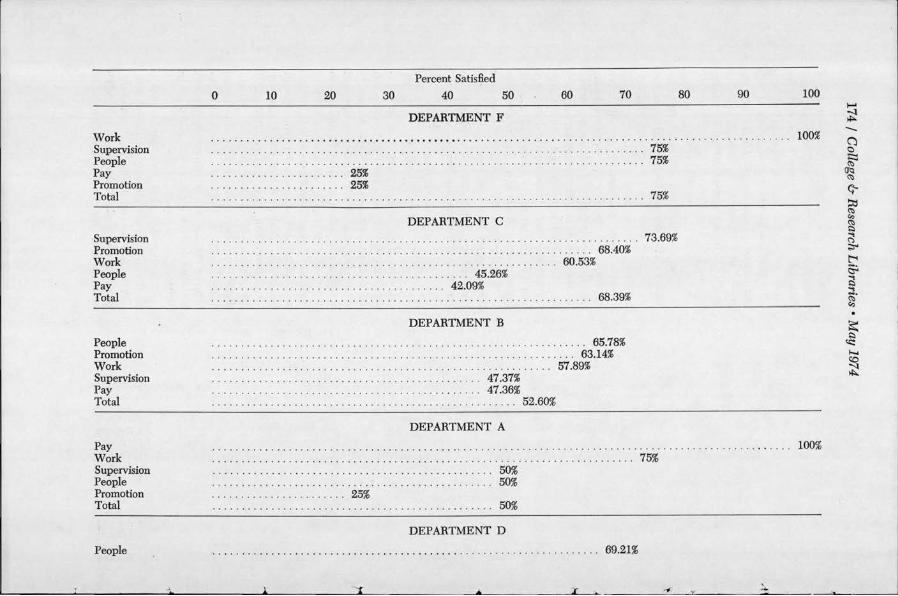
The employees of Department F are the happiest in Library X, as is shown by their position in the overall listing. All Department F employees are satisfied with the work involved in their jobs. Moreover, a relatively large proportion ( 79- percent) are satisfied with supervision and co-workers (people). However, the picture changes when pay and promotion are considered. Here the level of group satisfaction plunges sharply. It is interesting to note that Department F has the highest percentage of employees ( 75 percent) falling above the composite mean for the total job satisfaction.
Department C reveals a mixed pattern. The strengths of Department C lie in supervision, promotion, and work. The weaknesses appear to be in co-workers (people) and pay. And yet Department C enjoys a relatively large lead in total satisfaction. Thi·s pattern can probably be explained by library management on the basis of the role played by Department C in the total organization.
Department B presents a pattern similar to Department C, with the exception that people and supervision are interchanged. Again, the respective managements of departments C and B will want to consult with each other to discuss possible reasons accounting for this inversion of ranking. The strengths of Department B lie in the areas of people, promotion, and work.
The strengths of Department A are in pay and work. The one area of weakness is in promotion. The showings of Department A on supervision and people are quite respectable. The reasons for the satisfaction with pay ( 100 percent) should be ascertained, and communicated to all departmental managers.
Department D shows areas of strength in people and supervision. Work and promotion are areas of weakness. The area of pay cannot be char-
Library E Library B Library F Library I> Library A Library C
Library C Library D Library B Library E Library A Library F
Library C Library E Library D Library A Library F Library B
Library D Library B Library C Library F Library A Library E
Library F Library A
Percent Satisfied
0 10 20 30 40 50 60 70 80
PEOPLE
. 0 . ... 83o35% 66o56%
. 0 ... . .. 0 ........................... 0 . . 0. 0. 0. 0 ..... ........ 58o80%
.. 0 ... . .... .... . ............. . .. 0 .... . 0 . .. 0 0 0 .... . . 0. 54o59%
... 0 ..... .. 0 .... . . . .... 0 ........ 0 .. 0 ....... 0 .... 0 .. 0. 54o57% 35010%
SUPERVISION
0 0 ...... 0 0. 0 0 ..... 0 ......... 0 .. .............. 0 .......... . .............. 71055% .·. 0 0 0 .... 0 ........ 0 ....... 0 0: ..... ... .. 0. 0 0 ..... 0 ......... . ........ 69096% 0. 0 ... 0 0 ... .... ..... ... ...... 0 ........ . ....................... . ... 66o56% ...... . . .......... 0 . ..... .. ......... . .... .. . . . . . 50% ......... 0 .................. ... ........ ... . ... 47o74% ...................... . .. .. .. . . .. ... ... . ... . .. 47004%
WORK
......................... .. . ... . . .. .. ..................... . ..... . .... 70020%
. ......... . .. .. ... .. 0 . .. . ................ 0 ... . ....... .. ........... 66.68%
... 0. 0 0 ............. 0... .. ....... .. ... . ............... . ... 62.65%
..................... 0 ........... . . . ... . .. .. .. 47.74%
... .. . .. . . ... . ......... . . ... .... ..... . . . .. 44010%
. ..... . ..... ............ ...... . .. . . . . .. 41.60%
PAY 0 .. 0 .. . ............ ..... ........ . . .. ........ ..... .. . ........ .. . 64.44% .. .. ..... . . . .... ... ....... .. .. ... . .. .. 0 . . 0 ............... 56.16% .. .... 0 . ... .. 0 . .... . . . . .. .......... ....... . 0 . . 49.95% .................... 0 .. . 0 . ... 0 .......... .. 0 .. 47.04'% 0 .... . 0 .......... 0 0 .. ... .... .. ........... ... 45.49% .... .. .. . .... 0 0 16.67%
PROMOTION
0. 0 . ... . ................ 0 .... 0 .... .. .. . . .... .. . .... .. ... .. . .. . . . ..... 67.62% ... 0 . ..... ........ . .. .... ........... ... .. . . 0 . .. . ... . . .. .. ... ... . 65.94%
90 100
""""' -:t to -(J
~ ~
()'Q ~
G-::x; ~ c;.:, ~
~ C":l ~
t:""4 & ~ ., ;· c;.:,
~ ~ "'""' "' ~
r
:~ .00 .C'J • C') • C')
: ~ · .o :cO · ...-1
\C~ bO ·;;; rf:::>
.~~ ~
o:9 ...:l .es fJ)
.s
I ob Satisfaction I 173
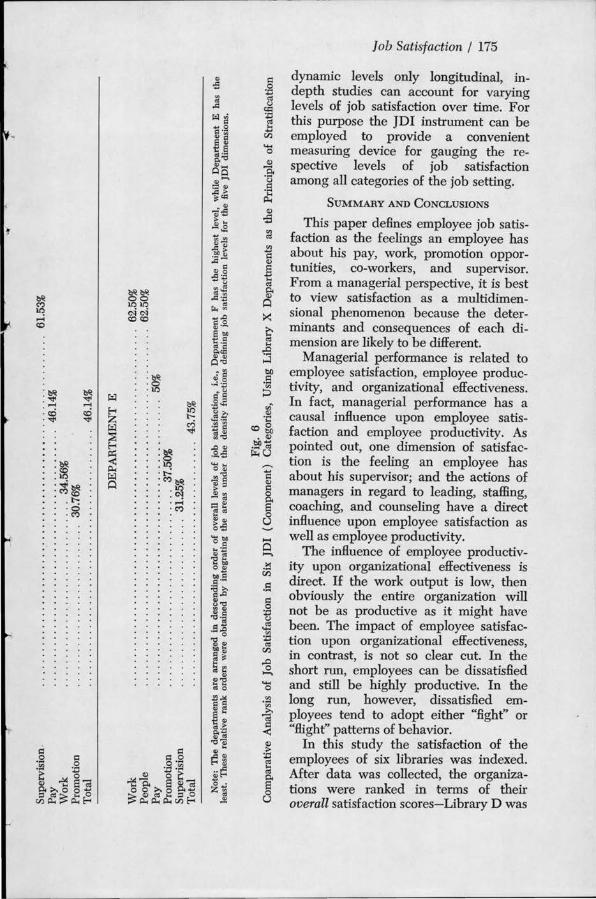
acterized as a strength or weakness, although its relatively low level suggests that this category needs to be continuously monitored in the future. It is possible that the trend is downward in pay satisfaction. If longitudinal studies verify this trend, then policies on pay may have to be re-evaluated. The management of Department D will want to take a hard look at the reasons behind the low figure cited for total satisfaction ( 46.14 percent). It is the second lowest for the group of six departments.
Department E is strong in the areas of work and people. Pay appears to be a neutral category. Weaknesses appear in the areas of promotion and supervision. Also, it appears that Department E has the lowest figure for total satisfaction ( 43.75 percent) among all the six departments. Although the magnitude of this figure is no cause for alarm, it does suggest that the trend in this area needs to be continuously monitored in future, longitudinal studies.
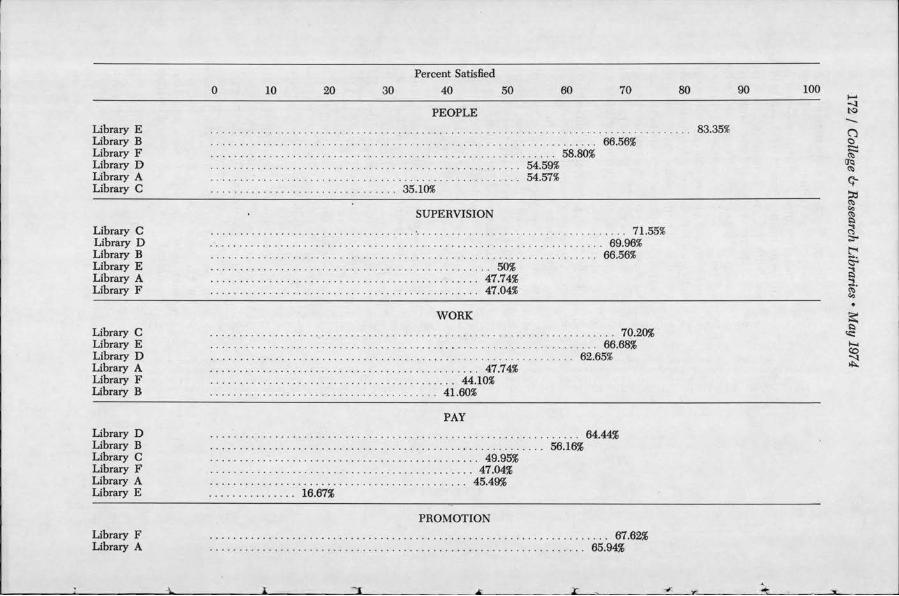
}DI CATEGORIES ·
OF JOB SATISFACTION
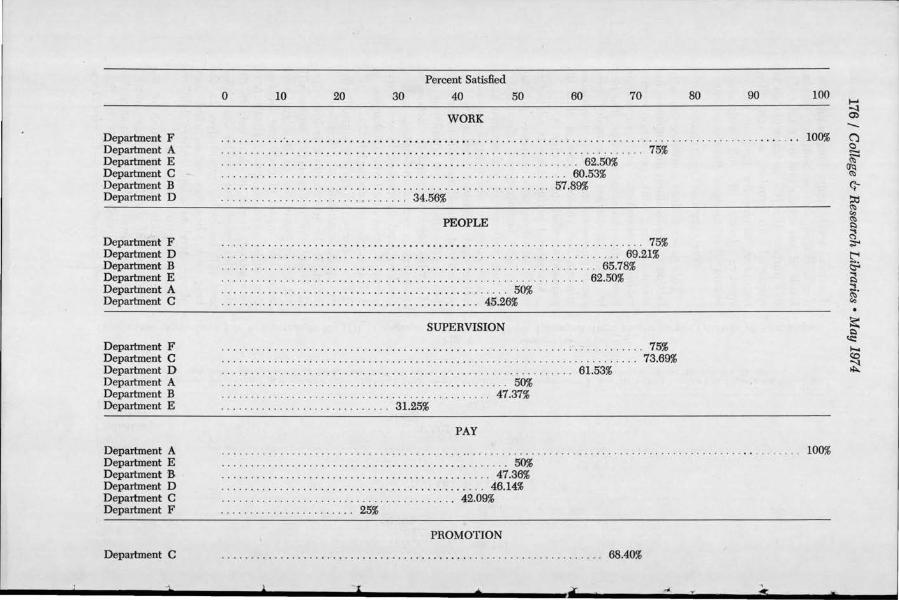
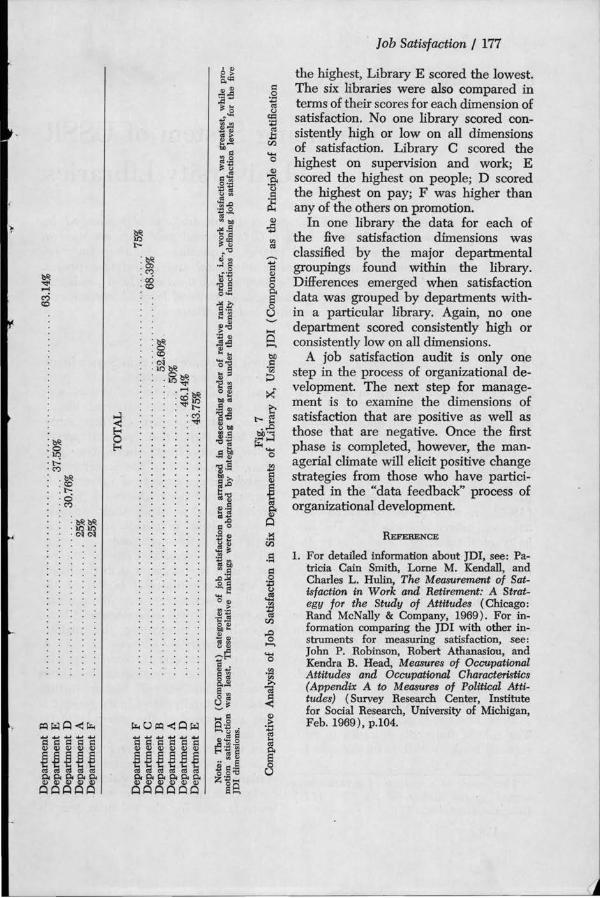
If the data is rearranged to emphasize the multidimensional nature of job satisfaction among the departments within a single library, each component of job satisfaction can be brought into focus. For example, an examination of Figure 7 reveals that work satisfaction is greatest for all six departments of Library X. In descending order are people, supervision, pay, and promotion. If this analysis is verified, then the promotional policies of Ubrary X should be re-evaluated. In this way, problem areas can be identified, whether they occur within a few or all departments of a library.
It is possible that this configuration of the data will change in the future. Cross-sectional surveys will aid in the determination of static levels of job satisfaction, but for the establishment of
Work Supervision People Pay Promotion Total
Supervision Promotion Work People Pay Total
People Promotion Work Supervision Pay Total
Pay Work Supervision People Promotion Total
People
Percent Satisfied
0 10 20 30 40 50 60 70 80 90 100
DEPARTMENT F
0 0 0 0 0 0 0 0 0 0 0 0 0 0 0 0 •• • ••••••••••••••••••••••• 0 • • • 0 0 0 . 0 0 0 0 0 0 0 0 . 0 0 0 0 0 0 0 0 0 0 0 0 0 0 0 0 0 0 0 0 0 0 0 0 0 ° 0 0 ° 0• 0 ° 0 0. 0. 0 0 100%
0. 0 0 0 . 0 0 0 0 0. 0 0. 0 0 0 0 •• 0 0 25% 0 •• 0 0 0 0 0 0 0 0 0 0 0 . 0 0 0 0 0 0 0 0 25%
75% 75%
• • • • 0 0 0 0 • 0 0 • 0 • • • • • • • • 0 75%
DEPARTMENT C 73.69%
•• 0 0 0 0 0 0 0 0 0 • • 0 0 0 0 0 •• 0 0 0. 0 0 0 0. 0 0 •••• 0 0 • • 0 0 0 0 0 • • 0 0 0 0 0 0 0 0 0 0 0 •• 0 0 . 0 0. 68.40% •• 0. 0 0 0. 0 . 0 • • • 0 • • 0 0. 0 . 0 ••• 0 •• 0 0 0 . 0. 0 0 0 0 . 0 0 0 0 ••• 0 0 0 0 0 0 0 0. 0. 0 60.53% • 0 ••• 0 0 0 0 0 0 •• 0 0 . 0 0 . 0 0 . 0 . 0 •• • 0 0. 0 0 •• 0 •• 0 0 0 0. 0 45.26% 0 0 0 0 • • 0 0 . 0 0 0. 0 0 0 0 0 •• 0 0 0 0 0 0. 0 0 0 •••• • 0 0 0 0 0 42.09% 0. 0 0 0 0 0 0 0 . 0 0 0 . 0 . 0 0 0 0 0 0 . 0 0 0 0 0 . 0 0 0 0 0 0 0 ••• 0 0 0 0 0 0 0 0. 0 • • 0 •• 0 . 0 0 0 0 0 0 ° 0 • 68.39%
DEPARTMENT B
0 0 0 0 0 0 0 0 0 0 0 0 0 0 0 . 0 0 0 0 0 0 0 0 0 0 0 0 0 0 0 0 0 0 0. 0. 0 0 0 . 0 0 0 0 •• 0. 0 •• 0. 0. 0 0 0 0 0 0 0 65.78% 0. 0 0. 0 0. 0 0 . 0 0 • • • 0 0 0 0 0 0 0 0 0. 0 ••• 0. 0 •• 0. 0 • ••• 0 0 0. 0 0 0. 0 0 0 0 0 0 0. 0 . 0 0 63.14% 0 0 0 0. 0 0 0 0 •• 0 0 •• 0 0 0 0 0 0 0 0 0 0. 0. 0 0 0 • • 0 0 ••• 0 . 0 ••••• 0. 0. 0 0 0 •• 0 0 0 57.89% • 0 0 0 0 0 0 0 0 0 0 0. 0 0 0 • • 0 0 0 0 0 0. 0 0 •• • • 0 0 0. 0 ••• 0 0 0 0. 0. 47.37% • 0 0. 0 •• 0 0 •• 0 0 0 0 0. 0 0. 0 0. 0 0 0 0 0 0 0 •• 0 0 ••• 0 0 0 0 0 • • •• 47.36% • 0 •• 0 0 0 • • 0 0 0 0 0 0 0 0 0 0 0 ••• 0 0. 0 0. 0 . 0. 0 •• • 0. 0 0 •••• 0 0 •••• 0 52.60%
DEPARTMENT A
0 0 0 0 0 0 0 0 0 0 0 0 0 0 0 0 0 0 0 0 0 0 0 0 0 0 0 0 0 0 0 0 0 0 0. 0 0 0 0 0 oo 0 0 . 0 . 0 0. 0 0 0 0 0 0 0 0 0 0 0 0 . 0 0 0 0 •• 0. 0 0 •••••••• 0. 0 0 0 •• 0 0 • • •• • 0 • • 100%
0 0 0 0 0 0 0. 0 0 0 0 0 0 0. 0 •• 0 0. 0 25%
50% 50%
50%
DEPARTMENT D
75%
69.21%
:~ :""'"! . c:o ·"<t4
: ~ ·0 · lr.l
Job Satisfaction I 175
dynamic levels only longitudinal, indepth studies can account for varying levels of job satisfaction over time. For this purpose the JD I instrument can be employed to provide a convenient measuring device for gauging the respective levels of job satisfaction among all categories of the job setting.
SUMMARY AND CONCLUSIONS
This paper defines employee job satisfaction as the feelings an employee has about his pay, work, promotion opportunities, co-workers, and supervisor. From a managerial perspective, it is best to view satisfaction as a multidimensional phenomenon because the determinants and consequences of each dimension are likely to be different.
Managerial performance is related to employee satisfaction, employee productivity, and organizational effectiveness. In fact, managerial performance has a causal influence upon employee satisfaction and employee productivity. As pointed out, one dimension of satisfaction is the feeling an employee has about his supervisor; and the actions of managers in regard to leading, staffing, coaching, and counseling have a direct influence upon employee satisfaction as well as employee productivity.
The influence of employee productivity upon organizational effectiveness is direct. If the work output is low, then obviously the entire organization will not be as productive as it might have been. The impact of employee satisfaction upon organizational effectiveness, in contrast, is not so clear cut. In the short run, employees can be dissatisfied and still be highly productive. In the long run, however, dissatisfied employees tend to adopt either "fight" or "Hight" patterns of behavior.
In this study the satisfaction of the employees of six libraries was indexed. After data was collected, the organizations were ranked in terms of their overall satisfaction scores-Library D was
Deparbnent F Deparbnent A Department E Department C -Department B Department D
Deparbnent F Deparbnent D Department B Deparbnent E Department A Department C
Department F Department C Deparbnent D Department A Deparbnent B Department E
Department A Department E Deparbnent B Department D Department C Department F
Department C
Percent Satisfied
0 10 20 30 40 50 60 70 80 90 100
WORK
.. .. . ...... · ........ ... .....•....••••••••••..... .... . . .. . . ... .. . .. .......... . ..... . . .. ... . . . .... .. .. 100%
.. ....... . . . ... . . .... . .. . ................. . ..... . .... ..... ... 62.50%
........ . .. ... ... . ...... .... . ..... ..... ... ................ . 60.53%
.. . ..... . . ... ..... . ...... ................. . .... ... . .. .. . 57.89% 34.56%
PEOPLE
75%
...... ... . .........................•..•••• .. ..... . ...... .. ..... ... . ..... 75%
......... . . . . . .. . ............ ... .. .. . . ... .. ..... .. . ... . ..... . .... . .. 69.21%
... ... ...... . .. ... . ...... . ................ . .. .... .. . . ........... 65.78%
.. . . ........................................ .. . . ... ...... .. . .. 62.50%
.. .... .. . .. ..... .. .......... ..... ......... ..... . . 50%
. . ..... . .. .... . . .. ... .......... ....... .... . . 45.26%
SUPERVISION
...... . . .. .... .. . ............................. ..... .. .. .. ......... . .. . .. 75%
.. .. . . .. . ......... . .... . ....... .. .............. .. 50%
. .. ............... . ... . ............ .. . ... ..... 47.37%
.. .......... . .. . ......... .... 31.25%
PAY
....... . ... . . . . ..... ........ . ............... .... . 50%
... ... .. ... . ....... .. ..... .. .. . ........ . .. . .. . 47.36%
..... .. .............. ........... ... ....... . . . 46.14%
........... .. . ..... .......... . .. ... ..... 42.09% . . .......... .. ......... 25%
PROMOTION
73.69% 61.53%
68.40%
100%
: ~ .0 -~ . t·C')
- ~ . c:o .t-: · 0 . C')
~ t-
· ~
:m - ~ . 00 . c:o
Job Satisfaction I 177
the highest, Library E scored the lowest. The six libraries were also compared in terms of their scores for each dimension of satisfaction. No one library scored consistently high or low on all dimensions of satisfaction. Library C scored the highest on supervision and work; E scored the highest on people; D scored the highest on pay; F was higher than any of the others on promotion.
In one library the data for each of the five satisfaction dimensions was classified by the major departmental groupings found within the library. Differences emerged when satisfaction data was grouped by departments within a particular library. Again, no one department scored consistently high or consistently low on all dimensions.
A job satisfaction audit is only one step in the process of organizational development. The next step for management is to examine the dimensions of satisfaction that are positive as well as those that are negative. Once the first phase is completed, however, the managerial climate will elicit positive change strategies from those who have participated in the "data feedback" process of organizational development.
REFERENCE
1. For detailed information about JDI, see: Patricia Cain Smith, Lorne M. Kendall, and Charles L. Hulin, The Measurement of Satisfaction in Work and Retirement: A Strategy for the Study of Attitudes (Chicago: Rand McNally & Company, 1969). For information comparing the JDI with other instruments for measuring satisfaction, see: John P. Robinson, Robert Athanasiou, and Kendra B. Head, Measures of Occupational Attitudes and Occupational Characteristics (Appendix A to Measures of Political Attitudes) (Survey Research Center, Institute for Social Research, University of Michigan, Feb. 1969), p.104.
Recommended