A Student’s View of Return On Investment
A Micro Perspective
www.bobp.biz
MICROECONOMICS focuses on the behavior of individuals in making decisions about the allocation of limited resources.
MACROECONOMICS looks at the performance, structure, behavior, and decision-making of the whole economic system.
MICROECONOMICS VERSUS MACROECONOMICS
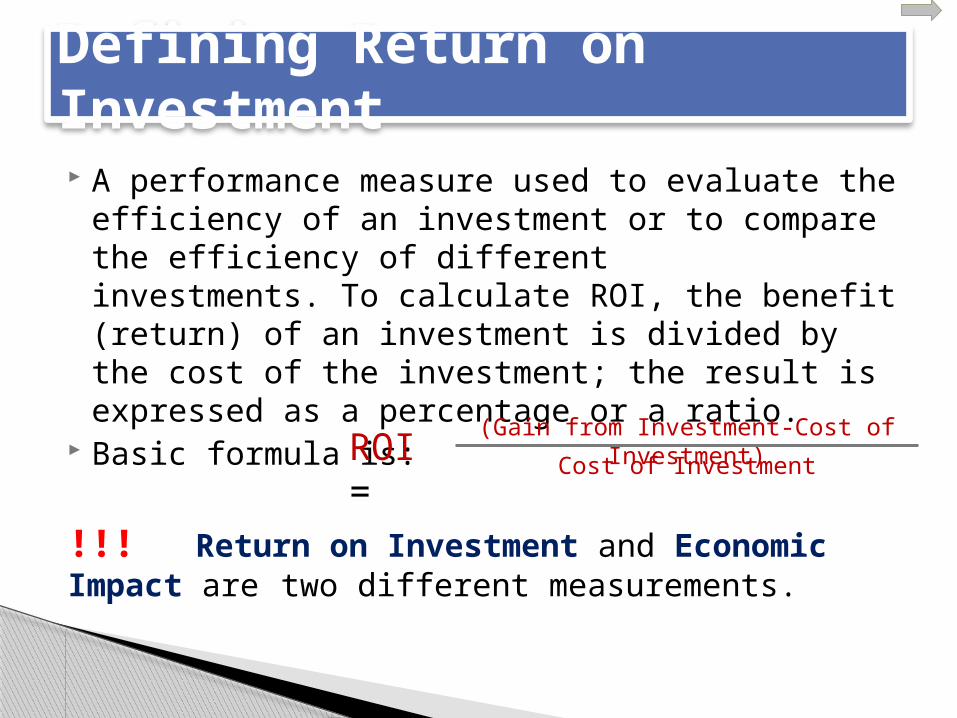
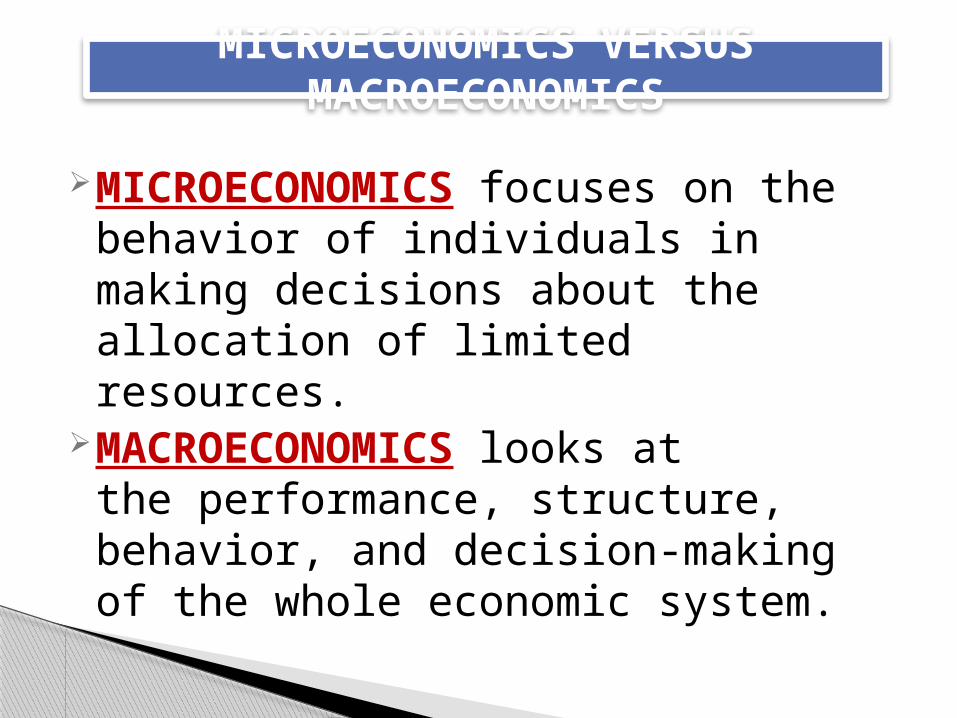
A performance measure used to evaluate the efficiency of an investment or to compare the efficiency of different investments. To calculate ROI, the benefit (return) of an investment is divided by the cost of the investment; the result is expressed as a percentage or a ratio.
Basic formula is:
!!! Return on Investment and Economic Impact are two different measurements.
Defining Return on Investment
ROI =(Gain from Investment-Cost of Investment)
Cost of Investment
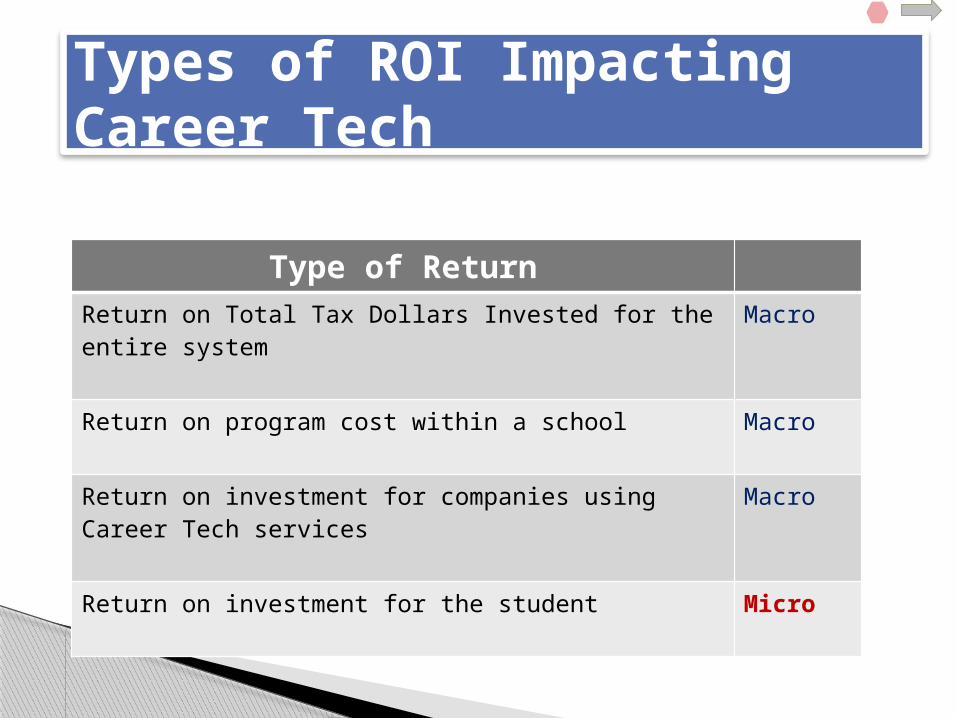
Type of ReturnReturn on Total Tax Dollars Invested for the entire system Macro
Return on program cost within a school Macro
Return on investment for companies using Career Tech services Macro
Return on investment for the student Micro
Types of ROI Impacting Career Tech
Return on Investment and Economic Impact for Career Tech programs has been an important topic in recent years. Much of the discussion has focused on attempting to show the macroeconomic impact of training programs to taxpayers, communities, and all stakeholders. These discussions are important and relevant, but the many facets and moving parts involved in macroeconomics often makes it difficult to make definitive conclusions about economic impact and concrete returns on investment.
Macroeconomics: What’s the Big Picture
Microeconomics is about the direct impact of decisions to the individual. This presentation will focus on the micro, instead of the macro, impact to stakeholders and students using Career Tech programs. In macroeconomics, the concern is the overall level or rate of economic activity, and the activities that that cause it to change. Microeconomics is concerned with choices among alternatives, and their impact on an individual.
Microeconomics: What’s in it for me
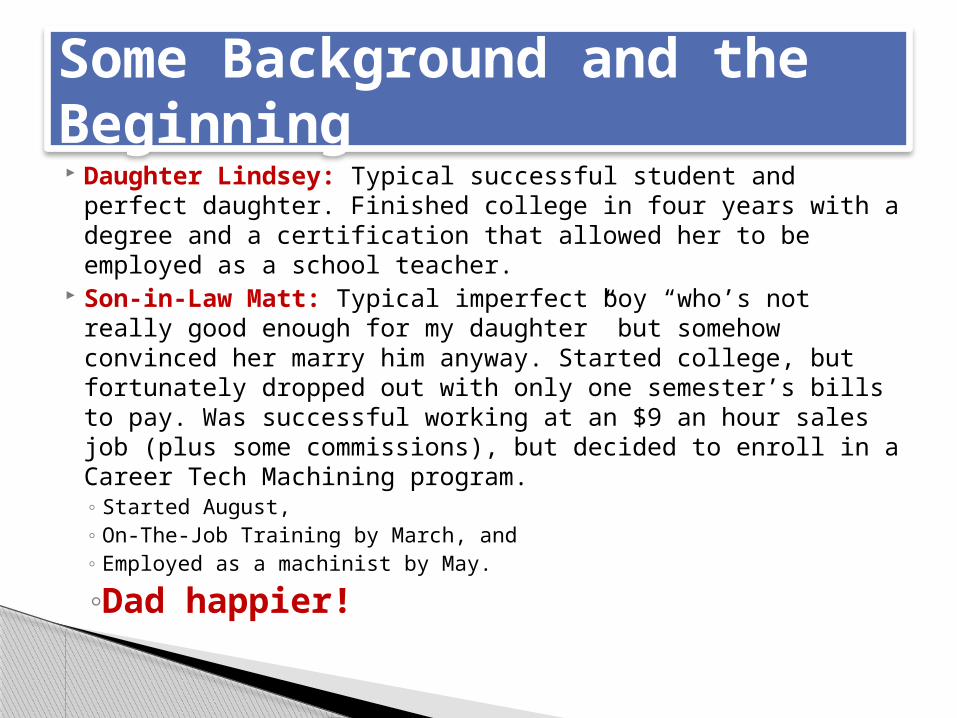
Daughter Lindsey: Typical successful student and perfect daughter. Finished college in four years with a degree and a certification that allowed her to be employed as a school teacher.
Son-in-Law Matt: Typical imperfect boy “who’s not really good enough for my daughter” but somehow convinced her marry him anyway. Started college, but fortunately dropped out with only one semester’s bills to pay. Was successful working at an $9 an hour sales job (plus some commissions), but decided to enroll in a Career Tech Machining program. ◦ Started August, ◦ On-The-Job Training by March, and ◦ Employed as a machinist by May.
◦Dad happier!
Some Background and the Beginning
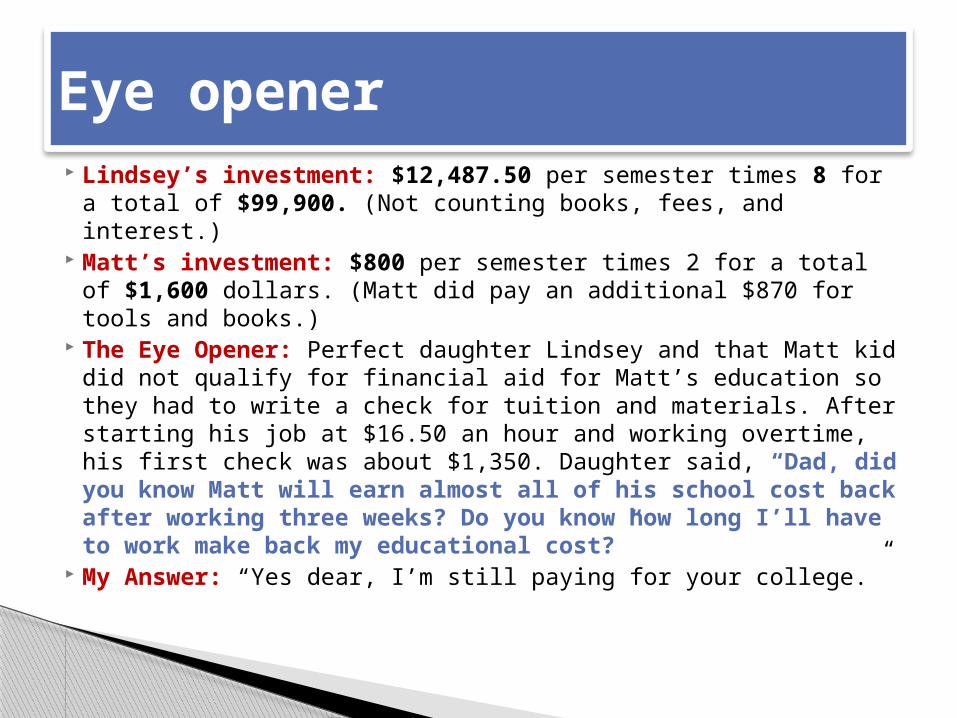
Lindsey’s investment: $12,487.50 per semester times 8 for a total of $99,900. (Not counting books, fees, and interest.)
Matt’s investment: $800 per semester times 2 for a total of $1,600 dollars. (Matt did pay an additional $870 for tools and books.)
The Eye Opener: Perfect daughter Lindsey and that Matt kid did not qualify for financial aid for Matt’s education so they had to write a check for tuition and materials. After starting his job at $16.50 an hour and working overtime, his first check was about $1,350. Daughter said, “Dad, did you know Matt will earn almost all of his school cost back after working three weeks? Do you know how long I’ll have to work make back my educational cost?”
My Answer: “Yes dear, I’m still paying for your college.”
Eye opener
At the same time my son-in-law was starting his new career, a leadership team at school was working on identifying and defining performance measures. This group met for several months and had lively and mostly constructive conversations.
The Holy Grail of performance measures was to find out how to gauge Economic Impact.
We made some progress, but the Grail is still elusive.
What we learned with the leadership team
Some performance measures can be determined based information we already collected
Some measure are important for internal planning Some performance measures must be extrapolated
from information into reports Some measures might be important for potential
customers
Some conclusion from the Leadership team
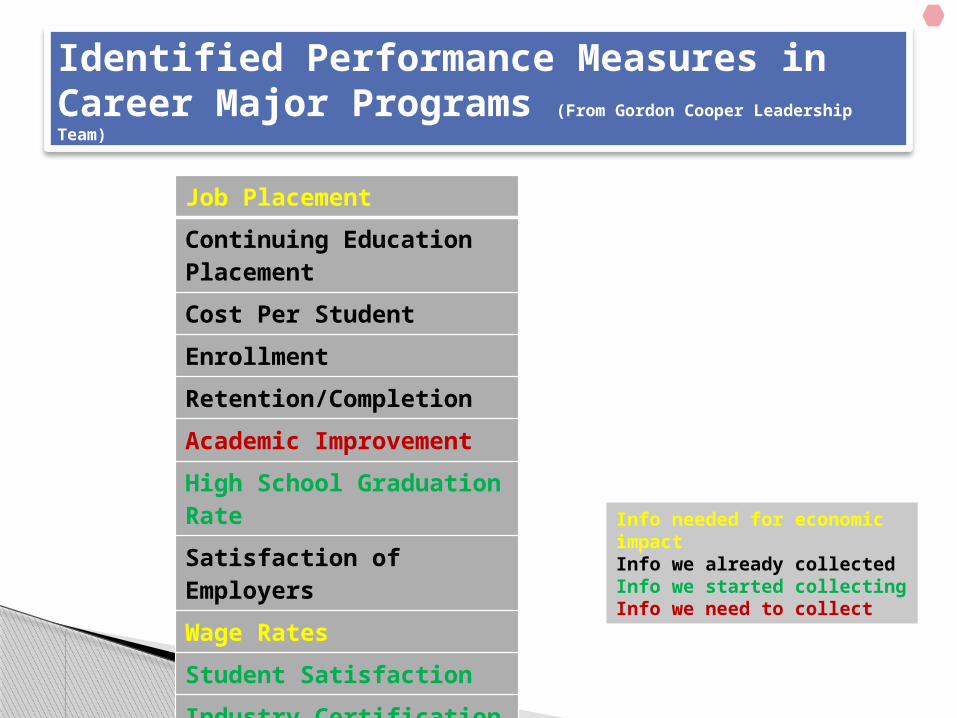
Identified Performance Measures in Career Major Programs (From Gordon Cooper Leadership Team)
Job Placement
Continuing Education Placement
Cost Per Student
Enrollment
Retention/Completion
Academic Improvement
High School Graduation Rate
Satisfaction of Employers
Wage Rates
Student Satisfaction
Industry Certification Pass Rate
Info needed for economic impactInfo we already collectedInfo we started collectingInfo we need to collect
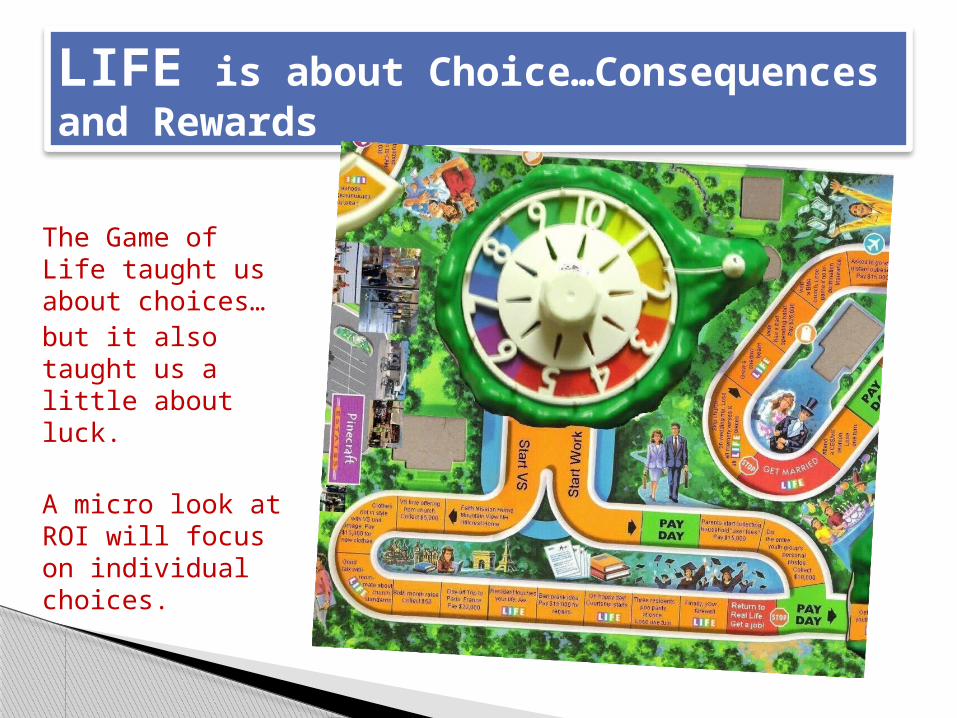
LIFE is about Choice…Consequences and Rewards
The Game of Life taught us about choices…but it also taught us a little about luck.
A micro look at ROI will focus on individual choices.
We DID NOT set out to develop this performance measure
But it seemed to be something that was relatively concrete
It also seem fairly easy to determine ROI for the student might not satisfy all
stakeholders, but might be useful for student recruitment and for student decision-making
ROI for the Student
What we learned
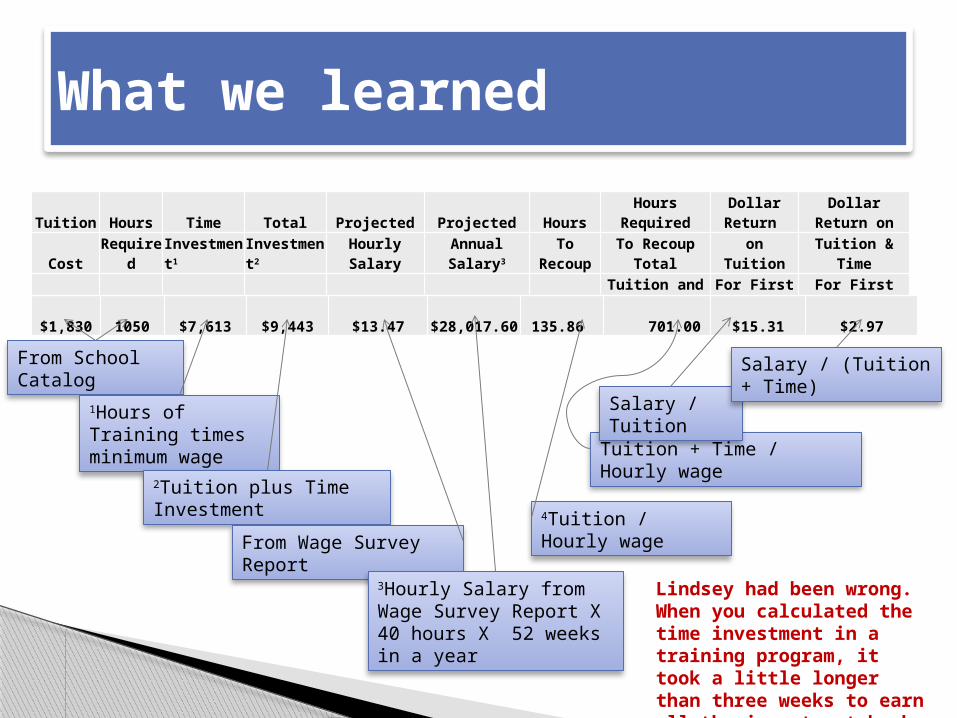
Tuition Hours Time Total Projected Projected Hours Hours Required Dollar Return Dollar Return onCost Required Investment1 Investment2 Hourly Salary Annual Salary3 To Recoup To Recoup Total on Tuition Tuition & Time
Tuition4 Tuition and Time For First Year For First Year
$1,830 1050 $7,613 $9,443 $13.47 $28,017.60 135.86 701.00 $15.31 $2.97
From School Catalog
1Hours of Training times minimum wage
2Tuition plus Time Investment
From Wage Survey Report
3Hourly Salary from Wage Survey Report X 40 hours X 52 weeks in a year
4Tuition / Hourly wage
Tuition + Time / Hourly wage
Salary / Tuition
Salary / (Tuition + Time)
Lindsey had been wrong. When you calculated the time investment in a training program, it took a little longer than three weeks to earn all the investment back.
$354 40 $290 $644 $11.09 $23,067.20 31.92 58.07 $65.16 $35.82
Comparisons
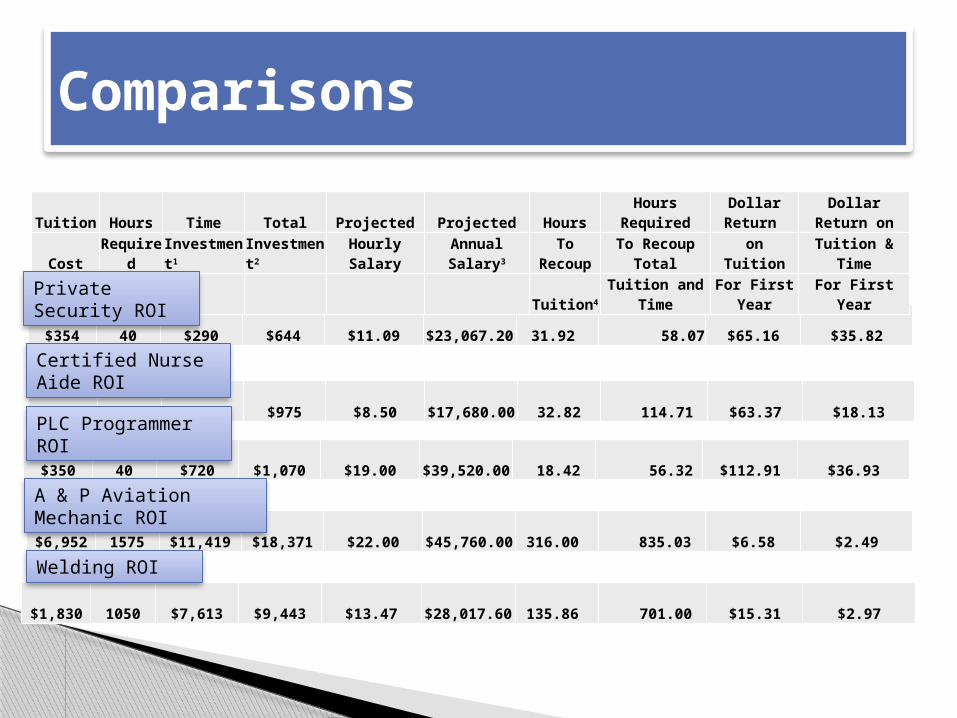
Tuition Hours Time Total Projected Projected Hours Hours Required Dollar Return Dollar Return onCost Required Investment1 Investment2 Hourly Salary Annual Salary3 To Recoup To Recoup Total on Tuition Tuition & Time
Tuition4 Tuition and Time For First Year For First Year
$279 96 $696 $975 $8.50 $17,680.00 32.82 114.71 $63.37 $18.13
$350 40 $720 $1,070 $19.00 $39,520.00 18.42 56.32 $112.91 $36.93
$6,952 1575 $11,419 $18,371 $22.00 $45,760.00 316.00 835.03 $6.58 $2.49
$1,830 1050 $7,613 $9,443 $13.47 $28,017.60 135.86 701.00 $15.31 $2.97
Private Security ROI
Certified Nurse Aide ROI
PLC Programmer ROI
A & P Aviation Mechanic ROI
Welding ROI
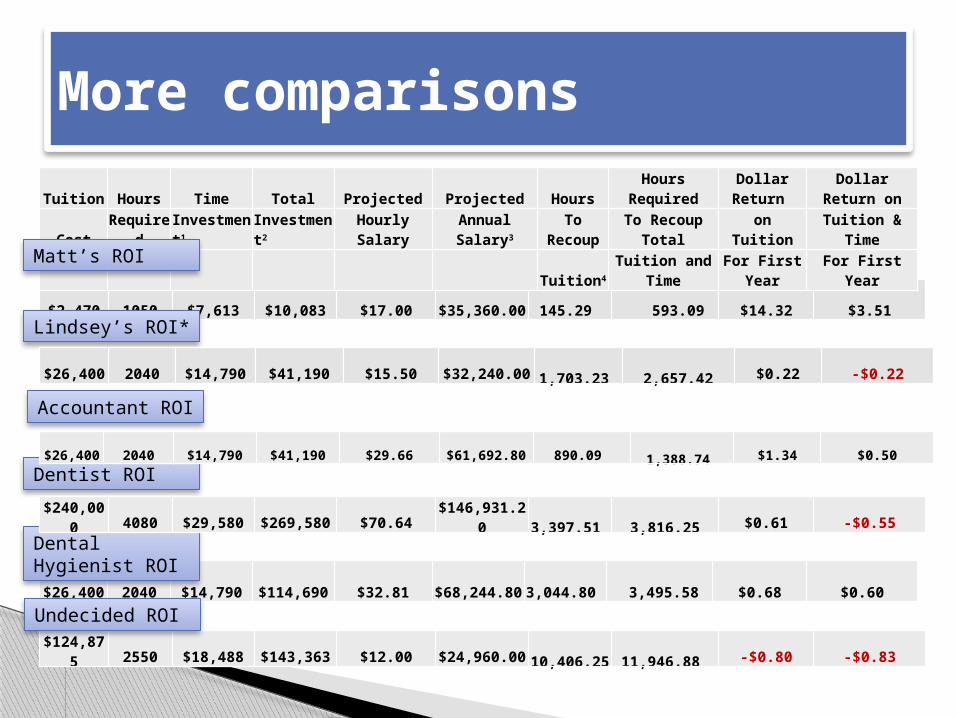
More comparisons
$2,470 1050 $7,613 $10,083 $17.00 $35,360.00 145.29 593.09 $14.32 $3.51
Tuition Hours Time Total Projected Projected Hours Hours Required Dollar Return Dollar Return onCost Required Investment1 Investment2 Hourly Salary Annual Salary3 To Recoup To Recoup Total on Tuition Tuition & Time
Tuition4 Tuition and Time For First Year For First Year
$26,400 2040 $14,790 $114,690 $32.81 $68,244.80 3,044.80 3,495.58 $0.68 $0.60
Matt’s ROI
Lindsey’s ROI*
Accountant ROI
Dentist ROI
Dental Hygienist ROI
$240,000 4080 $29,580 $269,580 $70.64 $146,931.20 3,397.51 3,816.25 $0.61 -$0.55
$124,875 2550 $18,488 $143,363 $12.00 $24,960.00 10,406.25 11,946.88 -$0.80 -$0.83
Undecided ROI
$26,400 2040 $14,790 $41,190 $15.50 $32,240.00 1,703.23 2,657.42 $0.22 -$0.22
$26,400 2040 $14,790 $41,190 $29.66 $61,692.80 890.09 1,388.74 $1.34 $0.50
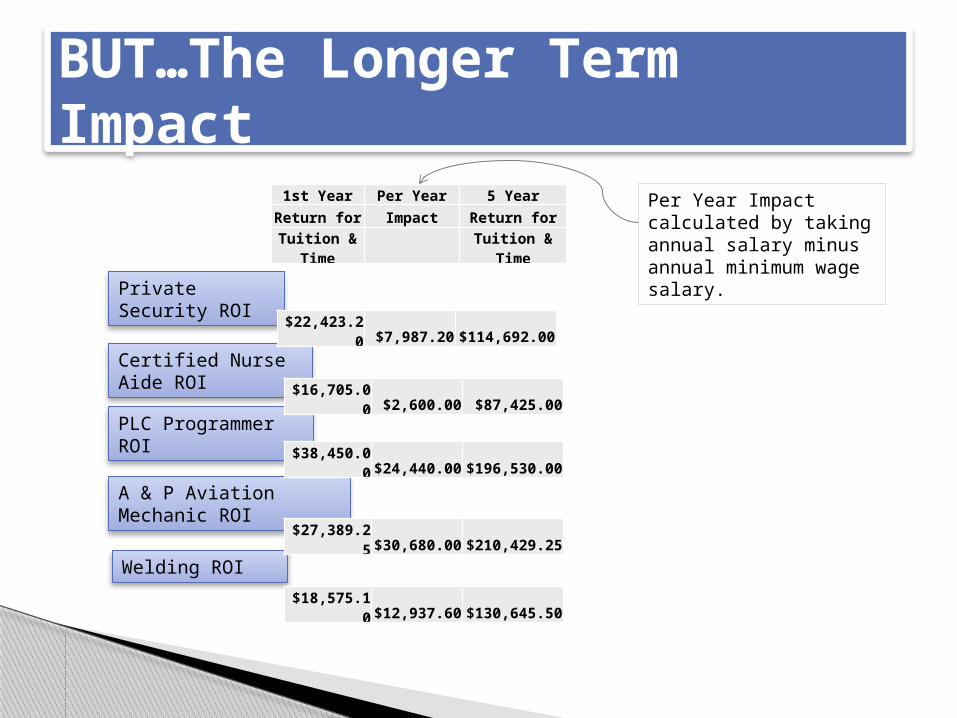
BUT…The Longer Term Impact
Private Security ROI
Certified Nurse Aide ROI
PLC Programmer ROI
A & P Aviation Mechanic ROI
Welding ROI
1st Year Per Year 5 YearReturn for Impact Return for
Tuition & Time Tuition & Time
$22,423.20 $7,987.20 $114,692.00
$16,705.00 $2,600.00 $87,425.00
$38,450.00 $24,440.00 $196,530.00
$27,389.25 $30,680.00 $210,429.25
$18,575.10 $12,937.60 $130,645.50
Per Year Impact calculated by taking annual salary minus annual minimum wage salary.
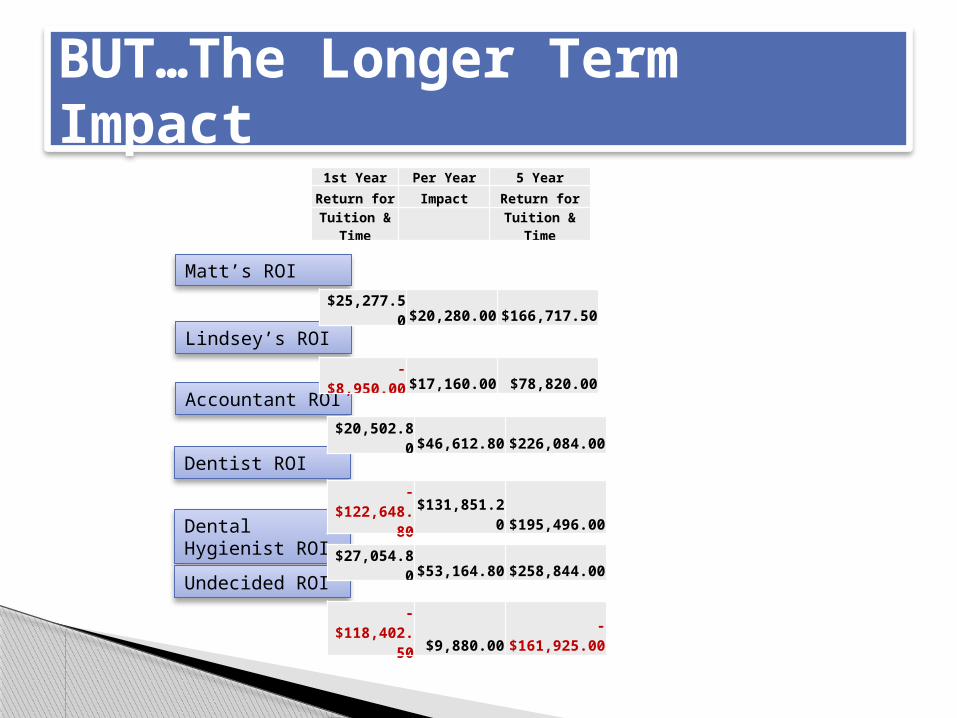
BUT…The Longer Term Impact
Matt’s ROI
Lindsey’s ROI
Accountant ROI
Dentist ROI
Dental Hygienist ROI
Undecided ROI
1st Year Per Year 5 Year
Return for Impact Return for
Tuition & Time Tuition & Time
$25,277.50 $20,280.00 $166,717.50
-$8,950.00 $17,160.00 $78,820.00
$20,502.80 $46,612.80 $226,084.00
-$122,648.80 $131,851.20 $195,496.00
$27,054.80 $53,164.80 $258,844.00
-$118,402.50 $9,880.00 -$161,925.00
Does not factor long-term earning potential Does not consider previous learning and experiences Training and education is still only a part of the puzzle related to
student success in a career A person’s pay is not the only indicator to success and fulfillmentBUT It does show a correlation between tuition cost, time investment,
and wage rates It does give a student more information to make intelligent
educational choices It does give policy makers comparisons to make program decisions
and could help students make better decisions for their future
Limitation to Student ROI
Students can be successful in a many ways. We need to be brutally honest when we provide career
counseling. Do we need to talk about educational ROI for
students?
More Questions contact: Bob Perry [email protected] Marty Lewis [email protected]
So What does all this mean?
Recommended