Concordia Seminary - Saint LouisScholarly Resources from Concordia Seminary
Master of Divinity Thesis Concordia Seminary Scholarship
3-1-1970
A Sociological Analysis of the CommuniunityImmediately Surrounding Our Savior LutheranChurch, St. Louis, MissouriKenneth HauptConcordia Seminary, St. Louis, [email protected]
Follow this and additional works at: http://scholar.csl.edu/mdiv
Part of the Practical Theology Commons
This Thesis is brought to you for free and open access by the Concordia Seminary Scholarship at Scholarly Resources from Concordia Seminary. It hasbeen accepted for inclusion in Master of Divinity Thesis by an authorized administrator of Scholarly Resources from Concordia Seminary. For moreinformation, please contact [email protected].
Recommended CitationHaupt, Kenneth, "A Sociological Analysis of the Communiunity Immediately Surrounding Our Savior Lutheran Church, St. Louis,Missouri" (1970). Master of Divinity Thesis. 71.http://scholar.csl.edu/mdiv/71


re5e.a rcie, cap` izo
CONCORDIA SEMINARY LIBRARY ST. LOUIS, MISSOURI

TABLE OF CONTENTS
Page
LIST OF TABLES iv
Chapter
I. INTRODUCTION 1
The Historical Background of the Study. . . 1 The Objectives of the Study . . . ... 2 The Scope and Limitation of the Study . . 3 The Methodology and Sources 4 The Organization of the Material 5
II. THE PHYSICAL CHARACTERISTICS OF THE COMMUNITY 6
The Geography of the Community 6 The Housing of the Community 8 The Business and Industry of the Community. 14 The Churches of the Community 15 The Schools of the Community 18 The Parks and Playgrounds of the Community. 19 Summary 20
III. THE POPULATION STATISTICS OF THE COMMUNITY. . 21
The General Character of the Population: Race, Sex, Age 21 The Familial Characteristics of the Population 23 The Employment Statistics of the Population 25 The Educational Statistics of the Population 27 Smimamy 23
IV. THE PROBLEMS AND NEEDS. OF THE COMMUNITY . . 30
The Problem of Crime in the Community . . 30 The Need for Economic Development in the Community 32 The Miscellaneous Problems and Needs of the Community 35 Summary 36
V. THE RESOURCES OF THE COLEAUNITY 37
Community Organizations within Census Tract 6-D e 37 Metropolitan Federation of Churches . • • 6 38 Summary 39

Page
FOOTNOTES 40
APPENDIX A 45
APPENDIX B 46
APPENDIX C 47
APPENDIX D 56
APPENDIX E 57
APPENDIX F . 53
APPENDIX G 59
BIBLIOGRAPHY 69

LIST OF TABLES
Table
1. Churches of and near Census Tract 6-D
Page
16
2. Marital Status of all Persons 14 Years and Over by Age and Sex--Census Tract 6-,.D 23

CHAPTER I
INTRODUCTION
The Historical Background of the Study
The study which here presents a sociological analysis of
the immediate community surrounding Our Savior Lutheran Church
is an outgrowth of the September 30, 1969 meeting of the Theo-
logical Education Research Committee' of Concordia Seminary,
St. Louis, Missouri. At this meeting it was moved and passed
"to support Ken Haupt's offer to drop the writing of his research
Paper (already in progress this quarter), to request that a
group of IV year students be allowed to write a joint paner
in the form of a concrete curriculum with theological justifi-
cation, and ti-at this paper he allowed to be used to meet the
requirement of their senior research elective . . . ."2
Dr. John S. Damm, Executive Director of Research for TERC,
arranged a dinner meeting on November 25, 1969 in which this
writer discussed with intereste^ faculty members of Concordia
Seminary various areas of interest common to TERC and to himself.
Present at the meeting, besides Dr. Damm and the writer himself,
were Professor Arthur Vincent, Director of Continuing Education
and Associate Professor of Homiletics at Concordia Seminary,
Louis, Missouri; Professor Paul. Goetting, Assistant Professor
of Practical Theology at Concordia Seminary; and Mr. James
Cross, Secretary for Church and Community of the Lutheran
Church--Missouri Synod.

2
Two conclusions were engendered by the meeting of Novem-
ber 25. The first was Professor Goetting's offer to encourage
his research-elective advisees to participate with this writer
in a joint-research project aimed toward an action-reflection
approach to theological education. The second conclusion of
this meeting was the writer's decision to research ways and
means with which Concordia Seminary and Our Savior Lutheran
Church, St. Louis, Missouri, might develop a cooperative minis-
try within the immediate neighborhood of the congregation.
The Objectives of the Study
Two basic objectives underlie the proposal of this coopera-
tive ministry.
The first objective, from Our Savior Lutheran Church's
point of view, is to develop a stronger witness of the Christian
Gospel through a ministry of involvement in the total needs
of its surrounding community. In a discussion with this writer
on November 29, 1969 regarding the aboire proposal, Dr. Ralph
Klein, Assistant Professor of Old Testament Exegesis at Concor-
dia Seminary and Interim Pastor of Our Savior Lutheran Church,
suggested that without some sort of cooperative effort the
congregation (consisting mostly of white, elderly, suburban
commuting members) may be forced soon to disseminate. He ex-
pressed optimism, on the other hand, that a cooperative effort
between Concordia Seminary and Our Savior Church might encourage
the development of a community congregation and of a ministry

3
concerned with the needs of the community.
The second objective of such a proposed cooperative minis-
try, from the viewpoint of Concordia Seminary, is to provide
the opportunity for students and/or faculty members to encounter
the theological enterprise within the context of a specific
congregation's urban ministry. In an interview with this writer
on January 20, 1970 Dr. John Tietjen, President of Concordia
Seminary, expressed general agreement with this objective.
He suggested, however, that Concordia Seminary's objective,
as he sees it, need not be limited to a specific congregation
but might be accomplished just as well in a cooperative effort
between Concordia and several Lutheran congregations of a given
community. In this regard he suggested also the possibility
that a "core staff" might be developed to perform the pastoral
duties of the congregations. Dr. Tietjen was clear to point
out that he offered these suggestions not as a superior alter-
native, but rather as clarification of the general nature of
Concordia Seminary's objective as he saw it. He expressed his
appreciation that the "Our Savior Proposal' was being researched,
and he expressed also his interest in the results of the study.
The Scope and Limitation of the Study
The scope of this study must include three parts. Firstly,
a careful analysis of the community surrounding Our Savior
Lutheran Church must be made. Such an analysis ought to delineate

the geographical information as well as the needs and the re-
sources of the community. Secondly, an analysis of Our Savior
Congregation is important, dealing mainly with the congregation's
understanding of, its willingness to, and its ability for minis-
try in this community. Thirdly, a study of theological educa-
tion is necessary in order to ascertain curricular models which
are capable of fulfilling functions commensurate to the objec-
tives of Concordia Seminary as well as to those of Our Savior
Lutheran Church.
Regarding the study as a whole, this writer has limited
himself to the first part, namely the analysis of the community
surrounding Our Savior Lutheran Church. The necessity of this
limitation became evident when none of Professor Goettines
advisees chose to take Dart in a joint study of this type.
It is the hope of this writer that the results of the study
here presented will serve, nevertheless, a necessary, albeit
prelimjnary, step toward completing the larger project.
The Methodology and Sources
Two basic methods of research were used. The first was
personal inquiry, involving discussions and interviews with
community leaders and residents as well as with certain city
employees. The second method of research employed was the study
of acquired documents dealing with the various categories of
community statistics.

As to the sources used in this analysis, it is necessary
to point out that many of the sources consulted varied both
in the categories used and in the areas covered. This often
made for great difficulty in correlating and interpreting various
statistics. The writer has correlated the information as much
as possible, giving the greatest amount of consideration to
those statistics dealing with the immediate community surrounding
Our Savior Church.
The Organization of the Material
The materials presented in this sociological analysis of
the community surrounding Our Savior Lutheran Church, St. Louis,
Missouri, are organized into four chapters. Immediately following
this Introduction, Chapter II provides the physical characteris-
tics of the community, giving particular emphasis to its housing
statistics. Chapter ITT presents all data pertaining to popu-
lation statistics. Chapter IV provides some of the major
problems and needs of the community, while Chapter V classifies
the resources of the community.

CH..APTER II
THE PHYSICAL CHARACTERTSTICS OF THE COMMUNITY
The Geography of the Community
Our Savior Lutheran Church, St. Louis, Missouri, is located
on the southeast corner of St. Louis Avenue and Abner Place,
one block west of Union Boulevard.
For purposes of research the community surrounding Our
Savior Church must be divided into several areas differing both
in shape and in size. Since these areas intersect, it is not
possible, for purposes of statistics, to determine any one geo-
graphical area which can serve as the basis for statistical
comparisons. It is important, therefore, that we delineate
carefully those areas pertaining to the community surrounding
Our Savior Lutheran Church.
The most immediate area germane to our study is "Paulyblock
7-06,"3 covering the area from Union on the east to Belt on the
west to Wabada on the south to St. Louis Avenue on the north.
This area covers seven large square blocks. If "Paulyblock 7-11"
is added, the expanded area covers eighteen square blocks,
extending from Union to Belt and from Wabada to Natural Bridge.
For reasons which will be explicated throughout this study, the
latter area provides natural geographical boundaries of the
community immediately surrounding Our Savior Church (See Apptridix A).

7
The next larger geographical area, for which the greatest
number of statistics exist, is Census Tract 6-D. This area
extends from Kingshighway on the east to Belt on the west, and
from Natural Bridge on the north to Maffft (east of Arlington)
and to Wabada (west of Arlington) on the south (See Appendix L).
As this study will show later, Census Tract 6-D is a useful
geographical area particularly when compared with other census
tracts or to the city as a whole. When one focuses on Census
Tract 6-D as a unit, it becomes clear that the area east of
Union Boulevard and the area west of Union Boulevard differ
in significant ways, foremost of which is housing. This will
be carefully demonstrated.
The third geographical area surrounding Our Savior Lutheran
Church with which this study deals is the Wells--Goodfellow
District of the Human Development Corporation. This area
"is bounded by Natural Bridge, Union Boulevard, the Mark Twain
Expressway, Kingshighway Boulevard, Easton Avenue, Union Boulevard,
Page Avenue, and the city limits"4 (See Appendix A). The fourth and largest geographical area to be considered,
short of the City of St. Louis itself, is District Seven of the
St. Louis Police Department. District Seven extends from Forest
Park to Natural Bridge, from Kingshighway to the city limits
(See Appendix A:).

8
The Housing of the Community
Since the greatest amount of housing information is obtain-
able through only the 1960 Census,5 many of the statistics here
presented will cover all of Census Tract 6-D. Wherever possible
the statistics have been broken down so as to indicate the totals
and percentages for the areas east and west of Union Boulevard.
In some instances the area west of Union Boulevard is divided
into two sections, one north of St. Louis Avenue and one south
of St. Louis Avenue.
In 1960 there were 2,316 housing units in Census Tract 6-D.6
Of these 2,316, 56 percent (1,296) 1,- ere located west and 44
percent (1,020) were east of Union Boulevard. Within the area
of Census Tract 6-D that is west of Union 825 housing units
(35.6 percent of Census Tract total) were north of St. Louis
Avenue, while 471 (20.4 percent) were located south of St. Louis
Avenue.7
The number of occupied housing units in Census Tract 6-D
was 2,217, 95.7 percent of the total. These fell into two major
categories: owner-occupied and renter-occupied. Those housing
units which were owner-occupied comprised 44.5 percent (986)
of the total. Renter-occupied housing units made up 55.5 per-
cent (-1,231)! of the total.8
There are very few large apartment buildings in Census
Tract 6-D. According to the 1960 Census 91.1 percent of the
2,316 total housing units were located in structures comprising
no more than four units each. It also shows that 43.9 percent

9
(1,015) of all units were in one-unit structures, while 26.6
percent (616) were located in two-unit structures. A total
of 70.5 percent (1,631) of all housing units in Census Tract
6-D were in one-unit or two-unit structures.9
It does not appear that these statistics pertaining to the
number of units per housing structure have changed much in the
past ten years. In the Neighborhood Handbook for-Human Develop-
ment Corporation Tells-Goodfellow District, printed in 1968,
the district is described as containing "a good percentage of
owner occupied single family homes. There are also a number of
four family flats and apartment houses... ."10 Also, the
"Zoning Map" of the City of St. Louis in the offices of the
City PlanninR. Commission reflects the same coding and building
regulations for Census Tract 6-D as existed a decade ago.11
In 1960 Census Tract 6-D had 328 (14.1 percent) housing
units with an overcrowded condition of more than one person
per room. Of these 328 the area west of Union Boulevard con-
tained 62 percent (204): 29.5 percent south and 32.5 percent
north of St. Louis Avenue. Per total housing units, therefore,
the Dart of Census Tract 6-D west of Union Boulevard is more
crowded than its eastern counterpart. 7ithin the western part,
that area south of St. Louis Avenue has the greater percentage
of overcrowdedness per total number of housing units (compare
with total housing unit figures on page 8 above).12

10
The types of construction far all housing structures in
Census Tract 6-D fall into two major categories. The larger
of these is that of brick construction, which includes all
housing structures east of, and a majority of those west of,
Union Boulevard. The other type is frame construction, which
includes a significant percentage of those housing structures
west of Union Boulevard.13
Regarding the value of the housing units in Census Tract
6-D, one is dependent almost entirely on the statistics of the
1960 Census. In 1960 the average value of the 986 owner-occupied
housing units in Census Tract 6-D was 19,500. West of Union
Boulevard the average was somewhat lower at 3e,321 per housing
unit. Within the part of Census Tract 6-D west of Union Boule-
vard, the area north of St. Louis Avenue had an average of 39,500
per housing unit, while the area south of St. Louis Avenue
averaged 37,850 per housing unit.14 Hence, the area of Census
Tract 6-D west of Union Boulevard and south of St. Louis Avenue
had the lowest value per housing unit.of those areas considered,
significantly below the average for the census tract.
Also, the average contracted rent in 1960 was lower for
that part of Census Tract 6-D west of Union Boulevard. While
the average rent for the census tract was $59 per month per
housing unit, the average for all renter-occupied housing units
west of Union Boulevard was 354.80 per month per housing unit.
West of Union Boulevard, that area south of St. Louis Avenue,

11
with an average of $54.25, was just slightly below the $55.55
average of its northern counterpart.15
What the value statistics of Census Tract 6-D are at pre-
sent would be extremely difficult, if not impossible, to ascer-
tain. The most significant reason for this is the construction
of several new single-family housing units within the census
tract during the past ten years. A significant number of these
comprise a modern housing development of one-family. ranch-level
and split-level homes, valued significantly higher than the av-
erage for Census Tract 6-D. The location of this development
is east of Union Boulevard and north of St. Louis Avenue.
As to the condition of the housing units in Census Tract 6-D,
"Table H-1" of the 1960 Census is very informative. It shows
that of the 2,316 housing units in the census tract, 2,090,
or 90.4 percent, were classified "sound" as compared with 226
"deteriorating" or lailapidated" units. Of those 226 unsound
units 193 (8.3 Percent) were classified as "deteriorating,!!
while 33 (1.3)percent were listed as "dilapidated."16
The location of these unsound units is significant. All
but six of the 193 "deteriorating!'' and all 33 "dilapidated"
housing units were west of Union -Boulevard. In addition, 22
(66.7 percent) df the 33 "dilapidated;' and 164 (84.9 percent)
of the 193 "deteriorating" units were west of Union and north
of St. Louis Avenue.17
The 1960 Census provides detailed information regarding
the housing units of specifically non-white occupants. Table Two

12
indicates that 1,289, or 55.6 percent, of the housing units
in Census Tract 6-D were occupied by non-whites. Of all units
(1,020) east of Union Boulevard 74.2 percent (757) had non-white
occupants, while only 41 percent (532) of the 1,296 housing
units west of Union were non-white occupied. Of those units
located west of Union Boulevard only 27 percent (223 of 825)
of those north of St. Louis Avenue had non-white occupants as
compared with 65.6 percent (309 of 471) located south of St.
Louis Avenue.-8
An analysis of the percentages of non-white occupied units
by area reveals a similar development as do the immediately
preceding statistics. such an analysis reveals that 58.5 percent
(757) of the total 1,289 non-white occupied housing units were
located east of Union Boulevard while 41.5 percent (532) were
west of Union. Of those west of. Union Boulevard 17.2 percent
(223) of the 1,289 were north of St. Louis Avenue; 24.3 percent
(309) were located south of the same.19
These statistics show that in 1960 the part of Census Tract
6-D that is east of Union Boulevard contained a majority of the
housing units occupied by non-whites. It also indicates that
the housing units occupied by non-whites comprised a majority
of the total housing units east of Union. In both cases, on
the other hand, the part of Census Tract 6-D west of Union
claimed only a minority. Within the part west of Union Boulevard,
the area south of St. Louis Avenue claimed the majority in both
cases.

13
The percentages of non-white occupancy for owner-occupied
and renter-occupied housing units closely approximated the total
for the entire census tract. The total housing units occupied
by non-whitesvts 1,289. Of these 44.8 percent (577) were owner-
occupied, while 55.2 percent (712) were renter-occupied. The
corresponding figures for the census tract were 44.5 percent
and 55.5 percent respectively. 20
According to the 1960 Census the non-white occupied units
comprised a higher percentage of "sound" housing than the average
for Census Tract 6-D. The number of non-white housing units in
the census tract considered to be "sound" by the Census Bureau
comprised 93.7 percent (1,207) of the 1,289 total. This compare'
with a percentage for the entire census tract of 90.4 percent.
A comparison of the "unsound" housing units shows the census
tract's percentage of "deteriorating" units at 8.3 percent
while that of units occupied by non-whites was at 5.0 percent.
The percentage of "dilapidated" housing was the same for both
groups at 1.3 percent.21
The "Zoning District Map" of the City of St. Louis, dated
April, 1969, indicates that all housing units of Census Tract 6-D
locate, east of Union Boulevard are classified in District "B;'
including both single-family and two-family dwellings. The
part of Census Tract 6-D that is west of Union is included in
three districts. The largest area of this part is located in
District "A," which allows only one-family dwellings. The area
extending from Union to Arlington, from St. Louis to the southern

14
border of Census Tract 6-D is classified in District "B." The
area of Belt between Ashland and Natural Bridge is included
in District "C." This aistrict includes multiple-family
dwellings.22
The Business and Industry of the Community
The information in this section will, of necessity, be
somewhat more general than that of the previous section. This
should detract in no way from the importance of the community's
economic character but, to the best of this writer's knowledge,
no specific information in this area exists. Nevertheless, the
information provided here will help ore develop an understanding
of the business and economic character of the community. Unless
otherwise indicated the information was acquired through the
personal observation of the writer.
The business community in the vicinity of Our Savior Lutheran
Church is represented mainly by independent businesses. The
Chevrolet plant on Natural Bridge between Union and Belt is the
only major industry in Census Tract 6-D. The Kroger Super Mar-
ket on Union between Labadie an Greer is the only "chain" estab-
lishment represented in the community.
The remaining establishments are small, independently -
owned businesses. Most of them are located in the "business
district" of the community. along Union Avenue; the remaining
few being sacttered along St. Louis Avenue and along Wabada
Street.

15
Mr. James O. Gordon, Director of Client Services for the
Interracial Council for Business Opportunity of Greater St.
Louis, estimated that 50 percent to 60 percent of these inde-
pendent business are black-owned.23 He further indicated that
the types of businesses represented most in the community are
beauty salons, barber shops, and taverns.?4 Other types include
drug stores, food stores, a furniture outlet, a roller rink,
a house of Negro history, and many others.
Other aspects of the business character of the community
will be dealt with in Chapter IV under the treatment of the
problems and needs of the community.
The Churches of the Community
The churches in the community are listed here in three
groups. The first group contains those churches within Census
Tract 6-D and east of Union Boulevard. The second group is made
up of those churches in Census Tract 6-D which are west of Union
(this is the community most immediately surrounding Our Savior
Church). The third group consists of the churches outside of
the part of Census Tract 6-D west of Union, but whose surrounding
community intersects it. The churches within each group are
listed in alphabetical order. All information in this section
is the result of the personal inquiry of the writer.

16
TABLE 1
CHURCHES OF AND NEAR CENSUS TRACT 6-D
Group I Churches of Census Tract 6-D east of Union
1. All Saints Episcopal Church Kingshighway at Terry (southwest corner)
2. Friendly Baptist Chruch 5164 Lexington (southeast corner of Geraldine)
3. Mount Nebo Church Union near Greer
Group II Churches of Census Tract 6-D west of Union
1. Church of God in Christ Belt and St. Louis Avenue
2. Clayton Missionary Baptist Church 2801 Union (northwest corner of Maffitt) Reverend W. L. Rhodes, Pastor
3. Christ Pilgrim Temple Wabada and Grover (northeast O. W. Carter, Pastor
4. Christ Temple (Church of God 2908 Arlington C. Brown, Minister
corner)
in Chriot)25
5. Christ Unity Temple Union at Lexington
6. Fahame Ameriapm Ethiopian Temple of Islam and Culture Incorporated (Negro Culture College) Union, just north of St. Louis Avenue
7. Faith Missionary Baptist Church 2865 Semple (back of store on southwest corner of St. Louis Avenue) Reverend P. L. Washington, Pastor
8. Fundamental Bible Church 5473 St. Louis Avenue H. Jeffries and U. Northern, ministers
9. Guiding Light Missionary Faptist Church 2500 Semple (northeast corner of Wabada) Reverend H. W. Simmons, Pastor

17
TABLE 1 (continued)
Group II Churches of Census Tract 6-D west of Union (continued)
10. Mount Erat Missionary Baptist Church 5429 St. Louis (between Semple and Arlington,)_
11. New North Side Baptist Church 3033 Semple (south of Ashland) W. Ellis Jr., Pastor
12. Our Savior Lutheran Church St. Louis and Abner Place Dr. Ra4ph Klein, Interim Pastor
13. Saint Marys House of Prayer c/o J. Fields Upholstery St. Louis and Semple (northwest corner) Sister E. Bobo, Secretary
14. Zion Spring Missionary Baptist Church 3044 Ashland (southeast corner of Arlington) Reverend L. Watd
Group III Churches near Census Ttact 6-D west of Union
1. Greater New Macedonia Baptist Church 5474. Wabada (near Belt) Reverend A. Anderson, Minister
2. First Free Will Baptist-Church (with educational center) Clara and Labadie (northeast corner)
3. Saint Edwards Roman Catholic Church Clara and Maffitt
4. Third Presbyterian Church Union and Northland (southeast corner)

18
The Schools of the Community
The educational facilities pertaining to the community
surrounding Our Savior Lutheran Church consist of five schools:
four elementary schools and one high school. The elementary
schools are Gundlach School on Arlington between St. Louis Avenue
and Ashland, Lexington School on Lexington and Norwood, Langston
School on Wabada and Belt, and Ford School on Clara and Minerva.
The high school is Beaumont School on Vandeventer and Natural
Bridge.
All of Census Tract 6-D is located within the districts of
two elementary schools. The -Dart of the census tract west of
Union Boulevard, with the exception of the area east of Abner
Place and north of St. Louis Avenue, is located in the Gundlach
School District.26 The remainder of Census Tract 6-D is in the
Lexington School District.
Two other elementary schools are connected with the community
to a somewhat lesser degree. Langston School is located on
the southwest border of Census Tract 6-D and includes the
surrounding area within its district. Ford School serves the
area of Census Tract 6-D for the "Community School Program" of
the St. Louis Board of Education. This program provides courses
in various phases of social development for community residents
of all ages. In the April, 1969, issue of the Board of Education's
"School and Home" statistics for the Community School Program
at Ford included a total of 44 classes, a course total of 23,
anda weekly attendance of a,100: persons.28

19
There is no high school in the vicinity of Our Savior
Lutheran Church. All high school students who are residents of
Census Tract 6-D are to attend Beaumont School on Vandeventer
and Natural Bridge.29
The Parks and Playgrounds of the Community
There are no parks within Census Tract 6-D. Only two parks
are located in the entire Wells-Goodfellow District of the Human
Development Corporation. They are Barrett Park, located at
Goodfellow and St. Louis Avenue, and Sherman Park, located at
Kingshighway and Easton. Barrett Park has an acreage of 13.16
while that of Sherman Park is 22.04.30
Statistics from the Department of Recreation, Parks and
Forestry indicate that in 1967 Barrett Park, with a staff of
four persons, had a total summer attendance of 5,820. Sherman
Park, also with a staff of four, had a total summer attendance
of 1,051.31
Staff personnel was provided also for certain school play-
grounds during the summer of 1967. None of these schools were
located within Census Tract 6-D. Within the Wells-Goodfellow
District of the Human Development Corporation four school play-
grounds were used. Arlington School (1617 Burd) had a staff
of two and a total attendance of 199. Ford School, with a staff
of four, had an attendance of 164. Hempstead School (5872
Minerva) had a staff of four persons but no attendance.
Langston School (closest to Our Savior Lutheran Church) had

20
an attendance of 8,545, supervised by four staff personnel.
Of the 15,779 total attendance for the parks and playgrounds
within the Wells-Goodfellow District, therefore, the Langston
School playground had 54 percent of the attendance, while the
remaining five locations together had a total of 46 percent
of the attendance.32
In a meeting on January 19, 1970 Mr. Harry Williams, Direc-
tor of the Wells-Goodfellow District of the Human Development
Corporation, stated that during the summer of 1970 finances for
local summer progra=ms will be available through the Human Develop-
ment Corporation and the Mayor's Commission on Youth Opportuni-
ties. He was able to offer no more specifics at that time, but
suggested a valuable resource person in this matter, Mrs. Robert
Paine, 7334 Westmoreland, (721-0258).33
Summary
The physical characteristics are extremely important since
they develop the necessary context within Which the people of
the community live and function. The housing statistics were
dealt with in the most detail for two reasons. The first is
to facilitate a future comparison with the 1970 statistics.
The second reason for such great detail in the housing section
is to present a report that will provide a babis for the best
possible understanding of the population statistics of the
community. These population statistics are the subject of
Chapter III.

CHAPTER III
THE POPULATION STATISTICS OF THE COMMUNITY
Most of the population statistics here presented are de-
rived from the 1960 Census and are limited to the area included
within Census Tract 6-D. Some af the information, particularly
in the section on the general characteristics of age, sex, and
race, includes figures from the 1965 estimate for the Wells-
Goodfellow District of the Human Development Corporation. The
population statistics contained in this chapter are presented
in four parts. The first is the general character of the popu-
lation: age, sex, and race. The second section is the familial
characteristics of the population. The third section deals with
employment characteristics, while the fourth analyzes the edu-
cational statistics of the community's population.
The General Character of the Population:. Race, Sex, Age
A general population trend may be indicated by statistics
gathered by the Human Development Corporation for its Wells-
Goodfellow District in April of 1968. According to these sta-
tistics the estimated population of the Wells-Goodfellow Dis-
trict in 1965 was 44,574 persons as compared to 42,854 in 1960.
This is an increase of 1,720 persons or an increase of 4 percent,
of the tota1.34 During the same period the total population
for the city of St. Louis declined from 750,000 in 1960 to an
estimated 702,000 in 1965, a decrease of 48,000, or 6.4 percent.35
22
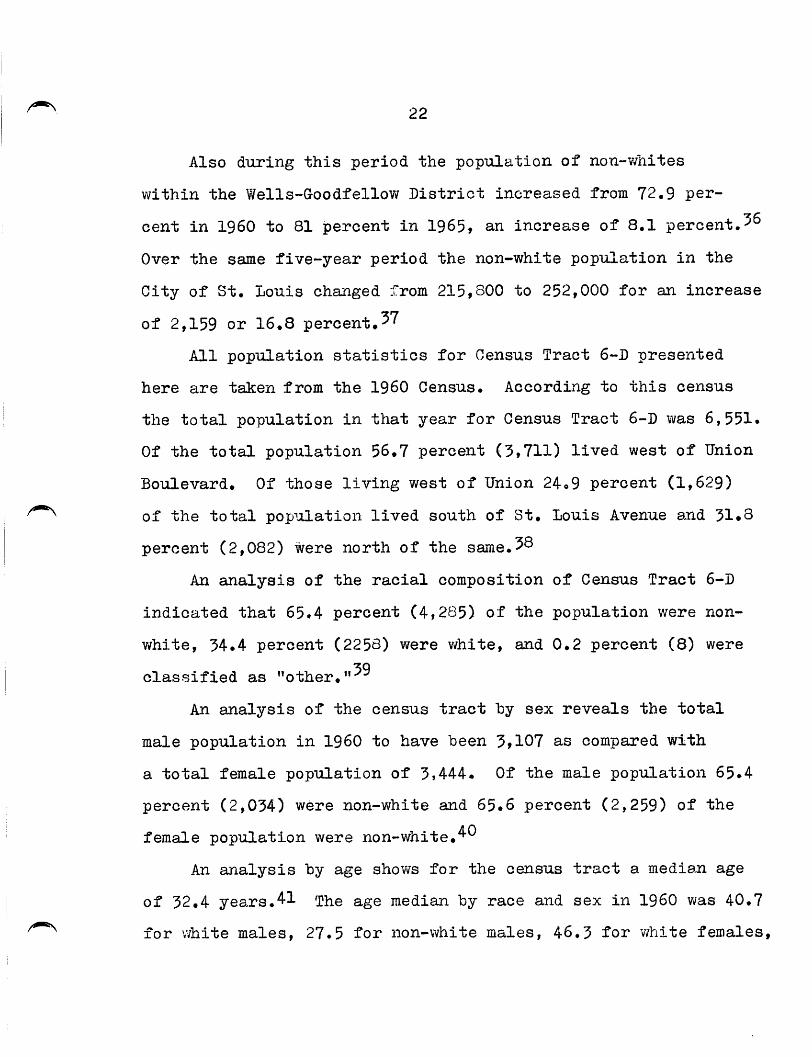
Also during this period the population of non-whites
within the Wells-Goodfellow District increased from 72.9 per-
cent in 1960 to 81 percent in 1965, an increase of 8.1 percent.36
Over the same five-year period the non-white population in the
City of St. Louis changed from 215,800 to 252,000 for an increase
of 2,159 or 16.8 percent.37
All population statistics for Census Tract 6-D presented
here are taken from the 1960 Census. According to this census
the total population in that year for Census Tract 6-D was 6,551.
Of the total population 56.7 percent (3,711) lived west of Union
Boulevard. Of those living west of Union 24.9 percent (1,629)
of the total population lived south of St. Louis Avenue and 31.8
percent (2,082) were north of the same.38
An analysis of the racial composition of Census Tract 6-D
indicated that 65.4 percent (4,285) of the population were non-
white, 34.4 percent (2258) were white, and 0.2 percent (8) were
classified as nother."39
An analysis of the census tract by sex reveals the total
male population in 1960 to have been 3,107 as compared with
a total female population of 3,444. Of the male population 65.4
percent (2,034) were non-white and 65.6 percent (2,259) of the
female population were non-white.4°
An analysis by age shows for the census tract a median age
of 32.4 years.41 The age median by race and sex in 1960 was 40.7
for white males, 27.5 for non-white males, 46.3 for white females,

23
and 29,1. for non-white females. The median age for all males
in Census Tract 6-D was 31.3, while for all females it was 33.142
The Familial Characteristics of the Population
In 1960 the population of Census Tract 6-D averaged 2.95
persons per household. Of the total population (6,551) 33.8
percent (2,217) were classified as the head of the household.
Of this total 20.8 percent (1,367) were the wives of the house-
hold head. Juveniles (under 18 years of age) comprised 27.8
percent (1,819) of the population. Classified as "other rela-
tives" were 15.8 percent (1,037), while 1.9 percent (111) were
"non-relatives" of the household head.43
A classification of the marital status of all persons 14
years and over in Census Tract 6-D follows.44
TABLE 2
MARITAL STATUS OF ALL PERSONS 14 YEARS AND OVER BY AGE AND SEX--CENSUS TRACT 6-D
Male Female
White Yon-white White Non-white
Total 2,157 1,310 2,598 1,594 Single 444 245 456 273 Married 1,508 976 1,568 1,036 Separated 59 48 103 84 Divorced 73 36 146 93
The total number of married couples in 1960 living within
Census Tract 6-D was 1,465. Of these couples 97 percent (1,421)
comprised their own household. Also, 49.3 percent (722) of

24
these coupes had children under 12, years of age, and 35.4 per-
cent (515) had children under six years old. In the case of
55.5 percent (811) of these married couples the husband was under
45 years of age.45
An accurate reflection of the molpility rate for Census
Tract 6-D must considcr both mobility of time and mobility of
place.
The statistics pertaining to the mobil ty of time indicate
that in 1969 the occupants of 40 percent (090) of the census
tract's 2,217 housing units had lived in their present unit less
than two years. The occupants of 33 percent (738) of the housing
units had lived in the present units less than six years, while
9 percent (237) of the housing units had been occupied by their
present residents for more than 20 years.46
The mobility of place for Census Tract 6-D is based upon
statistics from Table P-1 of the 1960 Census.47 The total of
persons in Census Tract 6-D in 1960 who were five years old
or older was 5,724. Of these 37 percent (2,120) were living
in the same house as in 1955, and 57.4 percent (3,285) had
lived in a different house in the United States in 1955. Of
these 3,25 who had changed residence 85.7 percent (2,',16) had
moved from the central city of the same S.M.S.A.48
Table P-4 of the 1960 Census provides the non-white family
characteristics for Census Tract 6-D.49 Of the 4,293 total
non-white population in the census tract 30.3 percent (1,289)
were classified as the head of the household. Wives of the

25
head comprised 20.4 percent (878), while juveniles (under 18
years of age) comprised 31.6 percent (1,355) of the total non-
white population.
Table P-4 provided non-white statistics of mobility only
for that of place. The total of those non-whites who were five
years old or older in 1960 was 3,664. Of these 29.8 percent
(1,097) lived in the same housing unit as they had in 1955,
and 63.9 percent (2,343) lived in a different unit. Of the
2,343 who had changed residence between 1955 and 1960 88.3 per-
cent (2,066) moved from the central city of the same S.M.S.A.5°
The Employment Statistics of the Population
In 1960 the community around Our Savior Lutheran Church
contained a significant number of low-income families. The
report of the Human Development Corporation indicated that in
1960 24 percent of the population of its Wells-Goodfellow Dis-
trict had an annual family income of less than $3,000. A total
of 69.4 percent of the families in that district had an annual
income of less than $6,000.51 The 1960 Census indicates that 65.9
percent (1,197) of the 1,818 families had an annual income of
less than $6,000. The median annual income for Census Tract 6-D
was $5,000.52
The 1960 Census released figures also for the income of non-
white families in Census Tract 6-D.53 Of the 1,150 non-white
families 64.6 percent (743) had an annual income of less than $6,000.
26
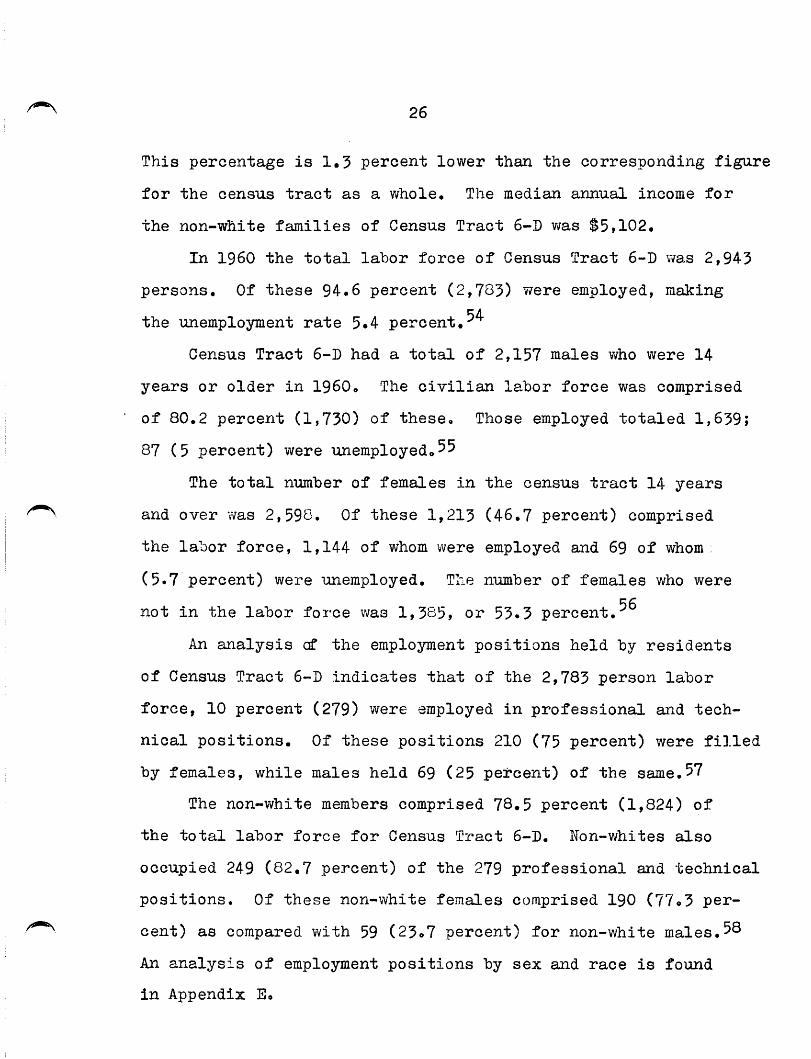
This percentage is 1.3 percent lower than the corresponding figure
for the census tract as a whole. The median annual income for
the non-white families of Census Tract 6-D was $5,102.
In 1960 the total labor force of Census Tract 6-D was 2,943
persons. Of these 94.6 percent (2,783) were employed, making
the unemployment rate 5.4 percent.54
Census Tract 6-D had a total of 2,157 males who were 14
years or older in 1960. The civilian labor force was comprised
of 80.2 percent (1,730) of these. Those employed totaled 1,639;
87 (5 percent) were unemployed. 55
The total number of females in the census tract 14 years
and over was 2,598. Of these 1,213 (46.7 percent) comprised
the labor force, 1,144 of whom were employed and 69 of whom
(5.7 percent) were unemployed. The number of females who were
not in the labor force was 1,385, or 53.3 percent.56
An analysis of the employment positions held by residents
of Census Tract 6-D indicates that of the 2,783 person labor
force, 10 percent (279) were employed in professional and tech-
nical positions. Of these positions 210 (75 percent) were filled
by females, while males held 69 (25 percent) of the same.57
The non-white members comprised 78.5 percent (1,824) of
the total labor force for Census Tract 6-D. Non-whites also
occupied 249 (82.7 percent) of the 279 professional and technical
positions. Of these non-white females comprised 190 (77.3 per-
cent) as compared with 59 (23.7 percent) for non-white males.58
An analysis of employment positions by sex and race is found
in Appendix E.

27
The Educational Statistics of the Population
The educational statistics for the community surrounding
Our Savior Lutheran Church are classified into two groups.
The first is the number of students between the ages of 5 years
and 34 years who are enrolled in the various levels of formal
education. The second group of statistics will deal with the
percentages of all persons over 25 years of age by the highest
level of education attained. All statistics are from the 1960
Census, some dealing with the Wells-Goodfellow District of the
Human Development Corporation and some dealing with Census
Tract 6-D.
The first group of statistics deals with the educational
enrollment levels of those persons between the ages of 5 and 34
years.
In the 1968 statistical report of the Human Development
Corporation it was written that in 1960 tie Wells-Goodfellow
District had a total of 9,744 persons between the ages of 5
and 34 years. Of these 510 were enrolled in college, 1,803 were
attending high school, 6,836 were in elementary school, and 595
attended kindergarten. 59
Within Census Tract 6-D the total persons between 5 and 34
years of age in 1960 was 1,288. Of these 81 were enrolled in
college, 470 in high school, 1,594 in elementary school and 156
in kindergarten.60

28
The second group of statistics deals with the highest edu-
cational level of all persons who were 25 years of age and over
in 1960.
The total number of persons in this category in the 'Viells-
Goodfellow District in the year 1960 was 23,049. Of these 2,364
had completed college; 9,208 had finished high school; 11,059
were elementary school graduates, and a total of 418 had attended
no school at al1.61
In Census Tract 6-D the total number of persons 25 years
and older in 1960 was 3,895. Of these the highest level of
education completed was college for 616, high school for 691,
elementary school for 1,731, and no school at for 57.62
A comparison of the non-white population with the total
population of Census Tract 6-D reflects for non-white persons
a median education of 11.0 years completed, while the census
tract as a whole had a median of 9.6 years. The census tract
as a whole had a college-graduate total of 7.7 percent, while
the non-white population averaged 12.1 percent college graduates.
Likewise, the educational level of 45.9 percent of the total
census tract population did not exceed the eighth grade as
compared to 34.5 percent of the census tract's non-white popu-
lation.63
Summary
The physical characteristics of the community and the popu-
lation statistics of the community, as presented in chapters
29
two and three, provide an analytical description of those ele-
ments comprising the community itself. Neither chapter has
dealt specifically with any of the problems or needs of the
community. Such a treatment is necessary, however, in order
properly to understand the community surrounding Our Savior
Lutheran Church. This will be the subject of Chapter IV.

CHAPTER IV
THE PROBLEMS AND NEEDS OF THE COMMUNITY
Any treatment of the problems and needs of a community
will demand a given amount of interpretation. Not all of those
involved in the living and functioning of a community will agree
as to the type and gravity of the community's major problems.
This chapter will deal with some of the major problems
and needs of the community surrounding Our Savior Lutheran Church,
St. Louis, Missouri, as seen by some of the community leaders.
The writer has attempted to relate his findings here as objec-
tively as possible.
The chapter is divided into three parts: crime, economic
development and miscellaneous problems and needs. The organi-
zation of these materials implies no degree of importance or
urgency for any given problem or need. Rather the organization
of the materials is strictly logistical, providing separate
categories for the problems and needs which require the most
clarification.
The Problem of Crime in the Community
Before the crime statistics of the community are presented,
two introductory comments are necessary. Firstly, almost all
of the statistics provided by the St. Louis Police Department
are dated 1968, while the population statistics to which they

31
are compared are from the 1960 Census. Secondly, the crime
statistics provided by the police department vary as to the
area represented. The writer has compiled that information
which he believes to be the most representative and the most
helpful for an understanding of the crime situation in the
community.
Our Savior Lutheran Church is located in the northern part
of the St. Louis Police Department's District Seven." The
area covered by District Seven is bounded by Natural Bridge
on the north, Kingshighway on the east, Lindell on the south
and the city limits on the west. It is one of nine police
districts in the City of St. Louis.65
Patrolman Cooper, Crime Analyst for District Seven, pointed
out that although District Seven has the highest crime rate of
any district in the city, the northern part (within which Our
Savior Church is located) has the lowest crime rate of the entire
district.66
District Seven does have the highest crime rate in the city.
According to the 1960 Census, the 98,165 persons living within
District Seven comprised 13.1 percent of the St. Louis population.
According to the "Statistical Supplement of 1968," printed by
the St. Louis Police Department, District Seven had the highest
percentage of total crimes at 13.2 percent. The rate of crime
per 100 persons was significantly higher for District Seven
than for the city as a whole. For the City of St. Louis in 1968

32
the rate of crime per 100 persons was 5.28, while the same figure
for District Seven was 7.27.
Although District Seven has the highest crime rate in the
City of St. Louis, the crime rate for Census Tract 6-D is approxi-
mately the same as that for the entire city. According to
unprinted figures compiled for this writer by Sergeant Brown,
Crime Analyst at St. Louis Police Headquarters, in 1960 Census
Tract 6-D had .87 percent of the total St. Louis population and
1.2 percent of the city's crime. These figures also indicated
that ofthe39,054 St. Louis crimes committed in 1968, 19 percent
(7,440) were directed against property. The corresponding per-
centages for the 1968 total of the 451 crimes in Census Tract 6-D
were 20 percent (90) against persons, and 30 percent (361) against
property. 68
The figures far juvenile delinquency show a slightly lower
average for Census Tract 6-D than for the city as a whole.
According to the population estimate of 1965, Census Tract 6-D
had 1.04 percent (1,198) of the total St. Louis youth between
the ages of 7 and 16 (114,530). In 1968 .85 percent (53) of
those juveniles apprehended were from Census Tract 6-D.69
Patrolman Cooper is convinced that crime remains a serious
problem for the citizens of District Seven.70
The Need for Economic Development in the Commtnity
This need, stated rather broadly, includes two specific
economic problems of the community: the amount of public

33
assistance, and the lack of business stability.
Mr. Harry Williams, Director of the Wells-Goodfellow
District of the Human Development Corporation, stated that the
number of persons within the Wells-Goodfellow District requiring
public assistance constitutes a significant economic problem
for this geographical area.71
In the Human Development Corporation's report of 1968 it
is indicated that the Wells-Goodfellow District constituted 5.7
percent of the total St. Louis population. In comparison, the
monthly average of the Aid to Dependent Children cases was 986,
or 10.5 percent of the 9,460 monthly average for the city of
St. Louis.72
In addition to this, Mr. Williams indicated that there are
many families in the district who, in his estimation, should
be receiving public assistance, but who, for various reasons,
are not.73
The second problem lending to the community's need for
economic development is the lack of business stability.
Mr. James Gordon, Director of Client Services for the
"Interracial Council for Business Opportunity of Greater St.
Louis," stated this as one of the major problems facing the
community in which Our Savior Lutheran Church is located. He
suggested that two factors are lending to the economic insta-
bility of the business community in that area.74
The first factor lending to this economic instability is
the high mortality rate of the community's many minority-owned

34
businesses. Mr. Gordon estimated that minority-owned businesses
constitute between 50 and 60 percent of the neighborhood's
business establishments, all of which he described as "small,
marginal, retail outlets." Mr. Gordon estimated farther that the
mortality rate of these business is approximately 75 percent.75
The second factor lending to the community's economic
instability, as he saw it, is the increasing exodus of white
businessmen from the area. He suggested that the prime reasons
for this exodus were the threat of burglary and the difficulty
of maintaining insurance coverage.
What Mr. Gordon said is in part documented by the "Report
on the Survey of Inner City Jewish Businessmen." Printed in
June, 1969, it renortc that the four greatest problems involved
in running an inner-city business are, in this order: insurance
coverage, adequate police protection, shop lifting, and burglary.77
Mr. Gordon suggested that four things are necessary if
the community is to gain economic stability. The first is the
need to encourage and inspire minority persons to enter businesses.
The second need is to work toward stopping the exodus of white
businessmen. The third is the need to raise the capital with
which to lend and to support those minority persons beginning
in business. The fpurth need is to find qualified and capable
individuals who are willing to volunteer their services as con-
sultants in areas of legality, finances, and business adminis-
tration.78

35
The Miscellaneous Problems and Needs of the Community
The following are problems and needs which have been suggested
by community leaders without extensive clarification or elab-
oration. There is no particular significance to the order or
to the amount of space given to any one item. They are listed
here primarily to develop one's total understanding of the prob-
lems and needs of the community as well as to provide possible
directions for further study in this area.
Firstly, the community is in need of a day-care center.
Mr. Harry Williams stated that although therels,a total of 15
day-care centers throughout the Human Development Corporation's
various districts, none of these are located within the Wells-
Goodfellow District. He expressed hope that Our Savior Lutheran
Church might consider sponsoring this muchly needed program for
its community.79
Secondly, the community is in need of a community organi-
zation. Miss Claridy, Director of the United Methodist Metro
Ministry, mentioned that in various communities an individual
community organization has been developed to serve as a resource
and as a catalyst for solving community problems. Often these
organizations have been begun by churches. The northwest section
of St. Louis has no such organization.8°
Thirdly, a summer program may be needed in this community.
The Mayor's Commission on Youth Opportunities works in conjunc-
tion with community organizations in order to provide summer

36
jobs and recreation for the youth of the city. Such a program
may be needed this summer for the community in which Our Savior
Lutheran Church is located.81
Summary
Describing the community, analyzing the statistics of its
population, and presenting some of its major problems is not
yet the entirety of this community analysis. There remains to
be presented the means and the resources available in and for
the community. These will be dealt with in Chapter V.

CHAPTER V
THE RESOURCES OF THE COMMUNITY
In addition to the churches, schools, and playgrounds
treated in Chapter II there are various groups and organi-
zations which serve as resource agencies for the community
surrounding Our Savior Lutheran Church. Some of these organi-
zations are located within Census Tract 6-D, although the great
majority of them lie within the surrounding areas. There is
also a "Metropolitan Federation of Churches," including fifteen
churches from the Wells-Goodfellow District.
The purpose of this chapter is to provide a concise com-
pilation of community resources. The material will be divided
into three parts. The first two parts will be represented by
the two sections entitled: "Community Organizations within
Census Tract 6-D" and "Metropolitan Federation of Churches."
The third part of this compilation is a list of community or-
ganizations serving the Wells-Goodfellow District reprinted from
pages 9 - 18 of the Neighborhood Handbook for Human Development
Corporation Wells-Goodfellow District. These pages comprise
Appendix of this study.82
Community Organizations within Census Tract 6-D
The following groups and organizations are located within
Census Tract 6-D.83

38
1. Interracial Council for Business Opportunity 2841 Union Boulevard
2. Mound City Medical Center 2715 Union Boulevard
3. Organized Men for Community Betterment St. Louis Avenue and Arlington Street
4. St. Louis Public Library Sherman Park Branch Union and St. Louis Avenue
5. Twentieth Ward Democratic Organization 2914 Union
6. Uhuru News and Black Topographic Center84 3081 Union Boulevard
Metropolitan Federation of Churches
The following are the members of the Metropolitan Federa-
tion of Churches located in the Wells-Goodfellow District.85
1. Saint Barbara Catholic Church Hamilton at Minerva
2. Saint Edward's Roman Catholic Church Clara at Maffitt
3. Saint Engelbert Catholic Church Carter at Shreve
4. Jerusalem Missionary Baptist Church 5596 Ridge
5. Northside Baptist Churbh 3033 Semple
6. Mount Bethel Baptist Church 1524-1526 Belt
7. New Canaan Baptist Church 5715 Easton
8. The Revelation Baptist Church 5715 Minerva

39
9. Zion Traveler Baptist Church 1444 Goodfellow
10. Good Hope Baptist Church 1914 Union Boulevard
11. Hill Chapel Baptist Church 5538 Wabada
12. Mount Hareb Baptist Church 5740 Minerva
13. Mount Herman Baptist Church 5588 Easton
14. Mount Nebo Baptist Church 3408 Union Boulevard
15. Trinity Methodist Church 2500 Hodiamont
Summary
The study here presented is the first part of what the
writer hopes will be a three-part project aimed toward dis-
covering the feasibility of developing a co-operative ministry
between Concordia Seminary and Our Savior Lutheran Church. In
analyzing the community surrounding Our Savior Church on the
batis of its physical characteristics, its population statistics,
its problems, and its resources, this report is intendel to
serve two basic ends. The first end for which this study is
intended is that it serve as a basis for the second and third
parts of the research project as outlined in the Introduction
of this study. The second end is that, regardless of the
feasibility of the co-operative ministry, Our Savior Lutheran
Church will find this study helpful in developing a more-active
ministry within its surrounding community.

40
FOOTNaTES;
le FWneafter referred to as TERG4
2. The Theological Education Research Committee of Concordia Seminaryp Unpublished "Minutes",;" Edgar Krentz,, Secretary,: September 30, 1969, p. 2.
3. The paulyblock-system is a development of the St.-Louis Metropolital Police Department in which. the City of St. Louis is divided into nine sections (these sections do, not coincide with the nine police districts),_ each of which is divided into numerous paulyblocks of approximately equal size. The paulyblock is the smallest area for which crime statistics are kept. These statistics are not pub-lished but are available upon request from the Crime Analysis Department of the St. Louis Metropolitan Police Department Headquarters.
4, The Research Department of the Human Development Corporation of Metropolitan St. Louis„ Neighborhood Handbook. for Human Development Corporation Wells-Goodfellow District ;Unpublished; December 1968)r Research and Planning Document Number 11r p. 10 Hereafter referred to as WGD.
5. Although these statistics are ten years old and in some respects obsolete, the author justifies their inclusion in this report for two reasons. Firstly, these statistics are valuable on the basis of the total situation and of the interrelationship of the individual statistics:,, even if the specific figures may no)longer apply. Secondlyr these statistics have been included in order that, when-,the11970 Census statistics have been released, a comparison might be made for the purpose of detecting trends which have de-veloped during the last decade.
6,', For a comparison of a similar analysis pertaining to population statistics see below page
7,; United States Department of Commerce,. Bureau of Census, United States Census: 1960 ('Washington:: United States Government Printing Office, 1960), Table 20 pp. 14-15v Hereafter referred to as USC.

41 8; ' 14
94 Ibid;
10; WW 4,. po
114 This information was acquired by means of the personal inquiry of the author on December 22, 19694
120 USG°, Table 2, po 144
13. This information was compiled by means of the ob-servation of the writer,. since no- statistics of this kind, to the best of his knowledge, are availableo-
14. USC0, Table 2,, pp. 14-154.
Ibid
164 Ibid., Table 1ff-1, po 1434
In Ibid4, Table 2, po 140
18O Ibid..
194 IbidO
204 Ibid., Table H-3, p4 1854
214 Ibid
224 Infra:: Appendix A, p.. 45.
23a This information was acquired by means of a personal interview on February 5, 1970o
24O Ibid.
254 It is not clear to this writer whether this locatioon is still in useo It appears to be deserted.
264 This information was acquired by means of an inter-view with Mto Cockerham, Priciple of Gundlach School,. on Frebruary 13,. 19706.
274 This information was acquired by means of an.interview with Mrs..Aston, Director of Personnel for the City of St.. Louia'Bbard of Education, on.December 1969. -Hereafter referred to as AST4
284 "Community Schools--a Family Affair," School:and Hbme (St. Louis:: Board of Education:. April, 1969),, pp. 4-54
42
29. AST.
304 MD., Po 74
31. Ibido
32o Ibid..
330 This information was acquired in a meeting onn. January 19r 1970„ at which were present with this writer Mr.- Harry Williams, Director of the Human Delvelopment Corporation Wells-Goodfellow District, Mrs.-Cdaridy, Diretor of the United Methodist Metro Ministry,. and Dr., Ralph Klein, Interim Pastor of Our Savior Lutheran Church° Hereafter referred to as WCX0
34.- WGD. po 14
3.54 Robert Gladstone and Associates,: Economic Consultants, Basic Economic Indicators ((Washington: Robert Gladstone and Associates,, Economic Consultants.,. Dedember 1968), ppo i-iio Hereafter referred to as BEI,
360 Infra: Appendix D, p. 56.
374 BEI1, p.
381 US00, Table 2,. po 144
390 Ibid., Table P-1, p l90
404 _Ibido, Table P-2, p4 52o
41,
424
Ibid-i
Ibid,;
43). 'bid°, Table P...1, Pa 191
444 Ibid®,; Table P-2, Pa 524
454 Ibid., Table 13-19 PO 191.
464 Ibido, Table 5.62, Po 1700
47. _Ibid., Table P-1, Pa 19.
484 - The areas included- inthir &.M.S.A. are St. Louis City,. Jefferson County,; St..Ctarles,Cauntyy.MadisoltObunty, Illinois, and Sto, Clair County,, Illinois.
491 USC., Table P-4, 130 133®

43 501 Supra: Footnote #484
514 WGDe. p4 14;
52'0 USC., Table P-1. p0 19.
53. 11-bid1, Table P-4, p. 1334
54, Ibid., Table P-3., p. 1060
55. Ibid*
560 Ibid.
57. Ibid.
584 IbidO, Table P-4, pe 133.
594 WGD., pe 1*
60. US0., Table P-1., p. 19.
610 WGD., p. 4/
621 US04, Table P-1, p. 191'
63. Ibid., Table P-4, pe 1331
641 Supra: Footnote #3
659 St. Louis Metropolitan Police Department, Statis-tical Supplement 1968,. Unpublished, but available at St.. Louis Metropolitan Police Department Headquarters,, p. 24.
660 This information was acquired by means of an interview with Patrolman Cooper, Crime Analyst for Police District Seven, on February 13,.19704 Hereafter referred to as PC.
674 St* Louis Metropolitan Police Department,. Statis-tical Supplement 1268, pe 4.
681 Infra: Appendix F, p. 58.
69, I, bid.
701 PC4
71. This informationwas acquired by means of an inter-view with Mr. Harry Williams on Jamuary 12, 19700 Here-after referred to as HWe

44
61106, pp. 90-91.
Higi,
74a This information was acquired by means of an interview with Mr. James Gordon on February 5s, 19704 Here-after referred to as JG.
75i;. Ibide
76e Ibid
77. The American Jewish Committee St. Louis Chapter,; Report on the Survey of Inner City Jewish Businessmen (`Unpublished; St. Louis: June 1969)7717.1-
784 JG4
79.; HW
80. WC-K.
81. Ibid.
824. wm, pp* 9-18* 83. This information was acquired by means of the
personal observation of the writer.
841 This organization is not yet in operation., but a sign on the front window reads "coming soon4"
854 WGEL., ID. 194

'tt • : : :tv 1:•••;.:•.*
APPENDIX A •
THE GEOGRAPHICAL AREAS SURROUNDING OUR SAVIOR •
LUTHERAN CHURCH
7:70 ice w; 5 Trier 7 Well- Goed-re"cd '0;srri'cl"" Certsios77Jet S-D R.I.46 Le its 70e t l/
• • -.•-• "
. •
...... !en._ .
• •• ------- ' • - - ...... . [1?r44WW•gike7-
'...g '7f • • .. •
.o v 4111 ' • .....
ZeZffit,AW. 4 •4
11:1:1 111111.
:suNVIWMW
A.1.1103A1M0 MOIDNINSTM
\,1
..;-. • • • •
1:?.::- •4:••••:•... . -ig:i:I • •NA::-....1:-...
•:•::*•.•
44.;,1:-.. '..., _0.;.:e....N...::?z,Z::::::••. •

APPENDIX B
MAP OF CENSUS TRACT 6-D BY BLOCKS Oeft
28 1Z
27 13
I* 26 15
/6
15
111.00111.
20
injs Itst it to., Ai
2, 5
ct
21
9
8 Emi
Z3 U
1E3 17
19
2Z
3 z

Blocks within census tracts
37••• 42- 38".
C 39...
/6..• '.41••• 92•••
.56.t`43• • • .117.,:"44••• /.4.45.•• 5. 4600•
‘," 47•.• 6 ,7 118•••
11.2 49•• • /„4,50o • • 3.0 51... t,4_52• • •
28, 514• • •
37,5'56• • • ?,4,57.• •
6-B o 1 O 5•.• 0 6••• Co 7•••
S,G 8• s • C 9•••
:Feit:40. • • 43.3 12.••
be> 13
cff.6 14.•• s.4 15
o 16••• 4,4-17•••
eS.c:113•4•1
e,19••• o 20•••
4,725..• Goe,..-26.•
,250 27••• /00 28••• • 29•••
1.5..730•••
6-C O 1ese C. 2••• O 3.00 I-' 4 • • •
5.••
7 O 134,00
,,,,(p9•• •
•• 11 12.eo 13•••
3.,714••• 15••• 16•••
18••• r 19
▪ •20••• 21•••
),%•..". 22.1,1 • 23•••
24••• r 25.•• -/26•••
• -.27eoe
6-0 • 2eso
3••• 11,••
• 5••• ' 6.•6
ig.1 8.•• • :79 • • •
..F.4.S10••• /4.111•••
1957 2
77 149 131 71
111 112 113 93
123. 132! 1121 139 161 114 46
117 56 12
With Lack- all ing
plumb- some ing or all
lard- facil- ities ities
Total
9 57
104 9
18 78 33 23 55
4
. 15 • • •
18
2163 161 120 175 95
125 91 52 84
148
42 77 23 78 53 22 34 48 30 34
98 47 79 98
2 119 131 97
3 20
2 11
166 000
000 0.•
O00
O110
000 • • •
.; • .• 1 •••
12 ' 12 •.•d
5.1 4 1It 1
loss @se 121 11 5' 5 21 2 1' 1
000 000 000
000
000
O 00
O 00 000 090
4 4 004
6 6 ••• 1 ' ego 1
2 ... 1 :' 1 000
2, 2 000
0000 000 000
3 li 2 1 3 I 2 1 1
666 1 622 ' osoll 000 ••• !! ••• "go!! ••• 4141,, •eo,
4
1 i1 1
1111 111 621 61 ... ... 123: 123 126; 115
1 1
94 !I .8; ...
.40, 400
8 7
40,, 000
4111 37 4 4511 4
000
44 •
.6. 6..
• • •
• • •
O90
000
o lole 000
9 goo
1
4 29
2 15
000
• Olo0
1
2 900
SOO
6 19
6.. 1111. 44 443
i
.9 • • •
20 0110
.00
SOO
• • •
000
.119
0011
000
*SO
1 1 *pee ••• *so •••
6 ' •••• 18
••• 000 440 0110
140 4 42
2 2 040
••• ••• 000
18 14 4 3 3 es.
42 35 11 1 ' ... 1 1 ••• 3 1
193 171 2;1 so. oil,.
O01* .,.. 000 11•• 1
1 4, • • • 1
CTS)::
• •
000 is,0 000
15 ;I, 15 12 ••• 12
48, 47 19i 18 ' 1
1Dilap-idated
Lacking some or all
facilities
No flush toilet
0.4
000
000
0.4
002
0041
000
000
000
000
040 JOS 000 O00 000 00. eq.
000 0.0 000
000
000
000
000
0.0
00.
OOP
040
0.0
0011
0411
O40
O00 000
•••
000
000
,000
oso
000
O oo
00*
000
O00
000
*O.
.00
000
0.0
1/ 9 0
O00
000
0110
000
ot • •• g • • • ••. O00,
00.1
000. 00o
361
2 4
• • 0
2 2
• • •
7 17
004
000
040
• • •
••11 ••• •••
79 goo go. see so. 1111. 4141. 0.11
0011
•••
000 000 O00 004
O00 000
11 12
ooe
90. OOP 000 000 48
•••
33 000 oeo 000
009
000
004
000
1
3
000
00.
040
000
000
000
6573 7
//" 238 /.1.: 482 r,.431 /?. 311 1 ,1 361 /1 352
373 /3335
1.; 442 19.441 pi' 356
,Z,/ 529 %565 I
t' 398 :5'127
336 9 219 / 21
2_ 59 4 91
45 7 54
*7833 J? *313 14 350 2 / 514 l( 276
*375 Le. 291
158 12 291 2 503
'181 /0 2116 :3 78
/0 258 I f 266
52 •-•-: 86 4 350 /:71.299 I 106
333 :1.; 153 1.?, 334 f 4 342 1,'-' 330
496 • 460
392
6551 168
1:•.: 295 `1 178
120 TO 242 . 116
210 210
.9 233 17 421
14 City Block Characteristics APPENDIX C'
Table 2.-CHARACTERISTICS OF HOUSING UNITS, BY BLOCKS: 1960-Con.
("Total population" contains no persons in group quarters unless preceded by asterisk: one asterisk (P) denotes less than 10 percent. two asterisks (**). 10 percent or more(
All housing units by condition and plumbing Occupied housing ,ruts
372 108 ; 81 28 1
5 1 / 35 11,
16 6 1 35 21.
60 26 / 394 100
451 119 e 193 751
• 217 63 242 59 205 53
C., 209 61 , 223 65
/ 275 67 *0.26 7
12 5 27 8 83 31
Total
44 42 77 77 23 23 85 79. 80 53 22 22 34 341
104 49 89 , 34
34
100 1 98 48 i 48
104 1 86 106 103 93 „ 3
120 11 119 133 132 108 105
2090 2021 , 69 69
117 • 115 54 , 53 411; 41 71 !! 71 46 P, 46 99 78 83 1 81 59 59
119 11 116
1255 1173 eof • • • 77 77
149 1118 131 130 67 67
111 105 69 j 66 64 63 92 91
108 16
4111. 6 ! 51
21 ! 131 951
117 , 71
5 5
28 21
5 5 3
i! With f all
Total facd-
Ei slum
With flush toilet
Owner occupied Renter occupied
Occu-pied by
non-white
1.01 or
more Per- sons Per
room
Total Average
value (dollars)
Aver-
Ze,.. bor
of
rooms
Aver- : Average
con- .'" Total . tract •
rent of (dollars) t rc.:ms
41 10500 5.2 60 56 4..1 57 18 2.* ••• 000 23 5.. 3.0 ••• 12
• • • 009 400 4141. • • s • • • 5 5500 5.2 6 57 3.0 5
1111.
..• ••• 5 6C .02: 4141. 1141. 20 54 2.3 4141. 1111.
5 1111. 4.2 17.,
53 3.2, 9 5 .7fG. 444 10000 6.6 47' 61 ,.11 74 23 30-1./4 37 10500 5.6 70. 4.61 87 29 2;:.•:%.:.; 22 14000 6.2 46' 552.5.34 7 :394'
27 10500 5.6 30 6C .00! 45 14 24 10000 5.5 30. 6'. .:03. 49 19 25 13500 5.6 26 83 5.0 48 11 27 10500 5.7 32 54 3.7 ' 41 12 /:.8•S'/ 24 12000 5.8 37 • 63 3•8 55 12 21 5.5 '3 59 .0.su 61 20 9 ,t6:71 000 .9. 000 7 28 7.1 0.0 00. 000 5 • • • 3.41 2
1 400 000 7 56 -.0 6.. .00 0.0 000 31• 45 3.1 5 10' ;:*e,,P.
1 . 571 11500 5.0 1253' 591 3.9, 1046 442 ,
••• •.• • 000' sou loge ooe 21 15
13500 15000
5.0 4.9
50' 3.6 '.1
126
65'.t : C 48 73
15 /?/: S2 19 Z:9/.27
16 15000 4.9 28 ,•45.1, 17 13000 4.6
105 63:?...:5) 52 :9 22
47 12500 5.2 60. 60 4.1' 66 16 ;••4 40 10500 5.0 64: 54 3.7 54 25 C/ 54, • 33 8500 4.7 75; 571 401' 74 21 295-"X';': 50 12500 5.5 421 62' 4031 64 16
51 11500 4.9 67; 57; 309' 81 29 38 13000 4.9 811 57. 3071 52 36 207.48 33 12500 43 10000
5.6 5.1
641 891
58' 3.6 60. 4.1
63 102
24 2-ch 44 44):;-7 ,...
47 10500 4.5 57' 3.7 112 51 4 tle 39
6 23
11000 000
105coo-
5.3 4.7 4.9
1011 70
76' 391 4 52!
553.13 4
62' 3.9
54
48
29 2 /5./1c:- 12 /L.7.'s 19 le7-11
45 8000 5.2 9 49; 4.6 ••• 4 11.• ••• 2 1400i 000 1 2 3.7?
000 000 le i551 1.5 4 5 q'.%
• • •• • 00. 28! 46 . 3.8 goo 11 2 000 00. 18 51' 3.11 3 I ii•? ../ ,'"
• • • 000 000
13 1601 3.8 400
1106 9500 4.7 1183 ; 601 3.8 1280 526 12 36 61
13500 18500 111500
4.2 5.1 '4.2
143: 62i 3.0 77
7;661 4.2
9 57! 2.0
40 41
10
14 .1:c.e•-' 39
31 15000 27 19000
4.3 5.1
5371 89 , 6
57 6.6 3
142
112
7 60 20
22 21 9500 4.8 62. 61' 3.7 52 21 36 7000 4.6 111 57' 3.5 20 13 7G•. 1° 41 38
11500 10500
4.8 4.7
1411 631 4.0 62 107, 3.9 110
"a
18 P1,' '- 35
" 4 /9. 1
31 7500 4.6 13! 50 1 4.5 23 13 e 50 15
7500 8500
4.7 4.9
19. 88; 4•4 40 61 54 ', 4.0 5
16 13 • • • 5 /9. 1
63 9500 4,7 11 /4-eit 59 8500 4.8
2067;
37 11! 53 44: 01 23 17 t?7.,,-;
12 6000 4.1 3 • ool • • • 5 4 17. 15 7000 4•3 16
i95 1 3.4 13 5 4
62 8500 4.8 361 571 3.8 51 25/94: 49 7000 4.5 33 , 70 3.6 214 19 15 9000 4.8 13 1 53 3.0 20 9 -7 ,4-•••
56 10000 4.5 41 11 63' 4.5 66 21 27 8000 4.1 20' 581 3.7 22 8 /4 .f` 63 8000 4•6 32 1 54 . 4•0 49 21 4,31.7,7 74 8000 4.8 26 ' 54' 4.0 44 24 f..7,( 62 7500 4.9 241 51' 3.8 51 21 ;74.3 64 8000 4.8 53': 54' 3.6 61 46 57 9500 4.8 65' 58' 3.8 72 32 29 8000 4.3 72; 53
1' 3.8j 66 37
I 986 9500 4.8 1231, 59. 307' 1289 328
6 4.8 60' 66 403: 63 , ••• 11 20000 4.5 102 65 3.8 99 38 14000 5.3 17 : 68 4.8 ' 48 4 /I
7 4141. 5.0 32 • 62 4.4 i 42 3 7:: • ^ 32 15000 5.3 42• 68' 4.1' 66 14
7 5.0 35 ' 66 3.9 32 5 22 7000 4.2 79 i 62 1 2.8 : ... , 10 59 7000 4.4 35 . 52 305 ; 6 7 /7,.r 52 7000 4•8 62 6500 4.7
54 ; 62 30: 9 75 ; 56 ' ••1 ; 37
11 z47,/ 14 ,a3.2
Total popo-lation
2316 69
117 55 42 74 46
114 96
110 139
20 29 21' 16
2458 161 120 175 95
125 93 52 84
149
Sound Deteriorating
10 68
112 9
18 113 46 '23 55
4
15 • • •
19
2193 161 120 175 95
125 92 52 84
148
63 55 47 60 63 66
5
101 14
• • • 2 5
19 13 91
105 47
39 50 46 57 51 44
12 24,
24 5 1 3
12 22
ooe
2 7
82 4.0 011.
• 0 • 6 3
11 8
1111. 35 13
000
• • •
090
000 00.
.00
30 0400
SOO • • • 00. 000
1000 000 040
O0. 000 000
000
000
000
4 • • •
4111.
7 • s
1 •••
1 8
69 090
2 1
000
090
21 2,
6.. 3
2 • • •
4 1141.
2 4141.
4
0.0 004 040
000 1111.

63;1 6:1.1* 14Lw.2.
'4.a
. a
2 /2.:5.;..". 0 £3S••/ 9 /6. Z
z: .c9.
7 3 9 G4 •ir 7 3 3 €?-5- 7 3 7.4 4 3.9/./ 4 4,37.3 1 42,92 6 /93.
214,5
1 4- 7 0
3$(.4 4 2136.4". 11 181,7 6 /57,5'. 3 60
1 350-e. • 52 /c.7
19 33..2.
12 22~•~ 13 11 /82•S 7 •2, ?tit.3
5 .3....3 0 6 !Ir.
16 3.2.1 24 ..5-33..a; 15 3 • • 30 .5- 9, 0 21 -.7 -4 ?..6. /9 -a I•7*.?„_.,
17 a 22 - / 25 -,, 4 29 43, 27 41, • • 18 L' 20 7 =3. 0 19 / 20 .73 3.2.
18 .1117 , 13 .! 14 p77, 9 25 2 /,4
17
23 .7% 6 -14..6 4 4-V., n
10 10 It: 9 :1.4-.8
2 . 10 /,-j • „f7 ••
1 • 24 .1.3?..o
1:- 12 240/. d* sa 033. •.
48 St. Louis, Mo.
Table 2.-CHARACTERISTICS OF HOUSING UNITS, BY BLOCKS: 1960-Con.
l-Total population" contains ._ persons in group quarters unless, preceded by aateriik: one Asterisk (*) denotes less than 10 percent:
two asterisk* ("). 10 Percent or morel • , •
15
8
Id
.........----=snvw..••=r.w. All housing units by condition and plumbing
housing Occupied units
I Sound 1 Deteriorating Owner occupied Renter occupied 1.01
Total
i! With Lack- I
• II all ing li plumb. some •
Total 11 fell ati Total ,,,,
With all
plumb-
Licking •OrTIC or all
faedities idated
map_
Total
, Average
value
Aver.
T.
her "b:, Total
Average c"- tract rent
Aver- age um.
nixi.•
,,,,,.
81c.c," wi woin . census
tracts
Total P.M.- I.t,on
0000' pied
111*
white
or more per-auto per in,
Ito-
inn
With No flu,h flush toilet Wart
i! facii• die.
feed. , inc.
• of
rooms (dollars)
of MOMS room
I
5:512••• /,:13••• ,'.8, 14.• • .:",,z15.ii• ..,.._716
i 0250 -•-• 178 .4 195 -1 91 7. 55
81 53 76 19 28
52 1 46 ' 6 40 38 2 70 . 70 e• • 3'i 30 000 71 7, ...
23 10
6 I 181 14'
18 8 6 15 2
L 21 • • •
••• ••• ego ... 12 ...
6
••• 1 7
29 A 19 „AO 14
' 6
asoo • 7000
8500 10000 ie.
14.1 3.8 4•6 4.4 4.3 Sol
47 32 25 4 16 32
50 49
. 57 eel, 59 58
3.1 3.5 3.4 too 3.0 3.0
61 26 43 14 1
15
2: 1
1
.../..17 4/ 18 0 19 C,20.•' 0 21•••
..5 142 4 97 '7676 4i, 90 5 197
67 42 254
32 46
66 391
254 I. 321 461
66. 39
247 31 461
g ee ••• 7 1
•••
1' 3
...I. ••• •••
1 3
&so ••• •••
... eoe 400 .00 ... ege ••• ••• ••• •••
oe• 409 ... ••• •••
' 27 22 87 10
: 16
9500 7500
, %,8500 • • •
• 14000
4.9 4.7 4.5 4.6
14 164
22 29
56 63 58 53
3.9 3.9 4.2 3.9
11 197 28 39
2
1
:2 22. • . 023 .724 D 026
H'..5 27" ..41.28.g
4 140 1.7.7 331 •.-379 7 181
!.--' 315 '1.'534 2 C.,499
58 95
132 58 89
148 176!161
58; 95
131 58 89 1
t 131 1
S7 94,
131 58 89
141 129
• 1 1
... oee pee 20 2
••• ....
1 Do. 000 11 10
• /• gee
1 ..• .00 11 • 9
••• e.w ..D goo 040 ...
li
••• go. ... gee 000 woo se.
••• ... 4.4 et. .00 4 7
19 75
'70 20 58 78
' 92
. 9500 .10000 10000 13000
' 9500 8000 7500
4.9 5.0 4.6 4.8 5.2 4e9 4.7
36 15 58 36 28 93 49
63 59 56 52 • 54 57 54
3.8 3.8 3.8 4.1 3.8 3.4 31.4
20 57 86 37 71 125 76
1 1. 1 2 2 3
6-E 08163 2359 2115 1 2046 69 235 212 231 otto 9 1021 9500 5.2 5.1
1240 67
61 60
3.9 4.4
1766 135
4
7.01..• 4%,!:12 7„2;3 /.84 Zio 5." q.216
.7.8 7 I< •
.2.58 3.0
":::*560 ....% -624 j; 394 /•••.460
2,44,*612
;t. 587 *570
.q.. 256 ;',::, 256
166 206
'124 160 115 102 152 72 95
153 '196 115 157 112 176 137 63 92
148 5 1941 2 112 3 154; 3 105; 7 159 1 17 130;. 7 60i 3 921 •••
13 13 10 7 .9 9 3 3 1 1 6 2 15 12
1 9 5 3 2
etto .3
eoe 000 000
3 4
• 1
41 ...
eg.
.eo 000 •..
e.g. see •••
.......94 goo
Ir.. ... 2
fee a.. 410, •••
95
.29 68 65 74 84 51 54
11500 11500 10000 8500 11000 12000
.10500 9000
- 904:10
5.4 5.0 4.9 5.3 5.8 5.9 4.6 4.7
107 86 80 45 108 64 17 39
62 60 71 60 63 66 51 58
4.3 3.3 3.7 4.1 4.1 4.0 3.7 3.5
168 91 88 89 131 126 52 59
0 io••• w.711
r. 8 12.e
12.293 4(279
1 ... 302
77' 83 .76
77 78
1 67
77 77 67
... 1
eee
oe. ... 2 2 9 .7
tool. idle .2
... ••• ...
foe 3
..,
41 38 29
9000 8000 9000
5.3 4.4 4.9 4.9
' 34 42 44 62
56 70 58 53
4.4 3.9 4.3 3.4
63 57 65 77
i 7
'1 l
7,3 13..e 2w 414.e. 0.1,15 w...5- 16
14 146 5.' 231 r.7! 204 .3 220
'97. 64 56 61
56 39 57
87 87 87 56 39 56
... wt.. ...
1
10 10 8 7 13 13 4 3
0.. . .1 eett
1
oo. goo es. sow
of. ... 4
*go
29 5 22 26
9000 ... 9500 9000
4.8 4.8 5.0 5.2
58 28 20 62
65 54 54 63
4.0 4.1. 4.3 3.5
51 41 30 62
1 l 1
.2, 17 .9 18 .e• 19
1/ 278 12,1.309 /5376
83, 101 113
.82 92i 113
73 90 109
9 2 4
1 gee 9 9
otos goo
1 ... ....
etwe .4.• *so
... et. •
17 39 40
10000 9500 8000
5.2 4.8
58 68
55 57
3.8 305
84 91
Q..5r20 J...821.1.1 3..Z.22etto 6,523000
/3 336 (1-. /55 4 206 /24.309
99 43 60 1 .74
41 28 44 53
37
44 U
281 *ea 4
two. 1
58 56 15 14 16 16 21 1 21
2 1
gee to.
...
... ooe *se
ego gee .oe •••
' 30 15 33
• 43
7500 15000 9500 7500
564 4.8 5.2 5.3
66 27 24 26
58 59 50 32
4•2 4.2 4.3 3.7
41 49 56
60
6-F 07531 2278 i 1482 . 1309 173 660 605 53 2 136 748 11000 6.0 1387 58 3.8
3.5 1807
65 4:
.s...i.r1••• 3,. ! 2.• • 7,.13
'Ss:'34000 314-5". 1:7C, 6 o 7
ft 225 4 103. /Z 309 IS 439 9 215 / 20 490479
. 70 37 108 199 ' 77 12 182
50 34 67 43 35
fitto 182
40 -32 61 37 24 • Ite 108
10 2 6 '6 11
.... 74
20 15 3 1 40 34 59 53 19 13 12 12 sq. 000
5 2
6 6
'wee 0.8
61 es.
••• ee.
000 otwo meg 000
••• etito
1 97 23
too 000
25 11 •34 20 17 1
54
10500 eg.
9500 '13000
' 11000 - tee 11500
5.9 4.7 5.4 6.2 8.2 ego 5.7
43 23 70 133
. 56 9
118
51 52 48 49 48 47 53
4e0 3.6 3.2 3.7 3.7 2.8
' 31 97 147 64 ••• 154
•
o EI••• ti *363 109 109 95 14 ••• ••• ••• •• • ••• • 55 11000 6.6 46 57 3.5 1 93 77
00.7 9.• • /0-.350 1041 72 70 2 29 28 1 ••• 3 48 8500 5.6 51 53 3.7
I_.-i: C10.• • LI. 275 104 1 15 13 2 86 84 .... 2 3 26 11500 4.3 70 47 3•3 72
y,.., i le • • ,.6.12gee .5/713...
c-.. 14... ..) 15... alt.... c 17... ': 18•• •
...,. ..*'20. • •
'4,1.353 /e0440 Z t *522 S24512 4. sm9111 /e 04:35 ht., 4144 t I: 331 I ; 250
105 120q 12611 145; ego 106 142
951, 73
,i in 76 81 145' •*es 106
'142
1
89 II 58
42 • 76 . 81 114 oog 102 136 87 56,
••• oo. ••• 31 000 4 6 2 2
60 60 44 44 42 42 ... ..•
' sop oeo owe ego .•• •••
5 4 15, 15
000
••• .. • og. 000 •••
1 ...
000
••• woe 000 oog ••• • • • ...
00....... 55 3
3 000 0em 'eq. •••
1 040
27
59 80 0.0 34 38 30 23
9500 13000 11000 14000 00.
11000 11000 12000 10000
6.6 5•9 6.9 6.6 000 7.3 5.0 4.8 4.7
75 62 63 65 00.
72 91 61 47
54 54 62 73 000
82 61 60 56
3.5 3.8 4.1 3.5 000 4.3 4•41 4•14 4.0
70 101 111 113
94 100 55 67
.00
.,,i7'. 421... ; 1 245 6511 53 53 e.g. 12 12 .........25 10500 5.4 38 46
61 6)
4.4 4.4
60 54
V.:./322moo ...:/...423•••
-324"e ,4".2Seee ...1'26.e.
, ../27...
::- 223 •II'• 206 , 124
:..-- 299 '..- 146 t 140
67 5611
40
321 67% 37"
10 2 1 9
'25 36
10 2 1
. 8 25
• 36
Do. .:• so. 1
... 000
55 , 49$ 54 46 3li 29 58 481 12 12 41 41
6 B 2 10 •eve •••
owto .6. eet. oe. ••g goo
...
... "I. oo. .1poo
15 21 7 11
'18 14
9500 11000
4.0 8000 9000
12500
5.2 5.5 5.0 6.1 5.8 6.1
32 24
50 16 26
56 59 69 45 89
4.3 468 4.9 3.6 4•3
49 30 61 15 27
. .
6•4 .8270 2459 2164 2061 103 247 .198 48 1 48 1249 1.12000 5.6 1105 57 3.8 3•14
1 2092 13
.:::, 1 0 2••• 0 3".
...... 75 -.9 70 'r 104
28 221 401
28 22 40
27 21 ft0
1 1
•••
••• • •• • ••
••• ••• •••
••• • •• •••
••• r•• •••
••• ••• •••
3 14 10
I 12000 11000
.......25 5.0 4.8
a 28
56 53
105 3.1 3.3 4.2
15 18 20
e,.> 4••• .2,•• 5.•.
.7,,v6000 Ct .?
S. s.189 -1 1;0 '53 .:., - 70
34 16 27
50 i 46 33 16 27
46 32 16 27
••• . 1
ette *two
4 1
wt.. toe.
4
All.
...
ore 1 .ee
000 ee.
bee 00. 000 ogo
.... eog 000 gee
30 23 ego 24
10000 9000 • •
9500
5.3 4.1
• •• 4.6
17 10
• 16 . 2
57 51 53 000
393' 3.0 .00
18 16 17
:-. I 8000 4,...' 152 44 43. 43 ... & .........20 10000 4.6 21 , 62 4.5 37 23
610 $700118 27 27 27 ..... .... tog. toe. twee ... 22 16000 5.0 ' 6 67 4.2
011". C $0117 27 27 27 ... see ... t000l es. ... 22 16000 5.2 4 1... oe. 3.9
24 120
ODZ..13e :,. 14..•
r•I.,215..•
2; 491 II 268 z-...I.; 211
132 89 66
89 29
1291 126 84 28
3 5
• 1
3 ••• ' 32
3 ••• ••• ••• -32 •••
••• ••• •••
••• ••• .
89 41
5 30
11000 14500 9000
5.8 5.8 5•4
39 44 29
56 , 65 56 , 56
30 4.1 3.8
67 56
176
.
, ...7.5'16..• "..t; 610 , 212 205 193 12 , 6 . 6 ••• ••• ' 1 70 13000 4.9 114
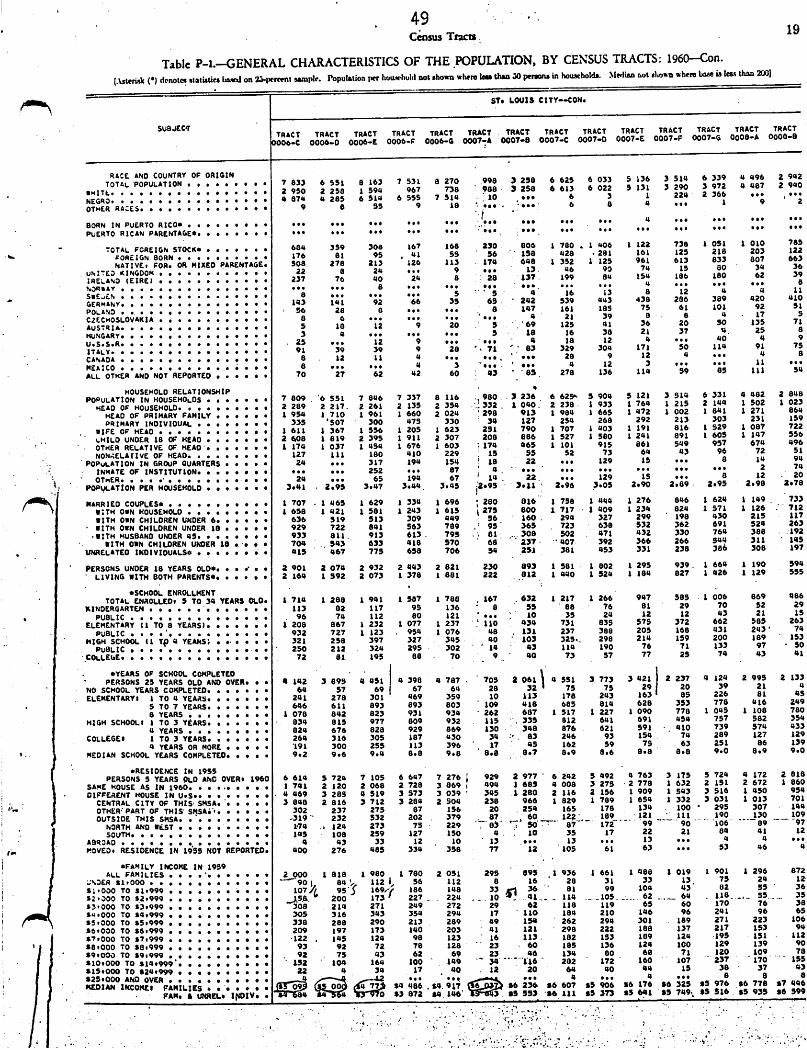
49 Census• Tracts,
Table P-1.-GENERAL CHARACTERISTICS OF THE POPULATION, BY CENSUS TRACTS: 1960-Con. I.Lsterisk (1 denotes statistics based on 23-percent sample. Population per hou.iellohl not shown where loo than 50 persons in households. Median not shown where base is loss than 2001
STe LOUIS CITY--CON.
SUBJECT TRACT TRACT TRACT TRACT TRACT TRACT TRACT TRACT TRACT TRACT TRACT TRACT TRACT TRACT 0006-C 0006-D 4006.E 0006.4 0006-4 0007-A 0007-B 0007-C 0007-0 0007.E 0007-F 0007.4 0008.4 0008.8
19
RACE AND COUNTRY OF ORIGIN TOTAL 'POPULATION • . .
4.117L NEGRO OTHER RACES
BORN IN PUERTO RICO* PUERTO RICAN PARENTAGE*
TOTAL FOREIGN STOCK FOREIGN BORN • • • . • • • • • • NATIVE, FOR. OR MIXED PARENTAGE
UNI7E3 KINGDOM • • • • • • • • • • • • IRELAND 1E18E1 .NORWAY SAEJEN GERMANY POLAND • .......... • CZECHOSLOVAKIA AUSTRIA HUNGARY U S S R ITALY CANADA MEA:CO • • • • • • • ..... • ALL OTHER AND NOT REPORTED
HOUSEHOLD RELATIONSHIP POPULATION IN HOUSEHOLDS
HEAD OF HOUSEHOLD. . . • •
HEAD OF PRIMARY FAMILY PRIMARY INDIVIDUAL
WIFE OF HEAD LHILD UNDER 18 OF HEAD OTHER RELATIVE OF HEAD NON,TELATIVE OF HEAD
'POPuLATION IN GROUP QUARTERS INMATE OF INSTITUTION OTHER. • • • . • .. . • •
POPULATION PER HOUSEHOLD
MARRIED COUPLES* WITH OWN HOUSEHOLD WITH OWN CHILDREN UNDER 6 WITH OWN CHILDREN UNDER 18
.WITH HUSBAND UNDER 45. • WITH OWN CHILDREN UNDER 18 • •
UNRELATED INDIVIDUALS* . • .... • .
PERSONS UNDER 18 YEARS OLD* LIVING WITH BOTH PARENTS*
*SCHOOL ENROLLMENT TOTAL ENROLLED. S TO 34 YEARS OLD.
KINDERGARTEN • • • • • . ...... • PUBLIC
ELEMENTARY 11 TO 8 YEARS) PUBLIC • • • • • •
HIGH SCHOOL tt 7p 4 YEARS; . e• • • • • PUBLIC
COLLEGE
*YEARS OF SCHOOL COMPLETED • PERSONS 25 YEARS OLD ANO OVER. • • NO SCHOOL YEARS COMPLETED ELEMENTARY' 1 TO 4 YEARS
5 TO 7 YEARS 8 YEARS
HIGH SCHOOL' I TO 3 YEARS 4 YEARS
COLLEGE' 1 TO 3 YEARS 4 YEARS OR MORE
MEDIAN SCHOOL YEARS COMPLETED
7 833 6 551 a 163 7 531 a 270 ,998 3 ase 6 625 6 033 5 136 3 514 6 339 4 496 2 942
2 950 2 258 1 594 967 738 ' 988 • 3 258 6 613 6 022 5 131 3 290 3 972 4 487 2 940
4 874 4 285 6 514 6 555 7 514 • 10 • 3 1 224 2 366 000 00
;
•
9.
• 95 9 le 4 see 1 9
000 000 000 Ow. mos .... eoo 000 000 4 0.0 000 000 .00
D.. Se. 000 000 0.0 . 000,
41.0 ••• e... . . • see 000 000 OD.
6114 359 308 167 168 230 806 1 780 1 406 1 122 738 1 051 1 010 785
176 81 95 , 41 55 ' 56 ' 158 428 •281 161 125 218 203 122
508 278 213 126 113 174 648 1 352 1 125 961 613 833 807 663
22 8 24 000 9 13 46 90 74 15 80 34 36
237 76 40 24 B .1; 137 199 84 154 186 180 62 39
00. Oell 8 ... .0.
•0...
• .0. a ...
•••..• 8
a 000 000 0.6 5 4 16 13 •8 12 4 4 11
143 141 92 •66 35 65 ' 242 539 443 438 286 389 420 410
56 28 0 ... • • • 8. 147 161 185 75 61 101 92 51
0 6 ... 0.0 .80 0.0 4 21 39 B 8 4 17 5
5 18 12 • 9 •20 • 5 '69 125 41 36 20 50 135 71
3 a ... ... ... 5 18 16 38 21 37 U. 25 8
25 000 12 9 00. 000 ' 4 18 12 4 011. 40 4 9
91 39 39 9 aa • '. 71 ' 03 329 304 171 50 114 91 75 , B 12 11 4 Oew 000. ' 000 28 9 12 a 000 4 8
8 0.0 000 4 3•
'see ' •ee 4 12 3 .00 000 11 ...
70 27 62 42 60 43 ' '85 278 136 114 59 85 111 54
. 7 809 '6 551 7 846 7 337 8 116 .,980 3 236 . 6 625. 5 904 5 121 3 514 6 331 4 482 2 848
2 289 2 217. a 261 2 135 2 354 :332. 1 040. 2 238 1 933 1 764 1 215 2 144 1 502 1 023
1 954 1 710 1 961 1 660 2 024 '298 913 1 984 1 665 1 472 1 002 1 841 1 271 864
335 '507 300 475 330 34 127 254 268 292 213 303 231 159
1 611 1 367 1 556 1 205 1 623 251 790 1 707 1 403 1 191 816 1 529 1 087 722
2 608 1 819 2 395 1 911 2 307 208 886 1 527 1 580 1 241 465 1 101
891 1 605 1 147 556
1 174 1 037 1 454 1 676 I 603 174 915 861 549 957 674 496
127 111 180 410 229 15 55 52 73 64 43 96 72 51
24 000 317 194 154 se 22 000 129 15 0.6 8 14 94
000 00. 252 .00 000 000 SOO 00. • • • 2 74
24 .00 65 19487
i 14 20 22, 000 129 /5 OD. 8.1:
)205 3041 . 2.95 3.47 3.44. 3.45 • ' 3.11 ' 2,96 3.05 2.90 2.89 2.95 2.98 .a.
1 707 . 1 465 1 629 1 334 1 696 •-280 816 1 . 758 1 444 1 276 8461 624 1 !::
733
1 658 1 421 1 581 1 243 1 615 i275 800 1 717 1 409 1 234 712
636 519 513 309 449 56 160 . 294 327 299 ' 198 430 215 117
929 722 841 563 789 ,' 95' 365 723 638 532 362 691 524 263
933 811. 913 613 795 .. 81 ...308 502 471 432 330 764 388 .192
704 ' . 543 633 418 570 68 - 237- ''407 392 366 266 549 311 145
415 ' 467 775 658 706 54 251 381 453 331 238 386 308 197
2 901 2 074 2 932 2 443 2 821 230 893 1 581 1 002 1 295 939. 1 664 1 190 594
2 164 1 592 2 073 1 378 1 881 222 812 1 ciao 1 524 1 184 827 1 426 1 129 555
1 714 1 288 1 941 1 587 1 788 . 167 ,632 1 217 1 266 947 585 I. 006 869 486
1 208 867 1 232 1 077 1 237 ! 110 434 731 835 575 372 662 585 263 , 96 74 112 80 121 ' eso - 10 35 24 12 12 43 21 15
932 727 1 123 . 954 I 076 48 . 131 237 388 205 168 431 243' 74
321 258 397 327 . 345 40 ' 103 325, 298 214 159 200 189 153
250 212 324 295 - 302 " ' 14 43 114 190 76 71 133 97 • 50
113 02 117 95 136 ' 8 ' 55 ' 88 76 81 29 70 52 29
72 81 . 195 ea . 70 9 40 73 57 77 23 74 43 41
4 142 3 895 4 451 1 4 398 4 787 . 705 2 061 . .
4 551 3 771 3 421 l 2 237 4 124 2 995 2 133 75 75 29 20 39 21 4
64 57 69 67 64 28 32178 243 163 85 226 81 45
241 '
278 301 469 359 10 113685 814 628 353 778 416 249 646 611 893 893 803 - 109
418 I 517 1 227 1 090 778 1 045 1 108 780 1 078 842 823 931 934 - 262 ' 687812 641 691 454 757 582 354 834 815 977 809 932 115 -. 135876 621 591 .. 410 739 374 433 824 676 828 929 869 130 " 348246 93 154 74 289 127 129 264 316 305 187 430 34 :.. 83162 59 75 63 251 86 139 '191 300 255 113 396 ' 17 ' 458.9 8.6 8.8 8.8 9.0 8.9 9.0 9.2 9.6 9.4 8.8 9.8 . 8.8 . .8.7
6 614 5 724 710566477276' i 929 2 977 ' 6 242 5 492 4 763 3 175 5 724 4 172 2 818 I 741 2 120 2 068 2 728 3 869 i 494 1 685 4 008 3 275 .2 778 1 632 2 151 2 672 1 860
• 4 469 3 285 4 519 3 573 3 039 • 345 _1 280 2 116 2 156 1 909 1 543 3 516 1 450 954
3 848 2 816 3 712 3 284 2 504 . 238 966 1 829 I 789 I 654 1 332 3 031 1 013 701
302 237 275 07 156 20 . 254 165 178 134 . 100 295 307 144
.319" 232 532 202 379 . 87 , 60. _ 122'. 189 - 121 ' 111 190 130 109
174 a 124 273 75 229 - 83- 7; 50 7.7 '. 87- 172-- -99 -- -- 90 '106' - ea -97
145 108 259 127 150 4 : 10 35 17 22 21 84 41 12
4 43 33 12 10 ' 13 . 13 .0 ,0 13 ... 4 4 ...
400 276 485 334 358 77 12 105 61 63 ... 53 46 4
2 000 1 ale 1 aeo 1 780 2 051 901 84', 112 I., 56 112
107.4 95..5 169,e 186 148 ...kW 200 173 f 227 __ 22a
308 214 271 249 272 305 316 343 354 294 338 288 290 213 , 289 209 197 173 140 203 .122 145 124 98 123
93 92 72 78 128 . 92 75 43 62 69 ' 152 104 164 100 - 149
22 4 34 17 40 42 ••• ••it
rbaa Ira -564 0 63 872 64 146' 6;74 Cf$17 $4 486 .$4.917
st
295 845 1 936 1 661 1 488 1 019 1 901 1 296 16 ' 28
872
8 31 33 13, 75 24 12. 81 99 104 43 02 55 36
1.18. . 55. 114 35 33
51_41_ .. 29 62 118 119
1465 6 ---- 64
170 76 38 17 110 184 210 96 241 96 65 49 154 262 294 301 189 271 223 106 41 121 298 222 188 137 217 153 94
16 113. 182 153 189 124 -195 151 112
23 , 60 185 136 124 100 129 139 90
23 46 134 00 71 120 109 78
34 116 282 - 172 - 160 107 237 170 155
12 20 04 40 44 15 38 37 43 ... a ... a ..• a a a
16 236 46 607 S5 906 16 176 96 325 $5 976 56 778 47 446 7. $5 553 '66 111 S5 373 SS 641 85 749., $5 516 15 935 $6 599
*RESIDENCE IN 1955 PERSONS 5 YEARS OLD AND OVER. 1960
SAME HOUSE AS IN 1960. • • • .0 • • •
DIFFERENT HOUSE IN U.S.. • CENTRAL CITY OF THIS, SMSA... • • • OTHER PART OF THIS' SMSA -, OUTSIDE THIS SOSSA
NORTH AND WEST SOUTH
ABROAD • • . • • . • ..... • • • MOVED. RESIDENCE IN 1955 NOT REPORTED.
*FAMILY INCOME IN 1959 ALL FAMILIES . • .•
CINDER 11.000 11.000 TO 41.999 12.000 TO 42.999 $3.000 70 *3.999 $4 .000 TO 44,999 15.000 TO 15.999 10.000 TO 46.999 47 .000 TO $7,999 48.000 TO 48.949 49.000 TO 49.999 410.000 TO $14,999 . 415.000 TO 424.999 $25.000 AND OVER MEDIAN INCOMES FAMILIES • • • • • •
FAN. 4 LOMELI. INDIV• •
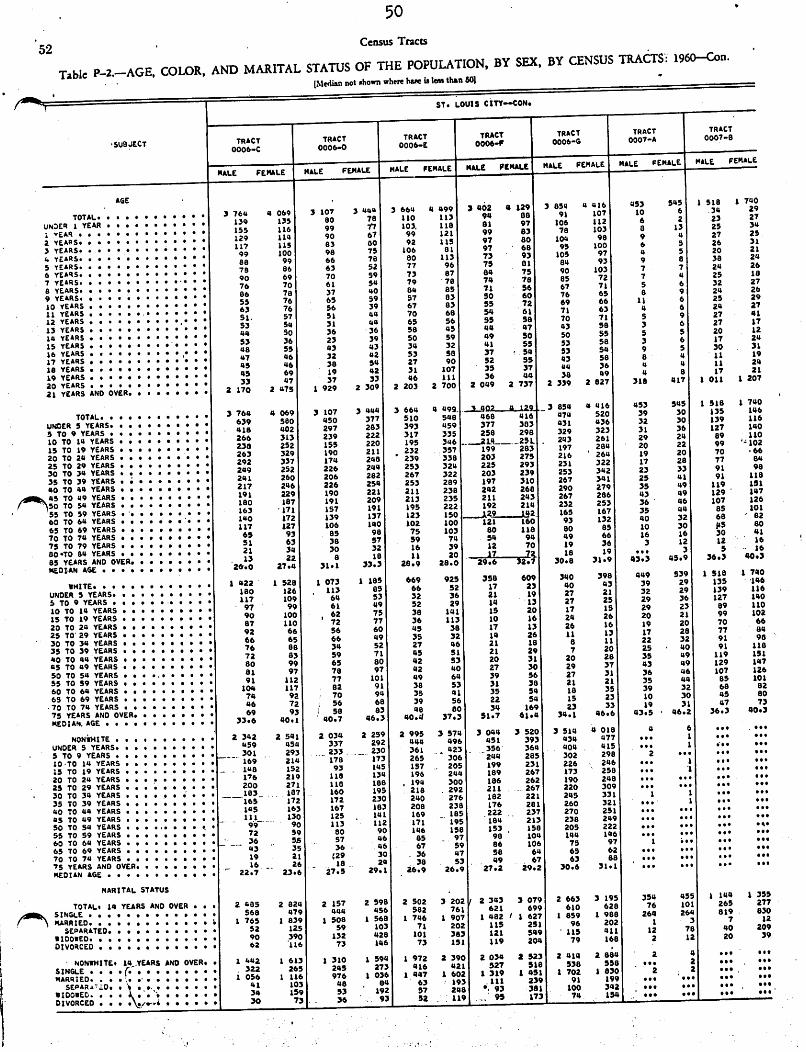
'SUBJECT TRACT 0006-C
TRACT 0006-0
TRACT 0006-E
TRACT 0006-F
TRACT 0006.4
TRACT 0007-A
TRACT 0007-B
MALE FEMALE MALE FEMALE MALE FEMALE MALE FEMALE MALE FEMALE MALE FEMALE MALE FEMALE
AGE
TOTAL UNDER 1 YEAR 1 YEAR 2 YEARS 3 YEARS 4 YEARS S YEARS 6 YEARS 7 YEARS 8 YEARS 9 YEARS 10 YEARS 11 YEARS 12 YEARS 13 YEARS 14 YEARS 15 YEARS 16 YEARS 17 YEARS 18 YEARS 19 YEARS 20 YEARS 21 YEARS AND OVER
3 764 139 155 129 117 09 88 78 90 76 86 55 63 51. 53 44 53 48 47 45 45 33
2 170
4 069 135 116 114 115 100 99 86 69 70 78 76 76 57 54 50 36 55 46 46 69 47
2 475
3 107 80 99 90 03 98 66 63 70 61 37 65 56 51 31 36 23 43 32 38 19 37
1 929
3 444 78 /7 67 80 75 78 52 59 50 40 59 39 411 44 36 39 43 42 54 42 33
2 309
3 664 4 499 110 113 103. 118 99 121 92 115 106 01 BO 113 77 96 73 87 79 78 84 85 57 83 67 83 70 68 65 56 58 45 50 59 34 32 53 58 27 90 31 107 46 111
2 203 2 700
3 402 4 129 94 88 81 97 99 83 97 80 97 68 73 93 75 81 84 75 74 78 11 56 50 60 55 72 54 61 55 98 44 47 49 50 41 55 37 ',54 52 95 35 37 36 44
2 049 2 737
3 854 91 106 78 104 95 405 84 90 65 67 76 69 71 70 43 50 53 53 43 44 38
2 339
4 416 107 112 103 98 100 97 93 103 72 71 65 66 63 71 58 55 58 54 58 36 49
2 827
453 10 6 8 9 6 11 9 7 7 5 0 11
Cl 5 3 5 3 9 8 4 4
318
545 6 2 13 4 5 5 8 7 11 6 9 6 6 9 6 5 6 5 4 4 8
417
1 518 . 34 23 25 27 26 20 38 24 25 32 24 25 24 27 27 20 17 30 11 11 17
1 011
1 740 29 27 30 25 31 21 24 26 14 21 25 25 21 41 11 11 24 31 /5 24 21
1 201
TOTAL UNDER 5 YEARS 5 TO 9 YEARS 10 TO 14 YEARS 15 TO 19 YEARS 20 TO 24 YEARS 25 TO 29 YEARS 30 TO 34 YEARS 35 TO 39 YEARS 40 TO 44 YEARS 45 TO 49 YEARS 150 TO 54 YEARS 55 TO 59 YEARS 60 TO 64 YEARS 65 TO 69 YEARS 70 TO 74 YEARS 75 TO 79 YEARS 80.TO 84 YEARS 85 YEARS AND OVER MEDIAN AGE
3 764 639 418 266 238 263 292 249 241 217 191 180 163 140 117 65 51 21 13
26.0
4 069 580 402 313 252 329 337 252 260 246 229 187
'171 172 127 93 63 34 22
27.4
3 107 450 297 239 155 190 174 226 206 226 190 191 157 139 106 85 38 30
a 31.1
3 444 377 283 222 220 211 248 244 282 254 221 209 191 137 140 98 57 32 18
33.3
3 664 4 499..1902 510 548 393 459 317 335 195 346 232..357
' 239 338 253 324 267 322 253 289 211 238 213 235 195 222 123 150 102 100 75 103 59 74 16 39 11 20
28.9 28.0
it 129_3 468 416 377 303 256 298
---..219--- _251 199 283 203 275 225 293 203 239 197 310 242 268 211 243 192 214
-........129 142 121 160 80 110 54 94 12 70 17 72.
854 474 431 329
. 243 197 216 231 253 267 290 267 232 165 93 80 49 19 18
30.8
4 416 520 436 323 261 284
' 264 322 342 341 279 286 253 167 132 85 66 36 19
31.9
453 39 32 31 29 20 19 17 23 25 35 43 36 35 40 10 16 3
004.
43.3
545 30 30 36 24 22 20 28 33 41 49 49 46 44 32 30 16 12 3
4509
1 516 135 139 127 89 99 70 77 91 91 119 129 107 05 68 55 30 12 5
36.3
1 741 144 614 141 111
'101 •64 81
91 114 151 14' 121 101 81 84 41 11
' 11 40.: 2906 3207
/MITE UNDER 5 YEARS 5 TO 9 YEARS 10 TO 14 YEARS 15 TO 19 YEARS 20 TO 24 YEARS 25 TO 29 YEARS
1 422 180 117 97 90 87 92
1 528 126 109 99 100 110 66
1 073 113 64 61
, 62 72 56
1 185 85 53 49 75 77 60
669 925 66 52 32 36 52 29 38 141 36 113 45 30
358 609 17 23 21 19 14 13 15 20 10 16 17 13
340 40 27 27 17 24 26
398 43 21 25 15 26 16
449 39 32 29 29 20 19
539 29 29 36 23 21 20 28
1 518 135 139 127 89 99 70 77
1 741 141 11' 141 111 10 61 8
30 TO 34 YEARS 35 TO 39 YEARS
66 76
65 86
66 34
49 52
35 32 27 46
14 26 21 18
11 8
13 11
17 22 32
40 91 91
9 11
40 TO 44 YEARS 45 TO 49 YEARS
72 80
83 99
59 65
71 80
45 51 42 53
21 29 20 31
7 20
20 28
25 35
• 49 49
119 129
15 14
50 TO 54 YEARS • •• 55 TO 59 YEARS
as 91
97 112
78 77
97 101
42 40 49 64
27 30 39 56
29 27
37 31
43 36 46
44 107 85
12 10
60 TO 64 YEARS 65 TO 69 YEARS .70 TO 74 YEARS
104 74 46
117 92 72
82 70
. 56
91 94 68
36 53 35 41 39 56
31 38 35 54 22 54
21 18 15
21 35 23
35 39 10
32 30
68 45 47
8 8 7
75 YEARS AND OVER 69 93 ' 58 83 48 80 34 169 23 33 19 31 36.3 40.
MEDIAN• AGE 33.6 40.1 ' 40.7 46.3 40.11 37•3 51.7 61.4 34.1 46.6 43.5 ' 4602
NON11051TE 2 342 2 541 2 034 2 259 2 995 3 574 3 044 3 520 3 514 4 01E1 4 6 000 00
UNDER 5 YEARS 459 454 337 292 444 496 451 393 434 477 100 1 000 O.
5 TO 9 YEARS 10'70 14 YEARS 15 TO 19 YEARS
--. 301 169
_ _ 148
293 214 152
_ 233 178 93
_. 230 173 145
361 _ 423 265 306 157 205
. _356 364 244 285 199 231
404 302 226
415 298 246
014
2 11,
1 114
1
010
0.0
114
00
14
• 0
20 TO 24 YEARS 25 TO 29 YEARS
176 200
219 271
118 118
134 186
196 244 , 194 300
189 267 186 262
173 190
258 248
ova 100
1 101
001
• .10
01
• •
30 TO 34 YEARS 35 TO 39 YEARS
- _103_ 165
187 172
160 172
195 230
218 292 240 276
211 267 182 221
220 245
309 331
000
1 0410 •
1 001
000
01
11
• 1 AD TO 44 YEARS 145 163 167 183 208 238 176 281 260 321 tee 1 001
45 TO 49 YEARS 50 TO 54 YEARS • . ••
_ 111 99
_ 130 90
125 113
141 112
169 185 171 - 195
222 . 237 184 213
270 238
251 249
000
•••
000
011
111
• • •
$1
11
55 TO 59 YEARS 72 59 80 90 146 158 153 158 205 222 00411 010 000 ••
60 TO 64 YEARS 55 57 46 05 _ 97 90 104 144 146 010 1101 000 44
65 TO 69 YEARS 70 TO 74 YEARS
3 19
35 21
36 ' 129
.46 30
67 59 . 36 47
86 106 58 64
75 65
97 62
1 Oft
6.. 110
... $40
04
11
75 YEARS AND OVER 16 _ 26 18 24 38 53 49 67 63 88 191 000 410 01
MEDIAN AGE r- 22.7 23.6 - 27.5 29.1 26.9 26.9 27.2 29.2 30.6 31.1 ... ... • • • of
MARITAL STATUS
TOTAL. /4 YEARS AND OVER a • • 2 485 2 824 2 157 2 598 2 502 3 202/ 2 343 3 079 2 663 3 195 354 455 1 144 1 3!
SINGLE • 0 • • • • • • •••••• 568 479 444 456 582 761 621 699 610 628 76 101 265 21
MARRIED ' 1 765 1 839 1 508 1 568 1 746 1 907 1 482 / 1 627 1 859 1 980 264 264 819 8:
SEPARATED 52 125 59 103 71 202 115 251 96 202 1 3 7 1
41004E0 90 390 132 428 101 383 121 549 ' 115 41/ 12 78 40 2(
DIVORCED 62 116 73 /46 73 15/ 119 204 79 168 2 12 20 1
NONIAN/TE, I4,VEARS AND OVER. • 1 442 1 613 1 310 1 594 1 972 2 390 2 034 2 523 2 414 2 884 2 4 ... ..
SINGLE . • • • 1.0 322 265 245 273 416 421 527 518 538 558 11100 2 001 01
MARRIED 1 SEPARA-.31 1
\
0
,..
0 •••• WIDOVEG DIVORCED
•••
/r.11
1 056 41 34 30
1 116 103 159 73
976 48 53 36
1 036 , 84
192 93
1 447 1 602 63 193 57 248 52 119,.
1 319 1 451 111 239
.• 93 381 95 173
1 702 91 100 74
1 830 199 342 /94
2 ... 000
' 000
2 e s. 000
000
OOP
000
011
001
11
0
1 ,
0
1
01
2
3 3
•
•
•
5 7 0 2 9 9
•
•
•
••
50 •
52 Census Tracts
Table P-2.-AGE, COLOR, AND MARITAL STATUS OF THE POPULATION, BY SEX, BY CENSUS TRACTS-: 1960-Con.
INtedian not Amen where hare is teen than 503
ST0 LOUIS CITY--CON.

2 502 1 972 70.8
1 972 1 870
102 5.2 530
2 343 1 701 72.0
1 697 1 603
94 5.5 642
2 063 2 109 79.2
2 101 1 960
141 6.7 554
358 274
76.5 257 249
8 3.1 84
1 144 936
81.8 936 901
35 3.7 208
2 464 1 948 79.1
1 944 881 63
3.2 516
2 109 1 712 8102
1 712 1 618
94 5.5 397
1 820 1 460 79.9
1 460 1 419
41 2.8 368
1 241 993
80.0 993 973
20 2.0 248
2 224 1 770 79.6
1 767 1 696
71 4.0 454
1 605 1 267 78.9
1 267 1 255
12 0.9 335
1 051 828
70•8 824 801
23 2.8 223
2 485 2 157 1 998 1 730 80.4 00.2
1 998 I. 720 1 861 1 639
137 87 6.9 5.0 487 427
2 824 2 598 3 202 3 079 3 195 451 1 355 2 919 2 466 2 258 1 506 2 685 1 943 1 453
1 312 1 213 1 654 1 229 1 545 154 546 1 072 921 831 583 1 208 690 552
46.5 46.7 51.7 39.9 48.4 34.1 400 36.7 37.3 36.8 38.7 45.0 35.5 38.0
1 223 1 144 1 525 1 193 1 457 150 520 1 058 865 807 563 1 170 686 535
89 69 129 36 88 4 26 14 . 56 24 20 38 4 17
6.8 5.7 ' 7.0 2.9 5.7 ... 4.8 1.3 6.1 2.9 3.4 3.1 0.6 3.1
719 609 69U 510 767 92/ 294 }4:37/5 901
36 1 512 1 385 1 540 1 850 1 650 297 / 009 847 1 545 1 427 923 1 477
218 1 2 /7 9 187 •Apo 3247 440 7
!.." , 347 233
/
7 659 47 39 151 ../
32 •
a
1 1161 1 639 1 870 L1 60 1 40 249 901 881 1-618 . 1 419 t 973 I. 6 6 1 255 801 . 61 67-108- 35-----1a5 22------52 171 66 - 75' I. -• • 54 - 91' ' -128 - - - 117 ----
43 41 67 50 1.--79--_-.111.9. 1 54 .85 _ 88 127
lra-----190--...-T68 ! 157 232 39 124 277 ' 213 232 160 330 M 179 113-- 47 37 29 39 31 15 49 150___ _80 131 62 72 106 93
-2113222 174--126--206 28 290 460 416 345 - 243 - - 320 --117--151- 534 363 463 374 325 51 ''215 363 445 302 232 467 236 122
--:-...-- -- 477- 13-7- 12-7 .16-7 ... ____ , • • ..,... ..• .. . , 5 .••`.._. ' tr---- • • • --- -- --••• • - • • *---- 210 229 298 278 394 33 _ 56 200 _ .__ 131 96 93.. • 140 . _ 75 . _ 65
262 191 272 299 271 4 47 45 94 40 - 49 124 27 . 10
- 272 ------295'-- 278 - -233 - 304 ---- - -37 -- --ZS - - - -42 ----- 89 - • - 49 - 22-- • - 67 - 99 3
1 223 1 144 1 525 1 193 1 457 150 520 '1 058 865 807 563 1 170 686 535
---•.-154---., 1Cr -306- -110 219 1... 40 -Ws- ---70 --al - -72- -189- -35- -58 ----
12 13 12 12 20 gee B 62 10 26 II 24 16 35 250-198 -142.----1 60 - "197 i53-- 26T - 322 -- -338 ' ---' 357 - -287- ' - 411 - -' -280 - '293
45 44 40 50 15 som • 43 125 • 03 83 57 58 102 44
. . a ----72I7 -"-7r 9' VII. 4 117 8 12 toi 158 151 143 184 137 48 77 ' 137 194 124 • 82 220 . 103 - • 04 '89 126- -197- -255- --2/7- oe. ' 13- B .." 7 -"-30 Ir..' 38 22 464
259 - 200 335 • 274 387 ' 13 ' 50 -- 71 -• B9 • 72 39 las
8 11 20 ' . 12 24 404 ' 5 440 8 044 ••• a 480
--227'107--309-129---17E/6 13 38 58 , 60 ..; 3S 51 13
3 084 2 783 3 395 2 796 3 417 399 1 421 2 939 2 483 2 546 2 181 2 756 2 339 2 542 358 '1 178 a 403 2140
452 506 459 316 711 29 ' 12E1 ' 324 204 77 92 164 136 149 12 110 ' 196 135
9 4 16 5 15 400 5 • 16 4
3 084 2 783 3 395 2 796 3 417 399 1 421 2 939 2 483 4 000 000 000 5 loot ' 400 ' 64* • • •
100 119 63 93 107 8 ' 81 134 121 865 727 730 608 641 101 520 1 044 1 079
24 9 12 29 12 600 5 12 43 111 94 . 123 113 113 4 ' 49 91 ' 89 101 106 63 79 96 27 115 297 315 222 232 109 86 115 32 77 113 -128 39 24 67 38 27 8 49 56 ' 41
125 75 121 90 97 12 62 139 ' 124 56 46 98 39 45 '. 17 34 '63 58 20 11 26 17 46 16 48 80 102 87 130 111 117 90 45 , 81 187 179 77 67 87 70 130 19 • 25 75 08 73 77 99 80 78 9 ' 59 113 92 49 31 70 51 60 5 - 73. 123 • 75
140 52 37 39 43 12 49 136 67 99 '58 135 75 116 B 37 67 64
206 220 240 353 239 24 187 400 299 40 29 66 56 54 13 50 83 72
104 142 245 283 244 • • • 13 8 12 133 134 '119 228 103 17 30 66 36 211 172 466 146 273 • • • 32 14 29 113 211 131 88 269 8 20 88 56 80 59 70 77 113 17 39 97 37
246 234 224 196 298 29 . 94 227 151 536 451 613 353 564 69 104 264 205
1 536 2 866 1 253 2 106
219 641 60 119
4 440
1 536 2 866 foot tot 59 105
57B 927 44
75 99 112 225
• 63 170 41 64 111 119
• 21 72 40 41
115 93 37 111 50 74
• 78 79 34 104 4 59
196 253 19 67 23 42 21 86 64 113 51 222 62 100
144 337 116 179
1 336 1 053
170 113
. 044
1'336
76 47 746 450
8 13 92 .54
162 79 99 53 36 20 98 62 al • 16 59' '53
151 100 59 20 67 ' 39 59 36 93 79 15 15
203. 210 52 30 22' 26 23 12 444
59 53 65 107
171 106 212 121
2 226 '1 801
263 150
12
2 226 too 104 748
' 8 135 180 65 37 69 44 73
137 52 82 80 89 38
327 38 30 72 24 91 57
154 240
111 941 504 251 90 16
1 941
390 219 446
•••
1 356 872 *to
96 336 14 78 4 9 4 33
53 28
142 305 *so
571 142 33 25 66
2 851 A 401 2 1 738 1 384 1
a
883 736 82 143 35 12 37 34 72 92
1 282 1 111
5 138
• ••
123 2Z
1 819 1 650
4
••• 77
20 20 16 14
1 312 927 400
•••
1 896 1 208
406
600
449 101
29 29 80
206 72
7 12 6
494 894
oo• 457 106
12 12 13
2 804 1 763
852 88 16 21 59
2 706 2 487
1 4481 1 346
5 ••• 4 so*
155 21 43 9
'9 89
102 16 8 4
2 750 2 308 2 064 2 560 2 . 123 1 879
• • • 066
9 4 3 131 169 162 25 4 25 8 12 9 12
92 91 66
2 679 1 328 • 440
046
819 146
36 32
318
3 249 .1 262
440
1 600
038 214
64 127 544
2 746 1 159
000
0061
1 167
107 37 26
250
3 231 513
12 000
- 1 Ill 89 89 35
302
2 995 1 616
8 004
833 114 33 27
364
2 472 2 259
172 a
37 . 8
' 266
2 843 2 512 .so
304 7
20 23
365..
2 550 2346
180 19
16 4 • toe
531
2 718 2 192 2 103 2 491
4.00
a a 9
317 198 9 25
19 11
434 329
350 1 321 293 1 236 O00 5 O0* 3 45 56
4 13 8
O46
40 31
51 •
106 Census Trans
Table P-3.-LABOR FORCE CHARACTERISTICS OF THE POPULATION, BY CENSUS TRACTS: 1960-Con. • .$
(Bawd on 25-percent sample. Percent not shown where base is lees than 2001
Sr. LOUIS CI71-.CON.
SUBJECT TRACT TRACT TRACT TRACT TRACT TRACT TRACT TRACT TRACT TRACT TRACT TRACT TRACT TRACT 0006-C 0006.0 0006-C 0006-a , 0006.4 0007,4 0007-0 0007-C 0007-0 0007-E 0007-F 0007-0 0005-4 0008-8
EMPLOYMENT STATUS. OCCo. 11 INDUSTRY
MALE. 14 YEARS OLD AND OVER. • • LABOR FORM• • • • • • 00000000
PERCENT OF TOTAL CIVILIAM LABOR FORCE
EMPLOYED UNEMPLOYED 000000 • • • • • •
PERCENT OF CIV. LABOR FORCE* •s NOT IN LABOR . . . • . . . • • .••• •
FEMALE. 14 YEARS OLD AND OVER. • LABOR FORCE............00
'PERCENT OF•
TOTAL EMPLOYED UNEMPLOYED • • •
••
PERCENT OF CIV. LABOR FORCE. • NOT IN LABOR FORCE 4 .6 • • V • • 0 •
MARRIED WOMEN IN L.Foo HUSBAND PRES. • WITH OWN CHILDREN UNDER 6
MALE. EMPLOYED • • • • • • • •
paOrEs5r6 l'Ec141,0 -11-a1NORED• EMUS."
HORS.. OFFS.. 6 PROPRIS. INCL. FARM. • LLEND.AL AND KIND1Z5-i0F0a85 SALES WORKERS. • • • • • • • • • • • • 01-07SAENr-FOREmth:-W-K1NDRE5-8ORKERS. OPERATIVES AND KIRCRED,WORKERS • • • it PRIVATE HOUSEHOLD TCRICERS-•-• -•- •-1-7-•-• SERVICE WKRSe. EXC. PRIV. HUUSEHOLD• • LABORERS. EXCEPT MINE* • • • • • • •
• 'OCCUPATION- NOT
FEMALE', EMPLOYED • • • • • 1.80PEtSit.. 7EcHNIL7.1- kINI8AgD WORKEAT: MGRS.' OFFS.. 8 PRUPR.St INCL. FARM. • - CLERICAL AND KINDRED WORKERS . • • • • SALES WORKERS. • • • • • • 000000
-CRAFTSMENCFORL.w.h. 0 wiNuvED V • OPERATIVES AND KINDRED WORKERS . • •
(A0111.5H I VATE-HOUSEHOLU wWHACRSO o ERVICE RMS.. EAC. PAIV. HOUSEHOLD. •
.ABORERS. EXCEPT .........MINE
TOTAL EMPLOYED . • • 000000 PRIVATE WAGE AND SALARY WORKERS. • • GOVERNMENT WORKERS • • • • 000000 :JELF.EMPLOYED WORKERS UNPAID FAMILY WORKERS
TOTAL EMPLOYED MINING CONSTRUCTION MANUFACTURING
FURNITURE 8 LUMBER 6 WOOD PRODUCTS • METAL INDUSTRIES • • • • • . • • • MACHINERY. • • • • • • lo TRANSPORTATION EQUIPMENT OTHER DURABLE GOODS '
• FOOD AND KINDRED PRODUCTS TEXTILE AND APPAREL PRODUCTS • 4 s • PRINT.. PUBLISH.Gt 6 ALLIED INDUS. • OTHER NONUUR. 'INCL. NOT SPEC. MFG).
RAILROAD AND RAILWAY EXPRESS SERVICE • OTHER TRANSPORTATION • • • •-• • • • • COMMUN.. UTILor 6 SANITARY SERV* • • WHOLESALE TRADE. • • s 0 0 00000 EATINU AND DRINKING PLACES OTHER RETAIL TRADE BUSINESS AND REPAIR SERVICES PRIVATE HCLISEHJLOS OTHER PERSONAL SERVICES HOSPITALS EDUCATIONAL SERVICES • 0000 0 OTHER PROFESSIONAL AND RELATED SERV. • PUBLIC ADMINISTRATION* • • • • • • • • OTHER INDUSTRIES (INCL. NUT REPORTED).
MEANS OF TRANSPORT* 6 PLACE OF WORK
ALL WORKERS (INCL. ARMED FORCESI'. PRIVATE AUTOMOBILE OR CAR POOL * • • RAILROAD . 0000000
SUBWAY OR ELEVATED oo BUS OR STREETCAR WALKED TO WORK OTHER MEANS WORKED AT HOME NOT REPORTED
INSIDE SMSA. 4S1* LOUIS CITY, HO
(4111111b) JEFFERSON COUNTY, MO ST. CHARLES COUNTY. U0 ST. LOUIS COUNTY, 110
(DISON COUNTY. ILL '
1St CUAIR COUNTY; ILL OUTSIDE.SMSA • • • • 00000000 PLACE or WORK NOT REPORTED

(!nuts Tracts
Tablc P-4.-CHARACTERISTICS OF THE NONWHITE POPULATION, FOR CENSUS TRACTS WITH 400 OR MORE SUCH PERSONS: 1960-Con.
[Asterisk (1 denotes statistics based on 25-percent sample. Population per household not shown where less than 30 persons in households. Median and percent not shown where Noe is less than 200)
1.33
ST. LOUIS CITY--CON.
TRACT TRACT TRACT TRACT TRACT TRAZT TRACT TRACT TRACT TRACT TRACT ; TRACT
0006..8 0006-C 000690 0006-E 0006-F '0006-6 0007-0 0010-A 0010-B 0010-C 0010-0 0011-A SUBJECT
HOUSEHOLD RELATIONSHIP NONWHITE POPULATION
POPULATION IN HOUSEHOLDS HEAD OF HOUSEHOLD
HEAD OF PRIMARY FAMILY PRIMARY INDIVIDUAL
WIFE OF HEAD • • • 4. • CHILD UNDER 18 OF HEAD OTHER RELATIVE OF HEAD NONRELATIVE OF HEAD
POPULATION IN GROUP QUARTERS INMATE OF INSTITUTION OTHER • • • • • • • 000000000
PMLATION PER HOUSEHOLD
MARRIED COUPLES* WITH OWN HOUSEHOLD WITH OWN CHILDREN UNDER 6 WITH OWN CHILDREN UNDER 18 WITH HUSBAND UNDER 45 YEARS WITH OWN CHILDREN UNDER 18
UNRELATED INDIVIDUALS
PERSONS UNDER 18 YEARS OLD* LIVING WITH BOTH PARENTS*
*YEARS OF SCHOOL COMPLETED PERSONS 25 YEARS OLD AND OVER. •
NO SCHOOL YEARS COMPLETED ELEMENTARY' 1 TO 4 YEARS
5 TO 7 YEARS 8 YEARS
HIGH SCHOOL' 1 TO 3 YEARS 4 YEARS
COLLEGE' I TO 3 YEARS 4 YEARS OR MORE
MEDIAN SCHOOL YEARS COMPLETED
*RESIDENCE IN 1955 PERSONS 5 YRS. OLD 8 OVER. 1960.
SANE HOUSE As IN 1960 00000 • • • • DIFFERENT HOUSE IN U.S.
CENTRAL CITY OF THIS SMSA OTHER PART OF THIS SMSA OUTSIDE THIS SMSA
ABROAD . • . . • . . . . . . MOVED. RESIDENCE IN 1955 NOT REPORTED.
*FAMILY INCOME IN 1959 ALL FAMILIES
UNDER $1,000 11.000 TO 11.999 12.000 TO 52.999 13.000 TO 13.999 14.000 TO 141999 15.000 TO $5,999 16.000 TO $6,999 $7.000 TO 17.999 10.000 TO $8,999 19.000 TO 19,999 110,000 AHD OVER MEDIAN INCOME' FAMILIES
FAN 6 uNREL. INDly.
*EMPLOYMENT STATUS AND OCCUPATION MALE. 14 YEARS OLD AND OVER. • •
LABOR FORCE.............o PERCENT OF TOTAL
CIVILIAN LABOR FORCE EMPLOYED UNEMPLOYED
PERCENT OF CIV. LABOR FORCE. • NOT IN LABOR FORCE • • • • • • • • • •
FEMALE, 14 YEARS OLD AND OVER. • LABOR FORCE. • • . • • 00000000
PERCENT OF TOTAL • • 00000 MARRIED WOMEN IN LeFor HUSBAND PRES. •
WITH OWN CHILDREN UNDER 6
MALE. EMPLOYED • • • • • • • • PROCESS.'.. TECHN'Lt 6 KINDRED WORKERS. MORS.. OFF.Sor 6 PROPR'S, INCL. FARM • CLERICAL AND KINDRED WORKERS • • • e • SALES WORKERS, • • • • • • 000000 CRAFTSMEN, FOREMEN. 6 KINORED WORKERS. OPERATIVES AND KINDRED WORKERS • • • • PRIVATE HOUSEHOLD WORKERS. • • • • • • SERVICE WKRS.. EXC. PRIVA. HOUSEHOLD. . LABORERS, EXCEPT MINE.. • • • • • • • OCCUPATION NOT REPORTED
FEMALE, EMPLOYED • • • • • • • PROFESS.L, TECHN.L..6 KINDRED WORKERS. ▪ OFF.5•• 6 PROPR.St INCL• FARM • CLERICAL AND KINDRED WORKERS • • • • • SALES WORKERS. . . • • . • • 00000 CRAFTSMEN, FOREMEN' 6 KINDRED WORKERS. OPERATIVES AND KINDRED WORKERS . • • • PRIVATE HOUSEHOLD WORKERS. • • • • • • SERVICE ERRS.. EXC. PRIV. HOUSEHOLD. • LABORERS. EXCEPT MINE. • • • • • • • • OCCUPATION NOT REPORTED
4 179 4 883 4 293 6 569 6 564 7 532 2 367 5 490 982 7 018 3 418 12 122
4 179 4 867 4 293 6 528 6 483 7 481. 2 367 5 473 982 6 986 3 402 12 043
1 046 1 280 1 289 1 766 1 807 2 C92 699 1 573 276 2 084 924 4 174
976 1 146 1 074 1 585 1 446 1 835 659 1 379 251 1 765 810 2 738
70 134 215 181 359 257 40 194 25 319 114 1 436
771 945 $78 1 282 1 067 1 477 571 1 128 220 1 372 627 1 821
1 668 1 830 1 355 2 126 1 804 2 194 746 1 757 329 2 088 919 3 171
622 733 701 1 200 1 467 1 495 316 896 147 1 273 833 2 265
72 79 70 152 318 223 35 117 10 169 99 612
..... 16 ... 41 81 51 000 17 000 32 16 79
es. oe• .4, 21 400 ..• 000 ... 000 006 000 4
.•• 16 0040 20 81 •51 • ... •17 000 32 16 75
4.00 3480 3.33 3.70 3.59 3.58 3.39 3.48 3.56 3.35 .3.68 2.89
761 1 015 923 1 345 1 159 1 540 585 1 165 275 I 432 663 1 943
739 983 896 1 305 1 073 1 1.67 567 1 120 256 1 420 639 1 858
364 453 371 436 276 404 202 344 SO 493 166 489
499 622 505 725 502 714 322 579 131 722 310 763
. 528 707 582 819 560 731 370 586 135 784 333 787
420 516 401 552 375 520 268 428 96 543 260 510
124 188 212 372 543 621 61 323 28 420 250 1 839
1 911 2 065 1 543 2 599 2 331 2 563 623 2 051 318 2 567 1 213 3 963
1 259 1 466 1 180 1 841 1 302 1.744' 665 1 447 209 1 764 685 1 959
1 858 2 324 2 355 3 421 : 3 607 a 345 1 406 2 995 624 ' 3 916 1 952 7 347
14 35 35 50 67 59 15 65 et. 57 74 151
163 126 166 251 433 345 72 273 47 444 258 1 030
407 313 258 703 738 728 194 518 94 675 376 1 668
253 403 354 530 710 773 132 491 77 627 274 1 296
424 571 554 827 1 661 877 261 671 132 909 462 1 643 418 512 420 664 777 796 340 580 • 94 666 384 806
100 222 284 225 137 415 192 262 . 61 358 80 401
79 142 284 171 84 352 200 135 119 180 44 352
9.7 10.5 11.0 9.6 8.8 9.9 12.1 9.7 11.1 9.5 9.0 8.6
3 362 5 659 5 727 6 649 2 000 4 804 864 6 049 3 023 10 614 3 938 001 4 285 39 3 073
237 1 302 ; 2 173 3 512 23 1 794 39 2 641 3 416
3 664
3 912 1 3 249 2 812 2 019 2 863 794 3 263 2 086 5 004
2 765 3 006
1 097
3 326 t 3 000 2 359 1 820 2 513 735 2 908 1 826 5 234
117 212 138 220 87 123 141 158 9 113 . 41 131
191 200 139 366 162 330 56 192 50 246 219 439
23 ..... 28 11 12 044 00. a ... 12 a 8
227 283 196 434 . 293 325 38 143 31 133 92 517
976 1 165 1 150 1 593 1 521 1 863 664 I 360 279 1 830 804 ' 2 883
44 72 52 81 56 103 23 60 so. 88 33 360
89 87 63 145 172 148 24 93 22 153 80 438
130 85 136 152 202 197 15 153 28 243 80 394
208 1 126 120 233 211 247 45 175 26 212 55 486
173 176 185 266 325 275 97 183 19 301 103 37C 190 148 227 187 233 161 249 91 228 57 302 272
92 107 110 124 117 178 67 147 32 180 94 192
52 ' 75 103 89 70 95 51 101 24 113 69 103
55 41 52 65 68 123 58 70 34 75 47 51;
26 51 56 36 47 64 75 62 19 48 25 62
41 76 86 167 92 184 its 88 18 115 28 152
$4 572 84 969 15 102 14 692 14 368 $A 660 116 552 $5 070 $5 781 114 728 15 268 $3 513 1111 384 64 683 19 813 14 286 13 793 14 140 $6 360 114 526 15 623 14 267 $4 625 62 411
•
1 101
84.8
1 412 1 996 2 048 2
7
4
9
6
.
: 727 1 723 1 355 2 213 1
5
0
5
7
.
: 3 95:
IX:.
1 326 1 098 1 610 1 490 1 943
80.6 89.01 405 ' 285 I 759
72.86u7 1
%:3: 80,3 79.5 837 26
74!
934 1 40182.7
1 610 1 486 1 935 285 1 755 637 1 112 1 515 1 396 1 812 205 1 653 97 , 69
626 1 328 ::79 2 t71:! 1 gii 95 90 123 21 77 goo 102 68 35!
5.8 5.8 5.9 6.! 6.4 3.2 5.5 eel. 5.8 8.1 12.'
I67 230 386 558 518 80 318 ' 70 454 235 1 19 231
2 390 2
4
5
5
:: 2
4
8
4
:: 1 394 1 610 1 613 15;r0
1 095 1 403916 2 022
52.1
2 637 1 306 4 82
4:1.15 609 801 633 540
39.0190 14:33,
430 49.8 51.6 545 130
652 244!
343 486 469 646 464 715 361 691 287 85
93 185 165 157 69 170 108 146 19 181 82 18
837 1 112 1 1 515 1 396 1 812 626 1 328 ' 285 1 653 769 2 40
35 28 47 31 125 40 37 62 74 15 14 1,1u
4 12 21 .43 28 36 21 23 . 14 46 24 5
82 123 117 133 1 145 213 143 212 37 198 76 IS . 19 19 13 10 19 31 16 13 14 18 12 a
53 85 106 105 102 141 77.
120 . 25 420 84 14
244 289 174 364 318 307 137 283 27 384 223 43
4 ... 4 13 12 271 255
16 .00 000 000 12 3 1
123 172 173 384 96 244 46 286 122 54
176 197 158 258 285 266 77 .259 55 277 162 45
97 187 206 251 201 293 19 137 . 5 230 46 41
553 739 793 1 152 1 063 1 315 517 881 162 1 133 46 117 190 118 102 245 117 91 36 51 143
501 1 94 ••• ... 13 12 : 12 16 11 9 too 4 ... 1
39 76 101 121 105 155 98 100 38 115•
83 14
10 17 9 24 ' 36 15 17 31 5 19 a 3
24 9 ... 21 7 ... 8 3 • 5 4 .00 00
71 73 80 96 15S 126 65 142 000 132 111 24
100 ' 81 117 193 251 212 3a 160 26 268 /24 51
185 209 156 302 ' 269 360 117 219 38 284 184 52
3 a 6 20 7 24 000 8 000 30 ....
73 153 119 245 119 162 20 110 19 134 39 27
•

TRACT TRACT 0008-A 0008.8
1 534 1 050
1 158 760
157 760 I 1 0$40
344 263 143 263
1 000
21 24 5 8
16 16 11 3
1 396 1 046 1 355 1 044
20 2 21 000
122 4 • 102 4 11 000
9 ... . 16 oo.
1 349 067 116 183 69 loss
13 3 28 20
219 118 296 183 634 479 202 136
96 87 • 26 24
4.8 4.9
1 435 835 59 110
... - 66 3 'gm
37 39
226 225 280 254
1 028 571
1 471 1 024 44 26 19 ...e
190 242 1 190 709 . 8 ...
130 19 8 000
000 ••-
1 502 1 023
209 143 539 420 298 211 223 117 108 . 69 125 61
2.5 2.4 2.5 2.5 2.5 1.9
709- 563 371 254 276 . 166 146 40
53 Census Tracts 143
Table H-1.-OCCUPANCY AND STRUCTURAL CHARACTERISTICS OF HOUSING UNITS, BY CENSUS TRACTS: 1960-Con. (Some data hated on sample; see tart. NTedian not shown where hose is lees than 501
•
SUBJECT
ST. LOUIS CITY--CON.
TRACT 0006-C
,TRACT TRACT 0006-0 0006-E
TRACT 0006-F
TRACT TRACT 0006-0 0007-A
TRACT TRACT 0007-B 0007-C
TRACT 0007-0
TRACT 0007.E
TRACT 0007-F
TRACT 0007-3
ALL HOUSING UNITS 2 458 2 316 2 359 2 278 2 459 337 1 062 2 275 1 985 1 012 1 245 2 250
TENURE. COLOR. AND VACANCY STATUS i
OWNER OCCUPIED 1 106 986 1 021 748 1 249 286 729 1 920 1 518 1248 702 1 293 4.1TE 536 409 226 131 121 285 729 1 919 1 515 1 246 651 761 ZNA.ITE 570 577 795 617 1 128 1 000 1 3 2 49 532
RENTER OCCUPIED 1 183 1 231 I 240 1 387 1 105 46 311 318 415 516 513 851 4.1TE 473 519 269 197 141 45 311 317 414 516 498 604 NoN441TE 710 712 971 1k 190 964 1 ... 1 1 000 15 167
AVAILABLE VACAN 111 88 71 66 3 15 15 37 32 23 85 SCR SALE ON r 27 20 13 15 9 3 6 9 22 17 4 42 FOR RENT B4 68 58 59 57 ... 9 6 15 15 19 43
OTHER VACANT 50 11 27 69 39 2 7 22 15 16 7 21
CONDITION AND PLUMBING
SOUND 2 193 2 090 '2 115 1 482 2 164 317 965 2 157 1 807 1 721 1 117 2 208 WITH ALL PLUMBING FACILITIES . . . • 2 163 2 021 2 046 1 309 2 061 315 950 2 130 1 752 1 684 1 107 2 150 LACKING ONLY HOT WATER • • • . • • • 17 21 15 14 10 1 . 6 3 15 18 5 15 LACKING OTHER PLUMBING FACILITIES. • 13 40 .54 159 93 1 9 28 40 19 5 43
DETERIORATING. . . . 11TH ALL PLUMBING FACILITIES . • • to
186 191-....215 660 247 19 ' 96 88 138 36 166 171 212 605 198 17 116 83..
125 32
LACKING ONLY HOT LATER • • • • • 0 • LACKING OTHER PLUMBIN4 FACILITIES. •
11 9
17 3 5 20 .
8 47
8 41
000
2 .
gi 12 10
10 2
3 4
2 2
DILAPIDATED. • • • • • • • • • . • • • 79 33 9 136 48 1 I 8 40 3 3 6
BATHROOMS
2 328 2 158 2 139 1 865 2 102 316 948 1 954 1 765 1 639 1 170 2 040 MORE THAN 1 91 ' 100 151 179 152 21 92 292 119 138 49 172 SNARED OR NONE 39 58 69 234 205 ••• 22 - 29 101 35 26 38
ROOMS
1 ROOM 4 30 7 112 29 1 2 5 8 • 4 ... 60 2 ROOMS 60 72 59 182 91 2 28 22 49 24 11 20 3 ROOMS 636 565 514 396 455 11 232 175 342 245 256 309 4 ROOMS 864 819 719 604 641 74 283 591 662 526 375 532 5 ROOMS 661 579 636 476 636 196 344 1 064 601 639 426 856
t•'"" 6 RODS 7 ROOMS
175 44
196 254 43 123
208 108
291 172
36 16
132 32
256 119
248 62
282 65
136 33
339 103
8 ROOMS OR ORE 14 12 47 192 144 1 9 43 13 27 8 31 MEDIAN 4.1 4.1 4.3 4.2 4.5 4.9 4.5 4.4 4.4 4.7 4.4 4.7
' UNITS IN STRUCTURE
1 1 292 1 015 843 987 1 484 327 875 2 124 1 849 1 263 718 1 182 2 504 .. 616 769 765 498 5 153 122 111 320 236 693 3 AND 4 541 078 576 351 290 5 34 19 25 200 200 364 5 TO 9 14 27 14/ 86 149 ... ••• 10 • ... 25 30 5 10 OR MORE 107 180 30 89 38 see see .elp 1 sloe 4141. 61 . 6
YEAR STRUCTURE BUILT
1950 TO MARCH 1960 68 8 10 16 48 134 402 100 26 28 89 1940 TO 1949 86 . 73 52 37 87 137 100 261 89 56 39 112 1939 OR EARLIER 2 304 2 235 2 303 2 231 2 356 152 828 1 592 1 796 1 730 1 178 2 049
BASEMENT
BASEMENT 2'352 2 208 2 288 2 233 2 427 337 1 031 2 221 1 855 1 761 1 235 2 204 CONCRETE SLAB 27 al 44 21 20 000 27 35 65 15 5 36 OTHER 79 67 27 24 12 ... 4 19 65 36 - 5 10
HEATING EOUIPMENT
STEAM OR HOT WATER 586 861 900 586 621 36 158 302 230 487 262 640 WARM AIR FURNACE 1 636 1 214 1 188 1 463 1 560 289 812 1 912 1 571 1 256 846 1 486 BUILT-IN ROOM UNITS 64 33 48 38 73 8 17 12 16 8 4 25 OTHER MEANS WITH FLUE 168 192 175 142 149 4 75 49 160 61 133 94 OT0ER MEANS WITHOUT FLUE 4 13 44 45 56 000 000 8 4,94. ••• 5 NONE . . . . • . . . . . • • • . . . . .00 3 4 4 ... ... ... ... .e. 000 fee 00.
ALL OCCUPIED UNITS 2 289 2 217 2 261 2 135 2 354 332 1 040 2 238 1 933 1 764 1 215 2 144
PERSONS
: PERSON 303 467 263 • 386 . 293 31 110 229 247 267 190 276 2 PERSONS 670 703 677 563 695 136 371 893 682 654 451 791 3 PERSONS 429 399 419 . 345 443 70 216 465 392 335 249 470 4 PERSONS 324 263 329 . 295 349 53 151 322 263 243 140 270 5 PERSONS 230 161 246 194 235 18 94 182 169 129 86 175 6 PERSONS OR MORE 333 224 327 352 339 24 98 147 180 136 99 162
ALL OCCUPIED 2.9 2.4 3.0 2.0 2.9 2.5 2.7 2.5 2.6 2.4 2.4 2.5 OWNER RENTER
2.9 3.0
2.6 3.3 2.4 2.6
3.1 2.8
3.1 2.9
. 2.3 000
2.5 2.5
2.4 2.4
2.6 2.3
2.5 2.4
2.6 2.3
2.7 2.4
(1"k) PERSONS PER ROOM
0.53 OR LESS 793 973 800 • 797 895 165 383 1 125 806 887 560 983 0.51 TO 0.75 502 495 516 427 564 87 302 544 513 412 327 529 0.76 TO 1.00 468 421 461 476 472 61 236 425 402 314 216 427 1.01 OR MORE 526 320 484 435 423 19 119 144 212 151 112 205

ALL OCCUPIED UNITS
YEAR MOVED INTO UNIT
1958 TO MARCH 1960 1954 TO 1957 1940 TO 1953 1939 OR EARLIER
AUTOMOBILES AVAILABLE
1 a 3 OR MORE NONE
VALUE
01NER OCCUPIED LESS THAN 65.000 115.000 TO 19.900 110.000 TO 614.900 115.000 TO 119.900 $20.000 TO 124.900 125.000 OR MORE MEDIAN DOLLARS • •
GROSS RENT
RENTER OCCUPIED LESS TmAh 120 120 TO $39 S40 TO 159 160 TO 179 180 TO 199
RENTER OCCUPIED MEDIAN • • • • •••••• pawn • •
11100 TO 1149 6150 OR MORE NO CASH RENT
,; MEDIAN r4110b
CONTRACT RENT
DOLLARS • •
ALL OCCUPIED UNITS
YEAR MOVED INTO UNIT
1958 TO MARCH 1960 1954 TO 1957 1940 TO 1953 1939 OR EARLIER
AUTOMOBILES AVAILABLE
2 3 OR MORE NONE
VALUE
OwNER CCC..PIED LESS THAI. 15.000 15.000 TO 19.900 110.000 TO 114.900 115.000 TO 119i900 120.000 TO 124.900 125.000 04 MORE
DOLLARS •
GROSS RENT
RENTER CCC4PIED LESS T.AN 120 S20 TO 139 140 TO 159 150 TO 179 180 TO 299 1100 TO 1149
(11111114.150 CA
OR PORE 0 SM RENT
MEDIAN
DOLLARS • •
CONTRACT RENT
ENTER OCCUPIED DOLLARS • •
MEDIAN
54 170 Census Tracts
Table H-2.-YEAR MOVED INTO UNIT, AUTOMOBILES AVAILABLE, AND VALUE OR RENT OF OCCUPIED HOUSING UNITS, BY CENSUS TRACTS: 1960-Con.
(Same data based on sample; median not shown *hero bale is insufficient; vet text. Plus (+) or minus (-) after number indicates median above or below that number;
ST. LOUIS CITY«40Ne
SUBJECT TRACT TRACT irRACT TRACT TRACT
0006-C 0006.0 0006.E 0006-F 0006-8 TRACT
0007-11 TRACT
0007.8 TRACT
0007.0 TRACT
0007-0 TRACT
0007-E TRACT
0007-F 0007-6 TRACT TRACT TRACT
0008-A '0008-6
332 1 040 2 238 1 933 1 764 1 215, 2 144 1 502 1 023.
f 'U ri 1.1 '
92 222 358 448 4185 345 966 290 203 64 250 • 558 012 355 273 407 327. 234
152 371 815 630 547 353 423 597 412 24 497 ' 507 443 416 244 348 286 174
245 685 1 447 1 208 1 097 718 1 354 970 700 21 122 240 149 185 128 240 169 141 00. 16 45 15 ••• sew 20 30 10 66 217 506 561 482 369 530 333 172
284 651 1 646 1 017 1 075 608 1 035 1 116 710 ... 17 30 64 30 10 10 13 4
36 213 317 675 346 224 173 160 34 154 312 ' 802 614 524 320 544 390 149 88 90 ' 561 60 161 49 261 446 304
4 18 115 3 13 3 23 97 170 2 1 21 1 1 2 4 10 49
13 400 11 500 - 17 600 9 800 11 500 11 100 13 100 14 900 17 SOO
64 311 318 415 516 513 851 344 263 008
•
000 000 0.0 .0. 000 00. • • •
... 4 4 •31 9 20 ... 16 ...
8 43 16 70 44 38 70 40 23 12 120 71 124 165 245 299 158 67
( a 95 121 72 210 175 348 69 79
, -.. --:8
'',..!!.171
31 3
15-
55 16 35
64 7
97
72 0.0
16
28 0.0
7
107 000
27
20 9
'24'
67 12
15 '.. 76 86 72 62 77 82 74 - 87
36 296 283 368 506. 824 320 248
4.. 60 .73 61 64 63 60 73
2 289 2 217 2 261 2 135. 2 354
r f
1 115 890 919 771 674 646 738 802 739 590 280 352 406 511 1 013 246 237 134 114 77
1 447 1 236 1 324 1 063 1 278 105 106 121 47 141 41 5 15 36 18
696 870 801 989 921
1.030 799 716 549 1 022 108 77 17 12 26 501 397 385 184 249 277 256 274 304 485 118 49 28 33 218 18 17 8 8 38 8 3 4 6 6
9 100 9 100 9 400 11 300 12 400
1 183 1 231 1 240, 1 387-" I 105 4 ... ••• Of. 000
9 21 •20 63 20 94 150 95 335 236
534 554 522 556 436 444 422 470 350 305 81 63 125 59 68 4 ... 000 0.0 9 13 21 8 24 31 78 76 79 70 74
00.
1 170 1 210 1 232 1 363 1 074 62 62 60 59 59
5.1. LOUIS CITY.....CON•
SUBJECT TRACT TRACT TRACT TRACT TRACT
0000-c 0008.0 0008-8 0008-F 0009-A
6
TRACT 0009-B
TRACT TRACT 0009-0 0009-0
TRACT 0009-8
TRACT 0010-A
TRACT 0010-B 0010-C
TRACT TRACT 0010-0 0010.8
TRACT
217 1 568 1 063 1 322 2 453 2 125 2 489 2 166 2 099
• ',I:L. r
46 430 384 368 850 714 751 751 708
61 406 216 400 725 569 939 699 . 474
71 460 323 341 666 485 504 489 542 39 272 140 . 213 212 357 215 227 375
a •
94 960 ' 612 798 1 380 1 381 1 167 1 012 1 136
37 56 67 83 148 103 108 82 124 4 5 15 ... 15 20 25 39 10
82 ' 547 369 441 910 621 1 169 1 033 829
95 429 274 268 1 016 730 816 271 579
32 ' 39 49 58 36 66 52 13 58
55 238 165 14S 396 424 323 75 362
8 125 46 61 494 201 343 121 146 ... 4., 23 12 4 78 36 77 57 11 ... , 4 1 .00 10 3 19 a ... ... . ... I ... 2 ... 2 1 ...
6 400 6 700 7 700 7 600 10 800 6 500 10 500 12 000 8 200 •
102 946 '646 831 1 134 1 063 1 506 1 451 1 194
... 4.00 a 0.0 $0. .0. 000 000 4
15 55 39 60 34 30 132 66 78
43 324 258 294 235 232 321 270, 434
27 393 248 345 523 453 608 515 458 11 124 58 68 251 265 380 411 168 6 13 14 24 48 48 53 127 28
0.0
•
O.. .00 •0...
•
0.1. 000 SOO 4 ... 37 27 • 40 43 35 • 12 54- 20 .... 63 61 62 70 71 70 74. 62
102 909 621 791 1 091 1 028 1 494 1 397 1 174 47 47 46 54 55 53 59 45
987 362 476 45 2038
175 73 158 15 606 ' 308 65 118 5 577
409 130 122 15 544 95 94 78 10 ' 311
699 235 281 22 1 298 139 58 36 • 18 165
10 5 ... .00 37 139 64 159 5 530
835 249 138 22 384 20 13 22 9 6
157 04 70 12 97 419 73 42 1 172 216 29 4 ... 92
20 21 ... ... 16 3 29 ... ... 1
12 900 11 900 8 400 ... 12 600
145 92 312 ' 30 1 151 0.0 0. Os. ... 3 ... a •19 20 21 22 85 15 155 al 36 141 10 373 16 5 41 000 407
22. 12 11 ... 162 O0. • 9 .0. 0.0 .00
5 0.0 15 5 31 O0. Se. 64 900 80
140 92 297 25 1 120 • G. 47 63
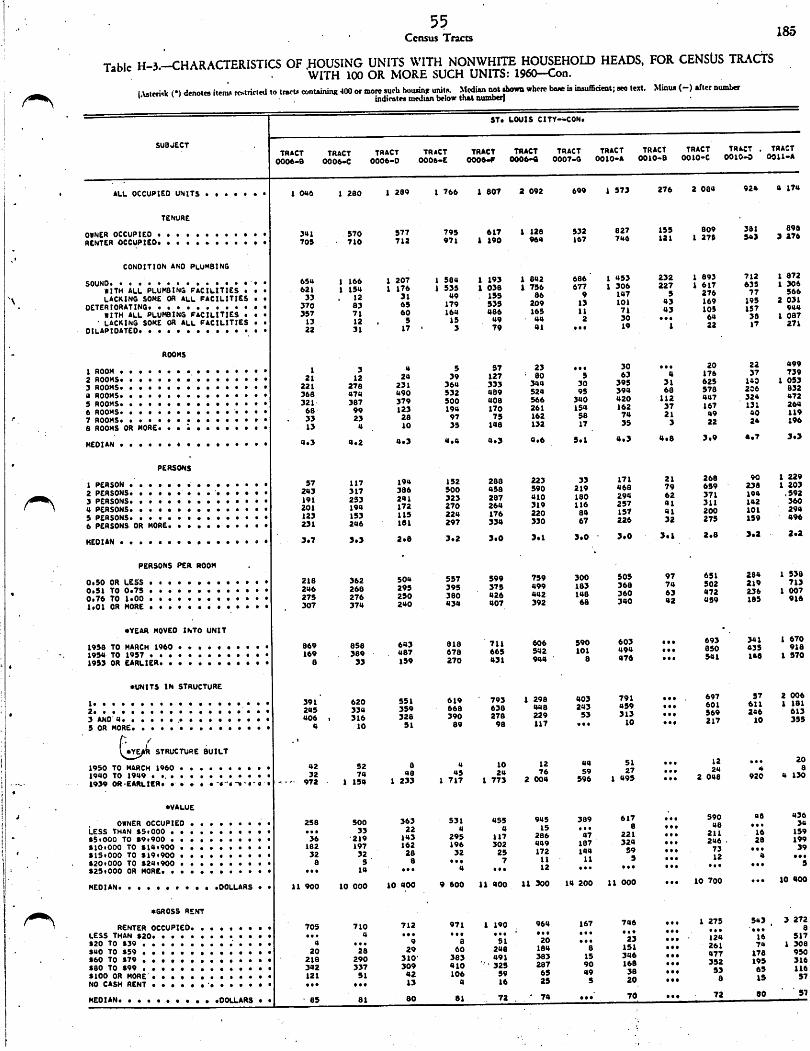
55 Census Tracts 185
Table H-3.-CHARACTERISTICS OF HOUSING UNITS WITH NONWHITE HOUSEHOLD HEADS, FOR CENSUS TRACTS WITH 100 OR MORE SUCH UNITS: 1960-Con.
(Asteriqk (1 denotes items restricted to tract. containing 400 or more such housing units. Median not shown where bare in insufficient; see text. Minus (-) after number Indicates median below that number!
SUBJECT
ST. LOUIS CITY--CON.
TRACT 0006-B
TRACT 0006-C
TRACT 0006-0
TRACT 0006aE
TRACT 0006aF
TRACT 0006-4
TRACT 0007.0
TRACT 0010-A
TRACT 0010-B
TRACT 0010-C
TRACT . 0010a0
TRACT 0011-A
ALL OCCUPIED UNITS 1 046 1280 1 289 1 766 1 807 2 092 699 1 573 276 2 084 924 4 174
TENURE
OWNER OCCUPIED 341 570 577 795 617 1 128 532 827 155 809 381 898 RENTER OCCUPIED 705 • 710 712 971 1 190 964 167 746 121 1 275 5a3 3 276
CONDITION AND PLUMBING
SOUND 654 1 166 1 207 1 584 1 193 1 042 686 1 453 232 1 893 712 1 872
WITH ALL PLUMBING FACILITIES • • 621 1 154 1 176 1535 1 038 1 756 677 1 306 227 1 617 635 1 306
LACKING SOME OR ALL FACILITIES • 33 . 12 31 49 155 86 9 147 5 276 77 566
DETER/ORATING. • • • • • • • • • • • 370 83 65 179 535 209 13 101 43 169 195 2 031
41TH ALL PLUMBING FACILITIES • • • 357 71 60 164 486 165 11 71 43 105 157 944
• LACKING SOME OR ALL FACILITIES • • 13 12 • 5 15 49 • 44 2 30 0.0 64 38 1 087
DILAPIDATED. • • • • • • • a • • 22 31 17 3 79 41 000 19 1 22 17 271
ROOMS
1 ROOM 1 3 4 5 57 23 0.. 30 ..• 20 22 499
2 ROOMS 21 12 24 39 127 ' 80 5 63 4 176 37 739
3 ROOMS 221 278 231 364 333 344 30 395 31 625 140 1 053
4 ROOMS 368 474 490 532 489 524 95 394 6B 578 206 832
5 ROOMS 321. 387 379 500 408 566 340 420 112 447 324 472
6 ROOMS 68 - 99 123 194 170 261 154 162 37 167 131 264
7 ROOMS 33 23 28 97 75 162 58 74 21 49 SO 119
B ROOMS OR MORE 13 a 10 35 148 132 17 35 3 22 24 196
MEDIAN 4.3 4.2 4.3 4414 4.3 4.6 561 4.3 nol, 3.9 4.7 3.1
PERSONS
1 PERSON 57 117 194 152 288 223 33 171 21 268 90 I 229
2 PERSONS 243 317 386 500 458 590 219 468 79 659 230 1 203
3 PERSONS 191 253 241 323 287 410 180 294 62 371 194 .592
4 PERSONS 201 194 172 270 264 319 116 257 41 311 142 360
5 PERSONS 123 153 115 224 176 220 84 157 41 200 101 294
6 PERSONS OR MORE 231 246 181 297 334 330 67 226 32 275 159 496
MEDIAN 3.7 3.5 2.8 3.2 3.0 3.1 3.0 3.0 3.1 2.8 3.2 - 2.2
PERSONS PER ROOM
0.50 OR LESS 218 362 509 557 599 759 300 505 97 651 284 I 538
0.51 TO 0.75 296 268 295 395 375 499 183 366 74 502 219 713
0.76 TO 1.00 275 276 250 380 426 442 laa 360 63 472 236 1 007
1.01 OR MORE 307 374 240 434 407 392 68 340 42 459 105 916
*YEAR MOVED INTO UNIT
1958 TO MARCH 1960 869 858 643 818 711 606 590 603 f.. 693 341 1 670
1954 TO 1957 169 389 . • . 487 678 665 542 101 494 900 850 435 918
1953 OR EARLIER 33 159 270 431 944 ' 8 476 ••• 541 140 1 570
*UNITS IN STRUCTURE •
391 620 551 619 793 1 298 403 791 . 697 57 2 006
2 245 334 359 . 668 638 448 243 459 000 601 611 1 181
3 AND 4 406 316 328 390 278 229 53 313 90. 569 246 613
5 OR MORE 4 10 51 89 98 117 ... 10 elo g 217 10 355
*YE A(1 STRUCTURE BUILT
1950 TO MARCH 1960 42 52 8 4 10 12 44 51 04, 12 000 20
1940 TO 1949 1939 OR .EARLIER. . o ---
32 972
74 • 1 154 1
48 233
45 1 717
24 1 773 2
76 004
59 596 1
27 495
00. •ro 2
24 048
a 920 4 130
*VALUE
OWNER OCCUPIED LESS THAN 85.000
258 500 33
363 22
531 4
455 4
945 15
389 4.0
617 a
000 000 48
590 Oa
• 000
436 34
15,0610 TO $9,900 •36 '219 143 295 117 286 47 221 400 211 16 159
810.000 TO $14,900 182 197 162 196 302 449 167 324 666 246 • 20 199 39 $15.000 TO $0,900 32 32 28 32 25 172 144 59 .r• 73
520.000 TO $24.900 8 s 0.11 7 11 11 5 SO. 12 00.
$25.000 OR MORE tee 14 000 4 ego 12 0.4 • • • .00 000 ••• S
MEDIAN DOLLARS • • 11 900 10 000 10 400 9 600 11 400 11 300 14 200 11 000 ... 10 700 10 400
*GROSS RENT
RENTER OCCUPIED 705 7/0 712 971 1 190 964 167 746 044 1 275 Si.) 3 272
LESS THAN $20 004 a 0.0 • • • • 9.0 • • • • ell* • • • 1116 •.. . • • • 0
$20 TO $39 4 000 9 8 51 20 040 23 ... 124 16 517
1140 TO S59 20 28 29 60 248 184 8 151 ... 261 74 1 308
$60 TO S79 218 290 310' 383 491 383 15 346 .00 477 178 950
$80 TO S99 342 337 309 410 .- 325 287 90 168 ... 352 195 316
$100 OR MORE - 121 51 42 106 59 65 49 38 000 53 65 116
NO CASH RENT .eo 000 13 4 16 25 5 20 SO. 8 15 57
. . . MEDIAN DOLLARS • • - 85 81 80 81 74 et. , 70 66. 72 00 57

APPENDIX D.
A COMPARISON OF THE 1960 AND) THE 1965; POPULATION: FOR THE WELLS-GOODFELLOW DISTRICTBY RACE AND SEX'_
Statistics from the 1960 Census:
Tbtal Male Female
Ebta1. 429 854 7.19998o 229.874
White 11g625 5p431 60,194-
Non-white 319,2291 149,549 169,680
Statistics from the 1965 Estimate:
Tbtai_ Male Female
Total 149.574 209816 239,758
White 89.648 49.040 49,6.08
Non-white 35p926 169.776 19D150
This information_ was taken from the Neighborhood Handbook
for Human Development Corporation Wells-Goodfellow District,
ppo 2-3O-

APPENDIX E
EMPLOYMENT POSITIONS BY SEX AND RAGE, FOR CENSUS TRACT. 6-a
Employment Position
Male
White' Non-white
Female Male Female
Professional, Technical, etc. 10 20 59 190:
Managerial, Propriatal, etc. 20 21 13
Clerical. 73 97 117 -_Iol
Sales Workers. 24 35 13 g
Craftsman, Foreman, etc. 116 4 106 ......
Operative. 36.3 71 174 80'
Private Household Worker. -- 9 4 117
Service Workers. 57 44 173 156
Laborers. 33 > 3 1581 8
Occupation not reported 89 68 206 119
Total 6D8 405 1,031 739
This information was compiled from Table P-3, p. 106,
and Table P-4, p. 133, of the United States Census: 1960.

CITY FIGURES
114,530 - /
6,210
5.42
19 (1178)
66 (4084)
04 (267)
11 (681)
04 (240)
27 (1669)
08 (4249)
1 (52)
1966 378 64
1967 401 82
1968 451 3T ao5'/ )
,77 793/47 /
icr,Gl
„Rftit,.)
AGAINST PROPERTY
314
319
TOTAL et 77' AGAINST PERSON (- / 71'
APPENDIX P
DELINQUENCY RATE VS JUVENILE POPULATION 1965 est of population 1968 delinquency statistics
CENSUS TRACT 6-D
Total Youth Population 1,198
No. Youth Apprehended 53
Rate/100 4.42
Percent Male White
Percent Male Nonwhite 91 (48)
Percent Female White
Percent Female Nonwhite 9 (5)
Percent Age 7 - 10 6 (3)
Percent Age 11 - 13 26 (14)
Percent Age 14 - 16 68 (36)
Percent Over 16
1960 population for 6-D was 6,551 Cr' 75-0, n 26
crime in Census Tract 6-D

APPENDIX G
AGENCIES SERVING THE
WELLS-GOODFELLOW AREA
BLIND GIRLS'HOME, INC.
5235 Page FO 7-2154 St. Louis, Mo.
Matron: Mrs. Leota Breit
Serves indigent, blind white women resident in Missouri.
A home for blind women who can care for themselves. There is no age limit. The women must give up state pensions. All care is given including hospi-talization and burial.
DE PAUL HOSPITAL
2415 N. Kingshighway FO 7-2800 St. Louis, Mo.
Administrator: Sister Elise, D.C.
Serves all patients except mental, contagious, tubercular, or chronic. Owned and operated by the Daughters of Charity of St. Vincent de Paul.
FAITH HOSPITAL ASSOCIATION, INC.
3300 N. Kingshighway EV 2-7979 St. Louis, Mo.
Accepts all patients except those with contagious or mental illnesses. Capacity: 125 beds.
JUNIOR KINDERGARTEN
5555 Page FO 7-4646 St. Louis, Mo.
A pre-kindergarten for those who will enter a kindergarten in the Enright School district the following year. The purpose is to enrich children in order to take advantage of their later school years. Serves about 100.
Hours: 9:30 - 11:30 a.m. & 1:00 - 3:00 p.m. Mon. - Fri.
4
9
,J111,..IIT.IMP••••••,••••••• • • ,,,,EsowarpR. - •

V
MASONIC EMPLOYMENT BUREAU
611 Olive Rm. 2066 CH 1-9445 St. Louis, Mo.
Manager: Chester W. Cook
A free employment service for master Masons and their dependents, and recom-mended non-affiliates.
Hours: 8:30 a.m. - 4:00 p.m. Mon. - Fri.
MOUND CITY DENTAL SOCIETY
3105 Union EV 3-0455 St. Louis, Mo.
President: Calvin C. Lee, D.D.S.
An association on dentists licensed to practice in Missouri. Promotes high ethical standards, the advancement of the dental profession, and dental health. Protects the public from unlicensed practitioners and gives service to those unable to pay.
Hours: 9:00 a.m. - 8:00 p.m. Mon. - Sat.
ST. ANNE'S HOME
5351 Page FO 1-2828 St. Louis, Mo.
Administrator: Sister Lydia Hoffman, MS, F.A.C.H.A.
A professional nursing home for chronically ill women, conducted by the Daughters of Charity.- Serves women 65 and over of all denominations.
Office Hours: 8:00 a.m. - 4:30 p.m. Mon. - Fri. and by appointment
ST. LOUIS PUBLIC LIBRARY
Sherman Park Wellston St. Louis, Mo.
2902 Union 5886 Easton
EV 3-3021 EV 5-4042
Lends books and provides reference service to residents of St. Louis and to those paying taxes in the city. Films, slides, records are available.
HOUrS: Sherman Park Mon. & Wed. 1:00 p.m. - 7:00 p.m. Tues., Thurs., Fri., Sat 9:00 a.m. - 5:30 p.m.
Wellston Mon. - Fri. 9:00 a.m. - 5:30 p.m.

61
ST. LUKE'S EPISCOPAL-PRESBYTERIAN HOSPITAL
5535 Delmar FO 7-1680 St. Louis, Mo.
Administrator: Harry M. Piper
Serves all patients except mental and contagious, especially those with short-term, acute illnesses. Capacity: 350 beds.
UNITED ORTHODOX JEWISH COMMUNITY VAAD HOEIR OF ST. LOUIS
028 Delmar PA 7-0380 St. Louis, Mo.
Executive Secretary: Hyman Flaks
Serves religious and cultural needs of all Jewish Orthodox congregations, their affiliated members, and individuals of the Jewish faith. Is a clearing agency for fund raising functions. Rabbinical Court concerning divorce, interfaith marriage, conversion procedures and other matters of Jewish jurisprudence.
Hours: 9:00 a.m. - 4:00 p.m. Mon. - Fri. (except Jewish and legal holidays. )
YOUNG MEN'S CHRISTIAN ASSOCIATION OF ST. LOUIS
Page Park Branch 5555 Page FO 7-4646 St. Louis, Mo.
Swimming pool, gymnasium, locker rooms. Operates Camp Rivercliff for boys and girls at Bourbon, Mo. Administration building has office, board and meeting rooms.
Hours: 8:30 a.m. - 9:00 p.m. Mon. - Sat.

62
Urban League of St. Louis, Inc.
4401 Fair (15) F.V. 0-0040
Mr. William F. Douthit, Executive Director Area A and B Council Block Units Junior Block Units
Provides help to residents living on both sides of the street within a single city block that wishes to organize for neighborhood improvements.
Its Objectives Are:
To improve neighborhoods - block by block - through better home, yard, street and alley up-keep
To educate residents on their responsibilities as citizens.
To develop the "neighbor with neighbor" spirit and teamwork in overcoming problems in adjusting to urban life.
To enable citizens to make full use of common resources in the community.
To seek out and develop neighborhood and area leadership to further the objectives or the block movement.
To enhance cooperation between citizens and governmental and voluntary bureaus and institutions.
It stresses... cooperative self-help projects for home and neighborhood improvements
Block Unit concerns include: Maintenance and Prevention of Block Decay, Upgrading City Services, Leadership Development, Family Life and Civic Education, Cooperation with City-wide Development Efforts, Human Relations Programming, Organization, Officers, Committees, etc. Meetings are held regularly each month. Dues are voluntary and are voted by action of the Block Unit. Member of the St. Louis Federation of Block Units.
Office Hours: Main Office. 8:30 a.m. - 5:00 p.m. Mon. - Fri.
12

Society of St. Vincent De Paul
4140 Lindell (08) FR. 1-4980
Executive Secretary: Thomas J. O'Donnell
St. Vincent De Paul Society
2709 Clara
Reverend Father William Krammer
VOLUNTEER SERVICES: Operates a volunteer program of friendly visiting through 112 parish conferences in St. Louis City and County. The volunteer units provide, on an individual basis, some measure of financial assistance; particularly in emergencies and in situations not covered by the public assistance program. Applications for service may be made directly to the neighborhood parish conference at the parish rectory address. Further information regarding the program may be obtained from the program coordinator.
BRENNAN CENTER FOR THE BLIND: Provides professional orientation and mobility training for blind persons residing in Missouri. Fees are charged. Applications are received by the Social Worker.
Hours: 8:30 a.m. - 5:00 p.m. Mon. - Fri.
Young Men's Christian Association of St. Louis and St. Louis County
Page Park Branch
5555 Page (12) FO. 7-4646
Executive Secretary: Henry H. Lenoir
Swimming pool, gymnasium, locker rooms. Administration building has office, board and meeting rooms. Operates Camp Rivercliff for boys and girls at Bourbon, Missouri. Also operates the Sarah-Page Extension at 4100 Page Blvd. Serves city high school districts of Sumner, Soldan, and Vashon.
Supervises and coordinates, through Metropolitan Departments and Branches, a program of group activities and individual services pro-moting the mental, physical and spiritual welfare of boys and girls, men and women of all races and creeds. Dues: minimum, $10.00 for Family-Sustaining Membership entitling family members to participate in programs on payment of activities fees. Some activities require Family-Sustaining Membership.

• , 1 rl
r ;I'
1..
64
II.
METROPOLITAN DEPARTMENTS
1528 Locust (03) GE. 6-4100
Camps Department: Operates boys and girls resident Camp Lakewood, and family-conference Camp Trout Lodge on Sunnen Lake near Potosi. Gives guidance to day camp operations of the branches and Camp River-cliff (operated by the Page Park Branch). Capacity: Lakewood, 232; Trout Lodge, 500.
Innercity Youth Outreach: Responsible for a special streetwork group program in selected depressed areas.
BRANCHES
The YMCA operates 12 branches, one division, and as listed below. These conduct varied programs, leadership training, "youth and govern-ment," clubs, classes, athletic activities, etc. Classes include swim-ming, skin and scuba diving, tumbling, wrestling, ballroom and square dancing, arts and crafts, bridge, slim gym, etc.
Clubs include Y-Indian Guide Tribes (lower elementary school age boys and their fathers), Hi-Y and Tri-Hi-Y Clubs (boys and girls in junilr high and high school); also clubs for young married and unmarried adults. Other clubs based on special interests such as bridt..,e, chess, rifle, Little Theatre, etc. Athletic leagues in baseball, volleyb="., softball, etc. "Teen-towns," lectures, travel and adventure series, discussion groups, and other formal and informal educAtional progr' In addition to their own facilities described below, the brarche: community facilities. Branch programs and activitiez; vary; cific details call the branch.
Hours: 8130 a.m. - 9:00 p.m. Mon. - Sat.
Department of Parks, Recreation, and Forestry'
5600 Clayton (10) Jr. 5-4111
Director: Louis W. Buckowitz T -
Department of Parks and Recreation I.- -
Wohl Community Center P
Kingshighway and Easton (13) FO. 7-2292 Ron Burell, Director
The Department maintains the following: 47 park playgrounds; 57 public school playgrounds; 16 swimming pools (8 municipal, 8 public school); 73 tennis courts (18 Board of Education); 74 parks (2,609 acres); one

65
9- and one 18-hole golf course; 99 softball, 40 soccer, 39 baseball, 7 football fields; one cricket and one rugby field; 8 handball courts; archery range, boat rental, banked cycle track, fly and bait casting docks, picnic areas, and other recreational and park facilities. Jewel Box Floral Conservatory. (See also Mark C. Steinberg Memorial Skating Rink and McDonnell Planetarium below.)
Hours: 8:00 a.m. - 5:00 p.m. Mon. - Fri. 9:00 a.m. -12:00 noon Sat.
Tuberculosis and Health Society of St. Louis
X-Ray Mobile Unit
911 Locust (01) CH. 1-554
v
AN/
Executive Secretary: Miss Ellen L. Boyce
Serves residents of St. Louis and St. Louis County. Purpose is the eradication and prevention of tuberculosis through health education, case finding, rehabilitation and research. Finances by the Christmas Seal campaign, and donations. Fees: none.
Hours: 8:30 a.m. - 4:45 p.m. Mon. - Fri.
Public Library
Legal name: The Board of Directors of the Public Library of the City of St. Louis
1301 Olive (03) CH. 1-2288
Librarian: Louis M. Nourse
Cabanne Branch
1106 North Union (13) FO. 7-4684
Lends books and provides reference service to residents of the city of St. Louis, and persons paying taxes in the city. Central Library, 22 branches and 3 bookmobiles. Book reviews, film showing, story hours for children, exhibitions, Great Books Groups, etc., open to the public without charge. Films (16 mm sound) available to organized adult groups for showing within the city provided no admision is charged. Slides on art, travel, architecture, available for home use. Also phonograph records. Television and radio programs sponsored. Ref-erence Department, and General Information Service, provide aids in
15

4 111
16
t',1Yrk,
66
book selection, outlines for organization programs, pamphlets on cur- rent topics, and answers to questions on general information.
Wolfner Memorial Lingary for the Blind provides books and magazines in Braille and "talking book" records. Books are available to the blind of Missouri as well as to local residents providing they are able to furnish a medical statement as to the extent of their blindness. Books may be kept a month and mailing is free.
Municipal Reference Branch has a special collection of materials dealing with municipal and state government. Fees: free to city residents or tax payers, other ;5.00 per year; children, $2.00 per year.
Serves the following services:
Sherman Park Branch 2902 Union
(15) F.V. 3-3021
Wellston Branch 5886 Easton (12) F.V. 5-4042
Hours: Main Library: 9:00 a.a. - 9:00 p.m. Mon. - Fri. 9:00 a.m. - 5:30 p.m. Sat. 2:00 p.m. - 6:00 p.m. Sun. (reading and study
October - May).
Branches: Hours vary.
Boys Scouts of America St. Louis Area Council
812 Olive (01) CH. 1-7856
Scout Executive: Russell J. Hart
417 North 10th Street
Serves boys 8 - 17 in St. Louis, St. Louis County, and St. Charles, Jefferson, Warren, Lincoln, Ste. Genevieve, St. Francois, Washington, Dent, Iron, Reynolds, Crawford, and Franklin Counties.
Offers a program for character development, citizenship training, and physical fitness conducted through units sponsored by various commun-ity groups such as churches, schools, clubs, settlements, etc. Activi-ties include camping, hiking, weekly meetings with educational and
1'1'14)

4.
67
recreational programs. Provides formal and informal training for volunteer unit leaders, unit committeemen, parents, District and Council personnel. (For information on camps, see St. Louis Camp Directory available through the Health and Welfare Council of Metropolitan St. Louis.) Fees: no local fees. Annual national registration fee. of $.50 for boys and $1.00 for adults, collected locally and sent to National office.
Hours: 8:30 a.m. - 5:00 p.m. Mon. - Fri.
Girl Scout Council of Greater St. Louis
417 North 10th Street (01) CA. 1-0939
Executive Director: Mrs. Eve C. Hyde
Serves girls 7-17 (including the handicapped), resident in St. Louis and St. Louis County; Crawford, Franklin, Iron, Jefferson, Madison, Reynolds, St. Francois, Ste. Genevieve and Washington counties, Mo.
Offers an'informal education program for the development of character and sound citizenship. Trains adults for volunteer group leadership. Operates one resident camp at Pevely, Mo. One established troop camp at Gray Summit, Mo. Also 30 day camps. (See St. Louis Camp Directory available through the Health and —Hare Council.) Membership Fees: $1.00 annual national dues; $.05-$.10 per 'week troop dues. Camp fees: $50.00 for two weeks resident camp. $5.00 to $20.00 troop camp; $3.00 for day camp.
Hours: 8:30 a.m. - 5:00 p.m. Mon. - Fri.
Health and Welfare Council of Metropolitan St. Louis
417 North 10th (01) CA. 1-2600
Executive Director: Dan MacDonald
A voluntary, central planning organization bringing together over 200 health, welfare, and recreation agencies for purposes of: developing an adequate network of"services; coordinating work of all agencies in solving community social and health problems; eliminating or modify-ing services not meeting current needs; and assisting in development of community policies in regard to health and welfare of citizens.
The Council is concerned with the more than $182,000,000 spent annu-

•
r.
ally through tax dollars or voluntary giving in health, welfare, and recreation in the metropolitan area.
CHRISTMAS BUREAU
Provides a clearing and consultation service to individuals, groups, and agencies on charitable Christmas giving.
INFORMATION AND REFFRRAL SERVICE
Provides a ginerat ilif.-irmation service on health, welfare, recreation and informal education resources, and refers applicants for service to appropriate agencies.
VOLITNTrFR SERVICE BUREAU
Provides for organization and coordination of community volunteer services through consultation, central recruiting, referral of volunteers, and by assisting in developing training opportunities. Serves member agencies of the Council, and other agencies and organizations.
Hours: 8:30 a.m. - 5:00 p.m. Mon. - Fri.
C.O.R.E
1500 North Union Solomon Rooks, Chairman
St. Louis Metropolitan Police Department Seventh District - 1304 North Union James F. Reddick, Captain
Seventh District Police Community Relations 5884 Easton Sergeant Herman Saunders
18

BIBLIOGRAPHY
American Jewish Committee St. Louis Chapter, The. Report_ on the Survey of Inner City Jewish Businessmen. St. Louis: June,-)700 Umpublished manuscript. The American Jewish Committee St. Louis Chapter,, St. Louis, Missouri*
"Community Schools--a Family Affair," School and Homeo St. Louis: Board of Education, April, 19V9.
"Crime in Census Tract 6-D." Prepared for Kenneth W. Haupt by Sergeant Brown. Unpublished statistics. St. Louis Metropolitan Police Department Headquarters,; St. Louis, Missouri°
"Crime Statistics for St. Louis by Paulyblock--1969." Un-published statistics for paulyblocks 7°06 and 7.110 St. Louis Metropolitan Police Department, St. Louis, Missouri.
Interracial Council for Business Opportunity. I_Donet Know Much About the Theory, of Black Power,; but I Know What it is Lik to be Black and Powerless° New Yorkr Interracial Council for Business- Opportunity, n.d0
Inter-religious Center for Urban Affairs. Alternative Forms of Urban Ministry* Parts I and III St. Louist Inter-religious Center for Urban Affairs,- 1969.
Krentz, Edgar, secretary& Unpublishe "Minutesr" dated September 30, 19690 The files of Concordia Seminary, St. Louis, Missouri.
'Map Legend: St. Louis Public Schools."- Unpublished map and legend. Board of Education,- St.. Louis,. Missouri*
Human Development Corporation of Metropolitan St. Louis,- Research Department ofo Neighborhood Handbook for Human Development Corporation Wells-Goodfellow District. St& Louis: Human Development Corporation, December, 19680
Robert Gladstone and Associates,; Economic Consultants. Basic Economic Indicators* Prepared for the St. Louis City Plan Commission° Washington: Robert Gladstone and Associates, Economic Consultants, December 19680
St. Louis Board of Education. St. Louis Scorecard. St. Louis: Board of Education, September, 17-6-97

70
St. Louis Metropolitan Police Department. Statistical Supplement 1968. St. Louis: St. Louis Metropolitan Police Department., node
"Si. LoUU, Missouri, by Census Tracts and Blocks: 19,60" Unpublished map. City Plan Commission', St. Louis", Missouri.
"St. Louis, Missouri:= Urban Programs." Unpublished map®. City Plan Commission,. St. Louis, Missouri..
"St. Louis„ Missouri: Zoning District Map"," dated April,. 1969. Unpublished map. City Plan Commission', St. Louis,, Missouri.
United States Department of Commerce.. BUreau of Census, United States Census 1960, Washington.t. United States Government Printing Office,. 19610
Recommended