A Small-Scale Multifunctional Heat-Pulse Sensor for Soil Water Content and Electrical Conductivity
Robert Heinse, Kelly Lewis and Scott Jones
Environmental Soil Physics GroupDep. Plants, Soils and Biometeorology, Utah State University
Western Society of Soil Science 2006, Park City, UT

RationaleMultifunctional sensor
Complex measurementsIntegrated interpretation
Water content and electrical conductivity Heterogeneity at a wide range of scalesSampling volumeHeat-pulse methodDirect current EC
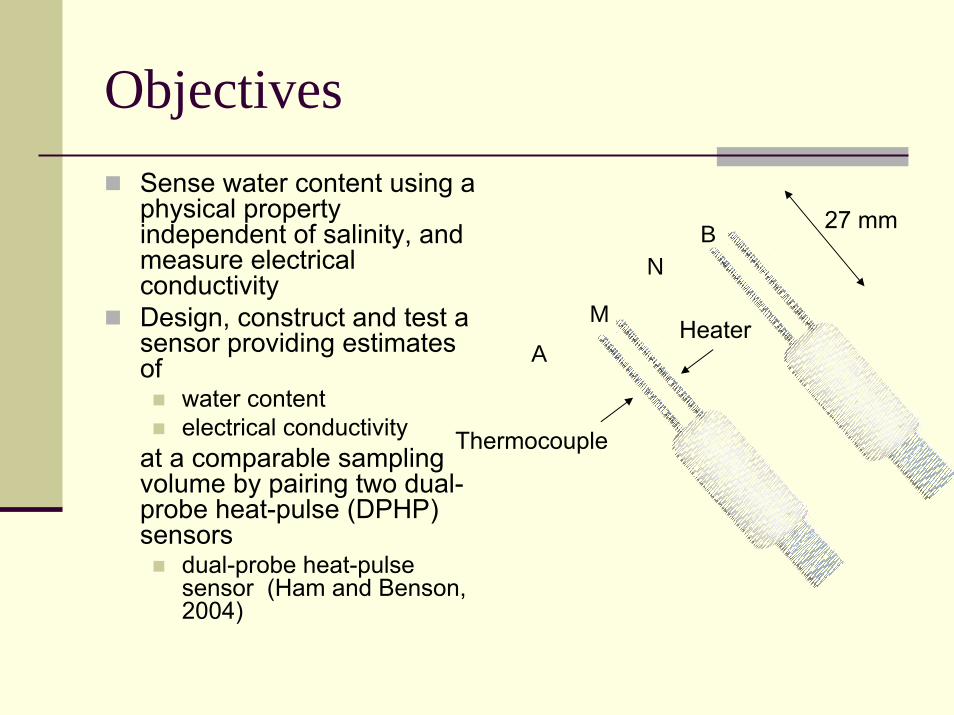
Objectives
A
B
M
N
Thermocouple
Heater
27 mmSense water content using a physical property independent of salinity, and measure electrical conductivityDesign, construct and test a sensor providing estimates of
water content electrical conductivity
at a comparable sampling volume by pairing two dual-probe heat-pulse (DPHP) sensors
dual-probe heat-pulse sensor (Ham and Benson, 2004)

Heat Pulse TheoryKnight and Kluitenberg (2004) model for
predicting volumetric water content :
mtt /0=ε c = specific heat capacityρ = bulk densityq’ = rate at which heat energy is releasedt0 = heater firing timetm = time to max tempr = apparent probe spacing∆T = Change in Temp
ww
sbv c
ccρρρθ −
=
)192
7128
5241
2411(' 5432
20 εεεε
πρ −−−−
∆≈
Tretqc

Prediction of the solution electrical conductivity σw:
Archie (1942)
where: σw… pore water conductivityS… saturationΦ… porositya, m, n… parameters
Measurement of the bulk electrical conductivity σ:
σσ nw
mw Sa −−Φ=
11111
2
−
⎥⎦
⎤⎢⎣
⎡⎟⎟⎠
⎞⎜⎜⎝
⎛−−⎟⎟
⎠
⎞⎜⎜⎝
⎛−=
BNBMANAM rrrrVIπ
σM N BA
I
V
A
B
M
N
Electrical Conductivity Theory

ImplementationShallow sample cell (2cm tall)Water addition/removal capability
porous plate at the bottom
DPHP and DPHP/4-electrodeAggregated clays
0.25—1 mm1—2 mm

0.4 0.5 0.6 0.7 0.8
0.4
0.5
0.6
0.7
0.8
DP
HP
θ [c
m3 c
m-3
]
(A)
0.25--1 mm
Syringe Volumetric Water Content [cm3 cm-3]0.4 0.5 0.6 0.7 0.8
0.4
0.5
0.6
0.7
0.8
DP
HP
θ [c
m3 c
m-3
]
(B)
1--2 mm
Syringe Volumetric Water Content [cm3 cm-3]
Change to cell water content!
Water Content Prediction

Saturated measurements with a solute pulse
15:00 18:00 21:000
0.1
0.2
0.3
0.4
0.5
0.6
0.7
Time
Spe
cific
Con
duct
ivity
[S m
-1]
Application of 0.68 Sm-1 Potassium Bromide Solution
Application of 0.04 Sm-1
Tap Water
σσ nw
mw Sa −−Φ=

Saturated measurements with a solute pulse
0 0.01 0.02 0.03 0.04 0.05 0.06 0.070
0.01
0.02
0.03
0.04
0.05
0.06
0.07
σw [S m-1]
Est
imat
ed σ
w [S
m-1
] salinizing
desalinizing
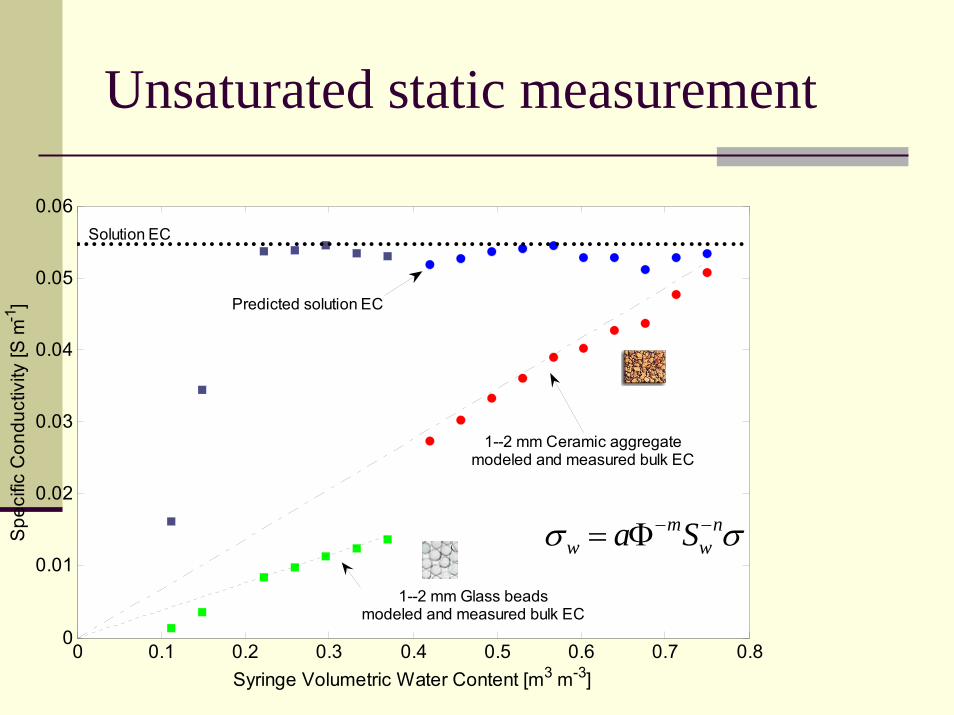
Unsaturated static measurement
0 0.1 0.2 0.3 0.4 0.5 0.6 0.7 0.80
0.01
0.02
0.03
0.04
0.05
0.06
Syringe Volumetric Water Content [m3 m-3]
Spe
cific
Con
duct
ivity
[S m
-1]
Solution EC
Predicted solution EC
1--2 mm Ceramic aggregatemodeled and measured bulk EC
1--2 mm Glass beadsmodeled and measured bulk EC
σσ nw
mw Sa −−Φ=

Nutrient monitoring
0 50 100 150 200 250 300
0.05
0.1
0.15
0.2
0.25
0.3
Time [hr]
Sol
utio
n E
lect
rical
Con
duct
ivity
[S m
-1]
Slow release fertilizer
12 4 6
3 5
Slow release fertilizer
12 4 6
3 51
1
3
3
2
2

-4
-4
-3
-3
-3-2
-2 -2
-2-1
-1
-1
0
0 0
11 22
2 33 101 -101
y [c
m]
0 2 4 6 8 10-2
-1.5
-1
-0.5
0
5
-5
-4 -4
-3
-3
-3
-2
-2
-2
-1
-10
0
0
1 1
-1-1
-1 -12
-2
2-1
2
x [cm]
y [c
m]
0 2 4 6 8 10-2
-1.5
-1
-0.5
0
A NM B
Sensitivity distribution
FactorsElectrode spacingPair spacingDepth???
Summary
Integration of heat-pulse water content and 4-electrode electrical conductivity sensing In-situ predictions in comparable sampling volumeMonitor fluxes of water and solutes
Poster presentation: “Measuring Electrical Conductivity Using A Low-Power Data-Logging System” by Lewis et al.

Measurement Accuracy
0 3 6 9 12 15 1810-5
100
105
Geo
met
ry F
acto
r [m
-1]
Spacing between AM [mm]0 3 6 9 12 15 18
100
Pot
entia
l Mea
sure
d ov
er M
N [V
]
0 3 6 9 12 15 18
100
0 3 6 9 12 15 1810-4
10-3
10-2
10-1
100
0.0004 S m-1
0.04 S m-1
4 S m-1
Recommended