A Preliminary Framework for Product Impact-Weighted Accounts George Serafeim Katie Trinh Rob Zochowski
Working Paper 20-076
Working Paper 20-076
Copyright © 2020 by George Serafeim, Katie Trinh and Rob Zochowski.
Working papers are in draft form. This working paper is distributed for purposes of comment and discussion only. It may not be reproduced without permission of the copyright holder. Copies of working papers are available from the author.
Funding for this research was provided in part by Harvard Business School.
A Preliminary Framework for Product Impact-Weighted Accounts
George Serafeim Harvard Business School
Katie Trinh Harvard Business School
Rob Zochowski Harvard Business School
1
A Preliminary Framework for Product Impact-Weighted Accounts
George Serafeim, Katie Trinh and Rob Zochowski∗
Harvard Business School
Abstract
While there has been significant progress in the measurement of an organization’s environmental and social performance, metrics to evaluate the impact of products once they come to market lag far behind. In this paper we provide a framework for systematic measurement of product impact in monetary terms and delve into the rationale for the framework’s seven elements. We then apply the whole framework to two competitor companies and elements of the framework across companies in different sectors of the economy to show the feasibility of measuring product impact and the actionability of the framework. Not only does this application demonstrate feasibility, it also indicates the value of impact-weighted financial statement analysis. We see our results as a first step, rather than a definitive answer, towards more systematic measurement of product impact in monetary terms that can then be reflected in financial statements with the purpose of creating impact-weighted financial accounts.
∗ George Serafeim is the Charles M. Williams Professor of Business Administration at Harvard Business School and the faculty lead of the Impact Weighted Accounts Project. Katie Trinh is a research associate at the Impact-Weighted Accounts Project at Harvard Business School. Rob Zochowski is the program director of the Impact-Weighted Accounts Project. The Impact-Weighted Accounts Initiative is a joint initiative between the Global Steering Group for Impact Investment and the Impact Management Project incubated as a project at Harvard Business School. We are grateful to the Division of Faculty Research and Development of the Harvard Business School for financial support. We thank Sir Ronald Cohen, David Freiberg, Eileen McNeely, Katie Panella, and Amanda Mary Rischbieth for many useful comments. Contact email: [email protected]
2
1. Introduction
Given that all companies have impacts on employees, customers and the natural
environment, efforts to measure environmental and social impact are crucial. Effective resource
management depends upon an accurate understanding of the current baseline and the anticipated
path forward. These allow for benchmarking, quantification of under- or out-performance, and the
possibility for course correction. Metrics also allow for allocation of resources in markets and the
development of price signals. Furthermore, they allow for the design of contracts, such as
compensation or lending contracts, which incentivize certain actions. For example, recent efforts
include the incorporation of environmental and social metrics in both executive compensation
plans and in bank loan contracts. Similarly, they can be included in the design of regulatory
incentives, such as tax or subsidy incentives.
The importance of measuring the impacts of companies is highlighted by the significant
growth in efforts to understand, measure and improve environmental and social impact. More
companies are disclosing environmental, social and governance (ESG) data as customers,
employees, investors and regulators are seeking to incorporate ESG considerations in their
decisions. As of 2017, 75% of the largest 100 companies in each of 49 countries (75% of 4,900
companies) were issuing sustainability reports with ESG data, a marked increase from the 12% in
1993.1 With over $22 trillion in assets under management labeled as ESG and more than $80
trillion publicly committed to integrate ESG data in investment decisions, asset owners and
managers have demonstrated a commitment to integrate ESG information in their investment
process.2
However, our own analysis and other research has indicated that currently most
environmental and social metrics disclosed by companies and prescribed by reporting standards
pertain to a company’s operations, defined as activities that happen within the company’s own
organizational control or in some cases, in their upstream supply chains.3 Examples of operational
impacts include water consumption, waste generation, carbon emissions, employee health and
safety records or diversity and inclusion efforts. While great progress has been made in measuring
1 Jose’ Luis Blasco, Adrian King, et al., “The road ahead: The KPMG Survey of Corporate Responsibility Reporting 2017,” KPMG International, page 9. Accessed July 9, 2019. 2 Global Sustainable Investment Alliance, “2016 Global Sustainable Investment Review” (PDF File), downloaded from GSI-Alliance Website on July 9, 2019. 3 NYU Stern Center for Business and Human Rights. “Putting the ‘S’ in ESG: Measuring Human Rights Performance for Investors.” March 2017. Accessed July 9, 2019.
3
such operational impacts and more disclosure now exists around them, the progress on measuring
the far-ranging impacts that products have on consumers and society has been less impressive.
Product impact refers to impact that occurs once a company has transferred control of
goods or services, which is consistent with traditional accounting recognition of a sale.
Measurement efforts for product impact are still coarse, relegated to broad categorizations such as
businesses with large negative externalities, traditionally tobacco and more recently coal, versus
all else. However, in reality, different products can have fundamentally different impacts due to
their effectiveness, affordability and reach, among other factors.
Moreover, while significant progress has been made in the development of environmental
and social metrics, these are not embedded in a financial statements’ framework enabling
managers and investors to understand trade-offs and relative performance evaluation that considers
impact along with risk and return. Monetization based on available data translates impact into a
language that is familiar to decision-makers. For this to happen impacts need to be measured and
monetized based on available data. Creating impact-weighted financial accounts is a scalable
solution for the incorporation of impact in business decision-making.
For companies that do measure their product impact, impact evaluation is highly specific,
limiting comparability and scalability. Moreover, the number of companies that have managed to
measure product impact in monetary terms is even more limited. Of the 56 companies that have
experimented with monetary impact valuation, only twenty percent estimate product impact.4 NS
Rail applies a monetary value to the mobility trains provide, whereas Safaricom measures the value
of secure financial connectivity created by M-Pesa. As demonstrated, the dimensions on which
these companies measure product impact are highly specific to individual products. Therein lies
the difficulty with measuring product impact: such impacts, in contrast to employment or
environmental impacts from operations, tend to be highly idiosyncratic limiting the ability to
generalize and scale such measurements.
A framework in which product impacts can be measured and monetized is needed. First,
creating a framework to measure the impacts of products introduces a systematic and repeatable
methodology that can capture product impacts across industries. This allows for transparency,
comparability, and scalability of product impacts. Second, a framework enables more nuanced
4 George Serafeim, T. Robert Zochowski, Jen Downing. “Impact-Weighted Financial Accounts: The Missing Piece for an Impact Economy”, Harvard Business School. Accessed December 16, 2019.
4
measurement of product impact. Rather than categorizing certain products, such as cigarettes or
coal, as unequivocally negative, a framework allows measurement of the level of positive or
negative impact that all types of products can create, including many that have large negative
externalities but are not traditionally classified as ‘sin’ businesses (e.g. high trans-fat or sodium
food). Measuring positive impacts allows for differentiation across products and companies and
derivation of a more balanced assessment of a company’s impact. Finally, the introduction of a
product framework encourages a holistic approach of measuring and reflecting impact in financial
statements by broadening the scope of impacts beyond operations. Instead of relying on customer
willingness to pay or demand to measure product impact, a framework expands measurement to
impacts that may not be felt by customers until years later or may not be borne by customers
directly, as in the case of environmental damage. An exhaustive system for measuring impact is
critical to promote and manage the development of products with better total stakeholder value.
Ultimately, the aspiration is to provide investors and managers with the ability to make more
informed decisions that account for the impact of a company’s product.
In this paper we provide a framework for systematic measurement of product impact and
the rationale for each of its elements. Moreover, we apply the framework in the context of two
competitor companies to show the feasibility of measuring product impact and actionability of the
framework. Then we generalize the framework showing examples of how it could be applied on
companies in other industries, such as pharmaceuticals, consumer packaged goods companies, and
water utilities. We see our results as a first step, rather than a definitive answer, towards more
systematic measurement of product impact in monetary terms that can then be reflected in financial
statements with the purpose of creating impact-weighed financial accounts.
2. Current efforts to measure product impact
There has been a significant level of experimentation in the market attempting to measure
product impact. These efforts have moved the field forward and allowed for a more sophisticated
treatment of product impact. In examining the different methodologies used to measure product
impact by organizations such as companies, investors, reporting standards, and data providers, a
few patterns arise. The metrics often are input or process oriented and are highly specific to single
products, investments, or industries. Where monetary impacts are estimated, there is a lack of
transparency around the specific assumptions used to monetize outcomes. In addition, the current
5
state of product impact measurement has comparability and accountability limitations. Below, the
current measurement efforts of different companies, investors, reporting standards, and data
providers is examined.
2.1.Companies
Companies have made significant progress in identifying a consistent methodology with
which to measure product impact. For example, the Handbook for Product Social Impact has
created a consensus-based methodology to inform companies on how they can assess the impacts
of products.5 Given the highly idiosyncratic nature of product impacts, a consistent methodology
can still produce a wide range of reported impacts that vary between companies. Even within a
single company with a range of different products, there is no consistent set of metrics used to
estimate product impacts. Yet, companies can compare their products to alternatives in the market
when identifying the impact their product generates. These product impact comparisons indicate a
feasibility for using similar metrics to compare the product impact of two different products and
suggests there is some set of relevant metrics across products that should be identified and
standardized.
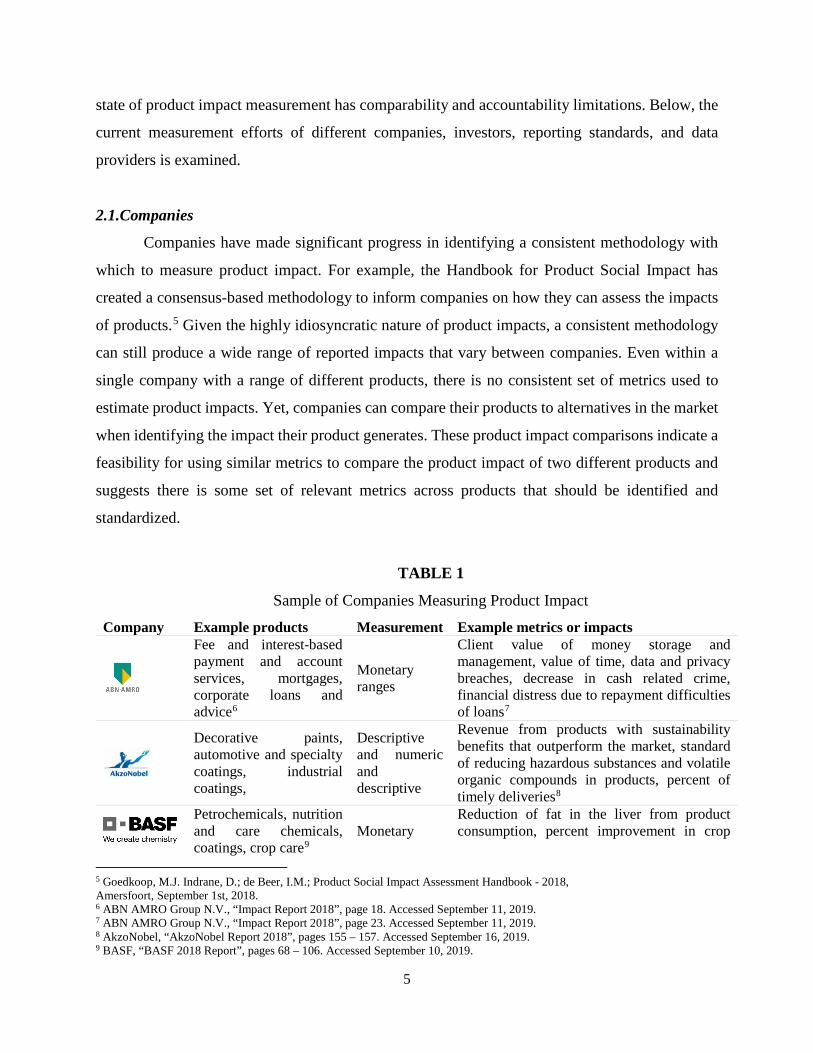
TABLE 1
Sample of Companies Measuring Product Impact
Company Example products Measurement Example metrics or impacts
Fee and interest-based payment and account services, mortgages, corporate loans and advice6
Monetary ranges
Client value of money storage and management, value of time, data and privacy breaches, decrease in cash related crime, financial distress due to repayment difficulties of loans7
Decorative paints, automotive and specialty coatings, industrial coatings,
Descriptive and numeric and descriptive
Revenue from products with sustainability benefits that outperform the market, standard of reducing hazardous substances and volatile organic compounds in products, percent of timely deliveries8
Petrochemicals, nutrition and care chemicals, coatings, crop care9
Monetary Reduction of fat in the liver from product consumption, percent improvement in crop
5 Goedkoop, M.J. Indrane, D.; de Beer, I.M.; Product Social Impact Assessment Handbook - 2018, Amersfoort, September 1st, 2018. 6 ABN AMRO Group N.V., “Impact Report 2018”, page 18. Accessed September 11, 2019. 7 ABN AMRO Group N.V., “Impact Report 2018”, page 23. Accessed September 11, 2019. 8 AkzoNobel, “AkzoNobel Report 2018”, pages 155 – 157. Accessed September 16, 2019. 9 BASF, “BASF 2018 Report”, pages 68 – 106. Accessed September 10, 2019.
6
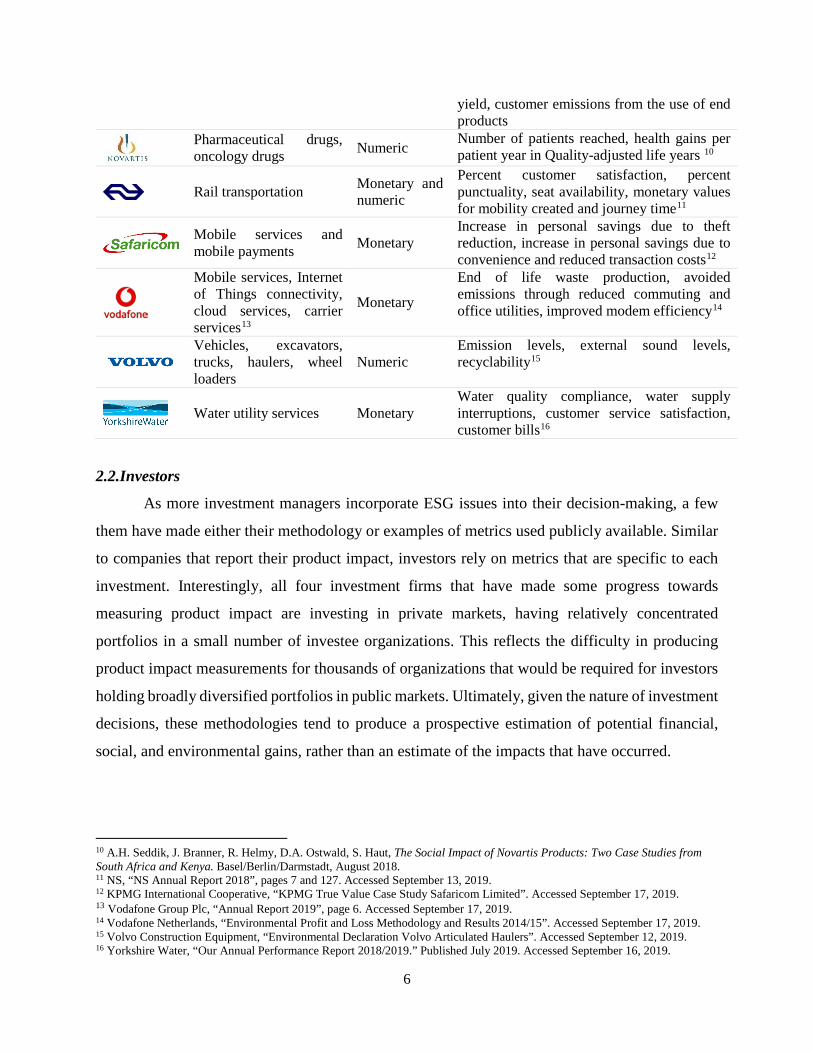
yield, customer emissions from the use of end products
Pharmaceutical drugs, oncology drugs Numeric Number of patients reached, health gains per
patient year in Quality-adjusted life years 10
Rail transportation Monetary and numeric
Percent customer satisfaction, percent punctuality, seat availability, monetary values for mobility created and journey time11
Mobile services and mobile payments Monetary
Increase in personal savings due to theft reduction, increase in personal savings due to convenience and reduced transaction costs12
Mobile services, Internet of Things connectivity, cloud services, carrier services13
Monetary
End of life waste production, avoided emissions through reduced commuting and office utilities, improved modem efficiency14
Vehicles, excavators, trucks, haulers, wheel loaders
Numeric Emission levels, external sound levels, recyclability15
Water utility services Monetary Water quality compliance, water supply interruptions, customer service satisfaction, customer bills16
2.2.Investors
As more investment managers incorporate ESG issues into their decision-making, a few
them have made either their methodology or examples of metrics used publicly available. Similar
to companies that report their product impact, investors rely on metrics that are specific to each
investment. Interestingly, all four investment firms that have made some progress towards
measuring product impact are investing in private markets, having relatively concentrated
portfolios in a small number of investee organizations. This reflects the difficulty in producing
product impact measurements for thousands of organizations that would be required for investors
holding broadly diversified portfolios in public markets. Ultimately, given the nature of investment
decisions, these methodologies tend to produce a prospective estimation of potential financial,
social, and environmental gains, rather than an estimate of the impacts that have occurred.
10 A.H. Seddik, J. Branner, R. Helmy, D.A. Ostwald, S. Haut, The Social Impact of Novartis Products: Two Case Studies from South Africa and Kenya. Basel/Berlin/Darmstadt, August 2018. 11 NS, “NS Annual Report 2018”, pages 7 and 127. Accessed September 13, 2019. 12 KPMG International Cooperative, “KPMG True Value Case Study Safaricom Limited”. Accessed September 17, 2019. 13 Vodafone Group Plc, “Annual Report 2019”, page 6. Accessed September 17, 2019. 14 Vodafone Netherlands, “Environmental Profit and Loss Methodology and Results 2014/15”. Accessed September 17, 2019. 15 Volvo Construction Equipment, “Environmental Declaration Volvo Articulated Haulers”. Accessed September 12, 2019. 16 Yorkshire Water, “Our Annual Performance Report 2018/2019.” Published July 2019. Accessed September 16, 2019.
7
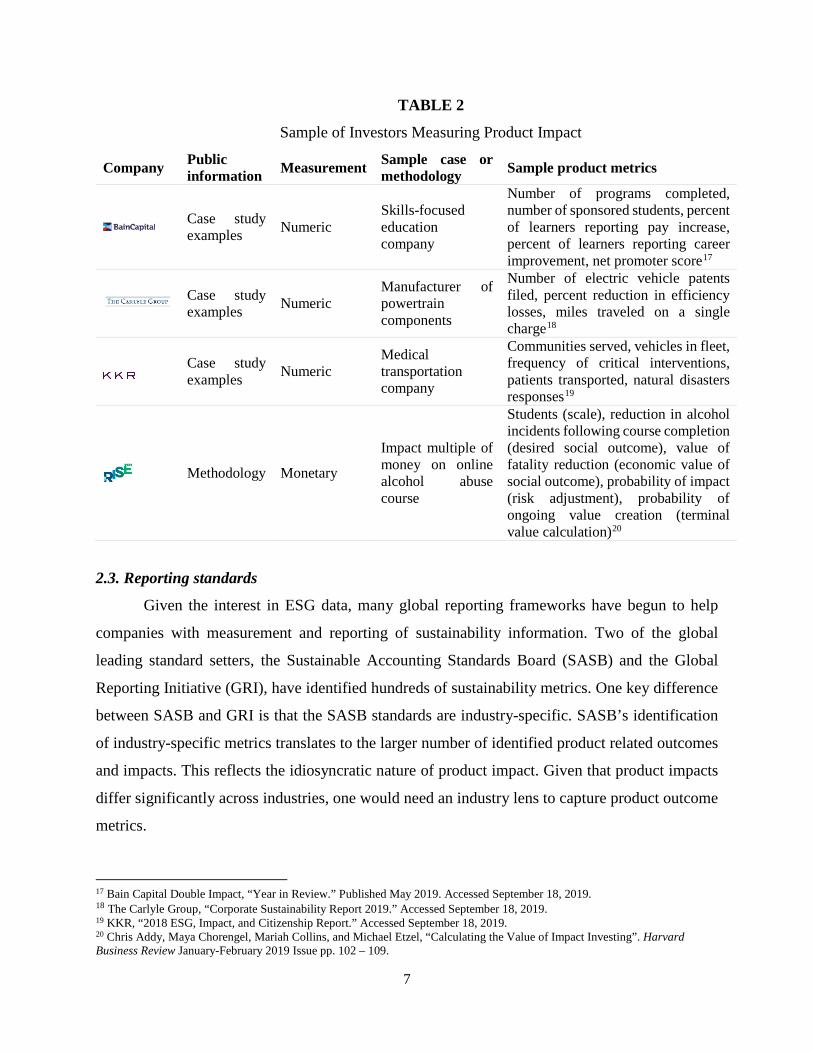
TABLE 2
Sample of Investors Measuring Product Impact
Company Public information Measurement Sample case or
methodology Sample product metrics
Case study examples Numeric
Skills-focused education company
Number of programs completed, number of sponsored students, percent of learners reporting pay increase, percent of learners reporting career improvement, net promoter score17
Case study examples Numeric
Manufacturer of powertrain components
Number of electric vehicle patents filed, percent reduction in efficiency losses, miles traveled on a single charge18
Case study examples Numeric
Medical transportation company
Communities served, vehicles in fleet, frequency of critical interventions, patients transported, natural disasters responses19
Methodology Monetary
Impact multiple of money on online alcohol abuse course
Students (scale), reduction in alcohol incidents following course completion (desired social outcome), value of fatality reduction (economic value of social outcome), probability of impact (risk adjustment), probability of ongoing value creation (terminal value calculation)20
2.3. Reporting standards
Given the interest in ESG data, many global reporting frameworks have begun to help
companies with measurement and reporting of sustainability information. Two of the global
leading standard setters, the Sustainable Accounting Standards Board (SASB) and the Global
Reporting Initiative (GRI), have identified hundreds of sustainability metrics. One key difference
between SASB and GRI is that the SASB standards are industry-specific. SASB’s identification
of industry-specific metrics translates to the larger number of identified product related outcomes
and impacts. This reflects the idiosyncratic nature of product impact. Given that product impacts
differ significantly across industries, one would need an industry lens to capture product outcome
metrics.
17 Bain Capital Double Impact, “Year in Review.” Published May 2019. Accessed September 18, 2019. 18 The Carlyle Group, “Corporate Sustainability Report 2019.” Accessed September 18, 2019. 19 KKR, “2018 ESG, Impact, and Citizenship Report.” Accessed September 18, 2019. 20 Chris Addy, Maya Chorengel, Mariah Collins, and Michael Etzel, “Calculating the Value of Impact Investing”. Harvard Business Review January-February 2019 Issue pp. 102 – 109.
8
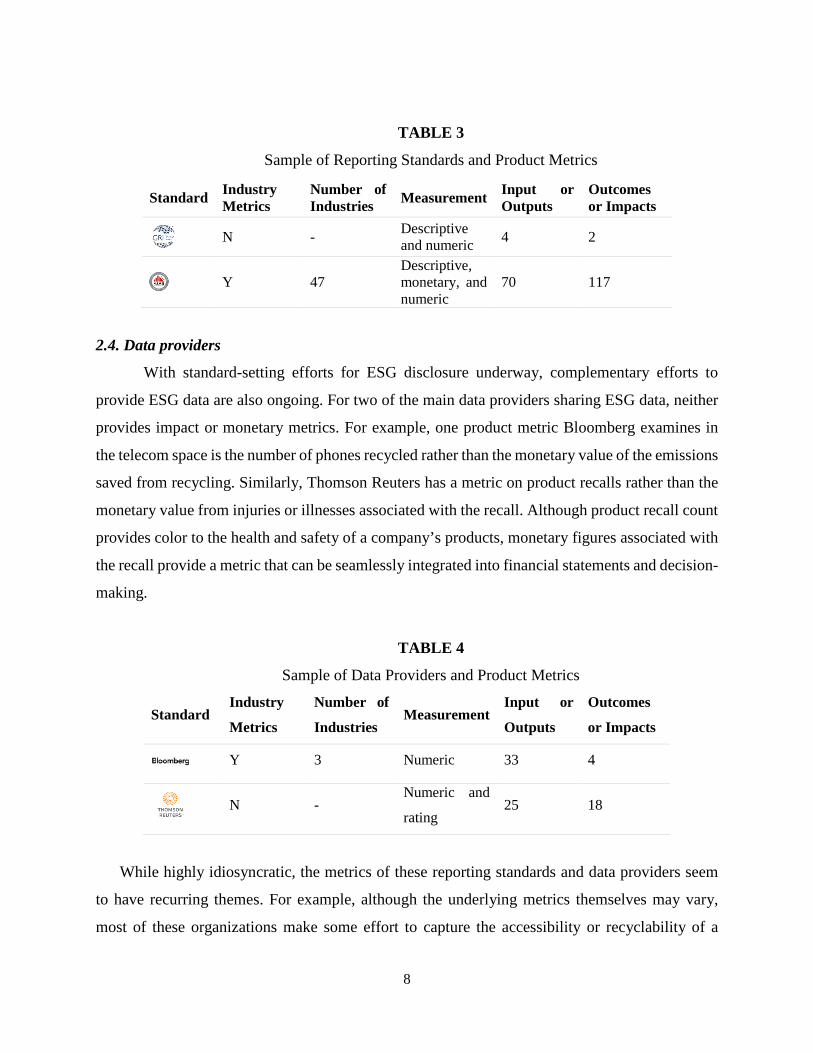
TABLE 3
Sample of Reporting Standards and Product Metrics
Standard Industry Metrics
Number of Industries Measurement Input or
Outputs Outcomes or Impacts
N - Descriptive and numeric 4 2
Y 47 Descriptive, monetary, and numeric
70 117
2.4. Data providers
With standard-setting efforts for ESG disclosure underway, complementary efforts to
provide ESG data are also ongoing. For two of the main data providers sharing ESG data, neither
provides impact or monetary metrics. For example, one product metric Bloomberg examines in
the telecom space is the number of phones recycled rather than the monetary value of the emissions
saved from recycling. Similarly, Thomson Reuters has a metric on product recalls rather than the
monetary value from injuries or illnesses associated with the recall. Although product recall count
provides color to the health and safety of a company’s products, monetary figures associated with
the recall provide a metric that can be seamlessly integrated into financial statements and decision-
making.
TABLE 4
Sample of Data Providers and Product Metrics
Standard Industry
Metrics
Number of
Industries Measurement
Input or
Outputs
Outcomes
or Impacts
Y 3 Numeric 33 4
N -
Numeric and
rating 25 18
While highly idiosyncratic, the metrics of these reporting standards and data providers seem
to have recurring themes. For example, although the underlying metrics themselves may vary,
most of these organizations make some effort to capture the accessibility or recyclability of a
9
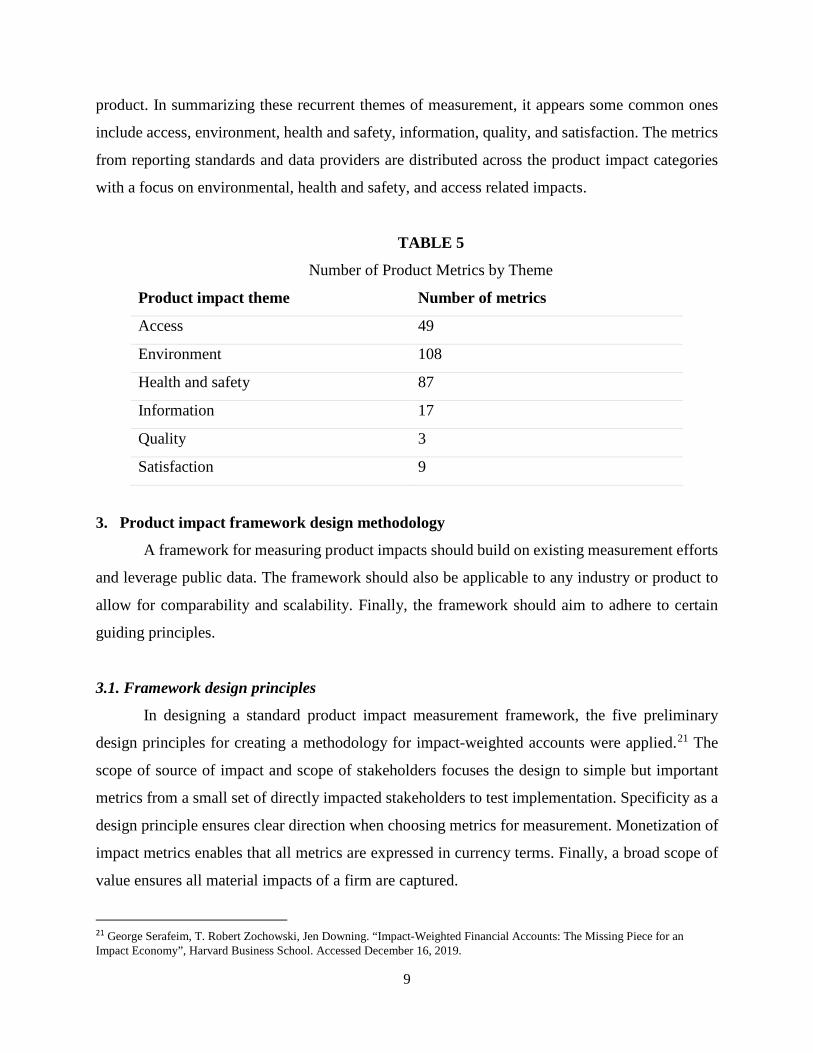
product. In summarizing these recurrent themes of measurement, it appears some common ones
include access, environment, health and safety, information, quality, and satisfaction. The metrics
from reporting standards and data providers are distributed across the product impact categories
with a focus on environmental, health and safety, and access related impacts.
TABLE 5
Number of Product Metrics by Theme
Product impact theme Number of metrics
Access 49
Environment 108
Health and safety 87
Information 17
Quality 3
Satisfaction 9
3. Product impact framework design methodology
A framework for measuring product impacts should build on existing measurement efforts
and leverage public data. The framework should also be applicable to any industry or product to
allow for comparability and scalability. Finally, the framework should aim to adhere to certain
guiding principles.
3.1. Framework design principles
In designing a standard product impact measurement framework, the five preliminary
design principles for creating a methodology for impact-weighted accounts were applied.21 The
scope of source of impact and scope of stakeholders focuses the design to simple but important
metrics from a small set of directly impacted stakeholders to test implementation. Specificity as a
design principle ensures clear direction when choosing metrics for measurement. Monetization of
impact metrics enables that all metrics are expressed in currency terms. Finally, a broad scope of
value ensures all material impacts of a firm are captured.
21 George Serafeim, T. Robert Zochowski, Jen Downing. “Impact-Weighted Financial Accounts: The Missing Piece for an Impact Economy”, Harvard Business School. Accessed December 16, 2019.
10
From these preliminary principles, an additional five product-specific guiding principles
were identified when testing the framework against various industries. Consistency ensures the
framework has constant units, scale, and approach. Incentive alignment encourages consideration
of the behavior that is incentivized by the framework to ensure it is aligned with positive social
and environmental impact. Best-in-class benchmarking protects the impact of a product or industry
from moving towards an unwanted average. Conservatism bases the framework in feasible
assumptions and comparisons. Finally, limiting impacts to first-order effects allows for clear
delineation and attribution.
3.2. Building the framework
To identify the relevant dimensions of product impact, a thought experiment was conducted
in which the product impact of two products with identical features and qualities are compared.
All else equal, the product with greater reach would have greater impact. Therefore, reach must
be a dimension of product impact, composed of a product’s quantity and duration. In reality,
products do not have identical features and therefore, greater reach does not mean greater impact.
Holding reach constant in simplified examples allows identification of the other dimensions of
product impact.
To identify these other dimensions of product impact, additional thought experiments can
be conducted to explore the elements of a customer’s interaction with a product. Consider the
impact of designer handbags and water where both products have the same reach. Water would be
viewed as more impactful because of the inherent goodness of the product. While water is a basic
need that provides sanitation and prevents dehydration, a designer handbag is a luxury item with
lower inherent utility. This example illustrates that quality is a dimension of a product’s impact.
To specify, quality as a dimension of impact therefore captures the extent to which a product
provides a basic need of inherent goodness and the effectiveness of a product which can be
measured by customer satisfaction, rather than the level of craftsmanship or leather that might be
used in a designer bag.
Next, consider the impact of a generic and prescription drug where both products have the
same reach and quality but the generic has a lower price. The lower priced generic would be viewed
as more impactful since its pricing makes it more accessible to consumers. Therefore, another
dimension of a product’s customer usage impact is access.
11
Holding price, reach, and quality constant, consider the example of cigarettes. Cigarettes
have accessible pricing (especially in the absence of taxes), broad reach, and high customer
satisfaction but are generally accepted as a product that is unequivocally bad. Regardless of the
negative impacts of cigarettes, the product maintains broad reach due its addictive nature.
Therefore, a dimension that product impact should capture is consumer optionality (i.e. if the
consumer has the freedom to make choices). In cases of addictive products or monopolies this
optionality is limited. Together, access, quality, and optionality compose of the customer usage
dimensions.
Finally, consider various products that produce energy, such as coal and solar. If the two
products had the same price, reach, quality, and optionality, solar energy would have greater
positive impact than coal because solar energy produces fewer emissions than coal when used. A
product’s environmental impact through usage efficiency and end of life recyclability is a
dimension of capturing a product’s overall impacts.
Looking at existing disclosure data, reach (quantity and duration), the customer usage
dimensions (quality, access, and optionality), environmental usage, and end of life impacts of
products are comprehensive of the categories that appear in existing measurement efforts. Pricing
and underserved impacts are components to access. Health and safety, data privacy, and innovation
are some of the attributes of a product’s quality. Information is one of the components within
optionality. Finally, emissions, energy and recyclability contribute to a product’s environmental
impact.
4. Diving deeper into the product impact framework
The dimensions of product impacts can be aggregated into a cohesive framework for use
across products and industries.
12
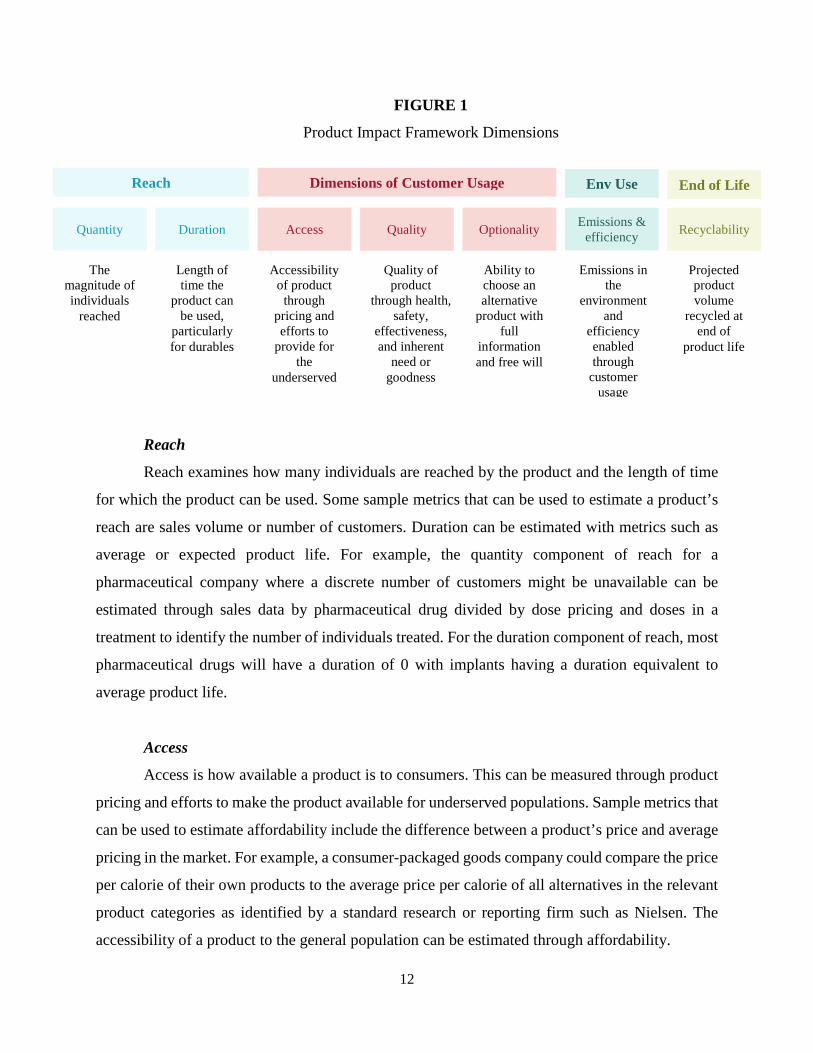
FIGURE 1
Product Impact Framework Dimensions
Reach
Reach examines how many individuals are reached by the product and the length of time
for which the product can be used. Some sample metrics that can be used to estimate a product’s
reach are sales volume or number of customers. Duration can be estimated with metrics such as
average or expected product life. For example, the quantity component of reach for a
pharmaceutical company where a discrete number of customers might be unavailable can be
estimated through sales data by pharmaceutical drug divided by dose pricing and doses in a
treatment to identify the number of individuals treated. For the duration component of reach, most
pharmaceutical drugs will have a duration of 0 with implants having a duration equivalent to
average product life.
Access
Access is how available a product is to consumers. This can be measured through product
pricing and efforts to make the product available for underserved populations. Sample metrics that
can be used to estimate affordability include the difference between a product’s price and average
pricing in the market. For example, a consumer-packaged goods company could compare the price
per calorie of their own products to the average price per calorie of all alternatives in the relevant
product categories as identified by a standard research or reporting firm such as Nielsen. The
accessibility of a product to the general population can be estimated through affordability.
Reach Dimensions of Customer Usage Env Use
End of Life
Quantity Access Duration Quality Optionality Emissions &
efficiency
Recyclability
The magnitude of individuals
reached
Length of time the
product can be used,
particularly for durables
Accessibility of product
through pricing and efforts to
provide for the
underserved
Quality of product
through health, safety,
effectiveness, and inherent
need or goodness
Ability to choose an alternative
product with full
information and free will
Emissions in the
environment and
efficiency enabled through
customer usage
Projected product volume
recycled at end of
product life
13
For particularly vulnerable populations, access to various products often allows for the
realization of large, critical impacts at a scale far beyond that of the general population. Given the
significance and importance of these impacts, product impacts to the underserved are estimated
separately in addition to general access. For a product to qualify as accessible to the underserved,
the product must address a UN Sustainable Development Goal in a market that would usually not
have access to the product. For example, cigarettes do not address a sustainable development goal
but are sold in developing markets. They would not be viewed as products that address an
underserved population even though they are serving a developing market because they make no
contributions to development. On the other hand, a pharmaceutical company could estimate the
averted medical and mortality costs and productivity gains of providing qualified drugs to
underserved markets.
Quality
Quality of a product can be measured by the health and safety, effectiveness, and inherent
goodness of the product. The health and safety of a product examines whether the product performs
to expected health, safety and privacy standards. For a packaged food product, its health and safety
would not be captured by how healthy the food product is, but by the costs associated with food-
borne illnesses from product recalls. Other metrics that can capture the health and safety of a
product include controversies or data leaks associated with the product.
The effectiveness of a product is whether the product works as it should. For packaged
food products, effectiveness would be where the nutritional value of the product is captured. For
example, the whole grains, fiber, added sugar, sodium, and trans-fat content of a product can be
translated to costs associated with changes in risk of coronary heart disease or diabetes. Where
effectiveness cannot be readily observed, customer satisfaction can be used as a proxy measure.
Lastly, the necessity dimension of the product examines whether the product provides some
basic need to the population. Elasticity can be used to identify products that are basic needs. Some
other relevant metrics for estimating how the product addresses a basic need include global
economic losses avoided through the product. For example, the basic need component of a utilities
company providing water would be captured through the averted economic losses from sanitation.
Similarly, the basic need component of certain food products would be the averted economic losses
of starvation.
14
Optionality
Optionality of a product is the extent to which consumers have free will and full
information in their purchasing choices. The optionality in product choice is composed by
information availability, monopolistic nature of the industry, and decision altering characteristics.
Under information availability, sample metrics would include labeling and marketing
controversies. For example, a water utilities company could use warning letters and fines around
improper marketing to estimate the costs of inaccurate information to consumers.
To identify products in an industry with monopolistic behavior, the Herfindahl-Hirschman
Index (HHI) or four-firm concentration ration (CR4) can be used. Monopolistic industries such as
the pharmaceutical industry can estimate extractive rents to consumers by using the excess of costs
associated with marketing to research and development.
For decision altering products, sample metrics include how addictive a product is. A
tobacco company could estimate the productivity and treatment costs associated with addiction
itself.
Environmental use emissions
Environmental impacts from product usage include emissions to the environment and
efficiencies enabled through product use. Some sample metrics that capture the efficiency of a
product are carbon or particulate emissions from use or energy required from use. A consumer-
packaged goods company could identify the carbon cost of emissions that would be used for
cooking and storage of the product.
End of life recyclability
End of life environmental impacts are based on the end of life treatment of the product.
Sample metrics could include volume or percentage recyclability and recoverability. A
pharmaceutical company could identify the associated carbon costs with the end of life treatment
of products sold.
5. Application of the product impact framework
Thus far, the product impact framework has been applied to company pairs within a number
of different industries across different sectors. These applications ensure the framework is feasible,
15
scalable, and comparable across different sectors. These applications also uncover nuances within
the dimensions of the framework and demonstrate how actual monetary values can be estimated
within each dimension.
We will first review a deep-dive of two competitor companies within a single industry,
automobile manufacturing, to provide a cohesive example that examines the impacts of
automobiles across all the product impact dimensions. We focus our impact estimates on those of
passenger fleet vehicles. The companies will be referred to as Company A and B given the purpose
of this exercise is to examine feasibility and is not to assess the performance of individual
companies. However, we note that all the data are actual data from two of the largest automobile
manufacturers in the world. We will then examine each dimension of the product framework with
an example from one of the following industries: consumer packaged goods, pharmaceuticals, or
water utilities, to demonstrate applicability of the dimensions across different industries and
different sectors when the underlying data and assumptions change.
5.1 Data collection process
The examples below are based on publicly disclosed data and industry-wide assumptions.
Company datapoints reflect information found in the most recent annual financial statements such
as the company’s Form 10-K, annual sustainability reports which often disclose SASB and GRI
metrics, and industry-wide assumptions from government agencies such as the US Department of
Transportation or the Food and Drug Administration.
16
6. Automobile manufacturing application of the product impact framework
6.1 Overall impacts estimated
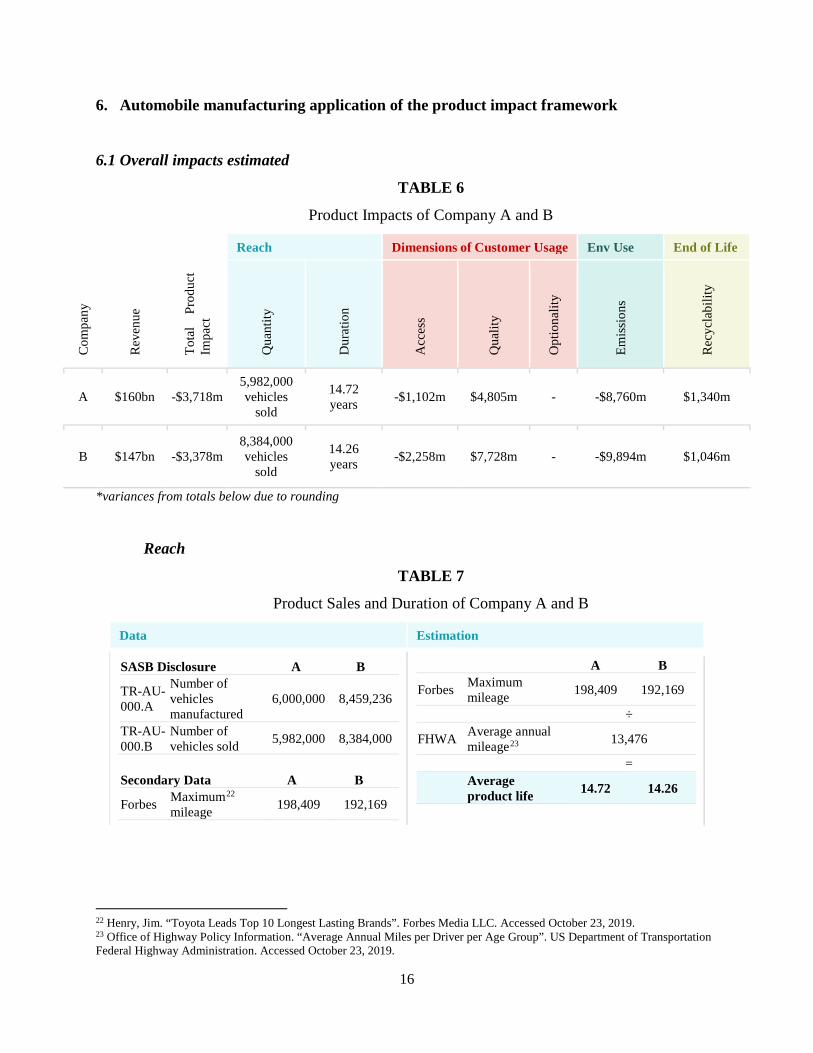
TABLE 6
Product Impacts of Company A and B
Reach Dimensions of Customer Usage Env Use End of Life
Com
pany
Rev
enue
Tota
l Pr
oduc
t Im
pact
Qua
ntity
Dur
atio
n
Acc
ess
Qua
lity
Opt
iona
lity
Emis
sion
s
Rec
ycla
bilit
y
A $160bn -$3,718m 5,982,000 vehicles
sold
14.72 years -$1,102m $4,805m - -$8,760m $1,340m
B $147bn -$3,378m 8,384,000 vehicles
sold
14.26 years -$2,258m $7,728m - -$9,894m $1,046m
*variances from totals below due to rounding
Reach
TABLE 7
Product Sales and Duration of Company A and B
Data Estimation
SASB Disclosure A B
TR-AU-000.A
Number of vehicles manufactured
6,000,000 8,459,236
TR-AU-000.B
Number of vehicles sold 5,982,000 8,384,000
Secondary Data A B
Forbes Maximum22 mileage 198,409 192,169
A B
Forbes Maximum mileage 198,409 192,169
÷
FHWA Average annual mileage23 13,476
= Average
product life 14.72 14.26
22 Henry, Jim. “Toyota Leads Top 10 Longest Lasting Brands”. Forbes Media LLC. Accessed October 23, 2019. 23 Office of Highway Policy Information. “Average Annual Miles per Driver per Age Group”. US Department of Transportation Federal Highway Administration. Accessed October 23, 2019.
17
To estimate the relevant quantity and duration for reach, a combination of publicly
disclosed data and secondary assumptions were used. The maximum mileage of the manufacturer’s
vehicle and average annual mileage in the United States are used to estimate average product life.
Although annual mileage is specific to the United States, this does not indicate that the framework
itself is only applicable in the United States. Instead, this is indicative of how an estimate can be
influenced by data availability. If a company were to apply this framework, internal data on
product life could be applied instead of calculating duration from a localized assumption.
The importance of accounting for average product life is highlighted with durable products.
The impact of a vehicle on the consumer is not limited to point of sale, but throughout its useful
life. For example, a vehicle has affordability and efficiency impacts throughout use and
maintenance and environmental impact at end of life. Therefore, average product life is needed to
determine how long and when to recognize usage and end of life impacts.
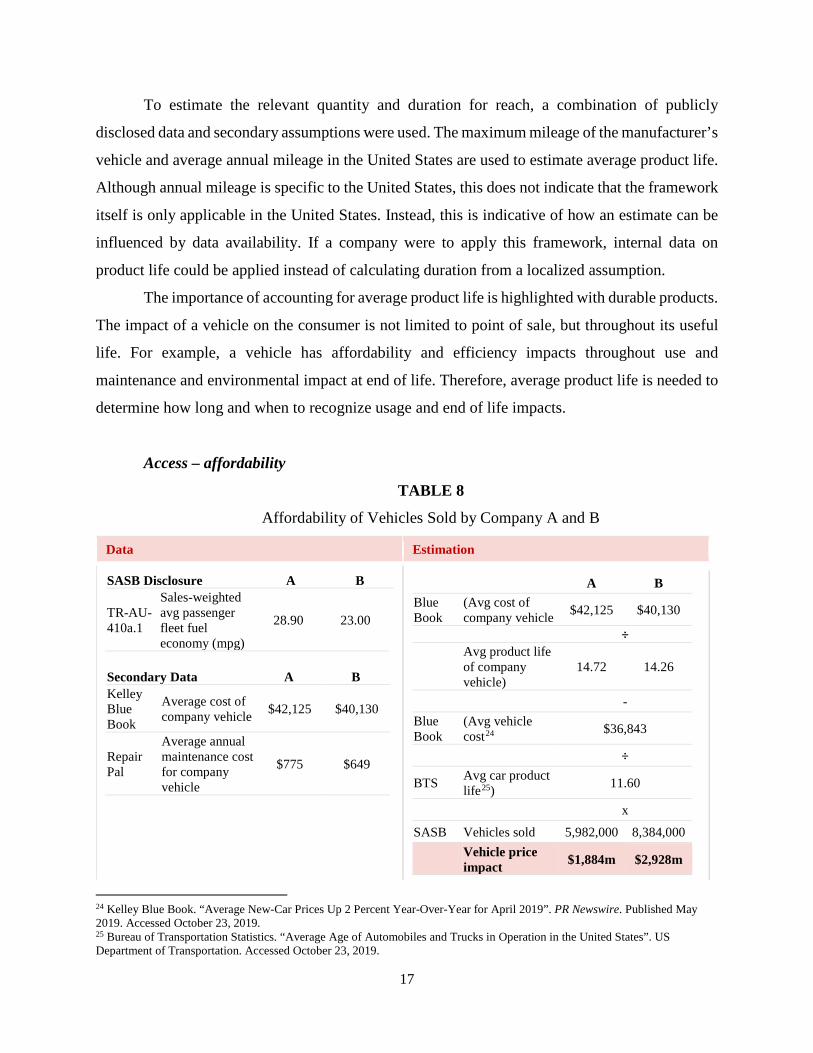
Access – affordability
TABLE 8
Affordability of Vehicles Sold by Company A and B
Data Estimation
SASB Disclosure A B
TR-AU-410a.1
Sales-weighted avg passenger fleet fuel economy (mpg)
28.90 23.00
Secondary Data A B Kelley Blue Book
Average cost of company vehicle $42,125 $40,130
Repair Pal
Average annual maintenance cost for company vehicle
$775 $649
A B Blue Book
(Avg cost of company vehicle $42,125 $40,130
÷
Avg product life of company vehicle)
14.72 14.26
- Blue Book
(Avg vehicle cost24 $36,843
÷
BTS Avg car product life25) 11.60
x
SASB Vehicles sold 5,982,000 8,384,000
Vehicle price impact $1,884m $2,928m
24 Kelley Blue Book. “Average New-Car Prices Up 2 Percent Year-Over-Year for April 2019”. PR Newswire. Published May 2019. Accessed October 23, 2019. 25 Bureau of Transportation Statistics. “Average Age of Automobiles and Trucks in Operation in the United States”. US Department of Transportation. Accessed October 23, 2019.
18
A B
Repair Pal
(Avg maintenance for company vehicle
$775 $649
-
Avg general vehicle maintenance26)
$1,186
x
SASB Vehicles sold 5,982,000 8,384,000
Maintenance impact $2,458m $4,502m
A B
FWHA (Average miles driven 13,476
÷ SASB Vehicle mileage) 28.9 23 -
FWHA (Average miles driven 13,476
÷
EPA Most efficient mileage27) 136
x
EPA Price of gallon of fuel28 $2.64
x
SASB Vehicles sold 5,982,000 8,384,000
Fuel price impact -$5,799m -$10,775m
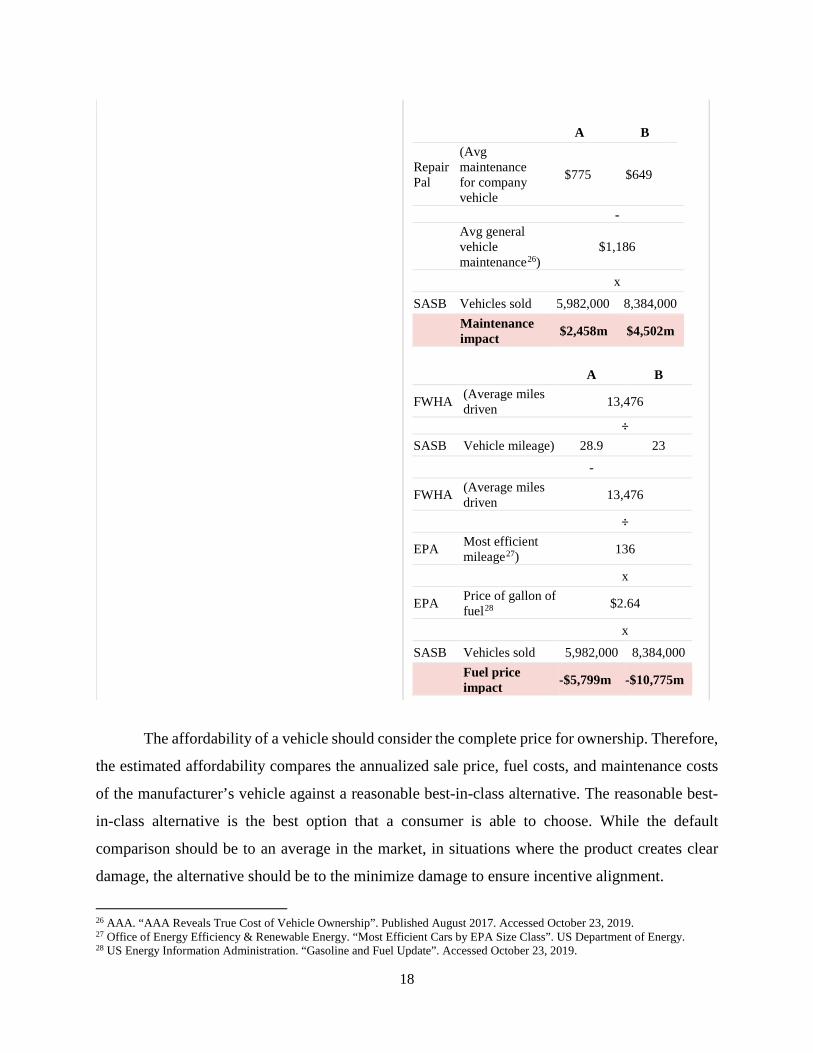
The affordability of a vehicle should consider the complete price for ownership. Therefore,
the estimated affordability compares the annualized sale price, fuel costs, and maintenance costs
of the manufacturer’s vehicle against a reasonable best-in-class alternative. The reasonable best-
in-class alternative is the best option that a consumer is able to choose. While the default
comparison should be to an average in the market, in situations where the product creates clear
damage, the alternative should be to the minimize damage to ensure incentive alignment.
26 AAA. “AAA Reveals True Cost of Vehicle Ownership”. Published August 2017. Accessed October 23, 2019. 27 Office of Energy Efficiency & Renewable Energy. “Most Efficient Cars by EPA Size Class”. US Department of Energy. 28 US Energy Information Administration. “Gasoline and Fuel Update”. Accessed October 23, 2019.
19
Vehicle price impact
In comparing the vehicle price to determine affordability, the sales price is divided by the
average product life to estimate an annualized sales price difference that should be recognized until
end of product life. The average product life is a key factor in determining affordability because
even though a certain car might have a very low sales price, it could also have an extremely short
product life and require more frequent car purchases. Furthermore, this recognition timing matches
the common mode of payment for vehicles through long-term leases.
Maintenance impact
Another component for affordability is the cost of maintaining the vehicle given different
vehicles can vary in their durability and maintenance needs. This estimate is dependent on initial
industry assumptions around the average annual maintenance cost for vehicles. These estimates
can be challenged and refined with industry input to improve accuracy.
Fuel price impact
In this example, the average fuel economy across all car types is compared to the best in
class car for fuel efficiency, a Hyundai Iconic EV. The comparison is reasonable given the Iconic
EV has a lower sales price than the average vehicle price for both companies. The comparison is
also limited to vehicles rather than other modes of transportation given the first-order principle to
ensure there is not an intractable comparison.
In practice, a manufacturer with more detailed fuel economy data could make the
comparison by car type rather than across car type. For example, the companies could compare
their EVs to the Hyundai Iconic EV and use the non-EV best-in-class fuel economy for their other
vehicles.
Even with manufacturer data, these estimates are reliant on industry-wide assumptions
around fuel price and average miles driven in a year. Industry input is therefore crucial in refining
these assumptions to improve accuracy and ensure alignment over time.
20
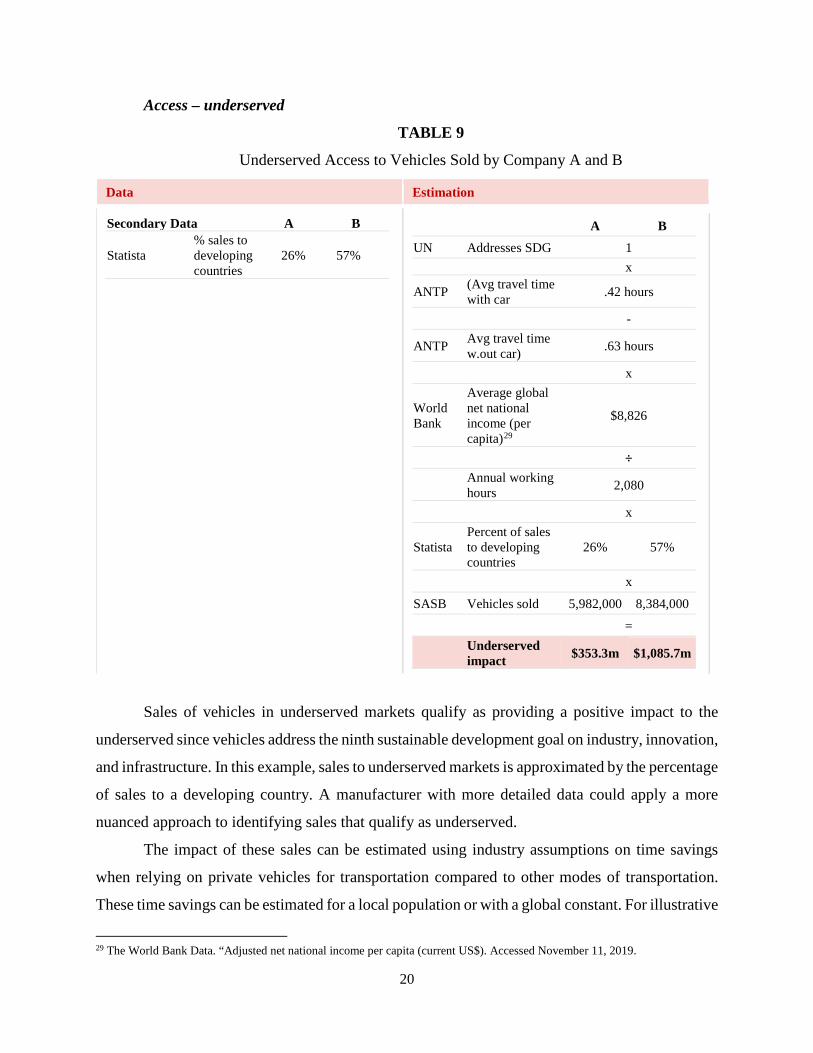
Access – underserved
TABLE 9
Underserved Access to Vehicles Sold by Company A and B
Data Estimation
Secondary Data A B
Statista % sales to developing countries
26% 57%
A B UN Addresses SDG 1 x
ANTP (Avg travel time with car .42 hours
-
ANTP Avg travel time w.out car) .63 hours
x
World Bank
Average global net national income (per capita)29
$8,826
÷
Annual working hours 2,080
x
Statista Percent of sales to developing countries
26% 57%
x
SASB Vehicles sold 5,982,000 8,384,000 =
Underserved impact $353.3m $1,085.7m
Sales of vehicles in underserved markets qualify as providing a positive impact to the
underserved since vehicles address the ninth sustainable development goal on industry, innovation,
and infrastructure. In this example, sales to underserved markets is approximated by the percentage
of sales to a developing country. A manufacturer with more detailed data could apply a more
nuanced approach to identifying sales that qualify as underserved.
The impact of these sales can be estimated using industry assumptions on time savings
when relying on private vehicles for transportation compared to other modes of transportation.
These time savings can be estimated for a local population or with a global constant. For illustrative
29 The World Bank Data. “Adjusted net national income per capita (current US$). Accessed November 11, 2019.
21
purposes, this example relies on a global time savings constant. Again, this constant could be
refined through industry debate and recommendations.
To identify the monetary value of these time savings, the average global hourly wage is
applied. A global wage is preferred to a local wage to ensure perverse incentives are not created
for manufacturers to avoid countries with the lowest wages, and likely the most underserved.
Although the monetary value of time saved could have also been estimated using willingness to
pay for time, global wage is preferred given the willingness to pay for time varies by congestion
(free flow, slowed down, stop and start) and timeliness (early arrival, minimized lateness, reduced
mean travel time)30. As with the affordability impact, the underserved impact can be recognized
until end of product life.
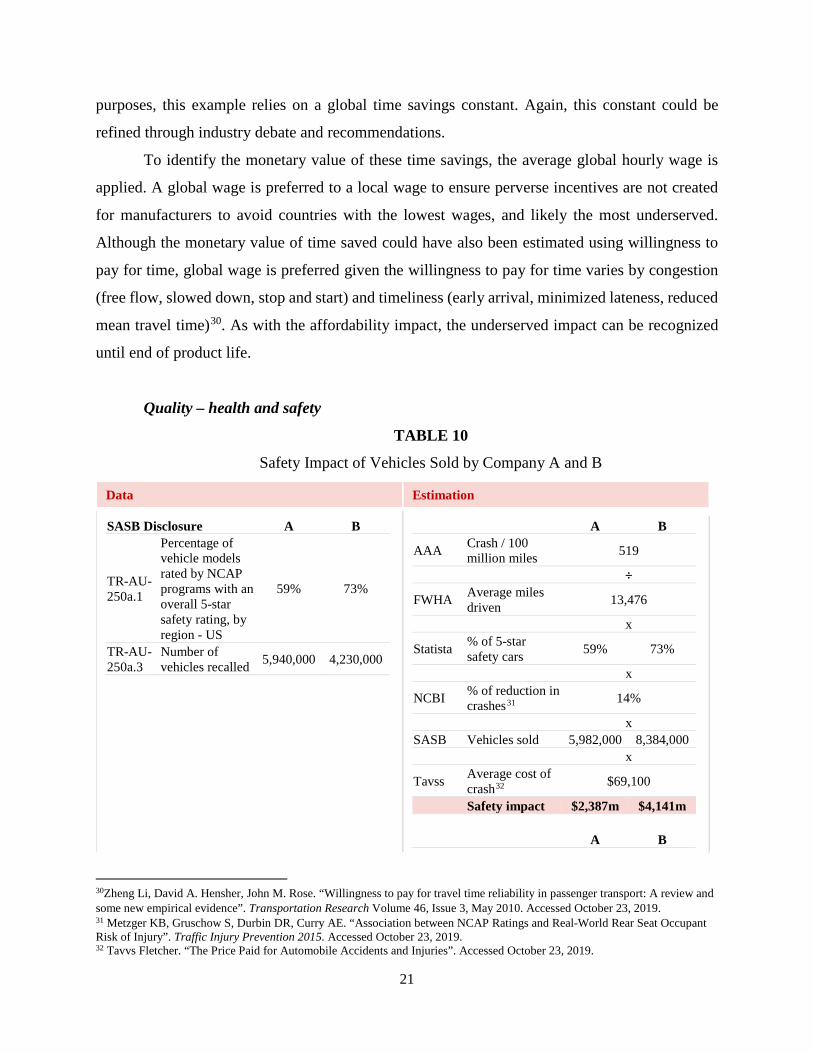
Quality – health and safety
TABLE 10
Safety Impact of Vehicles Sold by Company A and B
Data Estimation
SASB Disclosure A B
TR-AU-250a.1
Percentage of vehicle models rated by NCAP programs with an overall 5-star safety rating, by region - US
59% 73%
TR-AU-250a.3
Number of vehicles recalled 5,940,000 4,230,000
A B
AAA Crash / 100 million miles 519
÷
FWHA Average miles driven 13,476
x
Statista % of 5-star safety cars 59% 73%
x
NCBI % of reduction in crashes31 14%
x SASB Vehicles sold 5,982,000 8,384,000 x
Tavss Average cost of crash32 $69,100
Safety impact $2,387m $4,141m A B
30Zheng Li, David A. Hensher, John M. Rose. “Willingness to pay for travel time reliability in passenger transport: A review and some new empirical evidence”. Transportation Research Volume 46, Issue 3, May 2010. Accessed October 23, 2019. 31 Metzger KB, Gruschow S, Durbin DR, Curry AE. “Association between NCAP Ratings and Real-World Rear Seat Occupant Risk of Injury”. Traffic Injury Prevention 2015. Accessed October 23, 2019. 32 Tavvs Fletcher. “The Price Paid for Automobile Accidents and Injuries”. Accessed October 23, 2019.
22
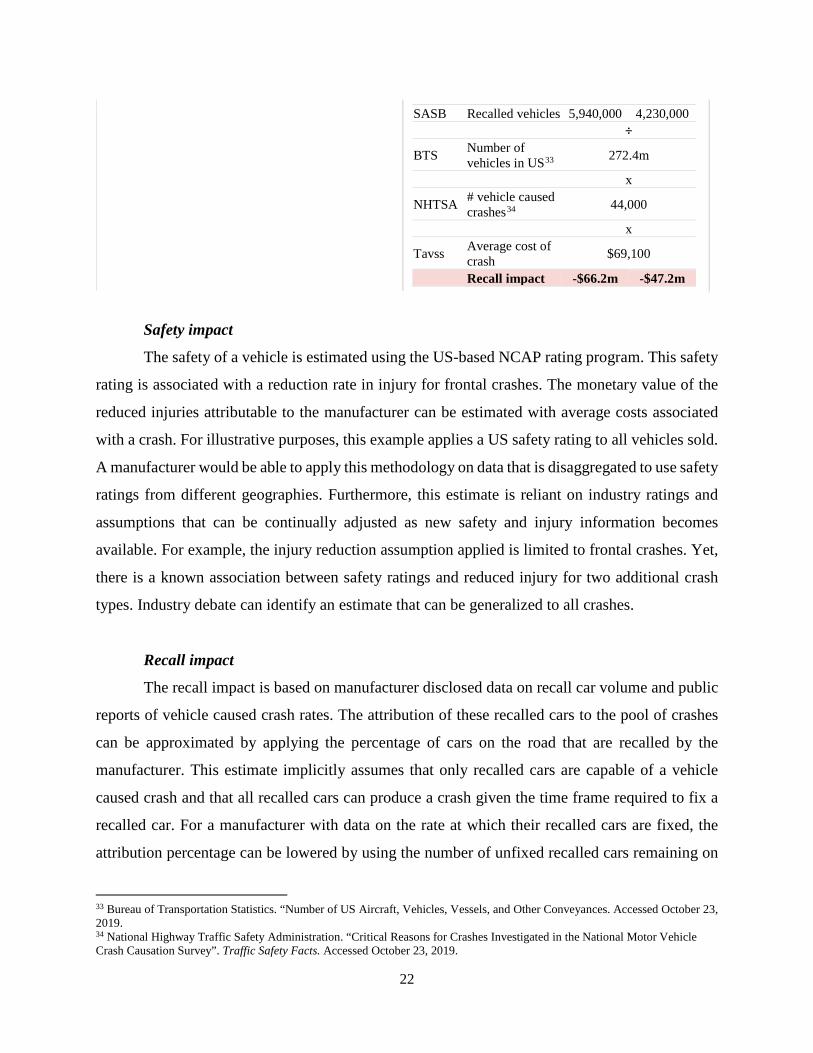
SASB Recalled vehicles 5,940,000 4,230,000 ÷
BTS Number of vehicles in US33 272.4m
x
NHTSA # vehicle caused crashes34 44,000
x
Tavss Average cost of crash $69,100
Recall impact -$66.2m -$47.2m
Safety impact
The safety of a vehicle is estimated using the US-based NCAP rating program. This safety
rating is associated with a reduction rate in injury for frontal crashes. The monetary value of the
reduced injuries attributable to the manufacturer can be estimated with average costs associated
with a crash. For illustrative purposes, this example applies a US safety rating to all vehicles sold.
A manufacturer would be able to apply this methodology on data that is disaggregated to use safety
ratings from different geographies. Furthermore, this estimate is reliant on industry ratings and
assumptions that can be continually adjusted as new safety and injury information becomes
available. For example, the injury reduction assumption applied is limited to frontal crashes. Yet,
there is a known association between safety ratings and reduced injury for two additional crash
types. Industry debate can identify an estimate that can be generalized to all crashes.
Recall impact
The recall impact is based on manufacturer disclosed data on recall car volume and public
reports of vehicle caused crash rates. The attribution of these recalled cars to the pool of crashes
can be approximated by applying the percentage of cars on the road that are recalled by the
manufacturer. This estimate implicitly assumes that only recalled cars are capable of a vehicle
caused crash and that all recalled cars can produce a crash given the time frame required to fix a
recalled car. For a manufacturer with data on the rate at which their recalled cars are fixed, the
attribution percentage can be lowered by using the number of unfixed recalled cars remaining on
33 Bureau of Transportation Statistics. “Number of US Aircraft, Vehicles, Vessels, and Other Conveyances. Accessed October 23, 2019. 34 National Highway Traffic Safety Administration. “Critical Reasons for Crashes Investigated in the National Motor Vehicle Crash Causation Survey”. Traffic Safety Facts. Accessed October 23, 2019.
23
the road rather than the total number of recalled cars. Given ongoing changes and advances in the
industry, it is possible to imagine a future in which extended warranties can also factor into the
health and safety impacts.
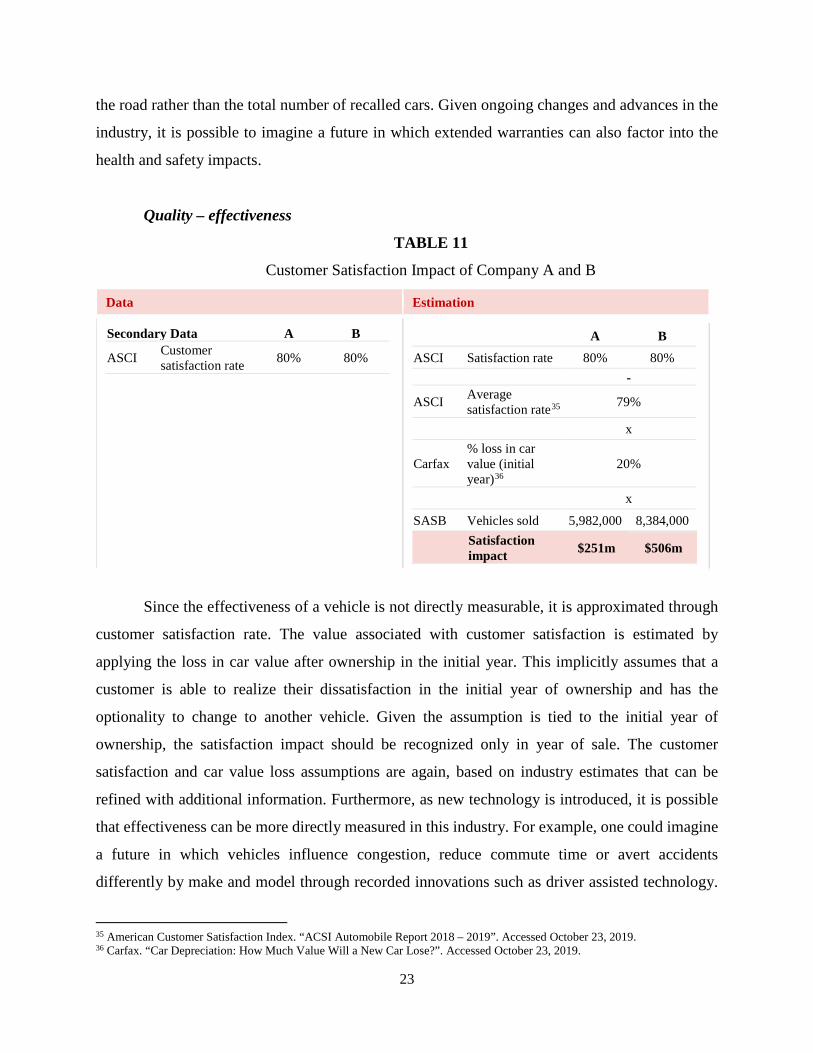
Quality – effectiveness
TABLE 11
Customer Satisfaction Impact of Company A and B
Data Estimation
Secondary Data A B
ASCI Customer satisfaction rate 80% 80%
A B ASCI Satisfaction rate 80% 80% -
ASCI Average satisfaction rate35 79%
x
Carfax % loss in car value (initial year)36
20%
x
SASB Vehicles sold 5,982,000 8,384,000
Satisfaction impact $251m $506m
Since the effectiveness of a vehicle is not directly measurable, it is approximated through
customer satisfaction rate. The value associated with customer satisfaction is estimated by
applying the loss in car value after ownership in the initial year. This implicitly assumes that a
customer is able to realize their dissatisfaction in the initial year of ownership and has the
optionality to change to another vehicle. Given the assumption is tied to the initial year of
ownership, the satisfaction impact should be recognized only in year of sale. The customer
satisfaction and car value loss assumptions are again, based on industry estimates that can be
refined with additional information. Furthermore, as new technology is introduced, it is possible
that effectiveness can be more directly measured in this industry. For example, one could imagine
a future in which vehicles influence congestion, reduce commute time or avert accidents
differently by make and model through recorded innovations such as driver assisted technology.
35 American Customer Satisfaction Index. “ACSI Automobile Report 2018 – 2019”. Accessed October 23, 2019. 36 Carfax. “Car Depreciation: How Much Value Will a New Car Lose?”. Accessed October 23, 2019.
24
These innovations would then reflect differences in the ability for different vehicles to effectively
transport the user.
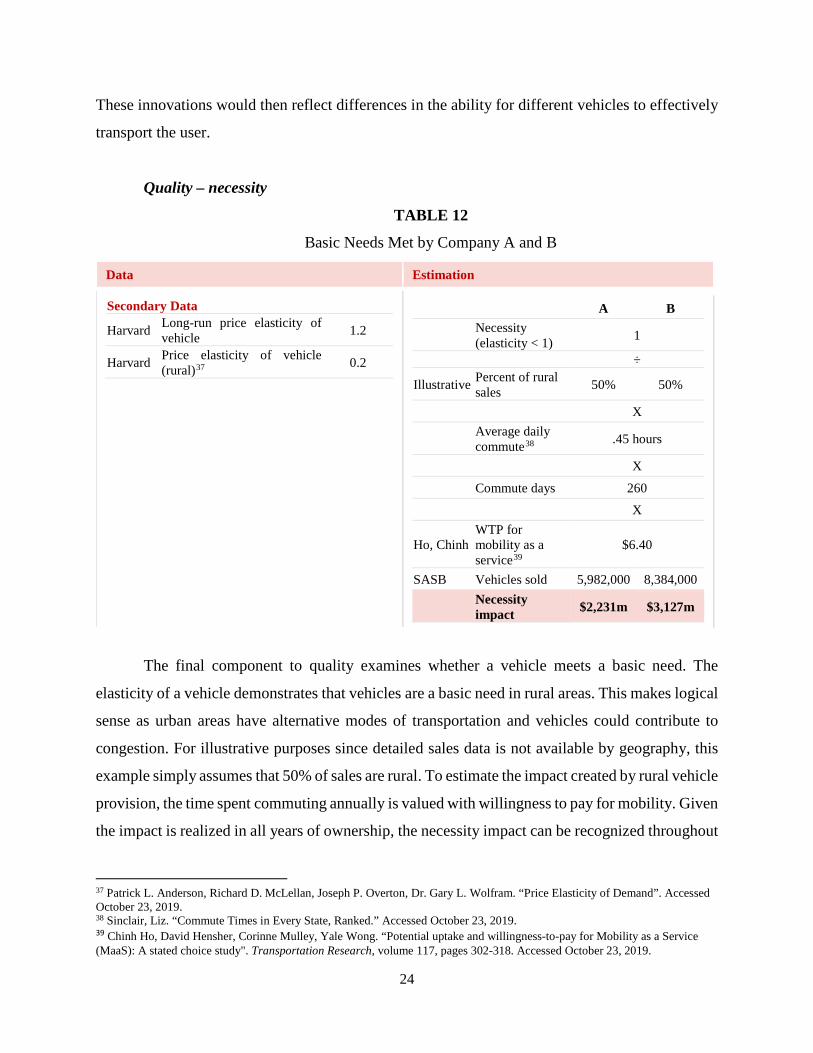
Quality – necessity
TABLE 12
Basic Needs Met by Company A and B
Data Estimation
Secondary Data
Harvard Long-run price elasticity of vehicle 1.2
Harvard Price elasticity of vehicle (rural)37 0.2
A B
Necessity (elasticity < 1) 1
÷
Illustrative Percent of rural sales 50% 50%
X
Average daily commute38 .45 hours
X Commute days 260 X
Ho, Chinh WTP for mobility as a service39
$6.40
SASB Vehicles sold 5,982,000 8,384,000
Necessity impact $2,231m $3,127m
The final component to quality examines whether a vehicle meets a basic need. The
elasticity of a vehicle demonstrates that vehicles are a basic need in rural areas. This makes logical
sense as urban areas have alternative modes of transportation and vehicles could contribute to
congestion. For illustrative purposes since detailed sales data is not available by geography, this
example simply assumes that 50% of sales are rural. To estimate the impact created by rural vehicle
provision, the time spent commuting annually is valued with willingness to pay for mobility. Given
the impact is realized in all years of ownership, the necessity impact can be recognized throughout
37 Patrick L. Anderson, Richard D. McLellan, Joseph P. Overton, Dr. Gary L. Wolfram. “Price Elasticity of Demand”. Accessed October 23, 2019. 38 Sinclair, Liz. “Commute Times in Every State, Ranked.” Accessed October 23, 2019. 39 Chinh Ho, David Hensher, Corinne Mulley, Yale Wong. “Potential uptake and willingness-to-pay for Mobility as a Service (MaaS): A stated choice study". Transportation Research, volume 117, pages 302-318. Accessed October 23, 2019.
25
the expected product life. In practice, the manufacturer could apply the actual percentage of non-
urban sales and industry input could identify precise estimates on the value of mobility.
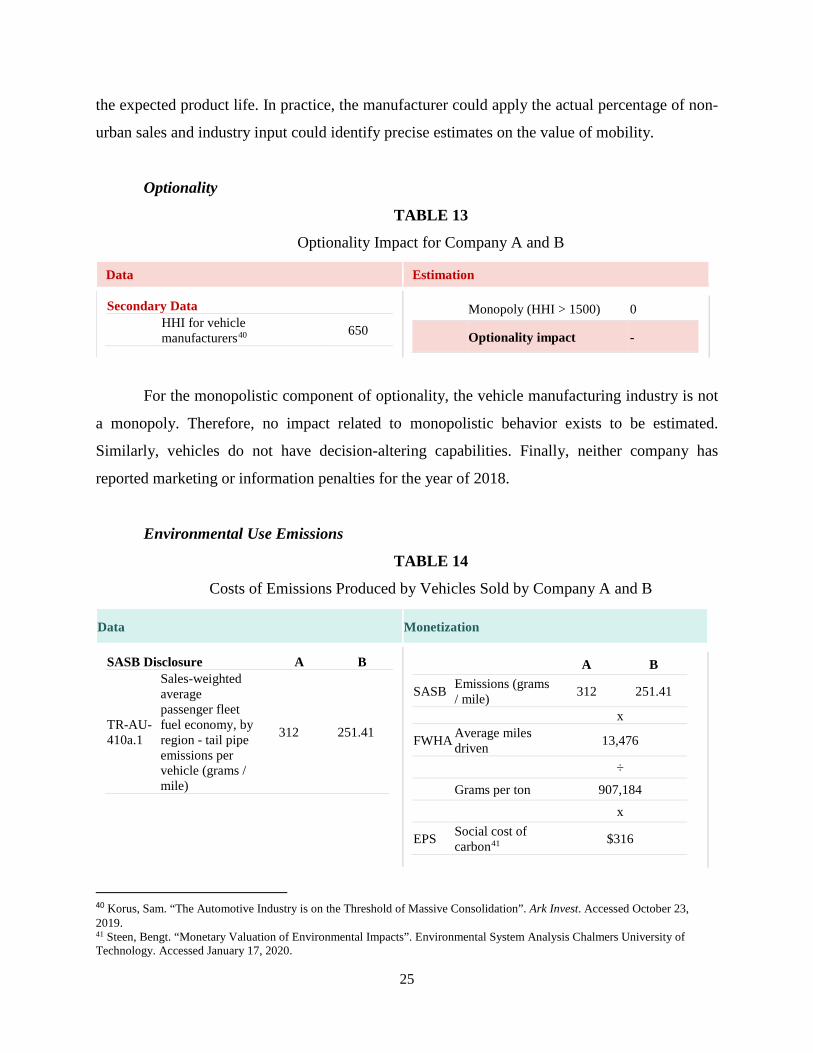
Optionality
TABLE 13
Optionality Impact for Company A and B
Data Estimation
Secondary Data HHI for vehicle
manufacturers40 650
Monopoly (HHI > 1500) 0
Optionality impact -
For the monopolistic component of optionality, the vehicle manufacturing industry is not
a monopoly. Therefore, no impact related to monopolistic behavior exists to be estimated.
Similarly, vehicles do not have decision-altering capabilities. Finally, neither company has
reported marketing or information penalties for the year of 2018.
Environmental Use Emissions
TABLE 14
Costs of Emissions Produced by Vehicles Sold by Company A and B
40 Korus, Sam. “The Automotive Industry is on the Threshold of Massive Consolidation”. Ark Invest. Accessed October 23, 2019. 41 Steen, Bengt. “Monetary Valuation of Environmental Impacts”. Environmental System Analysis Chalmers University of Technology. Accessed January 17, 2020.
Data Monetization
SASB Disclosure A B
TR-AU-410a.1
Sales-weighted average passenger fleet fuel economy, by region - tail pipe emissions per vehicle (grams / mile)
312 251.41
A B
SASB Emissions (grams / mile) 312 251.41
x
FWHA Average miles driven 13,476
÷ Grams per ton 907,184 x
EPS Social cost of carbon41 $316
26
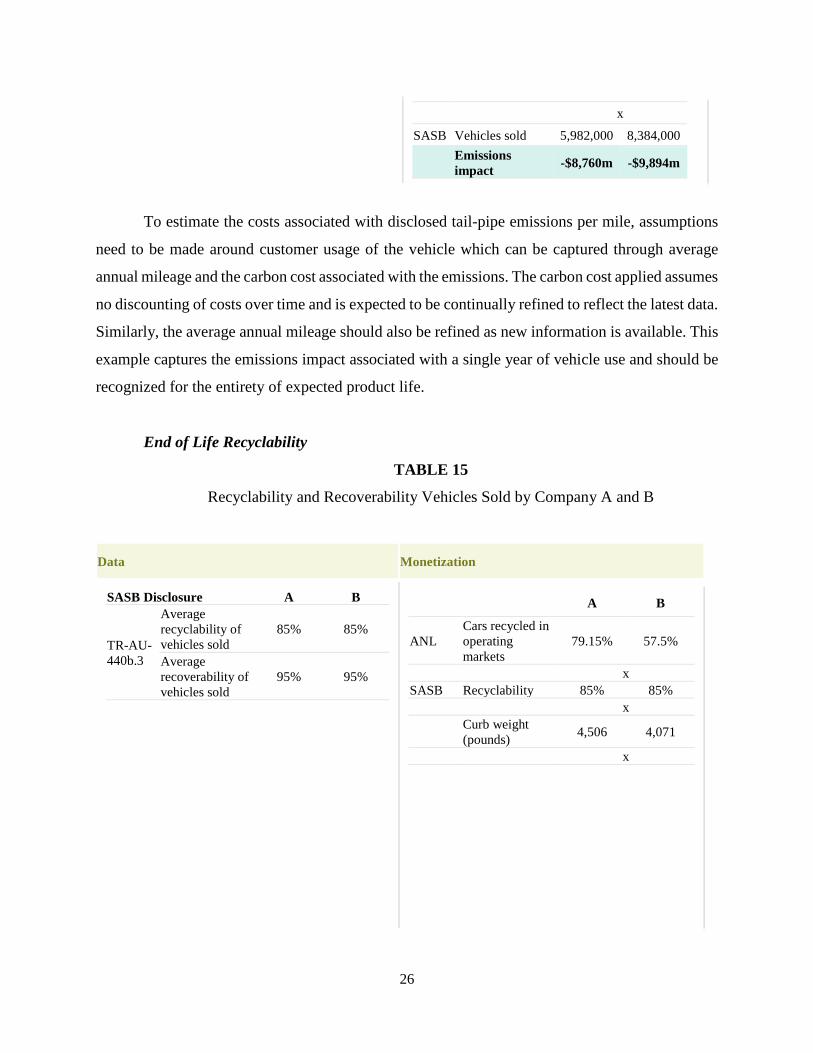
To estimate the costs associated with disclosed tail-pipe emissions per mile, assumptions
need to be made around customer usage of the vehicle which can be captured through average
annual mileage and the carbon cost associated with the emissions. The carbon cost applied assumes
no discounting of costs over time and is expected to be continually refined to reflect the latest data.
Similarly, the average annual mileage should also be refined as new information is available. This
example captures the emissions impact associated with a single year of vehicle use and should be
recognized for the entirety of expected product life.
End of Life Recyclability
TABLE 15
Recyclability and Recoverability Vehicles Sold by Company A and B
Data Monetization
SASB Disclosure A B
TR-AU-440b.3
Average recyclability of vehicles sold
85% 85%
Average recoverability of vehicles sold
95% 95%
A B
ANL Cars recycled in operating markets
79.15% 57.5%
x SASB Recyclability 85% 85% x Curb weight
(pounds) 4,506 4,071 x
x
SASB Vehicles sold 5,982,000 8,384,000
Emissions impact -$8,760m -$9,894m
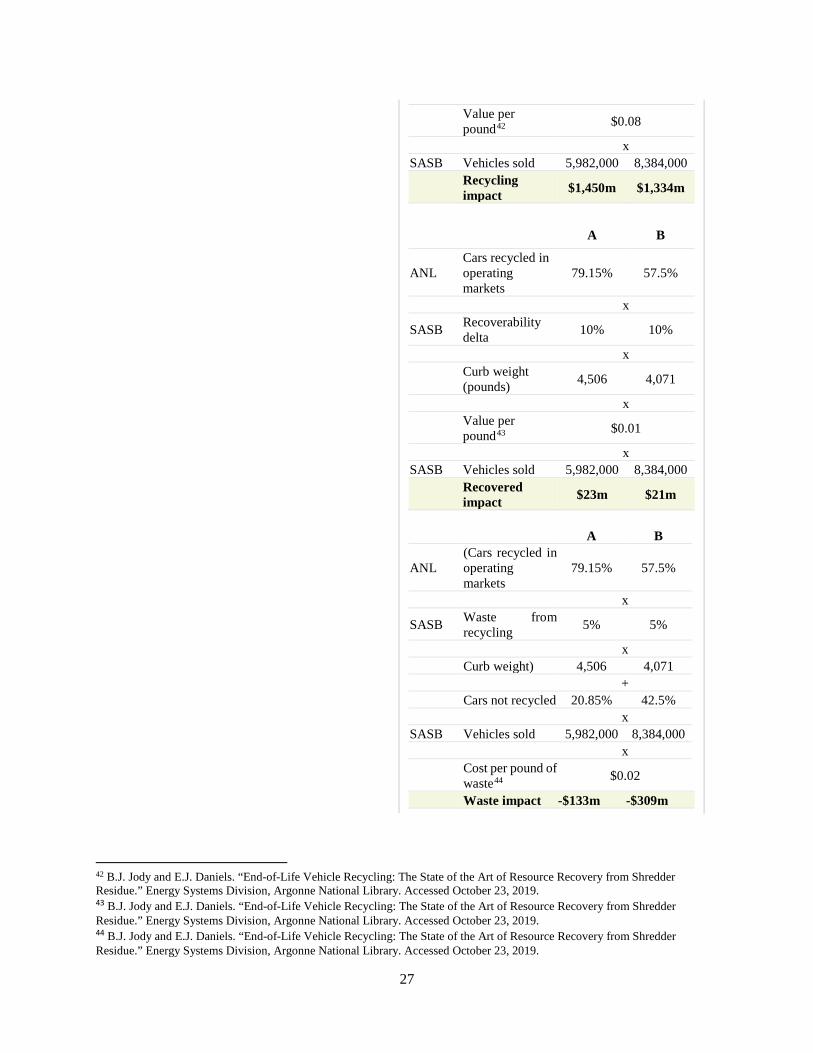
27
Value per pound42 $0.08
x SASB Vehicles sold 5,982,000 8,384,000 Recycling
impact $1,450m $1,334m
A B
ANL Cars recycled in operating markets
79.15% 57.5%
x
SASB Recoverability delta 10% 10%
x Curb weight
(pounds) 4,506 4,071 x Value per
pound43 $0.01 x SASB Vehicles sold 5,982,000 8,384,000 Recovered
impact $23m $21m
A B
ANL (Cars recycled in operating markets
79.15% 57.5%
x
SASB Waste from recycling 5% 5%
x Curb weight) 4,506 4,071 + Cars not recycled 20.85% 42.5% x SASB Vehicles sold 5,982,000 8,384,000 x Cost per pound of
waste44 $0.02 Waste impact -$133m -$309m
42 B.J. Jody and E.J. Daniels. “End-of-Life Vehicle Recycling: The State of the Art of Resource Recovery from Shredder Residue.” Energy Systems Division, Argonne National Library. Accessed October 23, 2019. 43 B.J. Jody and E.J. Daniels. “End-of-Life Vehicle Recycling: The State of the Art of Resource Recovery from Shredder Residue.” Energy Systems Division, Argonne National Library. Accessed October 23, 2019. 44 B.J. Jody and E.J. Daniels. “End-of-Life Vehicle Recycling: The State of the Art of Resource Recovery from Shredder Residue.” Energy Systems Division, Argonne National Library. Accessed October 23, 2019.
28
As is standard in the automobile manufacturing industry, both companies disclose the
recyclability and recoverability of vehicles sold. For illustrative purposes, average curb weight is
estimated from industry aggregate assumptions. In practice, a manufacturer could use actual curb
weight of sales. The assumptions around recycling rates and associated value of recycled,
recovered or wasted volume can be refined with additional information. Given the recycling and
recovering occurs at the end of product life, the associated impacts should be recognized at the
expected end of product life.
7. Select example applications of the product impact framework by dimension
Having documented the applicability of the framework in the context of two competitor
companies within an industry, in this section we focus on expanding the breadth of the applications
of the framework. Below we discuss the application of the framework using real data for
companies in the pharmaceutical, consumer packaged goods, and water utility industries.
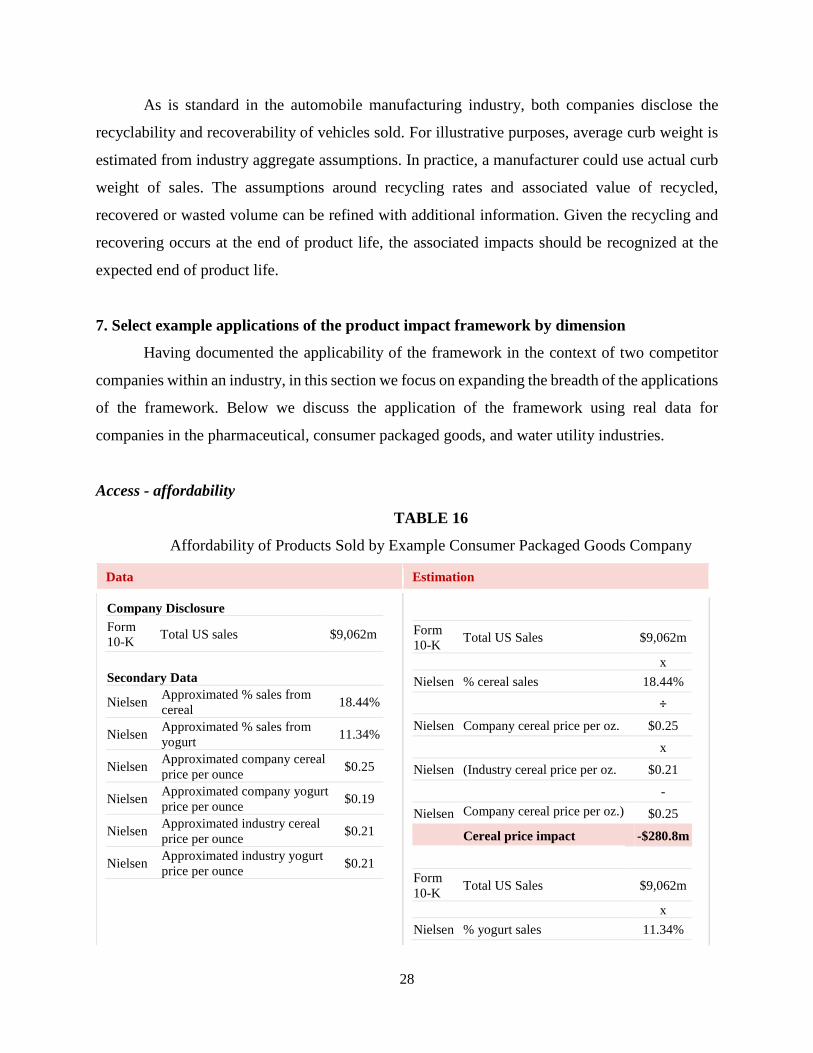
Access - affordability
TABLE 16
Affordability of Products Sold by Example Consumer Packaged Goods Company
Data Estimation
Company Disclosure Form 10-K Total US sales $9,062m
Secondary Data
Nielsen Approximated % sales from cereal 18.44%
Nielsen Approximated % sales from yogurt 11.34%
Nielsen Approximated company cereal price per ounce $0.25
Nielsen Approximated company yogurt price per ounce $0.19
Nielsen Approximated industry cereal price per ounce $0.21
Nielsen Approximated industry yogurt price per ounce $0.21
Form 10-K Total US Sales $9,062m x Nielsen % cereal sales 18.44% ÷ Nielsen Company cereal price per oz. $0.25 x
Nielsen (Industry cereal price per oz. $0.21 -
Nielsen Company cereal price per oz.) $0.25 Cereal price impact -$280.8m
Form 10-K Total US Sales $9,062m x Nielsen % yogurt sales 11.34%
29
÷ Nielsen Company yogurt price per oz. $0.19 x
Nielsen (Industry yogurt price per oz. $0.21 -
Nielsen Company yogurt price per oz.) $0.19 Yogurt price impact $88.9m
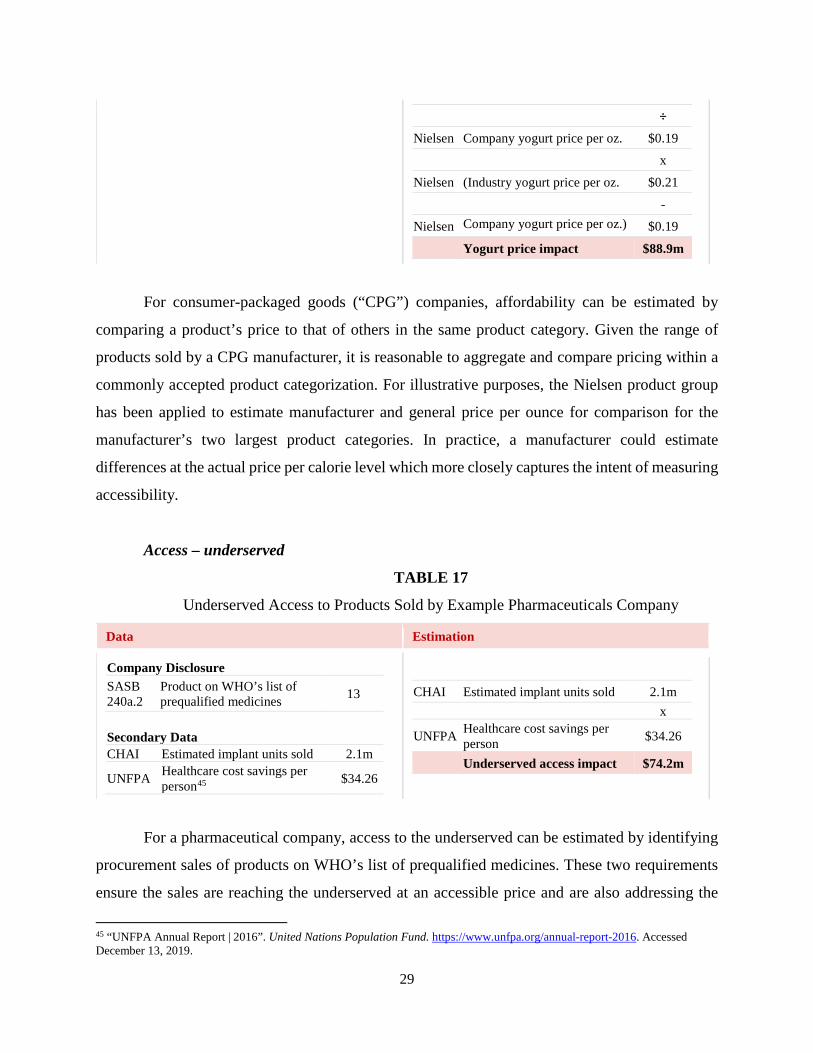
For consumer-packaged goods (“CPG”) companies, affordability can be estimated by
comparing a product’s price to that of others in the same product category. Given the range of
products sold by a CPG manufacturer, it is reasonable to aggregate and compare pricing within a
commonly accepted product categorization. For illustrative purposes, the Nielsen product group
has been applied to estimate manufacturer and general price per ounce for comparison for the
manufacturer’s two largest product categories. In practice, a manufacturer could estimate
differences at the actual price per calorie level which more closely captures the intent of measuring
accessibility.
Access – underserved
TABLE 17
Underserved Access to Products Sold by Example Pharmaceuticals Company
Data Estimation
Company Disclosure SASB 240a.2
Product on WHO’s list of prequalified medicines 13
Secondary Data CHAI Estimated implant units sold 2.1m
UNFPA Healthcare cost savings per person45 $34.26
CHAI Estimated implant units sold 2.1m x
UNFPA Healthcare cost savings per person $34.26
Underserved access impact $74.2m
For a pharmaceutical company, access to the underserved can be estimated by identifying
procurement sales of products on WHO’s list of prequalified medicines. These two requirements
ensure the sales are reaching the underserved at an accessible price and are also addressing the
45 “UNFPA Annual Report | 2016”. United Nations Population Fund. https://www.unfpa.org/annual-report-2016. Accessed December 13, 2019.
30
Sustainable Development Goal of good health and well-being. For illustrative purposes, this
example examines the impact from one of the company’s 13 qualified products. The impact of this
product is based on estimated procurement sales volume and an industry standard on the healthcare
cost savings from enabling family planning. In practice, a company could apply this methodology
to their entire suite of pre-qualified medicines and use actual procurement sales volume.
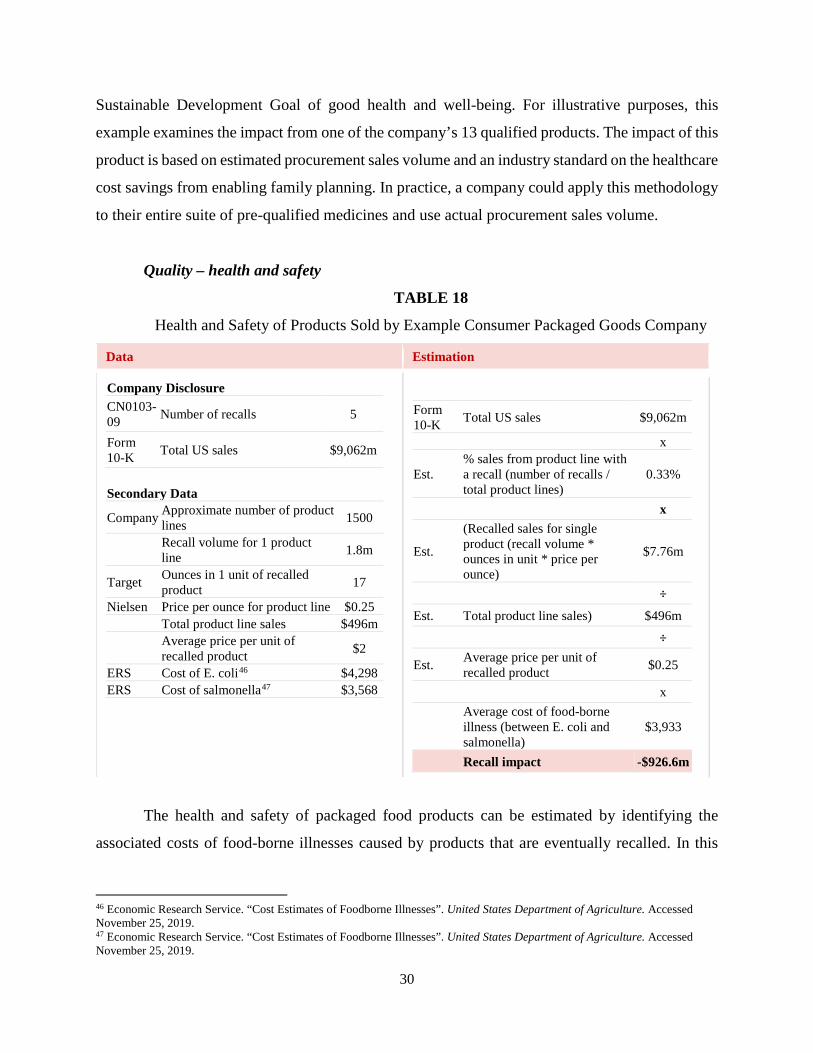
Quality – health and safety
TABLE 18
Health and Safety of Products Sold by Example Consumer Packaged Goods Company
Data Estimation
Company Disclosure CN0103-09 Number of recalls 5
Form 10-K Total US sales $9,062m
Secondary Data
Company Approximate number of product lines 1500
Recall volume for 1 product line 1.8m
Target Ounces in 1 unit of recalled product 17
Nielsen Price per ounce for product line $0.25 Total product line sales $496m
Average price per unit of recalled product $2
ERS Cost of E. coli46 $4,298 ERS Cost of salmonella47 $3,568
Form 10-K Total US sales $9,062m x
Est. % sales from product line with a recall (number of recalls / total product lines)
0.33%
x
Est.
(Recalled sales for single product (recall volume * ounces in unit * price per ounce)
$7.76m
÷ Est. Total product line sales) $496m ÷
Est. Average price per unit of recalled product $0.25
x
Average cost of food-borne illness (between E. coli and salmonella)
$3,933
Recall impact -$926.6m
The health and safety of packaged food products can be estimated by identifying the
associated costs of food-borne illnesses caused by products that are eventually recalled. In this
46 Economic Research Service. “Cost Estimates of Foodborne Illnesses”. United States Department of Agriculture. Accessed November 25, 2019. 47 Economic Research Service. “Cost Estimates of Foodborne Illnesses”. United States Department of Agriculture. Accessed November 25, 2019.
31
example, the recall volume is extrapolated from the number of recalled product lines, sales volume,
and standard recall volumes for a single product line. For illustrative purposes, it is assumed that
half of the recall volume causes E. coli and the other half causes salmonella. In practice, a company
would not need to estimate their recall volume but could report the actual recall volume and use
the relevant food-borne illness to identify associated costs.
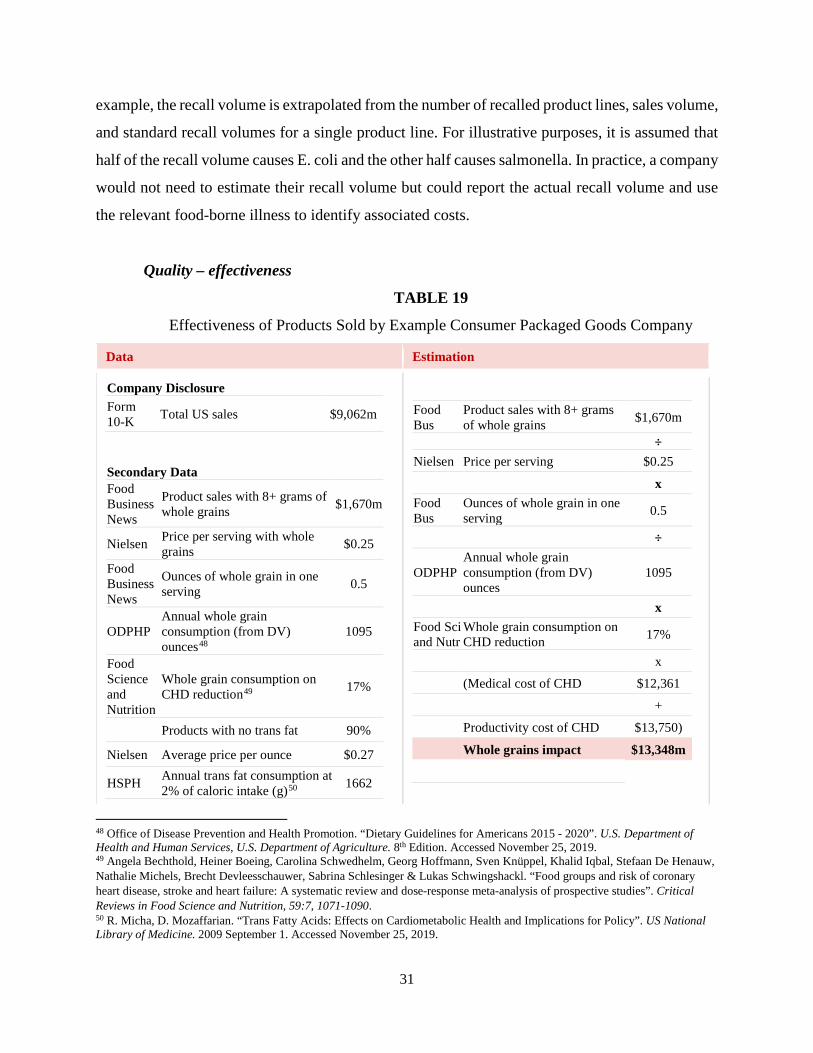
Quality – effectiveness
TABLE 19
Effectiveness of Products Sold by Example Consumer Packaged Goods Company
Data Estimation
Company Disclosure Form 10-K Total US sales $9,062m
Secondary Data Food Business News
Product sales with 8+ grams of whole grains $1,670m
Nielsen Price per serving with whole grains $0.25
Food Business News
Ounces of whole grain in one serving 0.5
ODPHP Annual whole grain consumption (from DV) ounces48
1095
Food Science and Nutrition
Whole grain consumption on CHD reduction49 17%
Products with no trans fat 90%
Nielsen Average price per ounce $0.27
HSPH Annual trans fat consumption at 2% of caloric intake (g)50 1662
Food Bus
Product sales with 8+ grams of whole grains $1,670m
÷ Nielsen Price per serving $0.25 x Food Bus
Ounces of whole grain in one serving 0.5
÷
ODPHP Annual whole grain consumption (from DV) ounces
1095
x Food Sci and Nutr
Whole grain consumption on CHD reduction 17%
x (Medical cost of CHD $12,361
+
Productivity cost of CHD $13,750) Whole grains impact $13,348m
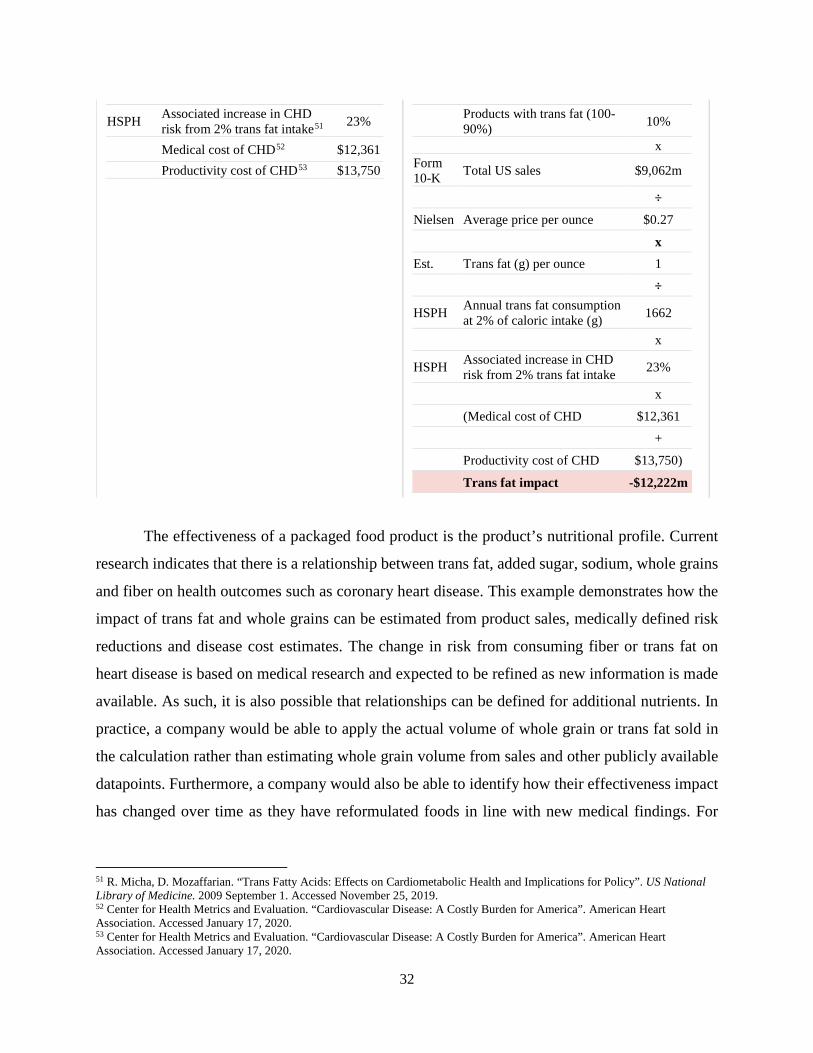
48 Office of Disease Prevention and Health Promotion. “Dietary Guidelines for Americans 2015 - 2020”. U.S. Department of Health and Human Services, U.S. Department of Agriculture. 8th Edition. Accessed November 25, 2019. 49 Angela Bechthold, Heiner Boeing, Carolina Schwedhelm, Georg Hoffmann, Sven Knüppel, Khalid Iqbal, Stefaan De Henauw, Nathalie Michels, Brecht Devleesschauwer, Sabrina Schlesinger & Lukas Schwingshackl. “Food groups and risk of coronary heart disease, stroke and heart failure: A systematic review and dose-response meta-analysis of prospective studies”. Critical Reviews in Food Science and Nutrition, 59:7, 1071-1090. 50 R. Micha, D. Mozaffarian. “Trans Fatty Acids: Effects on Cardiometabolic Health and Implications for Policy”. US National Library of Medicine. 2009 September 1. Accessed November 25, 2019.
32
HSPH Associated increase in CHD risk from 2% trans fat intake51 23%
Medical cost of CHD52 $12,361 Productivity cost of CHD53 $13,750
Products with trans fat (100-90%) 10%
x Form 10-K Total US sales $9,062m
÷ Nielsen Average price per ounce $0.27 x Est. Trans fat (g) per ounce 1 ÷
HSPH Annual trans fat consumption at 2% of caloric intake (g) 1662
x
HSPH Associated increase in CHD risk from 2% trans fat intake 23%
x
(Medical cost of CHD $12,361
+
Productivity cost of CHD $13,750) Trans fat impact -$12,222m
The effectiveness of a packaged food product is the product’s nutritional profile. Current
research indicates that there is a relationship between trans fat, added sugar, sodium, whole grains
and fiber on health outcomes such as coronary heart disease. This example demonstrates how the
impact of trans fat and whole grains can be estimated from product sales, medically defined risk
reductions and disease cost estimates. The change in risk from consuming fiber or trans fat on
heart disease is based on medical research and expected to be refined as new information is made
available. As such, it is also possible that relationships can be defined for additional nutrients. In
practice, a company would be able to apply the actual volume of whole grain or trans fat sold in
the calculation rather than estimating whole grain volume from sales and other publicly available
datapoints. Furthermore, a company would also be able to identify how their effectiveness impact
has changed over time as they have reformulated foods in line with new medical findings. For
51 R. Micha, D. Mozaffarian. “Trans Fatty Acids: Effects on Cardiometabolic Health and Implications for Policy”. US National Library of Medicine. 2009 September 1. Accessed November 25, 2019. 52 Center for Health Metrics and Evaluation. “Cardiovascular Disease: A Costly Burden for America”. American Heart Association. Accessed January 17, 2020. 53 Center for Health Metrics and Evaluation. “Cardiovascular Disease: A Costly Burden for America”. American Heart Association. Accessed January 17, 2020.
33
example, it is companies that have reduced the amount of trans fat in their products would see a
larger positive effectiveness impact year over year.
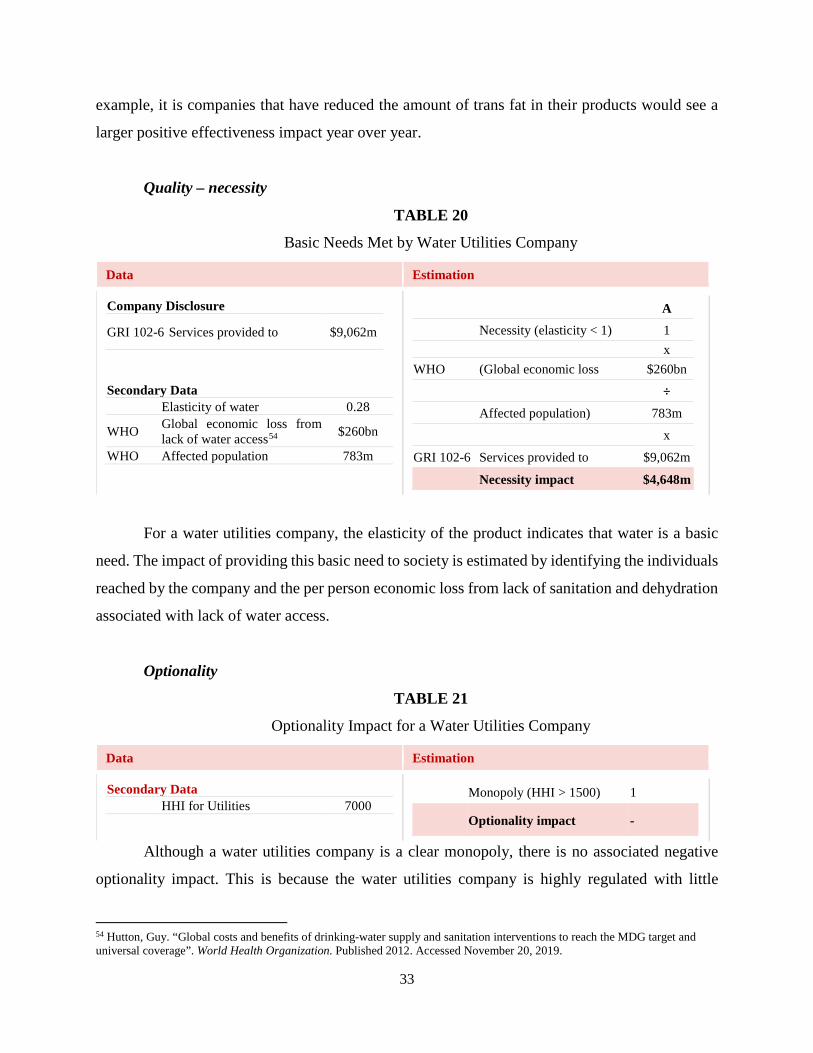
Quality – necessity
TABLE 20
Basic Needs Met by Water Utilities Company
Data Estimation
Company Disclosure
GRI 102-6 Services provided to $9,062m
Secondary Data Elasticity of water 0.28
WHO Global economic loss from lack of water access54 $260bn
WHO Affected population 783m
A Necessity (elasticity < 1) 1 x WHO (Global economic loss $260bn ÷ Affected population) 783m x
GRI 102-6 Services provided to $9,062m Necessity impact $4,648m
For a water utilities company, the elasticity of the product indicates that water is a basic
need. The impact of providing this basic need to society is estimated by identifying the individuals
reached by the company and the per person economic loss from lack of sanitation and dehydration
associated with lack of water access.
Optionality
TABLE 21
Optionality Impact for a Water Utilities Company
Data Estimation
Secondary Data HHI for Utilities 7000
Monopoly (HHI > 1500) 1
Optionality impact -
Although a water utilities company is a clear monopoly, there is no associated negative
optionality impact. This is because the water utilities company is highly regulated with little
54 Hutton, Guy. “Global costs and benefits of drinking-water supply and sanitation interventions to reach the MDG target and universal coverage”. World Health Organization. Published 2012. Accessed November 20, 2019.
34
opportunity to set price (in the absence of cronyism). Because the price setting prevents the
company from extracting high rents from their customers, the optionality impact from monopoly
is not relevant in this case.
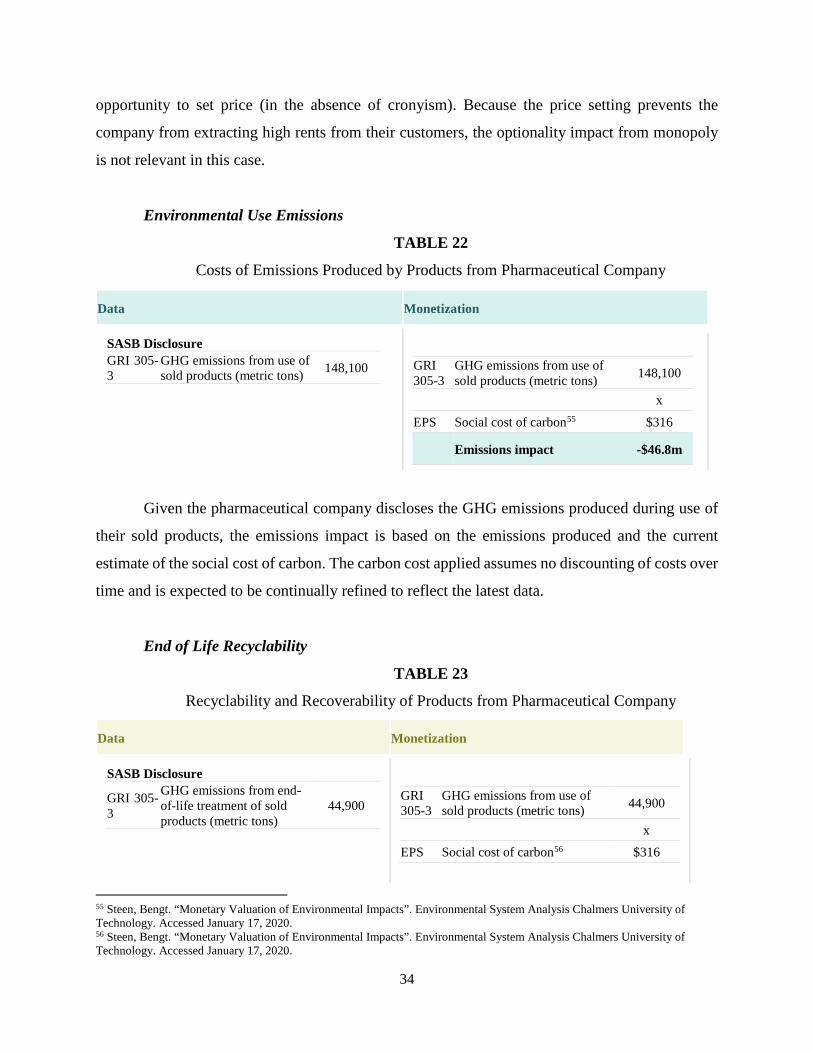
Environmental Use Emissions
TABLE 22
Costs of Emissions Produced by Products from Pharmaceutical Company
Given the pharmaceutical company discloses the GHG emissions produced during use of
their sold products, the emissions impact is based on the emissions produced and the current
estimate of the social cost of carbon. The carbon cost applied assumes no discounting of costs over
time and is expected to be continually refined to reflect the latest data.
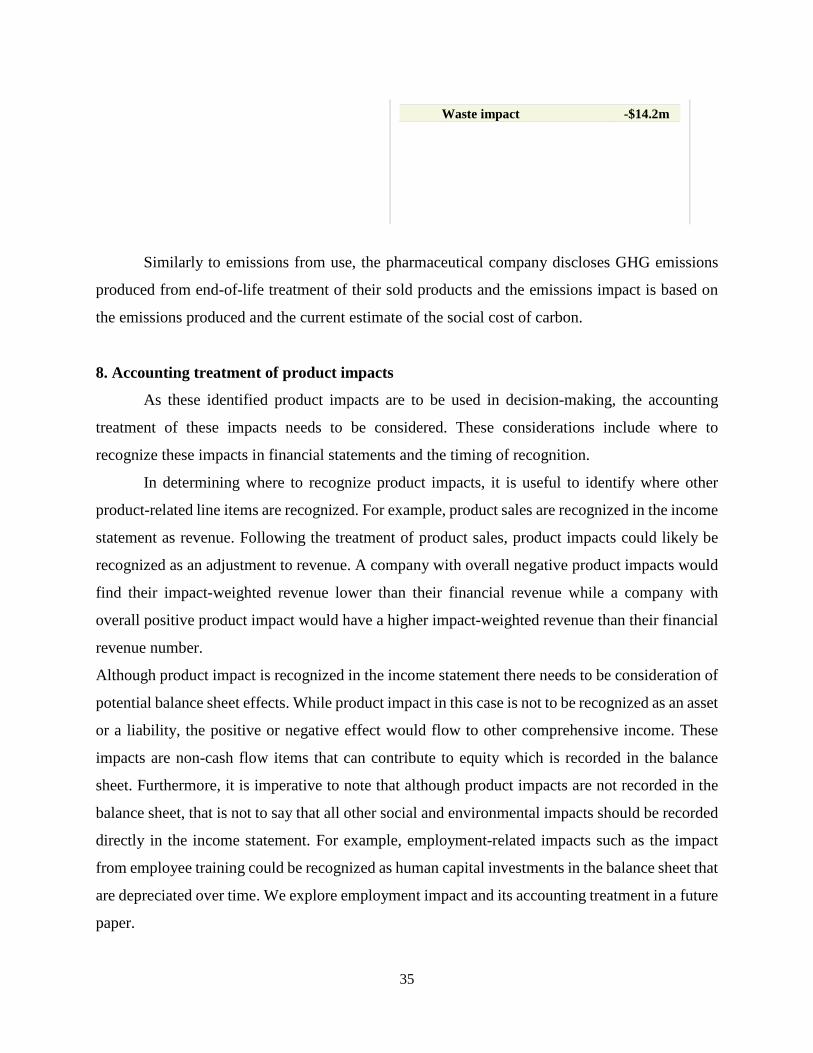
End of Life Recyclability
TABLE 23
Recyclability and Recoverability of Products from Pharmaceutical Company
Data Monetization
SASB Disclosure
GRI 305-3
GHG emissions from end-of-life treatment of sold products (metric tons)
44,900
GRI 305-3
GHG emissions from use of sold products (metric tons) 44,900
x EPS Social cost of carbon56 $316
55 Steen, Bengt. “Monetary Valuation of Environmental Impacts”. Environmental System Analysis Chalmers University of Technology. Accessed January 17, 2020. 56 Steen, Bengt. “Monetary Valuation of Environmental Impacts”. Environmental System Analysis Chalmers University of Technology. Accessed January 17, 2020.
Data Monetization
SASB Disclosure GRI 305-3
GHG emissions from use of sold products (metric tons) 148,100
GRI 305-3
GHG emissions from use of sold products (metric tons) 148,100
x
EPS Social cost of carbon55 $316 Emissions impact -$46.8m
35
Waste impact -$14.2m
Similarly to emissions from use, the pharmaceutical company discloses GHG emissions
produced from end-of-life treatment of their sold products and the emissions impact is based on
the emissions produced and the current estimate of the social cost of carbon.
8. Accounting treatment of product impacts
As these identified product impacts are to be used in decision-making, the accounting
treatment of these impacts needs to be considered. These considerations include where to
recognize these impacts in financial statements and the timing of recognition.
In determining where to recognize product impacts, it is useful to identify where other
product-related line items are recognized. For example, product sales are recognized in the income
statement as revenue. Following the treatment of product sales, product impacts could likely be
recognized as an adjustment to revenue. A company with overall negative product impacts would
find their impact-weighted revenue lower than their financial revenue while a company with
overall positive product impact would have a higher impact-weighted revenue than their financial
revenue number.
Although product impact is recognized in the income statement there needs to be consideration of
potential balance sheet effects. While product impact in this case is not to be recognized as an asset
or a liability, the positive or negative effect would flow to other comprehensive income. These
impacts are non-cash flow items that can contribute to equity which is recorded in the balance
sheet. Furthermore, it is imperative to note that although product impacts are not recorded in the
balance sheet, that is not to say that all other social and environmental impacts should be recorded
directly in the income statement. For example, employment-related impacts such as the impact
from employee training could be recognized as human capital investments in the balance sheet that
are depreciated over time. We explore employment impact and its accounting treatment in a future
paper.
36
As the timing of impact recognition has been discussed above in the example automobile
manufacturer application, product impact could be recognized when the actions influencing impact
take place. This is preferable to recognizing impact at point of sale since the recognition should
not be forward looking. For an automobile manufacturer, the timing of recognition for the
dimensions of product impact can vary by when the action occurs. This is highlighted when one
examines emissions and recyclability. With emissions, the impact would be recognized for the
duration of expected product life since the vehicle is being used throughout product life and the
emission particulates are being emitted during that usage. This is preferable to recognizing
emissions impact at point of sale since the particulate emissions have not yet been created. On the
other hand, their recyclability impact would be recognized at end of product life since that is when
the vehicle is being recycled.
9. Value of impact-weighted financial statement analysis
This application of the product framework to the competing automobile manufacturers not
only indicates feasibility of estimating monetary product impacts, but also demonstrates the
potential value of impact-weighted financial statement analysis. As indicated in the application,
one potential analysis enabled is a comparability of the product impacts of different companies.
Within a single industry, one can identify differences in how the two companies approach different
product attributes such as vehicle emissions or vehicle safety. For example, our analysis suggests
that while one company has relatively better performance on the access dimension the other
company outperforms on quality. Analyzing each dimension allows for a deeper understanding of
the business strategies employed by each company. The company that outperforms on recyclability
is better positioned to compete in the circular economy while the company that provides more
access to products through lower maintenance costs and lower fuel expenses is better positioned
to compete in underserved markets.
Beyond identifying differences in approach, impact-weighted financial statement analysis
can also help investors identify companies that are well-positioned to create additional impact in
dimensions of interest. For example, although both Company A and Company B create vehicles
with the same recyclability and recoverability rates, the prevalence of recycling in the markets in
which both companies differ. Company A operates in markets where more cars are recycled.
Therefore, even if both companies were to make the same improvement to their vehicle’s
37
recyclability and recoverability, Company A is better positioned to create positive end of life
recyclability impacts in the future.
Moreover, as more data is available around monetary product impacts, one can analyze a
company’s performance within certain dimensions to identify valuable industry and company
specific insights. For example, our hypothesis is that disruptive companies would have particularly
positive impact on their access and quality dimensions even if they have not yet gained significant
reach. Incumbents that see their access and quality impacts becoming more negative over time,
even though their reach could stay similar, might be prime candidates for future disruption.
Furthermore, as more data becomes available across companies, we could start
understanding the complementarities and trade-offs between the impact dimensions. Are access
and quality negatively correlated? What is the relationship between environmental use and quality?
How do these relations differ across industries? Answering those questions would enable managers
to make better decisions as they seek to optimize across impact dimensions to improve their
impact-weighted accounting numbers.
As financial statement analysis today enables business insights beyond the reported values,
one can expect that impact-weighted financial statement analysis should also drive insights beyond
the numeric impact estimated.
10. Conclusion
Although interest in ESG measurement has grown significantly, the focus has largely been
around the impacts related to a company’s operations rather than those created through product
use. Product impact has been difficult to systematically measure given the idiosyncratic nature of
the impacts and the tendency to view products in broad categorizations of simply good and bad.
This idiosyncrasy is highlighted in the efforts of the few companies, investors, and disclosure
frameworks that identify product impact.
The creation of a product impact framework that captures a product’s reach, accessibility,
quality, optionality, environmental use emissions and end of life recyclability allows for a
systematic methodology that can be applied to different companies across a wide range of
industries. This enables transparency, comparability, and scalability within product impact
reporting. The identified standard dimensions on which product impact can be measured are rooted
in existing measurement efforts, allowing data that is publicly available to be leveraged.
38
To ensure applicability, determine feasibility, and identify nuances within each dimension
of product impact, the framework will be tested on company pairs within each GICS sector. A
sample application for a single vehicle manufacturer indicates that monetary estimates can be
derived for impacts within each dimension using publicly disclosed data and industry-wide
assumptions. The example highlights the need for ongoing discussion and refinement of industry-
accepted assumptions given new information and changes to industries and technology over time.
Input from industry is crucial for the framework to be widely applicable. The example also
demonstrates how general estimates of impacts can become more precise when applying internal
company data with more granularity within this framework.
The next set of working papers will examine applications of the framework across each
GICS sector with the first in the series focused on automobile manufacturers for consumer
discretionary, food products for consumer staples, water utilities for utilities, oil and gas for energy
and pharmaceuticals for healthcare.
Ultimately, the aspiration is to develop and provide a framework that enables more
informed decisions which account for the many impacts created by products.
Recommended