A pilot of the Jolly Phonics
programme in the teaching of
reading and writing of English in
Cameroon
ii
1 Contents
Tables and Figures............................................................................................................................................................ iv
Abbreviations .................................................................................................................................................................... 1
Acknowledgements ........................................................................................................................................................... 1
About Universal Learning Solutions .................................................................................................................................. 1
2 Introduction .............................................................................................................................................................. 2
2.1 Aims and objectives .......................................................................................................................................... 2
2.2 Overview of Jolly Phonics programme .............................................................................................................. 2
2.3 Overview of context .......................................................................................................................................... 2
3 Methodology ............................................................................................................................................................. 3
4 Results and discussion .............................................................................................................................................. 3
4.1 Profile of respondents....................................................................................................................................... 3
4.2 Summary of results ........................................................................................................................................... 5
4.2.1 Mean score at baseline ............................................................................................................................. 6
4.2.2 Mean score at end line & mean score change .......................................................................................... 7
4.2.3 Letter sounds ............................................................................................................................................ 8
4.2.4 Whole word reading ................................................................................................................................. 9
4.2.5 Sentence reading ...................................................................................................................................... 9
4.2.6 Dictation and word writing ..................................................................................................................... 10
4.2.7 Listening comprehension ........................................................................................................................ 10
4.3 Has the progress been for all students? ......................................................................................................... 11
4.3.1 Comparing contextual factors ................................................................................................................. 11
4.3.2 Poverty indicators ................................................................................................................................... 12
4.3.3 Languages at home: ................................................................................................................................ 13
4.4 Did all schools perform equally well? ............................................................................................................. 13
5 Consideration of other influencing factors ............................................................................................................. 14
5.1 Factors contributing to success of the pilot .................................................................................................... 14
5.2 Challenges experienced in the pilot ................................................................................................................ 14
6 Conclusions ............................................................................................................................................................. 15
7 Recommendations .................................................................................................................................................. 15
Appendices ...................................................................................................................................................................... 16
Appendix A: Contents of Jolly Phonics Starter Kit....................................................................................................... 16
Appendix B: Raw data ................................................................................................................................................. 17
Profile of respondents............................................................................................................................................. 17
iii
Raw score results .................................................................................................................................................... 18
Relative score results .............................................................................................................................................. 18
Controls Mean Score Change .................................................................................................................................. 19
Poverty indicators raw data .................................................................................................................................... 19
Appendix C: Raw data by school ................................................................................................................................. 20
iv
Tables and Figures
Table 1: Demographic profile of respondents .................................................................................................................. 3
Table 2: Mean relative scores ........................................................................................................................................... 6
Table 3: Individual schools relative improvement .......................................................................................................... 13
Figure 4.1: Use of English at home ................................................................................................................................... 4
Figure 4.2: Main language spoken at home ...................................................................................................................... 4
Figure 4.3: Previous education experience ....................................................................................................................... 5
Figure 4.4: Household ownership ..................................................................................................................................... 5
Figure 4.5 Literacy pre-test scores for each assessment .................................................................................................. 6
Figure 4.6 Literacy post-test scores for each assessment ................................................................................................ 7
Figure 4.7: Mean change (relative scores) for each literacy assessment ......................................................................... 7
Figure 4.8: Raw score change: letter sounds .................................................................................................................... 8
Figure 4.9: Raw score change: words read and reading age ............................................................................................ 9
Figure 4.10: Raw score change: sentence reading............................................................................................................ 9
Figure 4.11: Raw score change: Dictation/word writing ................................................................................................ 10
Figure 4.12 Raw score change: Listening comprehension .............................................................................................. 10
Figure 4.13 Comparing relative score improvement for contextual factors .................................................................. 11
Figure 4.14 Poverty indicators comparison .................................................................................................................... 12
Figure 4.15 Language spoken at home ........................................................................................................................... 13
1
Abbreviations ECD Early Childhood Development
EGRA Early Grade Reading Assessment
ULS Universal Learning Solutions
Acknowledgements We would like to thank the following organisations and individuals for their support and involvement in this project:
Ministry of Basic Education
University of Bamenda
Regional Delegation of Littoral
Elizabeth Nonweiler
Jolly Learning
About Universal Learning Solutions Universal Learning Solutions (ULS) is a not-for-profit organisation that works with government, educators, donors
and experts around the world to provide bespoke services that deliver innovative literacy solutions. Our work
enables and enthuses teachers to deliver high quality literacy tuition and builds the institutional capacity of partners
through knowledge and skills transfer. Our vision is of a world where all children can read and write with confidence
and enjoy their right to learn. Through this we believe we can help release a child’s infinite potential.
The approach of ULS is to combine the proven synthetic phonics literacy method with fun, contextually appropriate
tools that enable and enthuse teachers to deliver high quality literacy tuition. Through an exciting partnership with
the publishers of Jolly Phonics, the world’s leading synthetic phonics programme, ULS is able to provide adapted
teaching and learning materials, training and on-going support for teachers to allow all children to be able to read
and write. In Nigeria, Universal Learning Solutions have already trained over 19,000 teachers and 1,000 government
officials across in 19 states, and over 1.5 million Jolly Phonics pupil books have been distributed to government
school pupils. Universal Learning Solutions have also begun projects in government primary schools in Ghana, Sierra
Leone, Cameroon, Ethiopia, Kenya and Nepal.
2
2 Introduction
2.1 Aims and objectives The aim of this project was to pilot the Jolly Phonics programme in the teaching of reading and writing of English in
government primary schools in Cameroon and assess its impact on early grade reading outcomes.
Specifically, the objectives of the evaluation were to:
1. To determine if the synthetic phonics approach of teaching reading and writing of English, and specifically
the Jolly Phonics programme, leads to faster progress in the pupils’ reading and writing ability in English than
those pupils not taught using the programme.
2. To determine whether the Jolly Phonics programme is effective for all student groups (gender, ECD
experience and language spoken at home).
2.2 Overview of Jolly Phonics programme With Jolly Phonics the pupils are first taught the letter sounds of English (so the sounds of the letters, not their
names). They are then taught how to ʻblendʼ those sounds together to read words (so d-o-g makes ʻdogʼ). In this way
the spoken word ʻdogʼ is made, or ʻsynthesisedʼ (hence ʻsynthetic’ phonics). It gives children the ability to read out
new words for themselves. It also enables them to write words by segmenting the word into its sounds, and then
writing the letters for those sounds. Pupils are then taught “tricky words” that do not follow the sound system. The
letter sounds are taught alongside culturally appropriate stories, songs, and actions that make learning the sounds
both memorable and fun.
The Jolly Phonics programme has now been used for over 20 years and has been endorsed for use in all schools in
countries such as the Gambia and Trinidad and Tobago and recommended by the government in other countries,
such as the UK and Nigeria. It also used in government schools in countries as diverse as Ghana, Kenya, Uganda,
Nepal, India, Mexico, Seychelles, Philippines and Fiji.
2.3 Overview of context The Jolly Phonics programme was piloted in one Primary 1 class at 6 government primary schools in Douala. Douala
is part of the French speaking region of Littoral but the schools involved in the pilot were English medium schools.
The pilot was implemented in partnership with Regional Delegation of Littoral and the Ministry of Basic Education.
The Primary 1 teacher and headteacher from each of the Jolly Phonics schools received 3 days of training in the Jolly
Phonics programme in December 2014 from an expert Jolly Phonics trainer. The training was also attended by
representatives from the Regional Delegation of Littoral and the Ministry of Basic Education. Each school was given a
Jolly Phonics Starter Kit (see Appendix A for details of kit), with each teacher and headteacher having a copy of the
Jolly Phonics Teacher Book and each Primary 1 pupil the Jolly Phonics Pupil Books 1 and 2. The Primary 1 teachers
taught using the Jolly Phonics programme, on average four times a week between January 2015 and June 2015. A
representative from the University of Bamenda undertook a monitoring visit to each of the pilot schools in March
2015. During this monitoring visit they observed the teaching of Jolly Phonics and gave feedback, provided support
and mentoring to these teachers and identified any challenges and issues that needed to be addressed.
3
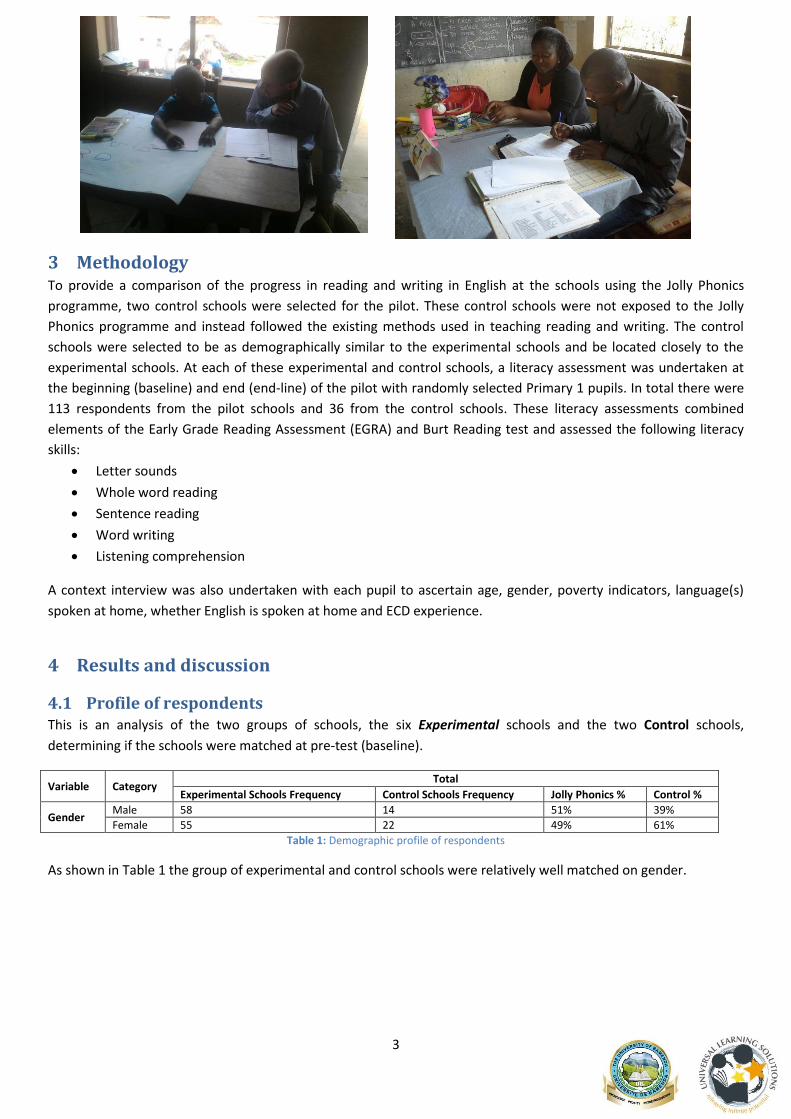
3 Methodology To provide a comparison of the progress in reading and writing in English at the schools using the Jolly Phonics
programme, two control schools were selected for the pilot. These control schools were not exposed to the Jolly
Phonics programme and instead followed the existing methods used in teaching reading and writing. The control
schools were selected to be as demographically similar to the experimental schools and be located closely to the
experimental schools. At each of these experimental and control schools, a literacy assessment was undertaken at
the beginning (baseline) and end (end-line) of the pilot with randomly selected Primary 1 pupils. In total there were
113 respondents from the pilot schools and 36 from the control schools. These literacy assessments combined
elements of the Early Grade Reading Assessment (EGRA) and Burt Reading test and assessed the following literacy
skills:
Letter sounds
Whole word reading
Sentence reading
Word writing
Listening comprehension
A context interview was also undertaken with each pupil to ascertain age, gender, poverty indicators, language(s)
spoken at home, whether English is spoken at home and ECD experience.
4 Results and discussion
4.1 Profile of respondents This is an analysis of the two groups of schools, the six Experimental schools and the two Control schools,
determining if the schools were matched at pre-test (baseline).
Variable Category Total
Experimental Schools Frequency Control Schools Frequency Jolly Phonics % Control %
Gender Male 58 14 51% 39%
Female 55 22 49% 61%
Table 1: Demographic profile of respondents
As shown in Table 1 the group of experimental and control schools were relatively well matched on gender.
4
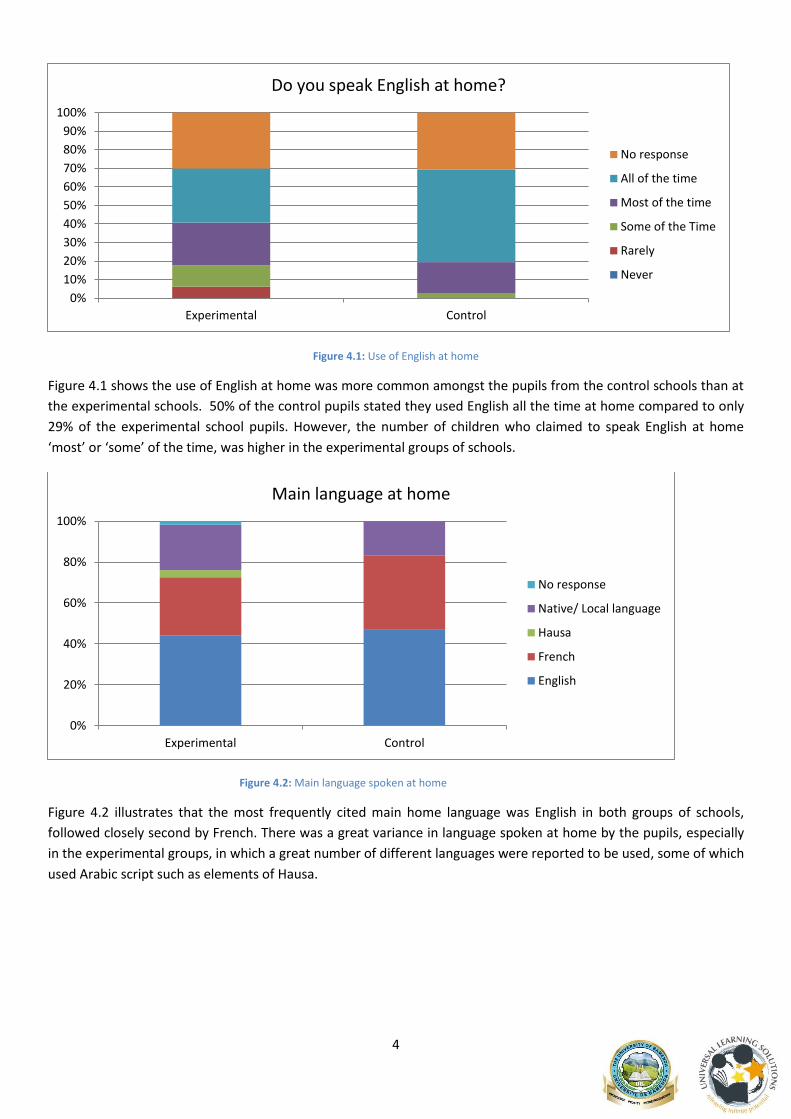
Figure 4.1: Use of English at home
Figure 4.1 shows the use of English at home was more common amongst the pupils from the control schools than at
the experimental schools. 50% of the control pupils stated they used English all the time at home compared to only
29% of the experimental school pupils. However, the number of children who claimed to speak English at home
‘most’ or ‘some’ of the time, was higher in the experimental groups of schools.
Figure 4.2: Main language spoken at home
Figure 4.2 illustrates that the most frequently cited main home language was English in both groups of schools,
followed closely second by French. There was a great variance in language spoken at home by the pupils, especially
in the experimental groups, in which a great number of different languages were reported to be used, some of which
used Arabic script such as elements of Hausa.
0%
10%
20%
30%
40%
50%
60%
70%
80%
90%
100%
Experimental Control
Do you speak English at home?
No response
All of the time
Most of the time
Some of the Time
Rarely
Never
0%
20%
40%
60%
80%
100%
Experimental Control
Main language at home
No response
Native/ Local language
Hausa
French
English
5
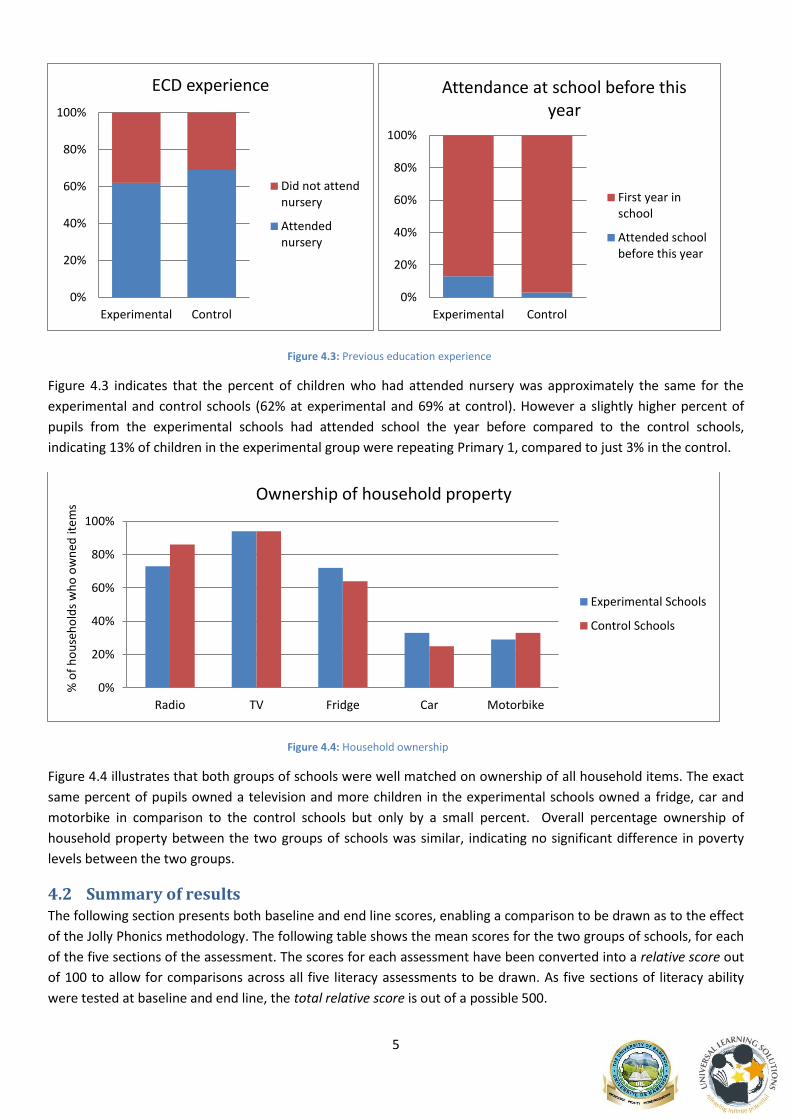
Figure 4.3: Previous education experience
Figure 4.3 indicates that the percent of children who had attended nursery was approximately the same for the
experimental and control schools (62% at experimental and 69% at control). However a slightly higher percent of
pupils from the experimental schools had attended school the year before compared to the control schools,
indicating 13% of children in the experimental group were repeating Primary 1, compared to just 3% in the control.
Figure 4.4: Household ownership
Figure 4.4 illustrates that both groups of schools were well matched on ownership of all household items. The exact
same percent of pupils owned a television and more children in the experimental schools owned a fridge, car and
motorbike in comparison to the control schools but only by a small percent. Overall percentage ownership of
household property between the two groups of schools was similar, indicating no significant difference in poverty
levels between the two groups.
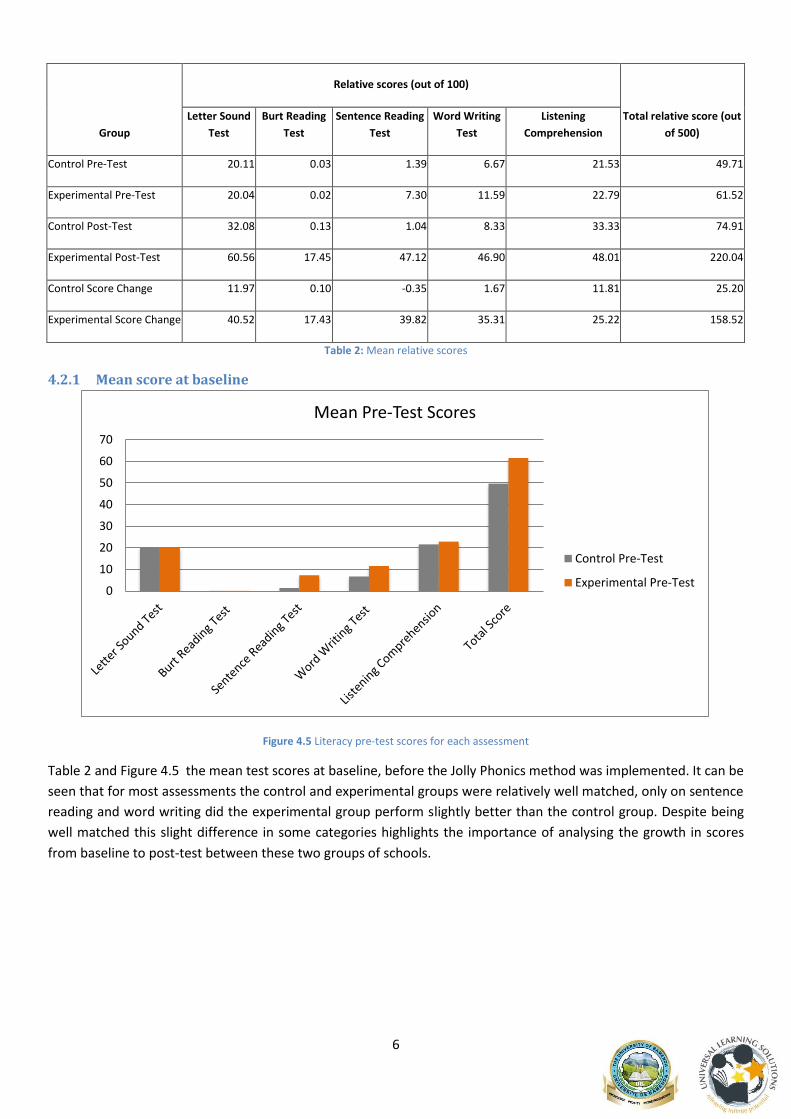
4.2 Summary of results The following section presents both baseline and end line scores, enabling a comparison to be drawn as to the effect
of the Jolly Phonics methodology. The following table shows the mean scores for the two groups of schools, for each
of the five sections of the assessment. The scores for each assessment have been converted into a relative score out
of 100 to allow for comparisons across all five literacy assessments to be drawn. As five sections of literacy ability
were tested at baseline and end line, the total relative score is out of a possible 500.
0%
20%
40%
60%
80%
100%
Experimental Control
ECD experience
Did not attendnursery
Attendednursery
0%
20%
40%
60%
80%
100%
Experimental Control
Attendance at school before this year
First year inschool
Attended schoolbefore this year
0%
20%
40%
60%
80%
100%
Radio TV Fridge Car Motorbike
% o
f h
ou
seh
old
s w
ho
ow
ned
item
s
Ownership of household property
Experimental Schools
Control Schools
6
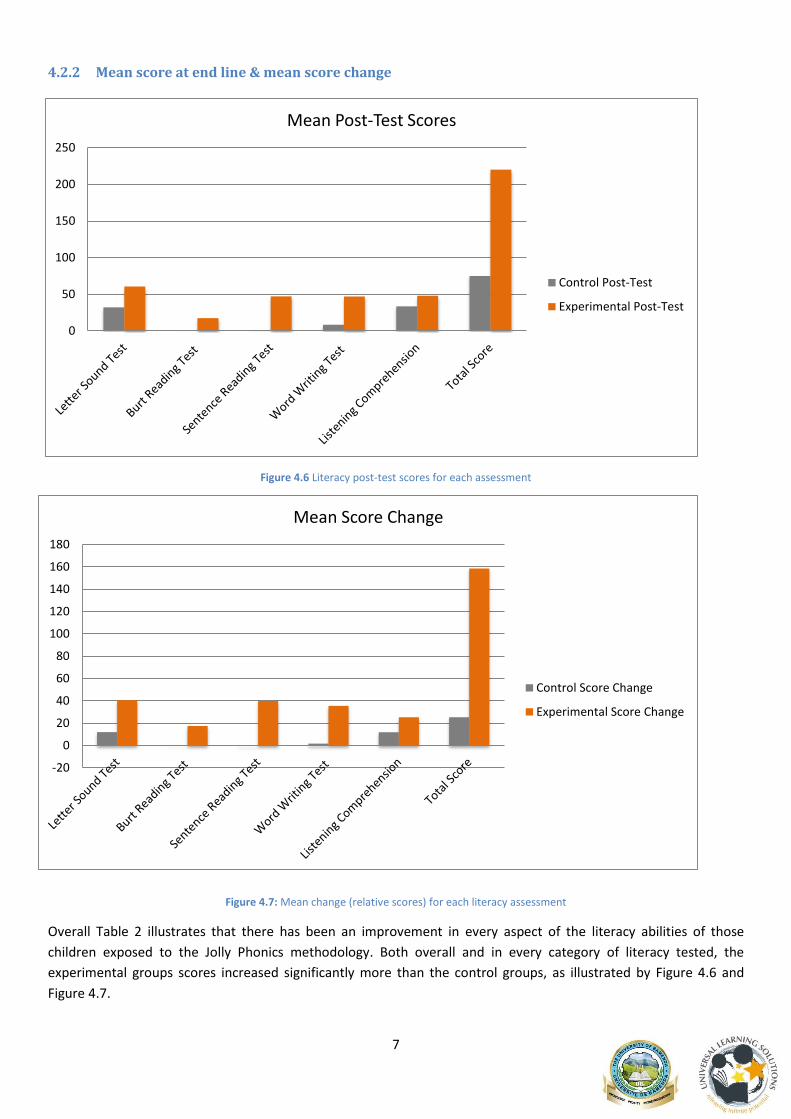
Group
Relative scores (out of 100)
Total relative score (out
of 500)
Letter Sound
Test
Burt Reading
Test
Sentence Reading
Test
Word Writing
Test
Listening
Comprehension
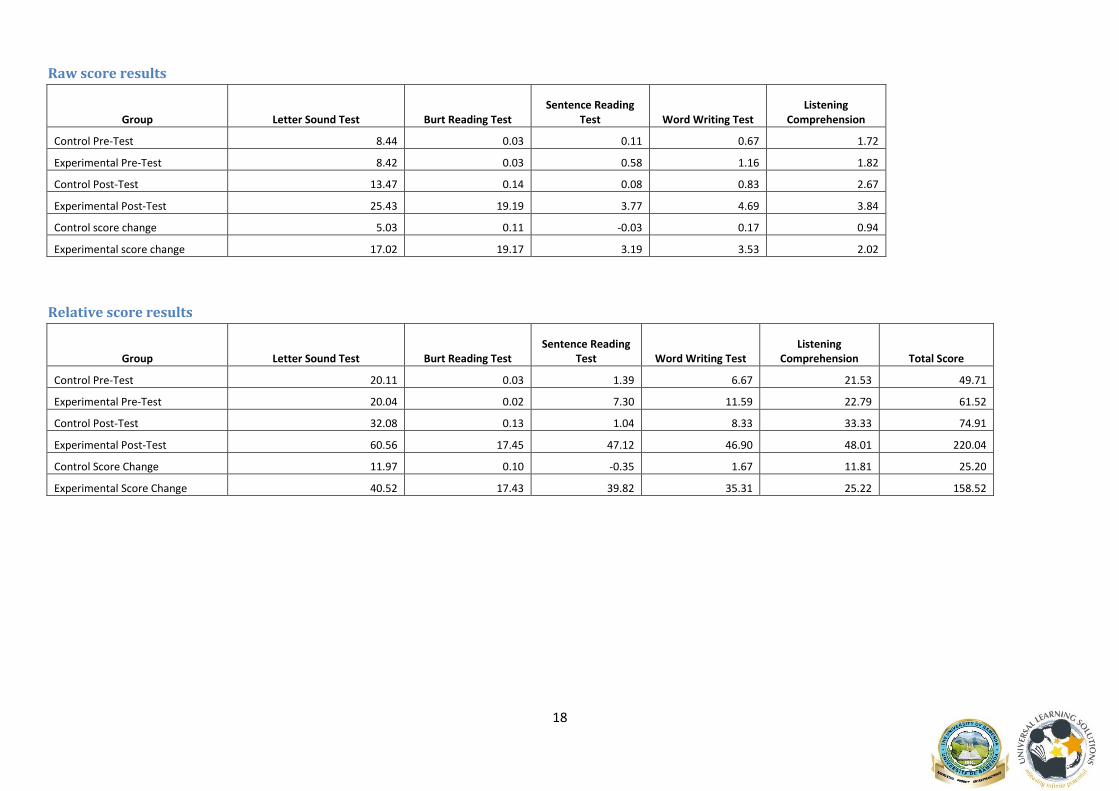
Control Pre-Test 20.11 0.03 1.39 6.67 21.53 49.71
Experimental Pre-Test 20.04 0.02 7.30 11.59 22.79 61.52
Control Post-Test 32.08 0.13 1.04 8.33 33.33 74.91
Experimental Post-Test 60.56 17.45 47.12 46.90 48.01 220.04
Control Score Change 11.97 0.10 -0.35 1.67 11.81 25.20
Experimental Score Change 40.52 17.43 39.82 35.31 25.22 158.52
Table 2: Mean relative scores
4.2.1 Mean score at baseline
Figure 4.5 Literacy pre-test scores for each assessment
Table 2 and Figure 4.5 the mean test scores at baseline, before the Jolly Phonics method was implemented. It can be
seen that for most assessments the control and experimental groups were relatively well matched, only on sentence
reading and word writing did the experimental group perform slightly better than the control group. Despite being
well matched this slight difference in some categories highlights the importance of analysing the growth in scores
from baseline to post-test between these two groups of schools.
0
10
20
30
40
50
60
70
Mean Pre-Test Scores
Control Pre-Test
Experimental Pre-Test
7
0
50
100
150
200
250
Mean Post-Test Scores
Control Post-Test
Experimental Post-Test
-20
0
20
40
60
80
100
120
140
160
180
Mean Score Change
Control Score Change
Experimental Score Change
4.2.2 Mean score at end line & mean score change
Figure 4.6 Literacy post-test scores for each assessment
Figure 4.7: Mean change (relative scores) for each literacy assessment
Overall Table 2 illustrates that there has been an improvement in every aspect of the literacy abilities of those
children exposed to the Jolly Phonics methodology. Both overall and in every category of literacy tested, the
experimental groups scores increased significantly more than the control groups, as illustrated by Figure 4.6 and
Figure 4.7.
8
For the remainder of this section raw scores from each assessment will be presented in order to evaluate the actual
change in ability for each skill.
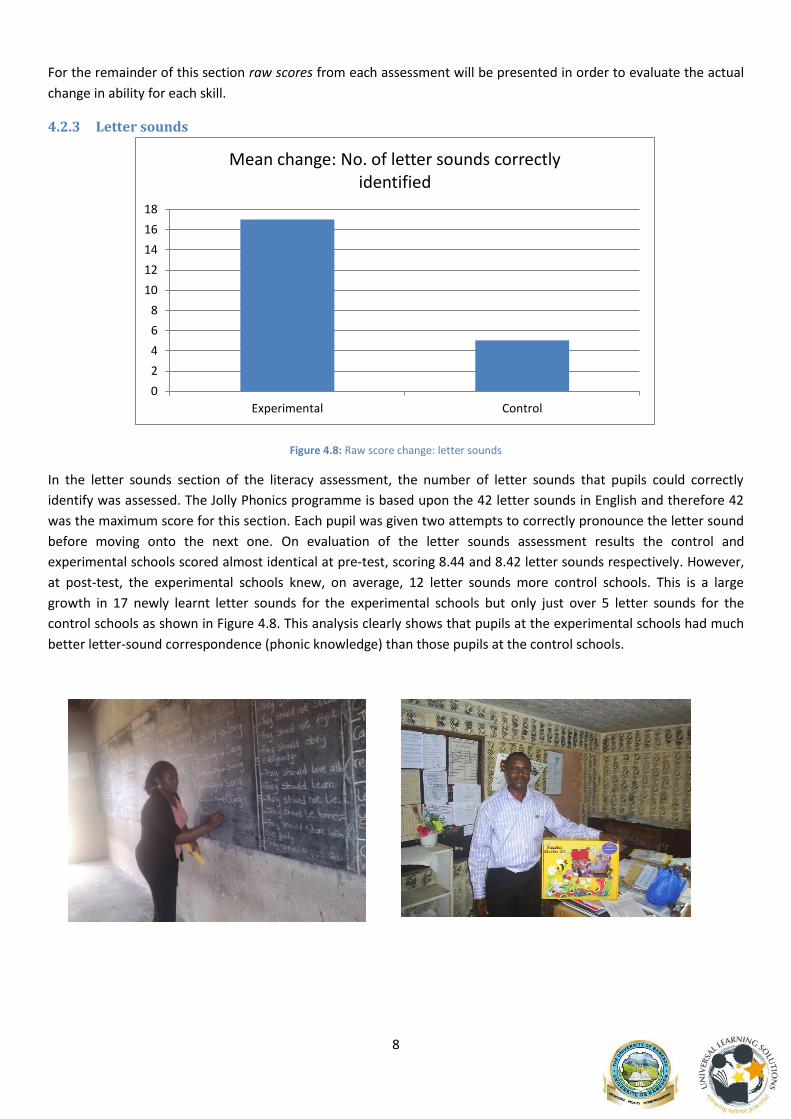
4.2.3 Letter sounds
Figure 4.8: Raw score change: letter sounds
In the letter sounds section of the literacy assessment, the number of letter sounds that pupils could correctly
identify was assessed. The Jolly Phonics programme is based upon the 42 letter sounds in English and therefore 42
was the maximum score for this section. Each pupil was given two attempts to correctly pronounce the letter sound
before moving onto the next one. On evaluation of the letter sounds assessment results the control and
experimental schools scored almost identical at pre-test, scoring 8.44 and 8.42 letter sounds respectively. However,
at post-test, the experimental schools knew, on average, 12 letter sounds more control schools. This is a large
growth in 17 newly learnt letter sounds for the experimental schools but only just over 5 letter sounds for the
control schools as shown in Figure 4.8. This analysis clearly shows that pupils at the experimental schools had much
better letter-sound correspondence (phonic knowledge) than those pupils at the control schools.
0
2
4
6
8
10
12
14
16
18
Experimental Control
Mean change: No. of letter sounds correctly identified
9
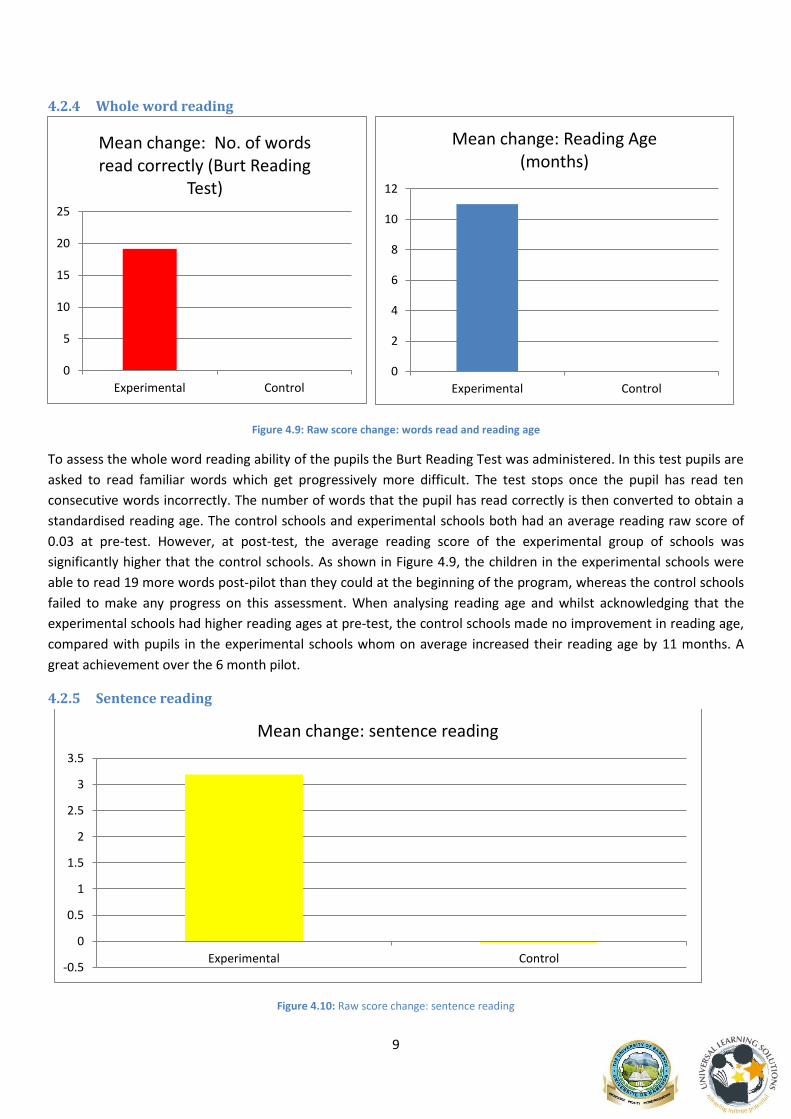
4.2.4 Whole word reading
Figure 4.9: Raw score change: words read and reading age
To assess the whole word reading ability of the pupils the Burt Reading Test was administered. In this test pupils are
asked to read familiar words which get progressively more difficult. The test stops once the pupil has read ten
consecutive words incorrectly. The number of words that the pupil has read correctly is then converted to obtain a
standardised reading age. The control schools and experimental schools both had an average reading raw score of
0.03 at pre-test. However, at post-test, the average reading score of the experimental group of schools was
significantly higher that the control schools. As shown in Figure 4.9, the children in the experimental schools were
able to read 19 more words post-pilot than they could at the beginning of the program, whereas the control schools
failed to make any progress on this assessment. When analysing reading age and whilst acknowledging that the
experimental schools had higher reading ages at pre-test, the control schools made no improvement in reading age,
compared with pupils in the experimental schools whom on average increased their reading age by 11 months. A
great achievement over the 6 month pilot.
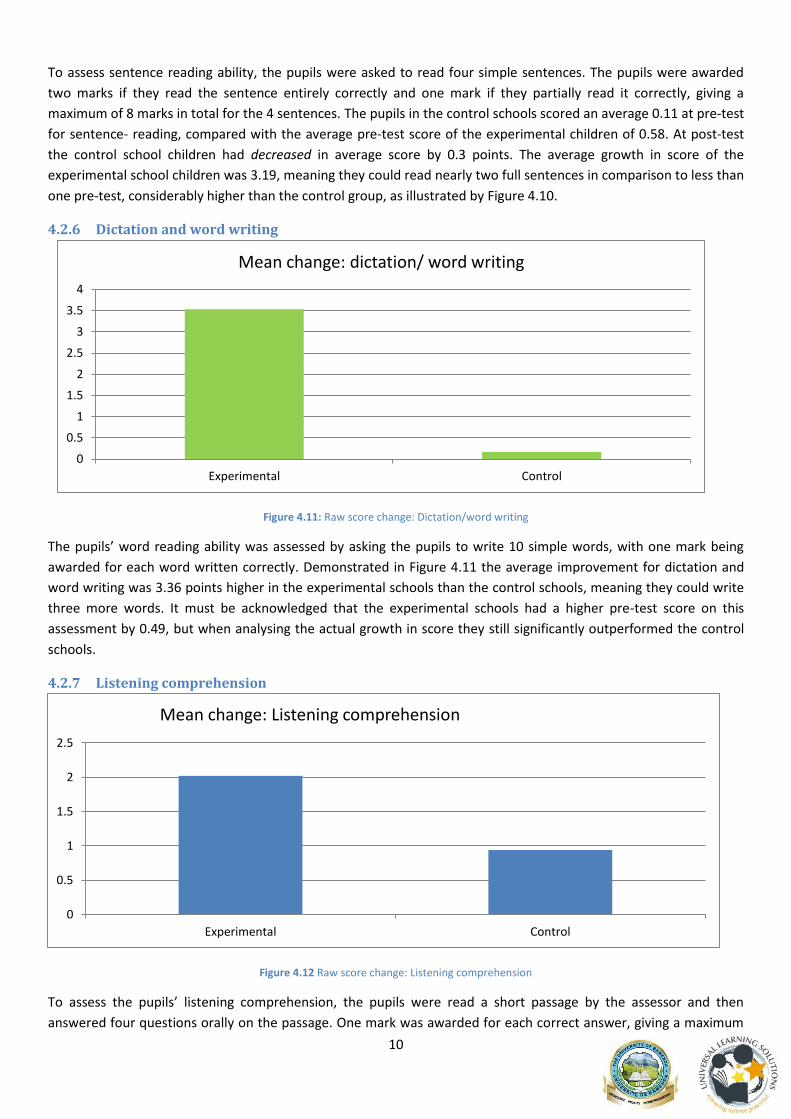
4.2.5 Sentence reading
Figure 4.10: Raw score change: sentence reading
0
5
10
15
20
25
Experimental Control
Mean change: No. of words read correctly (Burt Reading
Test)
0
2
4
6
8
10
12
Experimental Control
Mean change: Reading Age (months)
-0.5
0
0.5
1
1.5
2
2.5
3
3.5
Experimental Control
Mean change: sentence reading
10
To assess sentence reading ability, the pupils were asked to read four simple sentences. The pupils were awarded
two marks if they read the sentence entirely correctly and one mark if they partially read it correctly, giving a
maximum of 8 marks in total for the 4 sentences. The pupils in the control schools scored an average 0.11 at pre-test
for sentence- reading, compared with the average pre-test score of the experimental children of 0.58. At post-test
the control school children had decreased in average score by 0.3 points. The average growth in score of the
experimental school children was 3.19, meaning they could read nearly two full sentences in comparison to less than
one pre-test, considerably higher than the control group, as illustrated by Figure 4.10.
4.2.6 Dictation and word writing
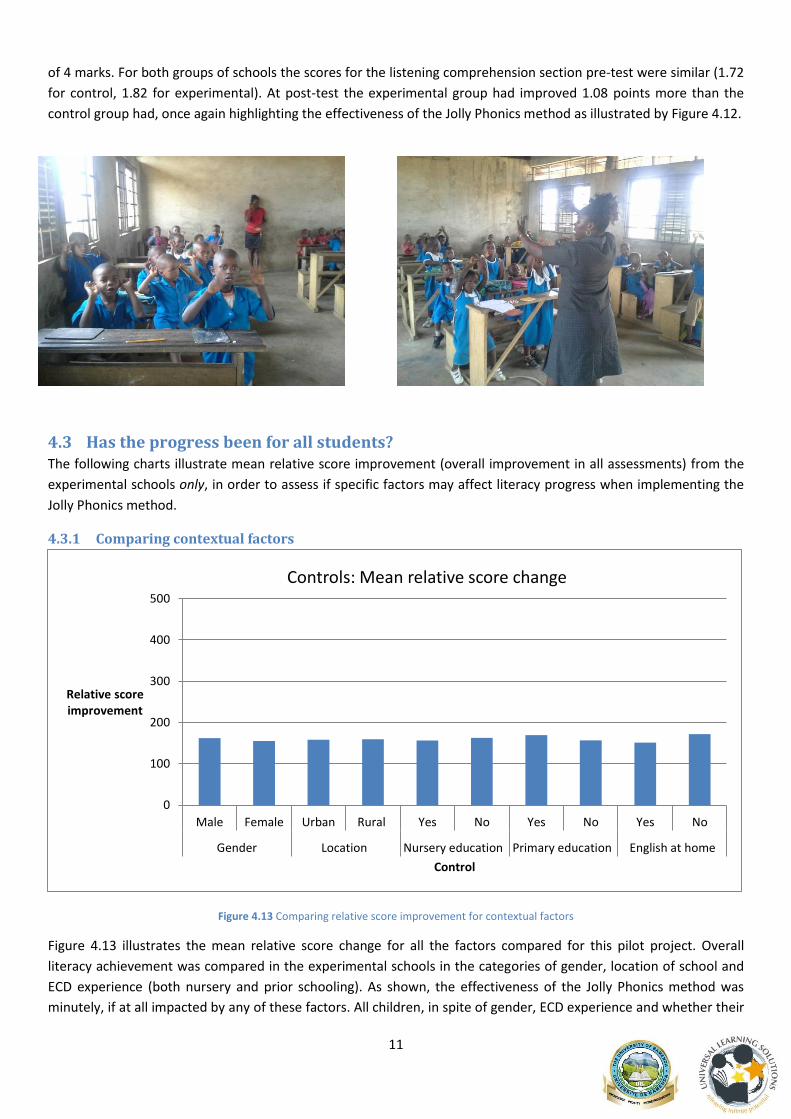
Figure 4.11: Raw score change: Dictation/word writing
The pupils’ word reading ability was assessed by asking the pupils to write 10 simple words, with one mark being
awarded for each word written correctly. Demonstrated in Figure 4.11 the average improvement for dictation and
word writing was 3.36 points higher in the experimental schools than the control schools, meaning they could write
three more words. It must be acknowledged that the experimental schools had a higher pre-test score on this
assessment by 0.49, but when analysing the actual growth in score they still significantly outperformed the control
schools.
4.2.7 Listening comprehension
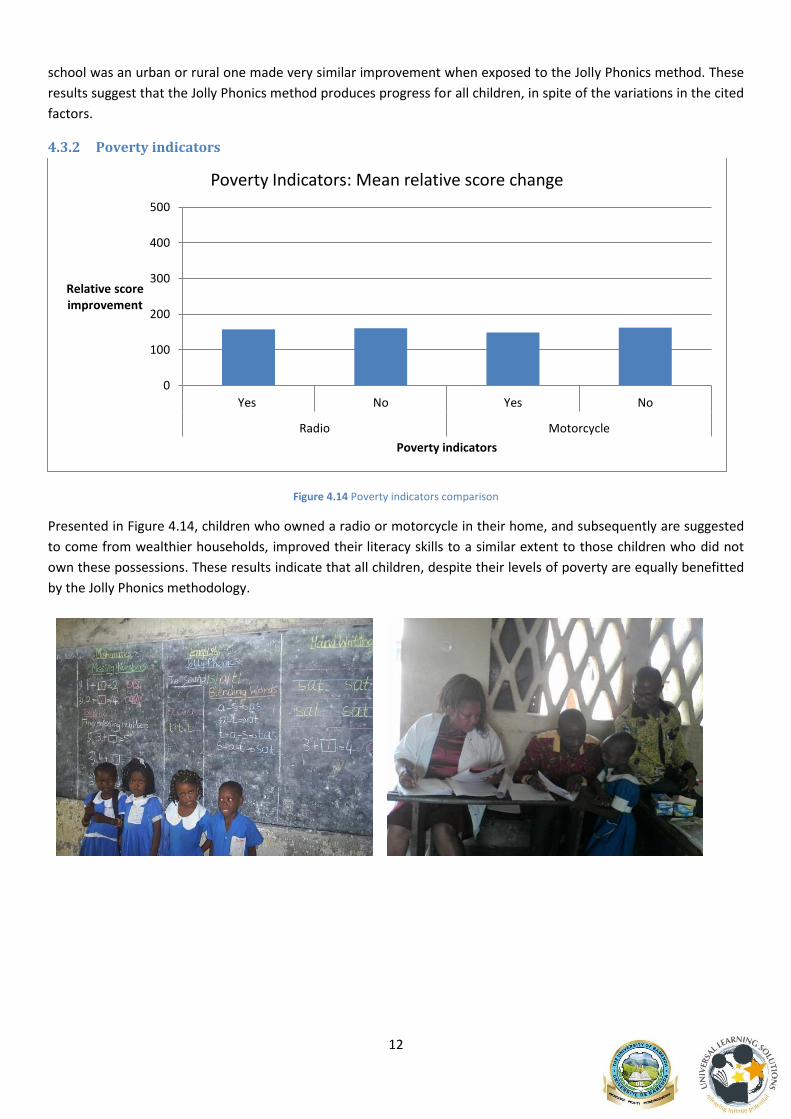
Figure 4.12 Raw score change: Listening comprehension
To assess the pupils’ listening comprehension, the pupils were read a short passage by the assessor and then
answered four questions orally on the passage. One mark was awarded for each correct answer, giving a maximum
0
0.5
1
1.5
2
2.5
3
3.5
4
Experimental Control
Mean change: dictation/ word writing
0
0.5
1
1.5
2
2.5
Experimental Control
Mean change: Listening comprehension
11
of 4 marks. For both groups of schools the scores for the listening comprehension section pre-test were similar (1.72
for control, 1.82 for experimental). At post-test the experimental group had improved 1.08 points more than the
control group had, once again highlighting the effectiveness of the Jolly Phonics method as illustrated by Figure 4.12.
4.3 Has the progress been for all students? The following charts illustrate mean relative score improvement (overall improvement in all assessments) from the
experimental schools only, in order to assess if specific factors may affect literacy progress when implementing the
Jolly Phonics method.
4.3.1 Comparing contextual factors
Figure 4.13 Comparing relative score improvement for contextual factors
Figure 4.13 illustrates the mean relative score change for all the factors compared for this pilot project. Overall
literacy achievement was compared in the experimental schools in the categories of gender, location of school and
ECD experience (both nursery and prior schooling). As shown, the effectiveness of the Jolly Phonics method was
minutely, if at all impacted by any of these factors. All children, in spite of gender, ECD experience and whether their
0
100
200
300
400
500
Male Female Urban Rural Yes No Yes No Yes No
Gender Location Nursery education Primary education English at home
Relative score improvement
Control
Controls: Mean relative score change
12
school was an urban or rural one made very similar improvement when exposed to the Jolly Phonics method. These
results suggest that the Jolly Phonics method produces progress for all children, in spite of the variations in the cited
factors.
4.3.2 Poverty indicators
Figure 4.14 Poverty indicators comparison
Presented in Figure 4.14, children who owned a radio or motorcycle in their home, and subsequently are suggested
to come from wealthier households, improved their literacy skills to a similar extent to those children who did not
own these possessions. These results indicate that all children, despite their levels of poverty are equally benefitted
by the Jolly Phonics methodology.
0
100
200
300
400
500
Yes No Yes No
Radio Motorcycle
Relative score improvement
Poverty indicators
Poverty Indicators: Mean relative score change
13
4.3.3 Languages at home:
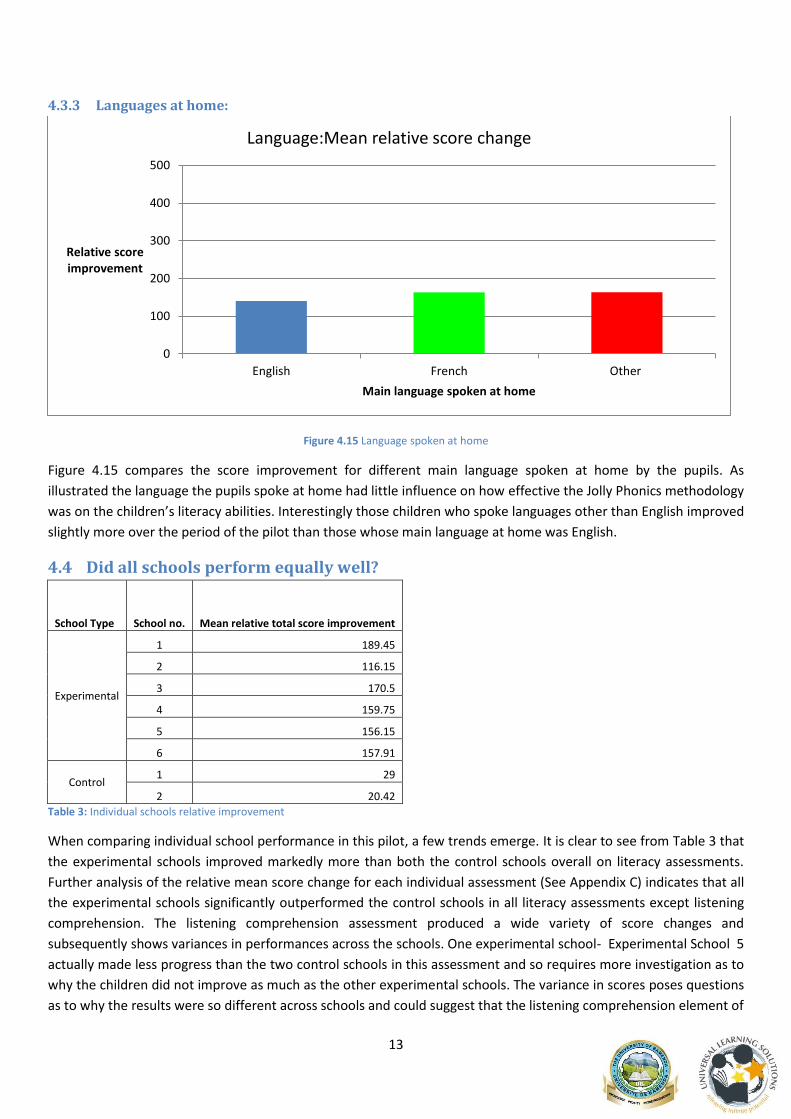
Figure 4.15 Language spoken at home
Figure 4.15 compares the score improvement for different main language spoken at home by the pupils. As
illustrated the language the pupils spoke at home had little influence on how effective the Jolly Phonics methodology
was on the children’s literacy abilities. Interestingly those children who spoke languages other than English improved
slightly more over the period of the pilot than those whose main language at home was English.
4.4 Did all schools perform equally well?
School Type School no. Mean relative total score improvement
Experimental
1 189.45
2 116.15
3 170.5
4 159.75
5 156.15
6 157.91
Control 1 29
2 20.42
Table 3: Individual schools relative improvement
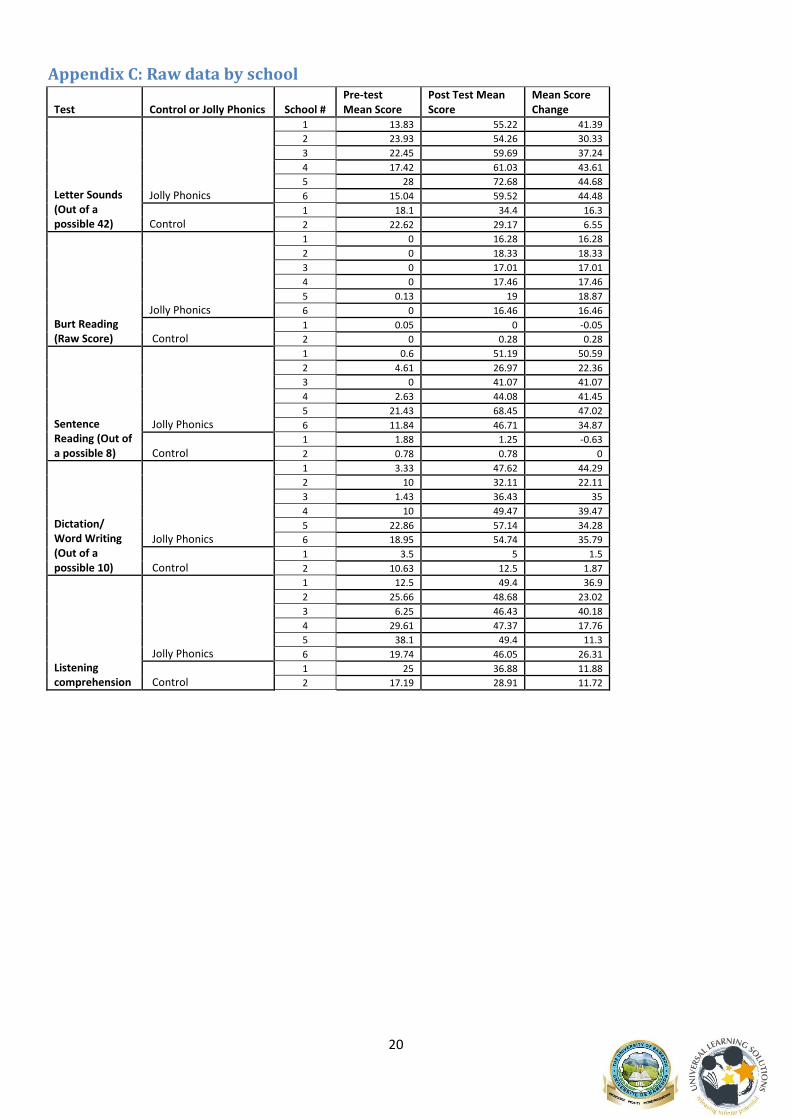
When comparing individual school performance in this pilot, a few trends emerge. It is clear to see from Table 3 that
the experimental schools improved markedly more than both the control schools overall on literacy assessments.
Further analysis of the relative mean score change for each individual assessment (See Appendix C) indicates that all
the experimental schools significantly outperformed the control schools in all literacy assessments except listening
comprehension. The listening comprehension assessment produced a wide variety of score changes and
subsequently shows variances in performances across the schools. One experimental school- Experimental School 5
actually made less progress than the two control schools in this assessment and so requires more investigation as to
why the children did not improve as much as the other experimental schools. The variance in scores poses questions
as to why the results were so different across schools and could suggest that the listening comprehension element of
0
100
200
300
400
500
English French Other
Relative score improvement
Main language spoken at home
Language:Mean relative score change
14
the Jolly Phonics course was neglected by teachers or not adequately understood by the teachers themselves.
When there are large differences in score growth between individual schools, such as between Experimental School
1 and Experimental School 2 for sentence reading, it could be suggested that the quality or the regularity of teaching
Jolly Phonics varied between schools or that teachers focused on different elements of the programme. Out of the
experimental schools, Experimental School 2 performed the worst in three of the five literacy assessments
prompting questions as to its poor performance. Further investigation may be required here to discover why this
school’s progress lagged behind the other experimental schools, if they faced any specific challenges and if they
could take lessons from one of the stronger performing schools.
5 Consideration of other influencing factors
5.1 Factors contributing to success of the pilot There were a number of factors that contributed to the success of this pilot and the improvements in the pupils’
literacy outcomes. These factors included:
Governmental support: The strong support that both the Ministry of Basic Education and the Regional
Delegation of Littoral gave to this pilot was vital to its success. Both parties should be congratulated and
thanked for this support. Continuing this strong partnership will be fundamental to the success of future
expansion of the Jolly Phonics programme in Cameroon.
Detailed initial training in Jolly Phonics: the 3 days of initial training for the teachers in Jolly Phonics by an
expert Jolly Phonics trainer provided a thorough introduction to the programme and how to teach it. A
minimum of 3 days training has been found to be most effective from the programme being used elsewhere.
Regular teaching of Jolly Phonics: it is recommended that Jolly Phonics should be taught at least 3 times a
week, and ideally daily. In this pilot, the majority of the teachers did teach the programme most days which
allowed the pupils to make good progress in their reading and writing ability.
5.2 Challenges experienced in the pilot Despite this pilot showing impressive improvements in the pupils’ ability to read and write when taught using the
Jolly Phonics programme, there were a number of challenges faced in the pilot. These challenges included:
Overcrowded classrooms and large class sizes: Although this problem is often unavoidable in this context,
the programme must be sensitive to the number of children teachers are responsible for and provide
support and guidance to the teachers in using the Jolly Phonics programme with such large pupil groups. For
example the trainer could model teaching a Jolly Phonics lesson to a large class as part of the training and
teachers given guidance and suggestions on how to use the materials for large classes.
Low proficiency of English amongst the teachers: In some cases the teacher’s proficiency of English was very
low, which provided challenges when they were attempting to teach the Jolly Phonics programme. Therefore
consideration should be given to this when implementing this programme in the future by both adapting the
programme to cater for this and providing support to the teachers to improve their level of English.
Lack of regular follow-up and monitoring: A great effort was made by the University of Bamenda and the
Regional Delegation of Littoral to monitor the implementation of the programme and provide some on-going
support to the teachers. However due to this pilot having limited funding and capacity, this support and
follow-up after the initial training was insufficient to maximise the impact of the programme. This is
compared to Jolly Phonics projects elsewhere having regular visits to the schools to mentor the teacher and
monitor the implementation of the programme as well as refresher training being organised. This lack of
follow-up and monitor did result in the teachers not being encouraged and supported adequately, issues not
being picked-up at an early stage and there being a deficiency of further training and mentoring. In any
scale-up of the programme, it is therefore important that the government works with the implementation

15
partners to implement a robust monitoring and mentoring programme that provides this vital on-going
support to the trained teachers.
6 Conclusions The aim of this project was to pilot the Jolly Phonics programme in the teaching of reading and writing of English in
government primary schools in Cameroon and assess its impact on early grade reading outcomes. Through this
evaluation it has been determined that the synthetic phonics approach of teaching reading and writing of English,
and specifically the Jolly Phonics programme, leads to greater progress in the pupils’ reading and writing ability in
English than those pupils not taught using the programme. This evaluation has also shown that the Jolly Phonics
programme is effective for all student groups (gender, ECD experience, poverty levels, school location and language
spoken at home).
As this analysis shows, the experimental schools outperformed the control schools significantly on all the five literacy
skills assessed, suggesting that the Jolly Phonics method provides a more effective way of teaching these key skills
than existing methods being used. For example pupils taught using Jolly Phonics on average increased their reading
age by 11 months after only using the programme for 6 months. This is compared to pupils not taught using the
programme making on average no improvement in their reading age over the same period. Such a significant
improvement in reading age demonstrates the impact that the Jolly Phonics teaching has on overall reading skills
and not just letter sound knowledge. Comparisons between children whom spoke varying languages at home
showed no significant difference in literacy progress, suggesting the Jolly Phonics methodology is effective for all
children despite the language they use the majority of time at home. Further analysis into prior ECD, gender, school
location and poverty levels highlighted such controls have little influence as to the success of children exposed to
this methodology. Subsequently it can be proposed that the Jolly Phonics method should be effective for all children
in Cameroon.
7 Recommendations This pilot study has shown that the Jolly Phonics programme provides a highly effective way of teaching children to
read and write and that it causes an increase in the literacy rates for all groups of children. Given the significantly
better progress the children taught using Jolly Phonics made than those not taught using the programme, it is
therefore strongly recommended that the Ministry of Basic Education extends this programme to all government
primary schools in Cameroon. Based on the strong evidence from this pilot study, the implementation of the
programme nationwide would results in a significant improvement in the literacy rate in Cameroon. However this
pilot has also highlighted some challenges particularly around the need for ongoing training, mentoring and support
for the teachers using this programme as well regular monitoring. It is therefore recommended that effective and
high-quality ongoing training and mentoring, as well as rigorous and regular monitoring, are implemented as core
parts of the expansion of this programme.
16
Appendices
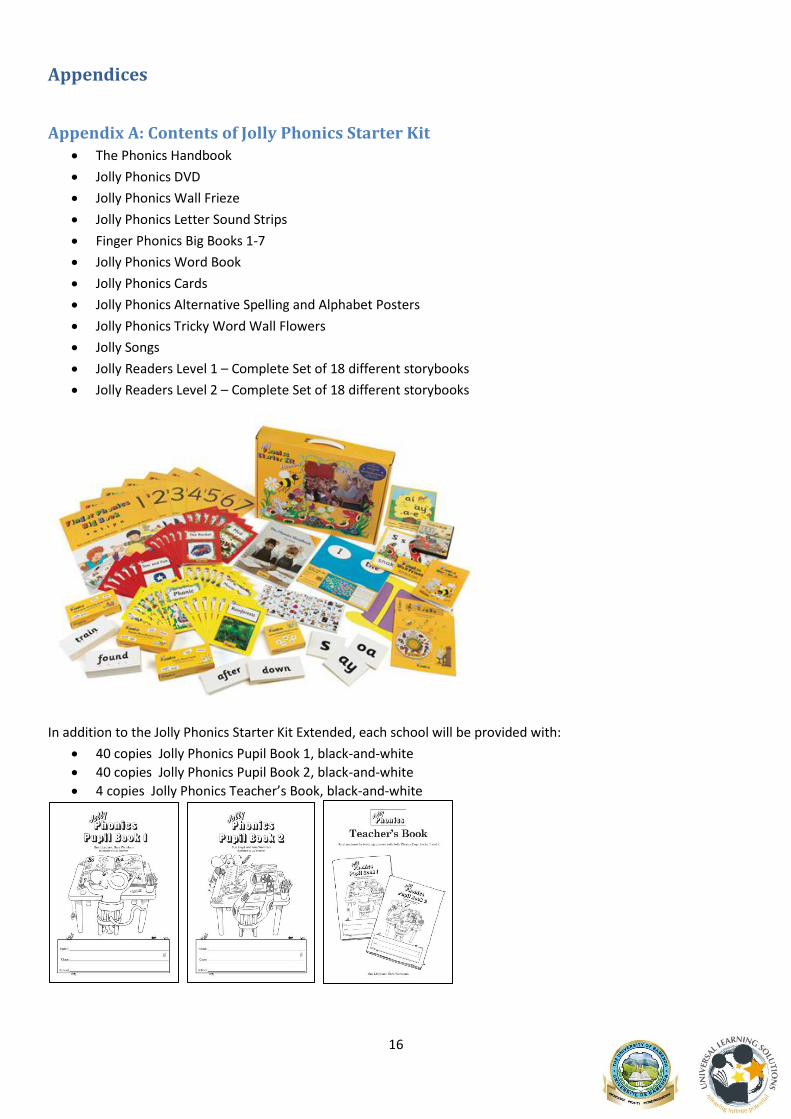
Appendix A: Contents of Jolly Phonics Starter Kit The Phonics Handbook
Jolly Phonics DVD
Jolly Phonics Wall Frieze
Jolly Phonics Letter Sound Strips
Finger Phonics Big Books 1-7
Jolly Phonics Word Book
Jolly Phonics Cards
Jolly Phonics Alternative Spelling and Alphabet Posters
Jolly Phonics Tricky Word Wall Flowers
Jolly Songs
Jolly Readers Level 1 – Complete Set of 18 different storybooks
Jolly Readers Level 2 – Complete Set of 18 different storybooks
In addition to the Jolly Phonics Starter Kit Extended, each school will be provided with:
40 copies Jolly Phonics Pupil Book 1, black-and-white
40 copies Jolly Phonics Pupil Book 2, black-and-white
4 copies Jolly Phonics Teacher’s Book, black-and-white
17
Appendix B: Raw data
Profile of respondents
Douala
Variable Category Jolly Phonics Control Schools Frequency
Jolly Phonics % Control %
Frequency
English Spoken at Home
Yes 73 24 65% 67%
No 40 12 35% 33%
Use of English At Home
Never 0 0 0% 0%
Rarely 7 0 6% 0%
Some of the Time 13 1 12% 3%
Most of the time 26 6 23% 17%
All the time 33 18 29% 50%
No response 34 11 30% 31%
Main Home Language
English 50 17 44% 47%
French 32 13 28% 36%
Hausa 4 0 4% 0%
Native/local language 25 6 22% 17%
No response 2 0 2% 0%
Attended Nursery
Yes 70 25 62% 69%
No 43 11 38% 31%
Attended School Before this Year
Yes 15 1 13% 3%
No 78 35 69% 97%
Radio Yes 82 31 73% 86%
No 31 5 27% 14%
TV Yes 106 34 94% 94%
No 7 2 6% 6%
Motorbike Yes 33 12 29% 33%
No 80 24 71% 67%
Car Yes 37 9 33% 25%
No 76 27 67% 75%
Fridge Yes 81 23 72% 64%
No 32 13 28% 36%
18
Raw score results
Group Letter Sound Test Burt Reading Test Sentence Reading
Test Word Writing Test Listening
Comprehension
Control Pre-Test 8.44 0.03 0.11 0.67 1.72
Experimental Pre-Test 8.42 0.03 0.58 1.16 1.82
Control Post-Test 13.47 0.14 0.08 0.83 2.67
Experimental Post-Test 25.43 19.19 3.77 4.69 3.84
Control score change 5.03 0.11 -0.03 0.17 0.94
Experimental score change 17.02 19.17 3.19 3.53 2.02
Relative score results
Group Letter Sound Test Burt Reading Test Sentence Reading
Test Word Writing Test Listening
Comprehension Total Score
Control Pre-Test 20.11 0.03 1.39 6.67 21.53 49.71
Experimental Pre-Test 20.04 0.02 7.30 11.59 22.79 61.52
Control Post-Test 32.08 0.13 1.04 8.33 33.33 74.91
Experimental Post-Test 60.56 17.45 47.12 46.90 48.01 220.04
Control Score Change 11.97 0.10 -0.35 1.67 11.81 25.20
Experimental Score Change 40.52 17.43 39.82 35.31 25.22 158.52
19
Controls Mean Score Change
Gender Location Nursery education Primary education English at home
Male Female Urban Rural Yes No Yes No Yes No
Experimental pre- test 60.9 62.18 61.3 61.95 67.46 51.86 44.36 64.15 69.87 46.91
Experimental post-test 222.82 217.12 219.33 221.45 223.82 214.54 213.78 220.93 220.96 218.43
Mean total score change 161.92 154.94 158.03 159.50 156.36 162.68 169.42 156.78 151.09 171.52
Poverty indicators raw data
Radio Motorcycle
Yes No Yes No
Experimental pre- test 58.56 69.35 67.15 59.2
Experimental post-test 216.16 229.87 216.08 221.82
Mean total score change 157.60 160.52 148.93 162.62
20
Appendix C: Raw data by school
Test Control or Jolly Phonics School # Pre-test Mean Score
Post Test Mean Score
Mean Score Change
Letter Sounds (Out of a possible 42)
Jolly Phonics
1 13.83 55.22 41.39
2 23.93 54.26 30.33
3 22.45 59.69 37.24
4 17.42 61.03 43.61
5 28 72.68 44.68
6 15.04 59.52 44.48
Control 1 18.1 34.4 16.3
2 22.62 29.17 6.55
Burt Reading (Raw Score)
Jolly Phonics
1 0 16.28 16.28
2 0 18.33 18.33
3 0 17.01 17.01
4 0 17.46 17.46
5 0.13 19 18.87
6 0 16.46 16.46
Control 1 0.05 0 -0.05
2 0 0.28 0.28
Sentence Reading (Out of a possible 8)
Jolly Phonics
1 0.6 51.19 50.59
2 4.61 26.97 22.36
3 0 41.07 41.07
4 2.63 44.08 41.45
5 21.43 68.45 47.02
6 11.84 46.71 34.87
Control 1 1.88 1.25 -0.63
2 0.78 0.78 0
Dictation/ Word Writing (Out of a possible 10)
Jolly Phonics
1 3.33 47.62 44.29
2 10 32.11 22.11
3 1.43 36.43 35
4 10 49.47 39.47
5 22.86 57.14 34.28
6 18.95 54.74 35.79
Control 1 3.5 5 1.5
2 10.63 12.5 1.87
Listening comprehension
Jolly Phonics
1 12.5 49.4 36.9
2 25.66 48.68 23.02
3 6.25 46.43 40.18
4 29.61 47.37 17.76
5 38.1 49.4 11.3
6 19.74 46.05 26.31
Control 1 25 36.88 11.88
2 17.19 28.91 11.72
Recommended