A NEW PUNCHING SHEAR STRENGTHENING
TECHNIQUE
FOR REINFORCED CONCRETE SLABS AT INTERIOR
SLAB-COLUMN CONNECTIONS
by
Bamidele Adetifa
A thesis presented to the University of Waterloo
in fulfilment of the thesis requirement for the degree of
Master of Applied Science m
Civil Engineering
Waterloo, Ontario, Canada, 2003
© Bamidele Adetifa 2003

I hereby declare that I am the sole author of this thesis.
I authorize the University of Waterloo to lend this thesis to other institutions or individuals for the purpose of scholarly research.
I further authorize the University of Waterloo to reproduce this thesis by photocopying or by other means, in total or in part, at the request of other institutions or individuals for the purpose of
scholarly research.
ii

The University of Waterloo requires the signatures of all persons using or photocopying this thesis. Please sign below, and give address and date.
iii

Abstract
In certain situations the punching strength of a connection may become inadequate after
construction due to changes of connection geometry from drilling or coring, or from changes of
building use, or construction and design errors. The use of shear reinforcement in the form of Shear
Bolts is a new approach to strengthening slab-column connections.
Reported in this thesis are the results of research on the use of shear bolts for reinforced concrete
interior slab-column connections without unbalanced moments. Six slab specimens were tested with
different configurations of shear bolts and without shear reinforcement to verify the effectiveness of
this method of reinforcement.
The central idea is an externally applied shear reinforcing technique that provides strength in shear
at par with other conventional reinforcement types on the one hand and offering the distinct
advantage and flexibility of external application after construction. A shear bolt consists of an
unhardened steel shaft threaded at one end and flared out to form a bearing/anchor surface on the
other end.
All six specimens were designed to fail in shear before reaching their flexural capacity, two of
which were more critical than the others because of the presence of openings simulating utility
ducts around the column perimeter.
From the tests, comparisons of predicted loads with the failure loads indicated a higher ultimate
load for slab reinforced with the bolt system. Similarly, strain measurements from strain gauges
attached to the longitudinal steel and deflection profiles of the slab showed that the new method was
efficient in increasing the shear capacity of the slabs. In summary, the test program showed that
shear bolts are effective in transforming the behaviour of the slab-column connections from a brittle
punching shear failure mode to a more ductile flexural one. Deflection profiles at different load
stages, and particularly at failure, show increased deflections for specimens reinforced with bolt
reinforcements. This indicates an increased ductility at the connection. Similarly, load and flexural
reinforcement strain magnitudes show substantial improvements in the strength of the connections.
iv

Acknowledgements
The author is grateful to everyone who helped in the course of this research program: the laboratory
staff, colleagues and friends.
Special thanks to Professor M.A Polak for her kind sponsorship and supervision of this
research.
V
Table of Contents
Abstract. . . . . . . . . . . . .. . . . . . . . . . . . . . . . . . . . . . . . . . . . . . . . . . . . . . . . . . . . . . . . . . . . . . . . . . . . . . . . . . . . . . . . . . . . . . . iv
Acknowledgements................................................................................ v
Table of Contents................................................................................. vi
List of Figures. . . . . . . . . . . . . . . . . . . . . . . . . . . . . . . . . . . . . . . . . . . . . . . . . . . . . . . . . . . . . . . . . . . . . . . . . . . . . . . . . . . . x
List of Tables...................................................................................... xiii
Chapter 1 Introduction ....... ; ........................................................... . 1
1.1 Background.............................................................................. 1
1.2 Punching Shear.......................................................................... 2
1.3 Openings Around Columns............................................................ 2
1.4 Conventional Slab-Column Tests...................................................... 3
1.5 Objectives................................................................................. 3
1.6 Scope of Research....................................................................... 4
1.7 Contents ofThesis.............. .............................. ......... ...... ............ 4
Chapter 2 Review of Literature........................................................... 6
2.1 Punching Shear Models................................................................. 6
2.1.1 Rotational Models.............................................................. 6
2.1.1.1 KinnunenandNylander....................................................... 6
2.1.1.2 Shehata........................................................................... 7
2.1.1.3 Brorns............................................................................ 9
2.1.2 Models based on Classical Plasticity Theory...................................... 10
2.1.2. l Braestrup et al.................................................................... 10
2.1.2.2 Plasticity Model by Bortolotti.. .. ,............................................ 11
2.1.3 Other Models........................................................................... 12
2.1.3.l Fracture Mechanics Model by Bazant and Cao............................. 12
2.1.3.2 Truss Model by Alexander and Simmonds.................................. 13
2.1.3.3 Bond Model by Alexander and Simmonds.................................. 14
2.1.3.4 Empirical Model by Moe...................................................... 15
2.2 Code Shear Design Procedures for Reinforced Concrete Slabs..................... 16
2.2.1 American Code ACI 318-99........................................................ 16
2.2.2 Canadian Code CSA A23.3-94................. .. . . . . .. . . . . . . . . . . . . . . . . . . . . . . . . . ... 17
vi
2.2.3 Eurocode 2ENV 1992-1-1.......................................................... 18
2.2.4 CEB-FIP MC 1990.................................................................. 20
2.3 Selected Experimental Studies on Punching Shear................................... 21
2.3.1 Dilger and Ghali: Shear Reinforcement for Concrete Slabs................... 21
2.3.2 Ghali, Sargious and Huizer: Vertical Prestressing ofFlate Plates Around
Columns........................................................................... 23
2.3.3 Marzouk and Hussein: Experimental Investigation on the Behaviour of High
Strength Concrete Slabs .................... ,.................................... 24
2.3.4 Elgabry and Ghali: Design of Stud-Shear Reinforcement for Slabs....... 25
2.3.5 El-Salakawy, Polak and Soudki: New Shear Strengthening Technique for
Concrete Slab-Column Connections........................................... 26
2.3.6 Rankin and Long: Predicting the Punching Shear Strength of Conventional
Slab-Column Specimens.......................................................... 27
Chapter 3 Test Program .. .. .. .. .. .. .. .. .. .. .. .. .. .. .. .. .. .. .. .. .. .. .. .. .. .. .. .. .. .. .. .... 28
3.1 General Description..................................................................... 28
3.1.1 Material Properties................................................................ 28
3.2 Experimental Program.................................................................. 33
3.2.1 Equivalent Continuous Slab System............................................. 33
3.2.2 Test Specimens..................................................................... 33
3.2.3 Slab Flexural Reinforcement..................................................... 35
3.2.4 Slab Shear Reinforcement........................................................ 37
3.2.5 Column Reinforcement........................................................... 38
3.3 Preparation of the Test Specimens................................................... 38
3.3.l
3.3.2
3.3.3
3.3.4
Form-work building .............................................................. .
Caging ............................................................................. .
Casting ............................................................................. .
Curing ............................................................................. ..
38
38
39
39
3.4 Test Set-Up and Experimental Apparatus........................................... 40
3.4.1 Pedestal Support.................................................................. 40
3.4.2 Boundary Conditions............................................................. 42
3.4.3 Corner Restraint................................................................... 42
3.5 Instrumentation........................................................................ 43
3.5.1 Strain Gauges..................................................................... 43
vii

3.5.2 Displacement transducers....................................................... 44
3.5.3 Video Camera..................................................................... 45
Chapter 4 Design of Test Specimens . . . . . . . . . . . . . . . . . . . . . . . . . . . . . . . . . . . . . . . . . . . . . .. . .. 46
4.1 Dimension and Specimen Selection.............................................. 46
4.2 Yield-Line Analysis................................................................. 47
4.3 Structural Analysis of Continuous Slab System................................. 48
4.3.1 Direct Design Method.......................................................... 48
4.3.2 Elastic Frame Analysis......................................................... 49
4.4 Two Step Approach to Conventional Slab Design by Rankin and Long.... 51
4.4.l Full Yielding (consideration of yield line) Flexural Failure............... 51
4.4.2 Localized Compression Failure............................................... 51
4.4.3 Partial Yielding Flexural Failure............................................. 51
4.4.4 Shear Punching Resistance.................................................... 52
4.5 Shear Design by Code of Practice Requirements.............................. 53
4.5.1 Shear Resistance without Openings/No Shear Reinforcement............ 54
4.5.2 Shear Resistance with Two Openings/No Shear Reinforcement............. 55
4.5.3 Shear Resistance with Four Openings/No Shear Reinforcement............. 55
4.5.4 Shear Resistance with Transverse Reinforcement by CSA A23.3-94.... 56
Chapter 5 Experimental Procedures and Observations . . . . . . . . . . . . . . . . . . . . . . . . . . . . . 57
5.1 Testing Procedures.................................................................. 57
5.2 Test Observations.................................................................... 58
5.2.1 Slab SB!........................................................................... 58
5.2.2
5.2.3
5.2.4
5.2.5
5.2.6
Chapter 6
Slab SB2 .......................................................................... .
Slab SB3 .......................................................................... .
Slab SB4 .......................................................................... .
Slab SB5 .......................................................................... .
Slab SB6 .......................................................................... .
Analysis of Experimental Results ........................................ .
61
63
65
67
70
73
6.1 Comparison of Various Code Predictions and Theoretical Analysis.............. 73
6.2 Stiffness and Ductility................................................................... 74
6.3 Deflection................................................................................. 74
6.4 Strains in Longitudinal Reinforcement................................................ 77
6.5 Strains in Shear Bolts.................................................................... 78
viii

6.6 Effectiveness of Shear Bolts in Reducing Crack Width.............................. 81
Chapter 7 Conclusions and Recommendations....................................... 83
7.1 Conclusions.............................................................................. 83
7 .2 Recommendations....................................................................... 84
Appendix A: Elastic Frame Analysis . .. .. .. .. .. .. . .. .. .. .. . .. .. . .. .. .. . .. .. .. .... 85
Appendix B: Experimental Results.. .. .. .. .. .. .. .. .. .. .. . .. .. . .. .. .. . .. . .. . .. . .. . .. 96
References . .. .. .. . .. . .. . .. .. .. .. . .. .. . .. .. .. .. .. .. . .. .. . .. .. .. . .. . .. .. . .. . .. .. . .. .. . .. 132
ix

Figure 1-1:
Figure 1-2:
Figure 2-1:
Figure 2-2:
Figure 2-3:
Figure 2-4:
Figure 2-5:
Figure 2-6:
Figure 2-7:
Figure 2-8:
Figure 2-9:
Figure 3-1:
Figure 3-2:
. Figure 3-3:
Figure 3-4:
Figure 3-5:
Figure 3-6:
Figure 3-7:
List of Figures
Flat Plate. . . . . . . . . . . . . . . . . . . . . . . . . . . . . . . . . . . . . . . . . . . . . . . . . . . . . . . . . . . . . . . . . . . . . . . . l
Punching Shear Failure Surface.............................................. 2
Shehata's Model................................................................ 8
Bortolotti's Failure Mechanism and Failure Profile........................ 11
As~embly of Load Resisting Struts.......................................... 13
Layout of Radial Strips........................................................ 14
Types of Shear Reinforcement Investigated by Dilger and Ghali....... 22
Load-Deflection Graphs from Dilger and Ghali............................ 23
Comparison of Deflection for Pres tressed and non-Prestressed Slabs... 24
Shear Stud Reinforcement Specifications................................... 26
Typical Arrangement of Shear Bolts in El-Salakawy's Tests............ 27
Typical Specimen............................................................... 29
Specimens Tested............................................................... 30
Typical Stress-Strain Curve for Longitudinal Reinforcement............. 32
Typical Stress-Strain Curve for Shear Bolts................................. 32
Test Specimen Shown in Equivalent Structure being Modelled.......... 34
Top Mat (Compression Reinforcement)..................................... 35
Bottom Mat (Tension Reinforcement)....................................... 36
Figure 3-8: Bar Hooks . . . . . . . . . . . . . . . . . . . . . . . . . . . . . . . . . . . . . . . . . . . . . . . . . . . . . . . . . . . . . . . . . . . . . . . . 36
Figure 3-9: Typical Shear Bolt............................................................... 38
Figure 3-10: Typical Cage..................................................................... 39
Figure 3-11: Casting by Bucket and Crane Method........................................ 40
Figure 3-12: Test Set-up with Pedestals and Slab in Place (Front)....................... 41
Figure 3-13: Testing Set-up Frame Only (Side View)..................................... 41
Figure 3-14: Testing Frame, Data Acquisition and Specimen in Place.................. 42
Figure 3-15: Dimensions of Comer Restraints and Connecting Rods.................... 43
Figure 3-16: Strain Gauge and Terminals.................................................... 43
Figure 3-17: Position of Strain Gauges....................................................... 44
Figure 3-18: Positions of LVDTs on a Typical Specimen................................. 45
Figure 4-1: The conventional Slab-Column Specimen.................................... 46
Figure 4-2: Yield-Line Pattern for Conventional Slab-Column Specimen............ 47
x.

Figure 4-4:
Figure 4-5:
Figure 4-6:
Figure 4-7:
Figure 4-8:
Figure 5-1:
Figure 5-2:
Figure 5-3:
Figure 5-4:
Figure 5-5:
Figure 5-6:
Figure 6-1:
Figure 6-2:
Figure 6-3:
Figure 6-4:
Figure 6-5:
Figure 6-6:
Figure 6-7:
Figure 6-8:
Figure 6-9:
Figure 6-10:
Figure 6-11:
Figure 6-12:
Figure A-1:
Figure A-2:
Figure B-1:
Figure B-2:
Figure B-3:
. Figure B-4:
Figure B-5:
Figure B-6:
Figure B-7:
Figure B-8:
Moment Coefficients for the Direct Design Method........................ 49
Distribution of Statical Moment by the Direct Design method........... 49
Elastic Frame Model Showing Moment of Inertia of Members............ 50
Moments from Elastic Frame Analysis....................................... 50
Modes of Flexural Failure...................................................... 51
Crack Pattern after Failure...................................................... 60
Crack Pattern after Failure of Specimen SB2........ ... .. .. .. .. .. .. .. .. .. ... 62
Crack Pattern after Failure of Specimen SB3............................ .... 64
Crack Pattern after Failure of Specimen SB4.......... .... . .. .. .. .. .. .. .. ... 66
Crack Pattern after Failure of Specimen SB5............................. ... 69
Crack Pattern after Failure of Specimen SB6.. ...... .. .......... ............ 71
Load vs Bottom Central L VDT Displacement.............................. 75
Load vs Internal LVDT Displacement....................................... 75
Load vs Displacement atLVDT 8............................................ 76
Load vs Displacement at L VDT 9......................................... ... 76
Load vs Longitudinal Reinforcement Strain at L6......................... 78
Position of Shear Bolts in Figure 6-7 to 6-11............................... 78
Bolt Strain Relative to Distance from the Column of Specimen SB2... 79
Bolt Strain Relative to Distance from the Column of Specimen SB3... 79
Bolt Strain Relative to Distance from the Column of Specimen SB4... 80
Bolt Strain Relative to Distance from the Column of Specimen SB5... 80
Bolt Strain Relative to Distance from the Column of Specimen SB6... 81
Load vs Vertical Crack Width of Specimen SB I........................... 82
Node Labels..................................................................... 94
Member Labels.................................................................. 95
Load-Displacement Graphs of Specimen SB 1.............................. 97
Load-Vertical Crack Width of Specimen SB I.............................. 99
Load-Longitudinal Reinforcement Strain Graphs of Specimen SB 1.. ... 100
Load-Displacement Graphs of Specimen SB2.............................. 102
Load vs Vertical Crack Width of Specimen SB2 .............................. 104
Load-Longitudinal Reinforcement Strain Graphs of Specimen SB2.. ... 105
Load-Bolt Strains Graphs of Specimen SB2............................. .... 107
Load-Displacement Graphs of Specimen SB3.. ........ ............ .... .. .. 108
xi

Figure B-9: Load vs Vertical Crack Width of Specimen SB3 .............................. llO
Figure B-10: Load-Longitudinal Reinforcement Strain Graphs of Specimen SB3... .. 111
Figure B-11: Load-Bolt Strains Graphs of Specimen SB3.. .. ... ... .... ..... .. .. .. .... .... 113
Figure B-12: Load-Displacement Graphs of Specimen SB4....................... .. . . . . ... ll4
Figure B-13: Load vs Vertical Crack Width of Specimen SB4.. ........... .... ..... .... ... 116
Figure B-14: Load-Longitudinal Reinforcement Strain Graphs of Specimen SB4...... 117
Figure B-15: Load-Bolt Strain Graphs of Specimen SB4.. .. . . . . . . . .. . . . . . . . . . . .. . . . . . . . ... 119
Figure B-16: Load-Displacement Graphs of Specimen SBS.... ...... ......... ...... ... ... 120
Figure B-17: Load vs Vertical Crack Width of Specimens SBS.. ... .. .. . .. .. ... .... .. . ... 122
Figure B-18: Load-Longitudinal Reinforcement Strain Graphs of Specimen SBS...... 123
Figure B-19: Load-Bolt Strains Graphs of Specimen SBS..... ... ... ......... .. . ...... ... . 125
Figure B-20: Load-Displacement Graphs of Specimen SB6............................. .. 126
Figure B-21: Load vs Vertical Crack Width of Specimens SB6.. ... .. .. .. ... ...... ... ... . 128
Figure B-22: Load-Longitudinal Reinforcement Strain Graphs of Specimen SB6...... 129
Figure B-23: Load-Bolt Strains Graphs of Specimen SB6.... .. . ...... ... .... ... ... ... ... .. 131
xii
Table 3-1:
Table 3-2:
Table 4-1:
Table 4-2:
Table 4-3:
Table 4-4:
Table 4-5:
Table 5-1:
Table 5-2:
Table 5-3:
Table 5-4:
Table 5-5:
Table 5-6:
Table 6-1:
Table 6-2:
Table 6-3:
Table 6-4:
List of Tables
Compressive Strength of Test Cylinders ................................. .
Summary of Experimental Program ....................................... .
Slab Capacity from Rankin and Long's Method ......................... .
Shear Resistance of Specimens by Code Provisions .................... .
31
34
52
54
Shear Resistance of Specimens with Two Openings by Code Provisions .. 55
Shear Resistance of Specimens with Four Openings by Code Provisions .. 55
Shear Resistance of Specimens Reinforced with Shear Bolts............ 56
Longitudinal Reinforcement Strains at Ultimate Load of Slab SB 1... .. 59
Longitudinal Reinforcement Strains at Ultimate Load of Slab SB2... .. 63
Longitudinal Reinforcement Strains at Ultimate Load of Slab SB3.. ... 65
Longitudinal Reinforcement Strains at Ultimate Load of Slab SB4... .. 67
Longitudinal Reinforcement Strains at Ultimate Load of Slab SB5... .. 68
Longitudinal Reinforcement Strains at Ultimate Load of Slab SB6.. ... 72
Test Specimens, Code Provisions and Experimental Results............ 73
Stiffness, Displacements and Ductility...................................... 74
Test Results: Yielding of Longitudinal Reinforcement................... 77
Maximum Crack Widths...................................................... 81
Xlll
Chapter 1
Introduction
1.1 Background
Reinforced concrete slabs are relatively thin and flat structural members that function to transfer
loads applied perpendicular to their plane. Slabs have a variety of applications in building
construction. Primarily they serve as floors and roofs in buildings but are also used as walls,
foundation mats, and bridge decks, where they transmit uniformly distributed load components
parallel to their plane or relatively heavy concentrated loading.
Reinforced concrete floor slabs are constructed in a variety of ways: in-situ, precast or composite.
These may also take a number of different structural forms including: solid, ribbed or waffle and
may be reinforced or prestressed. In building construction, slabs are typically supported on beams
or girders, which in turn frame into columns or walls. In Canada, slabs supported directly on
columns without beams are called flat slabs. The first true North American flat slab was constructed
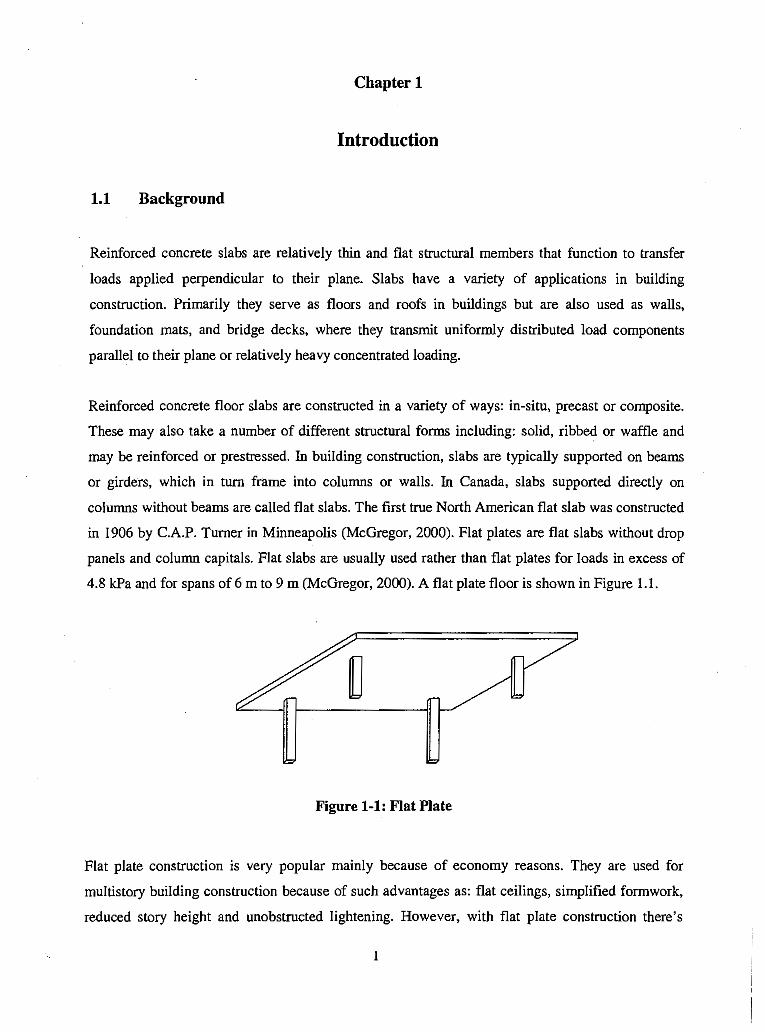
in 1906 by C.A.P. Turner in Minneapolis (McGregor, 2000). Flat plates are flat slabs without drop
panels and column capitals. Flat slabs are usually used rather than flat plates for loads in excess of
4.8 kPa and for spans of 6 m to 9 m (McGregor, 2000). A flat plate floor is shown in Figure 1.1.
Figure 1-1: Flat Plate
Flat plate construction is very popular mainly because of economy reasons. They are used for
multistory building construction because of such advantages as: flat ceilings, simplified formwork,
reduced story height and unobstructed lightening. However, with flat plate construction there's
I

Chapter I: Introduction 2
always the problem of high stresses at the column supports that can result in a so-called punching
shear failure.
1.2 Punching Shear
Punching shear is a significant failure mode that must be accounted for in the design of slabs. It is
critical because it happens without warning. Punching shear ( or two-way shear) involves movement
of a truncated cone or pyramid-shaped surface around a column as shown in Figure 1.2.
Figure 1-2: Punching Shear Failure Surface
1.3 Openings Around Columns
Holes and ducts around columns in slabs are undesirable structurally because they cause an
effective reduction in the critical perimeter for punching shear. In some situations however, these
cannot be avoided for functionality reasons. Therefore, codes of practice have recommended ways
to take into account the strength reduction at slab-column connections due to such openings.
Typically the codes recommend projecting the dimensions of the openings on the critical perimeter.
Reagan (1974) has pointed out that the design standards have not accounted for unsymmetrical
arrangement of openings. When openings are unsymmetrical in an interior connection eccentricity
of loading is introduced at the critical perimeter.
Chapter I: Introduction 3
1.4 Conventional Slab-Column Tests
Two different types of set-ups have been adopted in tests studying the behavior of slab-column
connections. These are isolated slab-column connections and slab-column subsystems.
Isolated slab-column connections consist of a column stub integrally cast with an area of
surrounding slab. The dimensions of the surrounding slab are chosen to represent the span of the
lines of contraflexure or zero moment in a continuous slab system. In isolated tests, the slab is either
supported along its boundary and load applied through the column or the column is supported and
the load applied transversely at some distance from the column (FIB, 2001).
Slab-column subsystem tests are not very popular due to their cost. They would usually consist of
more than one column stub or columns integrally cast with an area of surrounding slab whose
boundaries represent lines of contraflexure.
1.5 Objectives
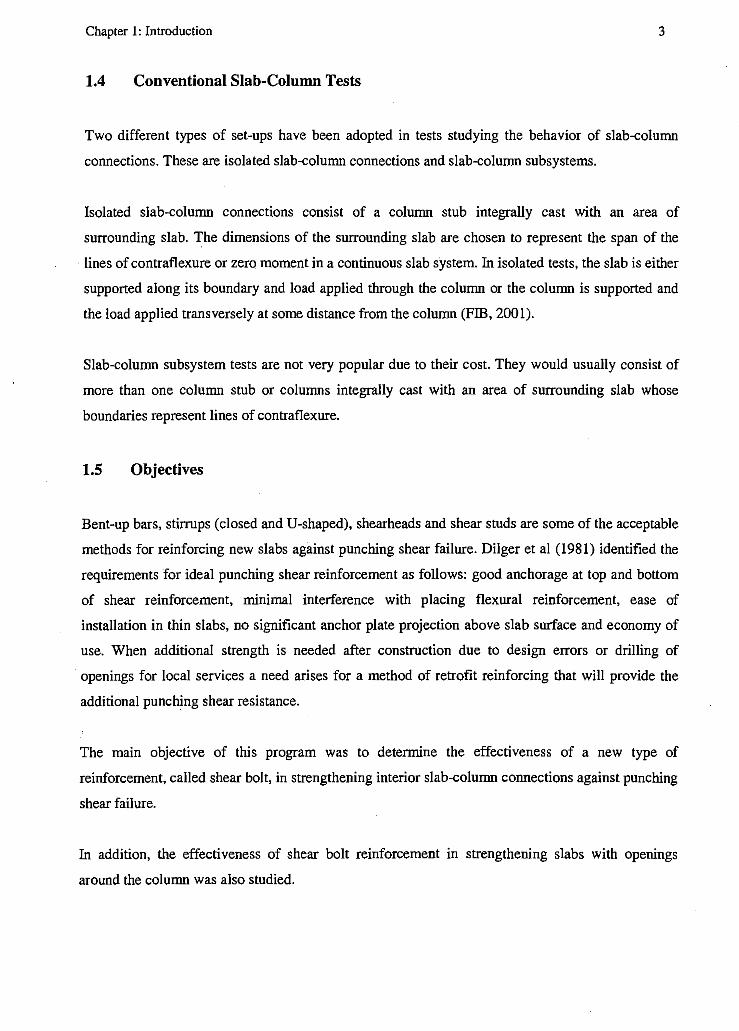
Bent-up bars, stirrups (closed and U-shaped), shearheads and shear studs are some of the acceptable
methods for reinforcing new slabs against punching shear failure. Dilger et al (1981) identified the
requirements for ideal punching shear reinforcement as follows: good anchorage at top and bottom
of shear reinforcement, minimal interference with placing flexural reinforcement, ease of
installation in thin slabs, no significant anchor plate projection above slab surface and economy of
use. When additional strength is needed after construction due to design errors or drilling of
openings for local services a need arises for a method of retrofit reinforcing that will provide the
additional punching shear resistance.
The main objective of this program was to determine the effectiveness of a new type of
reinforcement, called shear bolt, in strengthening interior slab-column connections against punching
shear failure.
In addition, the effectiveness of shear bolt reinforcement in strengthening slabs with openings
around the column was also studied.

Chapter 1: Introduction 4
1.6 Scope of Research
The present study was an experimental investigation of interior slab-colunm connections. A study
on the use of shear bolts in strengthening edge slab colunm connection was previously carried out
by El-Salakawy et al (2003).
Six isolated slab-colunm specimens representing interior slab-colunm connections were
constructed. The specimens had varying amounts of punching shear reinforcement and were with or
without openings. Loading, displacement and strain data were collected during testing. The data
was compared to predictions from codes of practice and other analytical methods.
1.7 Contents of Thesis
This thesis is divided into six chapters and three appendices.
Chapter 1 is the introduction and contains a background, objectives and scope of the research
program.
Chapter 2 provides further background information and a review of past research in literature on
punching shear.
Chapter 3 is a detailed description of the test program designed to study the effects of shear bolts.
Chapter 4 summarizes the design process. The stipulations of design specifications are
investigated. The yield line method is presented as well as other methods used.
Chapter 5 contains details of the experimental procedures and observations. Crack patterns, strain
history and maximum deflections are discussed.
Chapter 6 reviews the results and data from the test in light of codes of practice and other
analytical methods.
i
J 11''.1. 1·, I! l'I'
iii
, I
h ,,111 ''I ,II! :1·!

Chapter I: Introduction 5
Chapter 7 contains the conclusions drawn from this study and recommendations are provided for
further research.
Presented in the appendices is a print out of the elastic frame analysis and graphs showing the data
collected during testing for all slabs.
I I I 11
11 11

Chapter2
Review of Literature
2.1 Punching Shear Models
2.1.1 Rotational Models
2.1.1.1 Kinnunen and Nylander
Kinnunen and Nylander (1960) published the first mathematical model for punching shear. Their
model esseQtially considered a circular polar-symmetric slab supported by a centralized column and
loaded externally with a uniformly distributed load on the slab area. The derivation was based on
experimental testing on 61 slabs not reinforced transversely. The model consists of rigid sectors
outside the punching cone of a typical punching shear failure. The boundaries of the sectors consist
of two radial crack planes and an inclined crack surface. Further, the sectors are supported by a
triaxially compressed truncated conical shell extending from the column to the root of the inclined
shear crack surface.
Failure criteria were defined as a limitation on either the inclined radial compressive stress or the
tangential compressive strain at the shear crack. Kinnunen and Nylander derived Equation 2.1 and
2.2 to predict the ultimate load of a non-shear-reinforced slab by iteration of the ratio of the
concrete compression zone kx such that Vu,, and Vu,, are equal..
where,
I 2kx +--
v., = K=d 2kx-~TJ-cr,uf(a) ••. , k
vu,
f(a) =
I+.....£ T]
tana(I-tana)
I+tan 2 a
6
(2.1)
(2.2)
Chapter 2: Review of Literature
k, = concrete compression zone
T/ = column size to depth ratio
d = effective depth
a = inclination of conical shell
O'cu = ultimate concrete stress
8 = [slab
d
ru = radius of conical shell
r1 = radius of yielded circular area inside conical shell
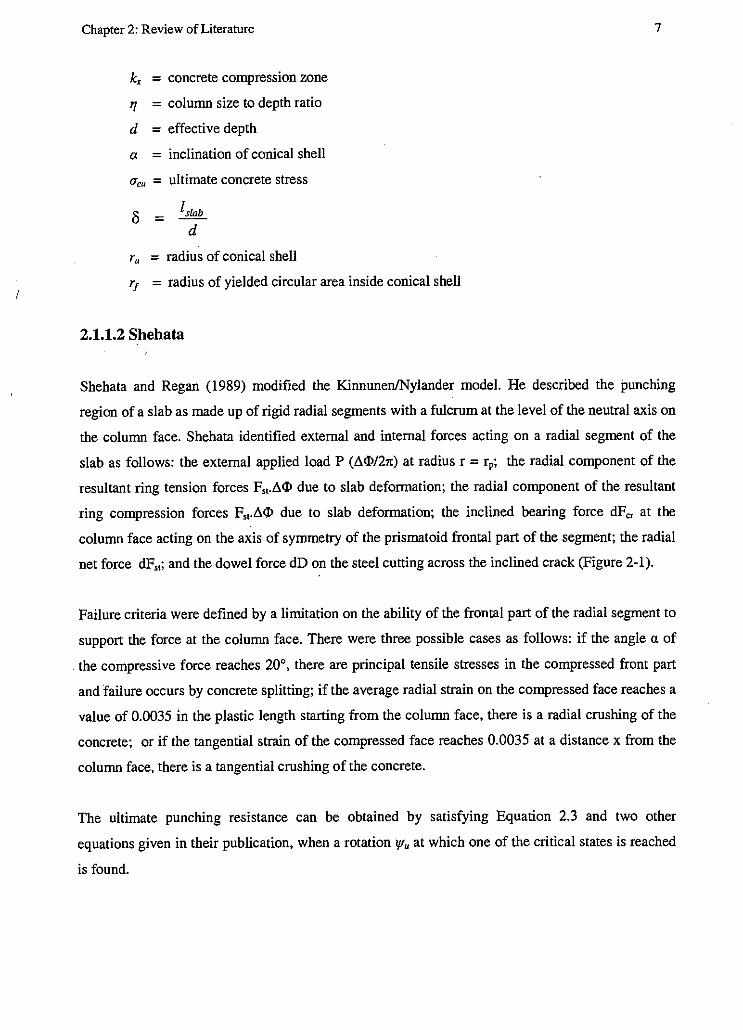
2.1.1.2 Shehata
7
Shehata and Regan (1989) modified the Kinnunen/Nylander model. He described the punching
region of a slab as made up of rigid radial segments with a fulcrum at the level of the neutral axis on
the column face. Shehata identified external and internal forces acting on a radial segment of the
slab as follows: the external applied load P (Ll<l>/21t) at radius r = rp; the radial component of the
resultant ring tension forces F,..11<1> due to slab deformation; the radial component of the resultant
ring compression forces F,..11<1> due to slab deformation; the inclined bearing force dF" at the
column face acting on the axis of symmetry of the prismatoid frontal part of the segment; the radial
net force dF,.; and the dowel force dD on the steel cutting across the inclined crack (Figure 2-1).
Failure criteria were defined by a limitation on the ability of the frontal part of the radial segment to
support the force at the column face. There were three possible cases as follows: if the angle a of
the compressive force reaches 20°, there are principal tensile stresses in the compressed front part
and failure occurs by concrete splitting; if the average radial strain on the compressed face reaches a
value of 0.0035 in the plastic length starting from the column face, there is a radial crushing of the
concrete; or if the tangential strain of the compressed face reaches 0.0035 at a distance x from the
column face, there is a tangential crushing of the concrete.
The ultimate punching resistance can be obtained by satisfying Equation 2.3 and two other
equations given in their publication, when a rotation 1/fu at which one of the critical states is reached
is found.

Chapter 2: Review of Literature 8
P ~! ( rp - r0 ) = ( dFsr + dFs,,p + F,1 Llq> + F,,,pLlq>) · Z + dD( rw - r0 ) (2.3)
'• la}
ld-x}J dF~
lb}
P(~J i)m,
Figure 2-1: Shehata's Model (a) Stress Concentration (b) Forces acting on a Segment (c)
Forces acting on a Segment in a Radial Plane (Shehata and Regan, 1989)
where,
D = dowel force
d = effective depth of a slab
rp = radius of a peripheral load or reaction
r0 = radius of the column or loaded area
r w = wedge radius (punching radius)
L1 rjJ = small sectoral angle
Chapter 2: Review of Literature 9
2.1.1.3 Broms
Broms (1990) introduced two principal modifications to the Kinnunen/Nylander rotational model.
First, he adopted standard values of concrete properties rather than calibrated values from test
results. Secondly, he calculated different heights of the compression zone in the radial and
tangential directions opposed to the Kinnunen and Nylander's iterative approach. He further
accounts for unsymmetrical punching and size effect in his modified model. Just like the Kinnunen
and Nylander' s model, two broad failure mechanisms were identified as possible causes of failure
in punching. For the high tangential compressive strain failure mechanism, a limiting value of e,pu
as in Equation 2.4 was proposed from which a value of punching load V, could be calculated (see
Broms, 1990 for the equations for V,).
= 0.0008.( 150 . 2:J0.333 axpu f,
(2.4)
The radial concrete compressive stress failure mechanism comes into play when the compressive
stress in the imaginary conical shell reaches a critical value of 1.1.fc' at the bottom of the shear
crack. The punching load is described by Equation 2.5.
'(300).333 v" "' 0.46( b + 3.5y Jyf, Y
The critical punching load is determined as the lesser of V, and V0 •
where,
Xpu = height of the compression zone at flexure in the tangential direction when punching occurs
axpu = height of the equivalent rectangular stress block with the stress f', y = approximate thickness of conical shell
b = diameter of column
(2.5)
Chapter 2: Review of Literature 10
2.1.2 Models based on Classical Plasticity Theory
2.1.2.1 Braestrup et al
Braestrup et al (1976) observed that there are distinct surfaces of discontinuity when a shear failure
occurs. They considered these discontinuities to be narrow, rigid-plastic regions of concrete that
move relative to each other. By applying classical plasticity theory, they assumed that work
dissipated in the discontinuity could be calculated. This work, added to any work dissipated in the
reinforcement, is then equated to the work done by the applied load causing the relative movement,
to arrive at an upper bound method.
The failure criterion adopted for the concrete in the narrow plastic zone is the modified Coulomb
Yield criterion defined by three parameters: cohesion c, the angle of friction <I>, and the effective
tensile strength J,,. Further, the yield criterion was described as a combination of two parts: the
sliding criterion in Equation 2.6 and the separation criterion in Equation 2.7.
,; = c-atan<j> (2.6)
= f .. (2.7)
For the case of punching shear, an upper bound solution for the axisymmetric punching strength of
a slab was derived. In general implicit form, the total work dissipated in a failure surface is obtained
from Equation 2.8.
h
W; = ofF(r,r')dx 0
And the external work done by load is Pli
(2.8)
The work equation derived is shown in Equation 2.9. The explicit form is solved by variational
calculus from which the lowest upper bound and hence the solution can be found.
h
P = fF(r,r')dx (2.9) 0
Chapter 2: Review of Literature 11
where,
o = virtual displacement
F(r,r) = function of r and r'
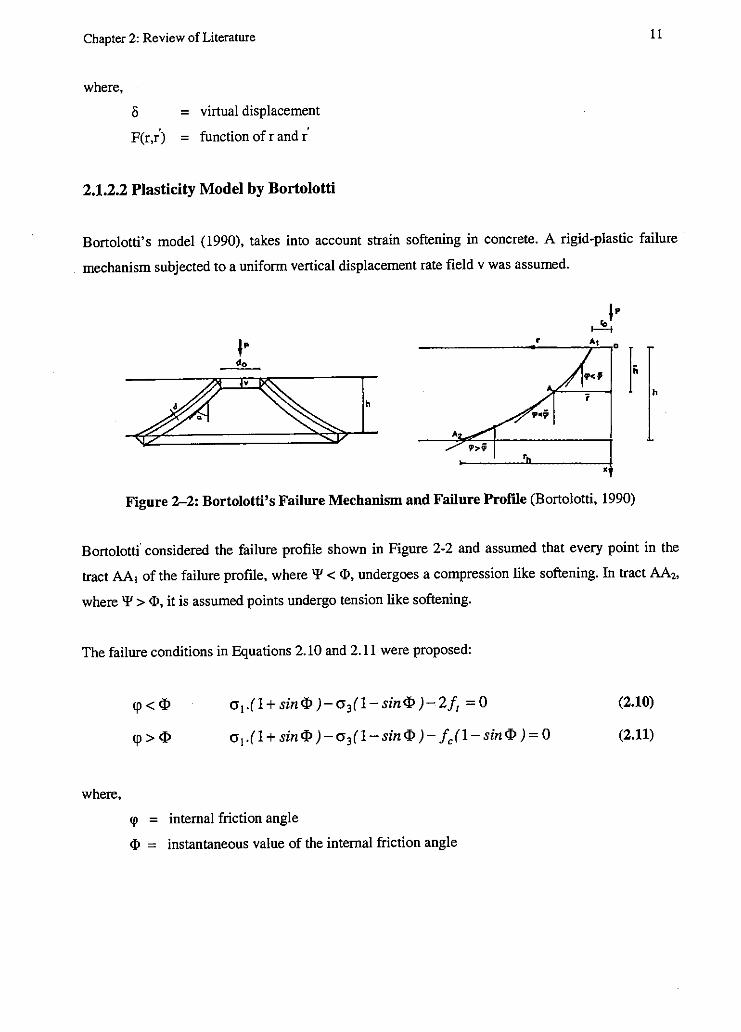
2.1.2.2 Plasticity Model by Bortolotti
Bortolotti's model (1990), takes into account strain softening in concrete. A rigid-plastic failure
mechanism subjected to a uniform vertical displacement rate field v was assumed.
,. i-!!!-t
r ., D I·
h
Figure 2-2: Bortolotti's Failure Mechanism and Failure Profile (Bortolotti, 1990)
Bortolottf considered the failure profile shown in Figure 2-2 and assumed that every point in the
tract AA, of the failure profile, where q, < <I>, undergoes a compression like softening. In tract AA2,
where q, > <I>, it is assumed points undergo tension like softening.
The failure conditions in Equations 2.10 and 2.11 were proposed:
where,
<p < <I>
<p > <I>
cr 1.(l + sin<I> )-all-sin<I> )-2!, = 0
cr1 .(1 + sin <I> )-all-sin<I> )- f/1- sin<I>) = 0
<p = internal friction angle
<I> = instantaneous value of the internal friction angle
(2.10)
(2.11)
Chapter 2: Review of Literature 12
2.1.3 Other Models
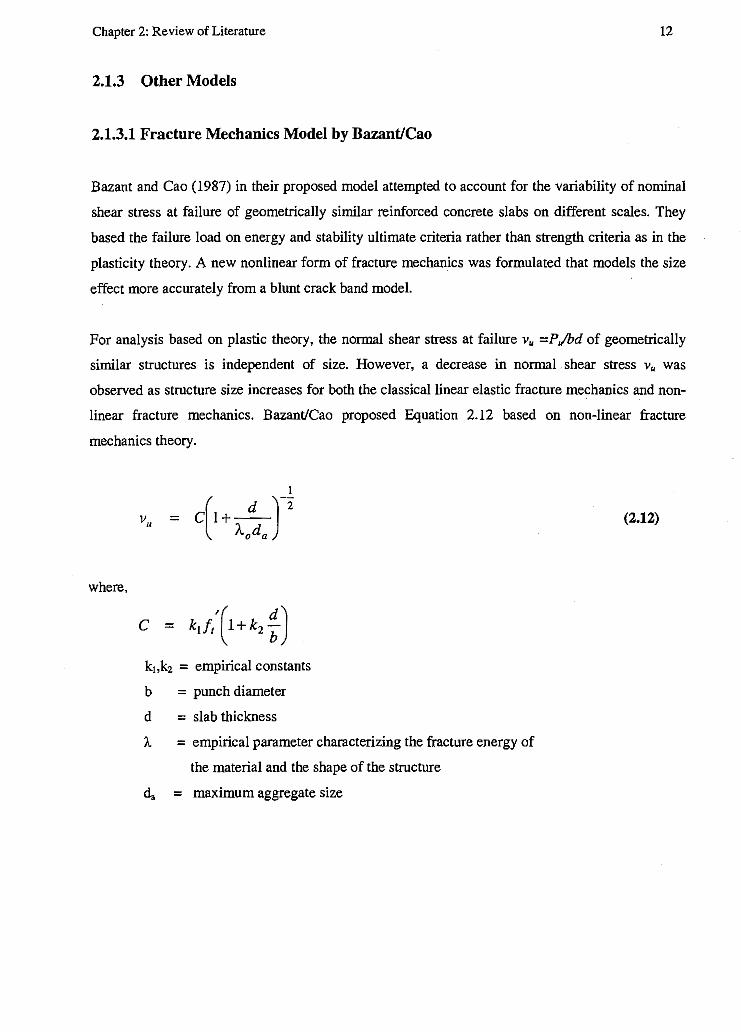
2.1.3.1 Fracture Mechanics Model by Bazant/Cao
Bazant and Cao ( 1987) in their proposed model attempted to account for the variability of nominal
shear stress at failure of geometrically similar reinforced concrete slabs on different scales. They
based the failure load on energy and stability ultimate criteria rather than strength criteria as in the
plasticity theory. A new nonlinear form of fracture mechanics was formulated that models the size
effect more accurately from a blunt crack band model.
For analysis based on plastic theory, the normal shear stress at failure Vu =P ,/bd of geometrically
similar structures is independent of size. However, a decrease in normal . shear stress Vu was
observed as structure size increases for both the classical linear elastic fracture mechanics and non
linear fracture mechanics. Bazant/Cao proposed Equation 2.12 based on non-linear fracture
mechanics theory.
(2.12)
where,
k1,k2 = empirical constants
b = punch diameter
d = slab thickness
:I.. = empirical parameter characterizing the fracture energy of
the material and the shape of the structure
d, = maximum aggregate size

Chapter 2: Review of Literature 13
2.1.3.2 Truss Model for Two-way Shear by Alexander and Simmonds
Alexander and Simmonds (1987) developed a quantitative model for punching based on the
plasticity theory. They suggest that an appropriate model for both ultimate capacity and slab
column connection behavior must account for the following variation in parameters: the overall
connection geometry, the concrete strength, and the yield strength of flexural reinforcement.
Alexander and Simmonds proposed a 3-D space-truss model composed of concrete compression
struts and steel tension ties. The compression struts were either parallel to the plane of the slab
(anchoring struts) or were at some angle et to the plane of the slab (shear struts). The shear struts
were further differentiated into:
• Gravity Struts: these oppose the downward movement of the slab relative to the column and are
tied by top mat steel.
• Uplift Struts: Shear struts that oppose the upward movement of the slab relative to the column
and are tied by bottom mat steel.
Figure 2-3 shows a qualitative description of the truss model for punching shear. A failure criterion
was defined in terms of three possible modes: first, failure of the tension tie, second, failure of the
compression struts and lastly, a shear strut failure, which may occur if the out of plane component
of the compression strut exceeds the confining strength of the slab.
Figure 2-3: Assembly of Load Resisting Struts (Alexander and Simmonds, 1987)
Chapter 2: Review of Literature 14
2.1.3.1 Bond Model by Alexander and Simmonds
Alexander and Simmonds (1992) developed a model describing the behavior of concentrically
loaded flat-plate-column connections at failure. Their bond model, which is a modification of
Alexander-Simmonds (1987), gave a description of the mechanism of shear transfer for
orthogonally reinforced slab-column connections that is consistent with test observations.
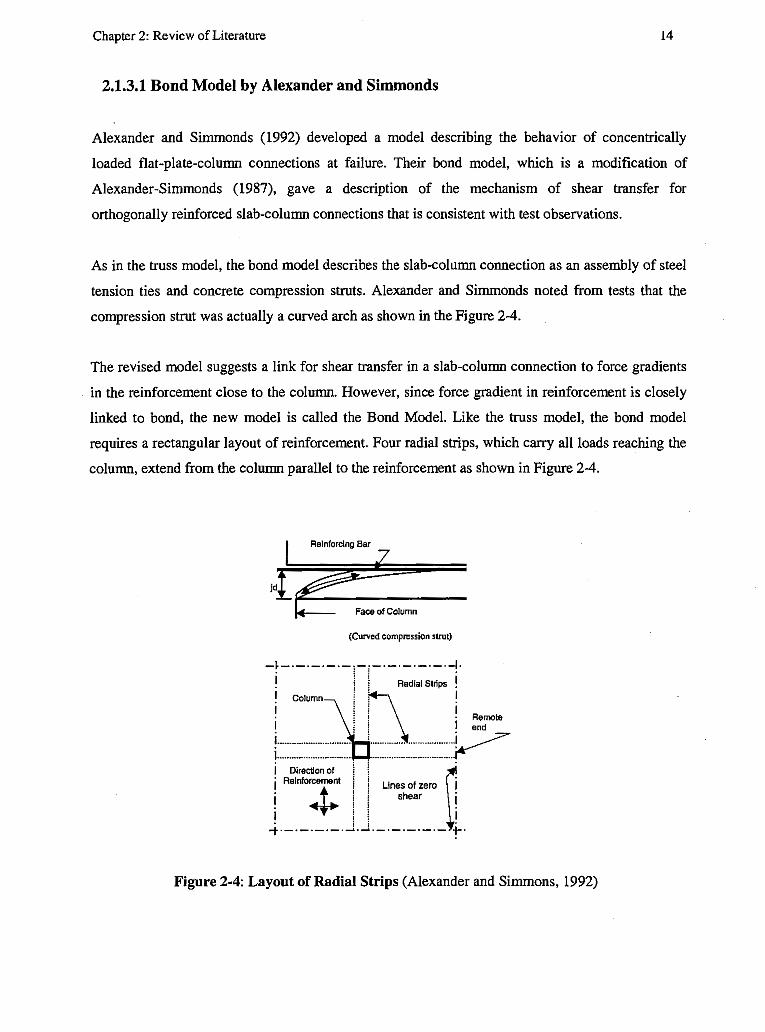
As in the truss model, the bond model describes the slab-column connection as an assembly of steel
tension ties and concrete compression struts. Alexander and Simmonds noted from tests that the
compression strut was actually a curved arch as shown in the Figure 2-4.
The revised model suggests a link for shear transfer in a slab-column connection to force gradients
in the reinforcement close to the column. However, since force gradient in reinforcement is closely
linked to bond, the new model is called the Bond Model. Like the truss model, the bond model
requires a rectangular layout of reinforcement. Four radial strips, which carry all loads reaching the
column, extend from the column parallel to the reinforcement as shown in Figure 2-4.
Reinforcing Bar
Face of Column
(Cwved compression strut)
-1-·-·-·-·-,-,-·-·-·---·~· ! j ! Radlal Strips !
i Column~! /[\ : , : : · Remote ! j ! ! end ! ........... _............. '..... ....... ... .. ....... ! ..-?" , .......................... -.................................. ~ i Ofrection of / ! ~-j Reinforcement i ! Lines of zero j ! + ) j shear ! I.._..,; I ~--·-·----~·j·-·-·-·-·- +·
Figure 2-4: Layout of Radial Strips (Alexander and Simmons, 1992)
Chapter 2: Review of Literature 15
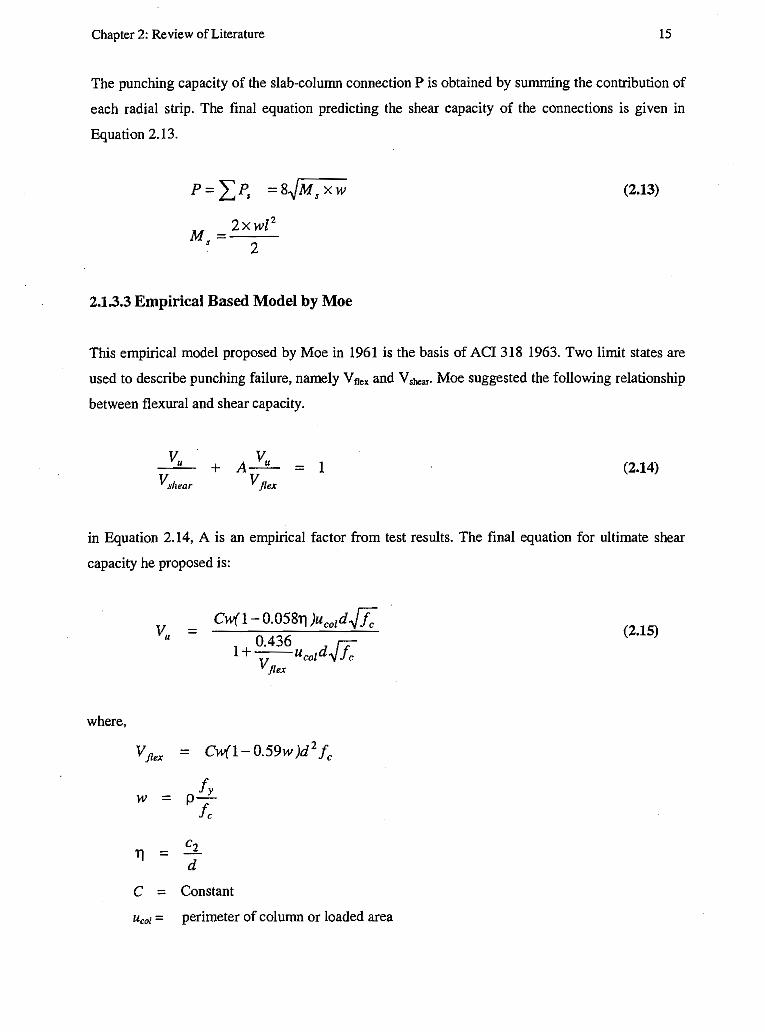
The punching capacity of the slab-column connection P is obtained by summing the contribution of
each radial strip. The final equation predicting the shear capacity of the connections is given in
Equation 2.13.
P= I;P, =8~M,xw
M = 2xwl2
' 2
2.1.3.3 Empirical Based Model by Moe
(2.13)
This empirical model proposed by Moe in 1961 is the basis of ACI 318 1963. Two limit states are
used to describe punching failure, namely Vfl,x and V,hea,· Moe suggested the following relationship
between flexural and shear capacity.
(2.14)
in Equation 2.14, A is an empirical factor from test results. The final equation for ultimate shear
capacity he proposed is:
where,
w =
YJ =
=
= Ci« 1- 0.59w )d 2 fc
Jy p-
C2
d
ie
C = Constant
u,01 = perimeter of column or loaded area
(2.15)
Chapter 2: Review of Literature 16
2.2 Shear Design Procedures for Reinforced Concrete Slabs
The various reinforced concrete design standards (ACL CSA, BS8110, Euro code, Model Code)
examined are based on a limit state design. The requirements for shear design in all the codes is
such that the capacity must be greater than the nominal load, stated as follows:
where,
v.
v.
:5 v.
= V
u·d
V. = Ve+ Vs
v. = nominal shear capacity of the critical section
v. = ultimate shear stress
Ve = punching shear resistance of concrete
V, = punching resistance of the steel
(2.16)
(2.17)
(2.18)
All the standards specify that in shear reinforced slabs, the nominal shear stress must be limited to
the resistance of the slab at a critical perimeter. And then checks are made at outer perimeters such
that the shear stress does not exceed the resistance anywhere at the connection.
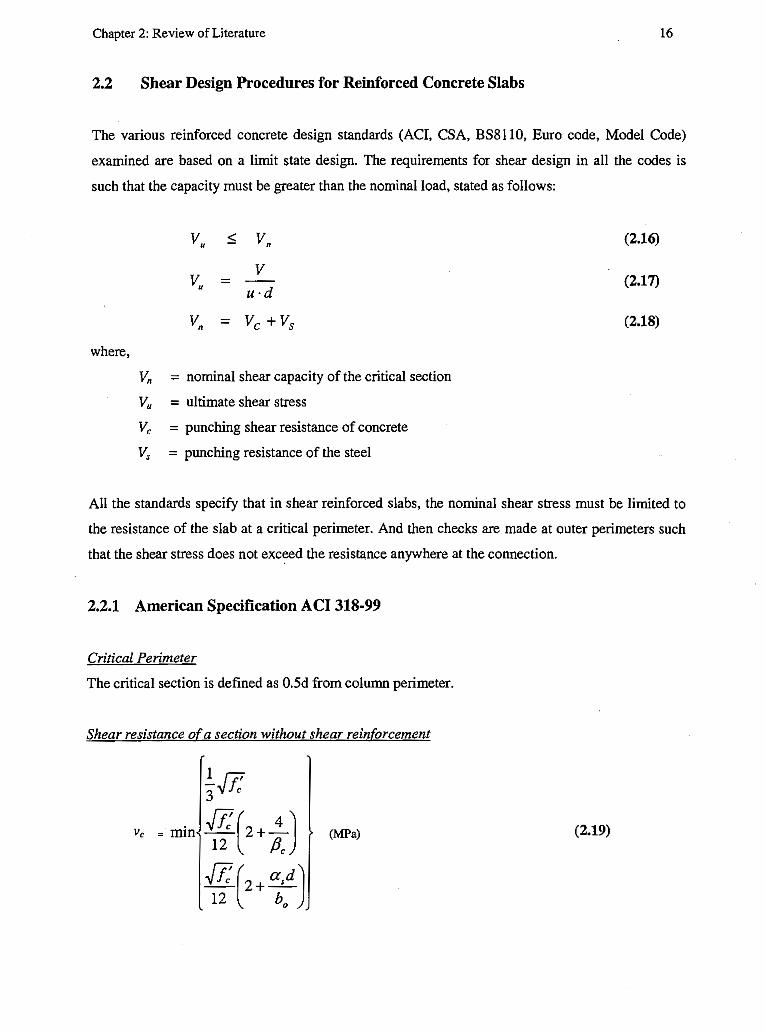
2.2.1 American Specification ACI 318-99
Critical Perimeter
The critical section is defined as 0.5d from column perimeter.
Shear resistance ofa section without shear reinforcement
!_? 3
,Jlc
Ve = min ft(2 +_±_) 12 /Jc
(MPa) (2.19)
ft(2 + a,d) 12 b
0

Chapter 2: Review of Literature
a., = 40 for interior column, ~' = column aspect ratio
Shear resistance with shear reinforcement
V, :<:: 1/>V, (2.20)
rp = 0.85 for shear
v, = Ve.+ Vs (2.21)
where,
v, = 1/>.,A,,,Jy,
bos (2.22)
Jyv :<:: 414MPa
For headed shear reinforcement, maximum resistance of concrete with shear reinforcement,
v, = 0.167.?.¢,.[i;
Maximum shear resistance of section with shear reinforcement
where,
vfmax :<:: 0.67 .?.¢,.ff:
Avs = the area of shear reinforcement
f,, = yield strength of shear reinforcement
bo = length of the critical perimeter
s = spacing of concentric rows of shear reinforcement around a column
y = strength factor of concrete
cp, = resistance factor for concrete
2.2.2 Canadian Standard CSA A23.3-94
Critical Perimeter
The critical section is defined as 0.5d from column perimeter
(2.23)
(2.24)
17
Chapter 2: Review of Literature
Shear resistance ofa section without shear reinforcement
0.4.[l;
min 0.2.[1;(1+ ;J (MPa)
ft(o.2+ iod)
Shear resistance with shear reinforcement
where,
¢, A,, f Y"
bos v, =
'
(2.25)
(2.26)
(2.27)
(2.28)
For headed shear reinforcement maximum resistance of concrete with shear reinforcement,
(2.29)
Maximum shear resistance of section with shear reinforcement
(2.30)
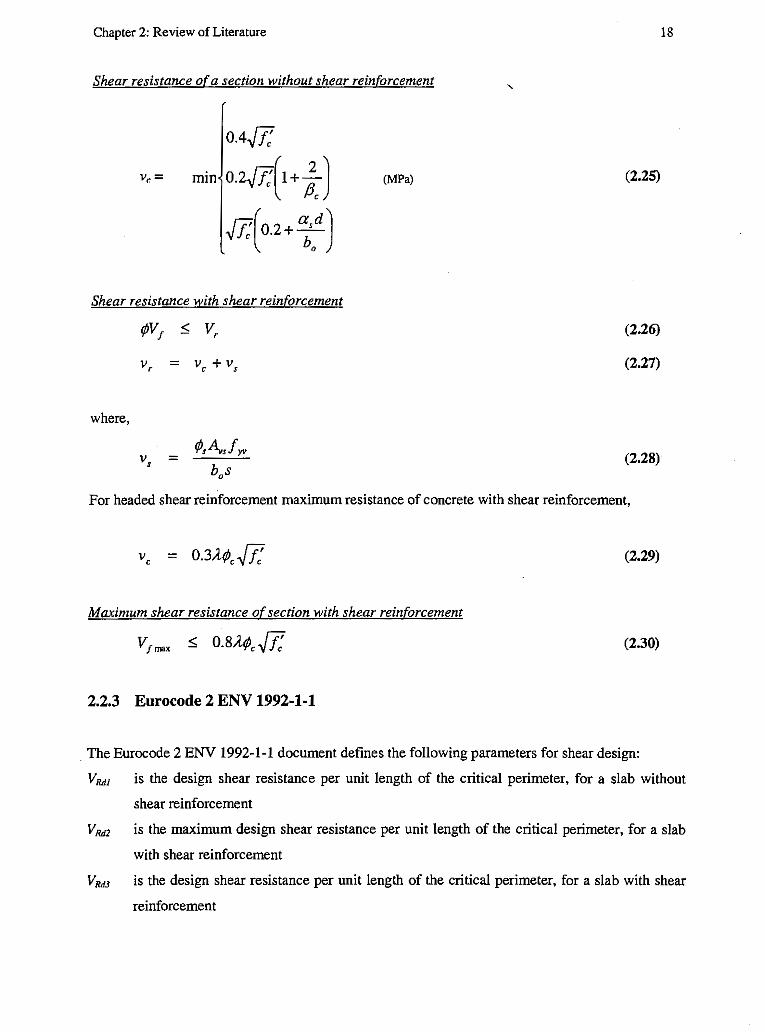
2.2.3 Eurocode 2 ENV 1992-1-1
. The Eurocode 2 ENV 1992-1-1 document defines the following parameters for shear design:
18
VRJ1 is the design shear resistance per unit length of the critical perimeter, for a slab without
shear reinforcement
VRd2 is the maximum design shear resistance per unit length of the critical perimeter, for a slab
with shear reinforcement
VRdJ is the design shear resistance per unit length of the critical perimeter, for a slab with shear
reinforcement

Chapter 2: Review of Literature
Vsd the shear force per unit length along the critical section
Critical Perimeter
The critical perimeter is defined as the perimeter surrounding the loaded area and at a
distance 1.5d from it.
Shear resistance ofa section without shear reinforcement
When,
v sd :,; v Rdl , no shear reinforcement is required
v.d, =r.dk(l.2+40p1)d
TRd = 0.25fc,k0.05f rc
k = (1.6- d) :2'.1.0
Shear resistance ofa section with shear reinforcement
When Equation 2.35 is not satisfied, shear reinforcement is required such that
v,d :,; v.d,
where,
+ °" A f sina L..J SW yd u
Maximum shear resistance of section with shear reinforcement
where,
v.,d = shear force per unit length along critical section
f,,d = design yield stress of the reinforcement
p1 = equivalent longitudinal reinforcement ratio
TRd = basic Shear strength of members without shear reinforcement
u = perimeter of critical section for punching shear
a = angle between reinforcement and the plane of the slab
19
(2.31)
(2.32)
(2.33)
(2.34)
(2.35)

Chapter 2: Review of Literature
2.2.4 CEB-FIP Model Code 90
Critical Perimeter
The critical section is defined as 2.0d from the column perimeter.
Shear resistance ofa section without shear reinforcement
It should be verified that
Vsdc 5 VRdl
where,
1
VRdl = 0.12;(100p · f,k )3
and,
; = 1+~200/d
Shear resistance ofa section with shear reinforcement
The model requires that punching shear resistance be verified in three zones
• The zone immediately adjacent to the loaded area
P,d 5 u0 d(0.5f,d2 )
• The zone in which the shear reinforcement is placed
P,d 5 0.75V Rd! + 1.5.!!._A,wf ywd sin a S,
f,wd 5 300 MPa
• The zone outside the shear reinforcement
1
P,d 5 0.12;(100P.f,k) 3 un,,fd
20
(2.36)
(2.37)
(2.38)
{2.39)
(2.40)

Chapter 2: Review of Literature 21
Maximum shear resistance of section with shear reinforcement
:,; 0.5 f,a2 (2.41)
J,d2 = 0.6(1- f. /250). u • . d
where,
v,d, = shear stress on concrete section
J,, = characteristic strength of concrete
f.,wa = characteristic strength of steel
p1 = ratio of flexural tensile reinforcement
u0 = length of periphery of column or loaded area
s, = radial spacing of layers of shear reinforcement
u •. ,1 = the critical perimeter 2.0 d from the out layer of shear reinforcement
A,w = area of shear reinforcement in a layer around the column
2.3 Selected Experimental Studies on Punching Shear
2.3.1 Dilger and Ghali: Shear Reinforcement for Concrete Slabs
Dilger and Ghali (1981) investigated four different types of shear reinforcement at the University of
Calgary. Figure 2-5 shows three of the types studied.
They tested 40 slab-column connections with various types of shear reinforcement they developed.
Most of the specimens were subjected to pure concentric axial load. The flexural reinforcement
provided had a ratio of approximately 1.1 % and concrete design strength was 28 MPa. From their
tests, they reported that full yield strength of the types of shear reinforcement was reached and that
only shear in excess of 0.33"1/( (MPa) needed to be resisted by the shear reinforcement. CSA
A23.3-M77 and ACI 318-1977 both require that shear stresses higher than 0.17"1/ ( (MPa) be
carried by shear steel (CSA now requires 0.2"1/( due to lower load safety factors).
They compared their findings to ACI Specification 318-1977 and Canadian Standard CAN A23.3-

Chapter 2: Review of Literature 22
M77 (which both required 0.17'1/ f,' (MPa)) and an ultimate nominal shear resisted by steel and
concrete as 0.5'1/f,' (MPa). A typical load-deflection curve from their test is shown in Figure 2-6.
They suggested from their experiment that the upper limit of shear resistance could be as high as
0.67'1/fc' (MPa). They also found that vc' decreases as the distance of the critical section from the
column face increases.
They suggested design rules for punching shear at the critical section at d/2 from the column face.
6 8toR TO 1-K)t.D ELEMENTS 10G£'THER
---H0t.ES FOR ATTAQMHT TO FORMWORK
I I I I
:ft= _.:h-n=-1 I I I
,,, STUDS WITH SClJARE ANCHOR PLATES
W£LO
a D D D
Q D Cl Q
0 D Q D
:::o::: DOD QDCI
ODD DOD
D O C Cl
a o a a
a o a a
I<)
J.BBL ~n~ ,r
(bl
Figure 2-5: Types of Shear Reinforcement Investigated by Dilger and Ghali
(Dilger and Ghali, 1981)
Chapter 2: Review of Literature
'" (600)
0 04 UOl
0.B 120)
,~ 130)
, .. i40}
SLAB 'oEFL£CTIOH, ln.(mPl'I)
2.0 150)
2A {601
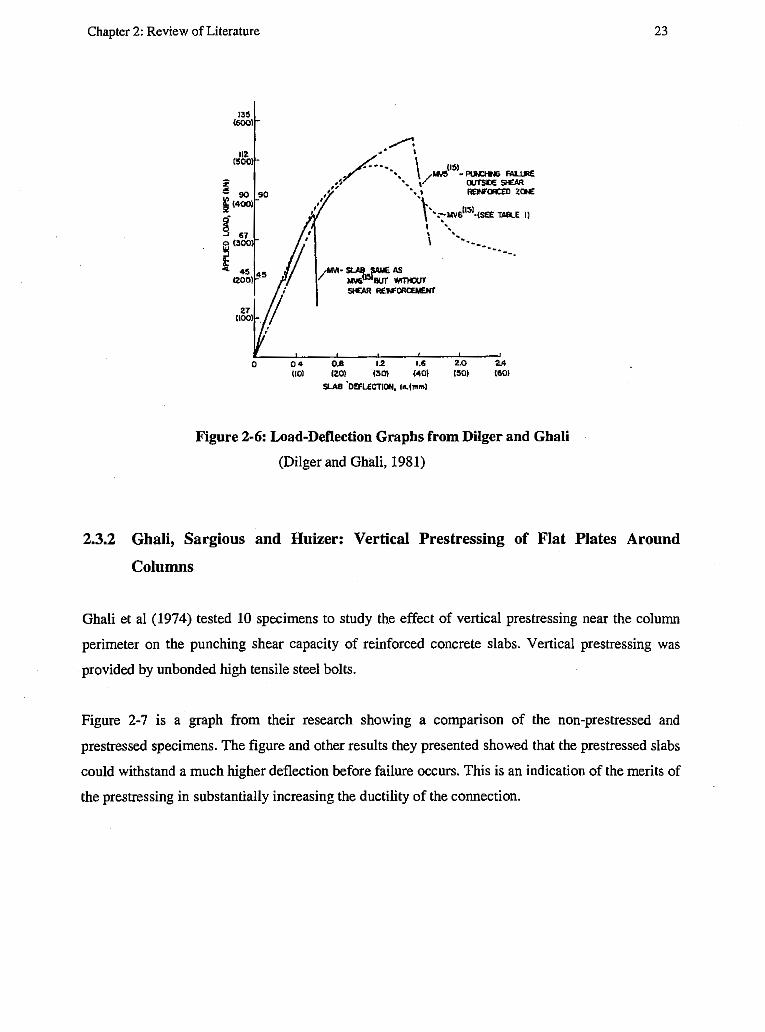
Figure 2-6: Load-Deflection Graphs from Dilger and Ghali
(Dilger and Ghali, 1981)
23
2.3.2 Ghali, Sargious and Huizer: Vertical Prestressing of Flat Plates Around
Columns
Ghali et al (1974) tested 10 specimens to study the effect of vertical prestressing near the column
perimeter on the punching shear capacity of reinforced concrete slabs. Vertical prestressing was
provided by unbonded high tensile steel bolts.
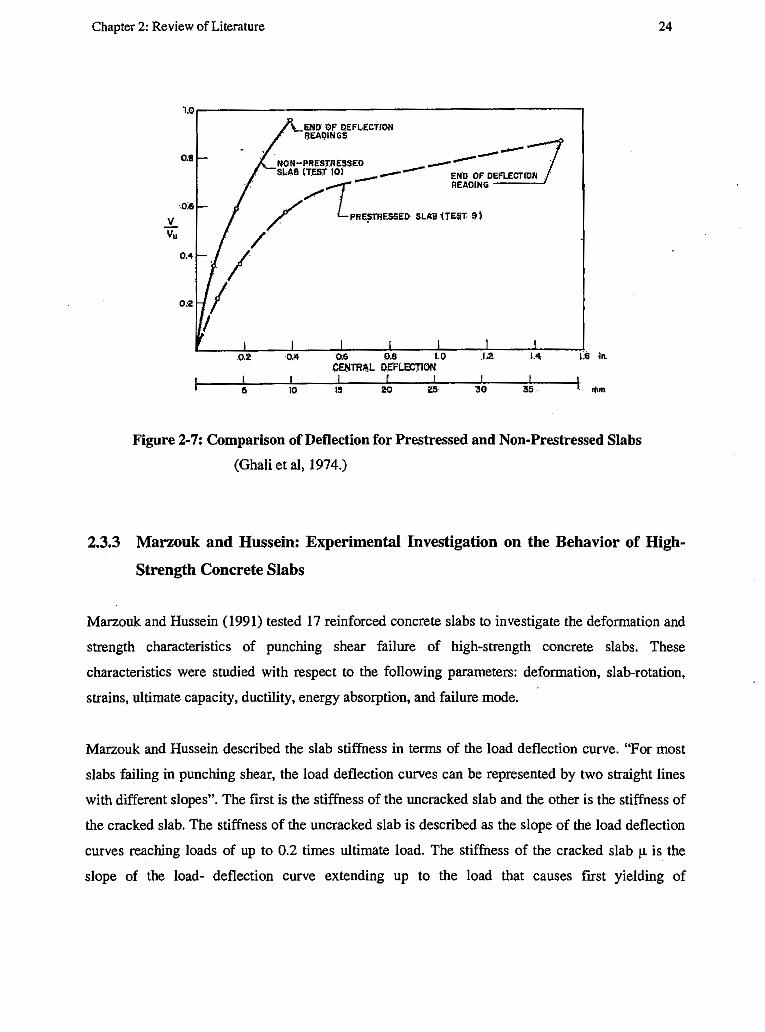
Figure 2-7 is a graph from their research showing a comparison of the non-prestressed and
prestressed specimens. The figure and other results they presented showed that the prestressed slabs
could withstand a much higher deflection before failure occurs. This is an indication of the merits of
the prestressing in substantially increasing the ductility of the connection.
Chapter 2: Review of Literature
:J_ Yu
1.0
O.B
·.O:&-
/ 0.4 I 02 //
.0.2
! •
END" 'OF DEFL..ECTl"ON l:IEAQIN~S
NON-PRESJ:RESSED --,,,_---~· · SLAB (T.ES1 · 1oj ~ --- END OF DEFLECTION _
1-- R'EAOING
// PRE/rrffESSED SLAB ·(TE1!T· 9)
M n6 0.8 I.D .La 1.4, CE!rn!AL O.EFl.ECJION
I I r I t 10 1• 20 25 30 35
,:~ in.
I '"m
Figure 2-7: Comparison of Deflection for Prestressed and Non-Prestressed Slabs
(Ghali et al, 1974.)
24
2.3.3 Marzouk and Hussein: Experimental Investigation on the Behavior of High
Strength Concrete Slabs
Marzouk and Hussein (1991) tested 17 reinforced concrete slabs to investigate the deformation and
strength characteristics of punching shear failure of high-strength concrete slabs. These
characteristics were studied with respect to the following parameters: deformation, slab-rotation,
strains, ultimate capacity, ductility, energy absorption, and failure mode.
Marzouk and Hussein described the slab stiffness in terms of the load deflection curve. "For most
slabs failing in punching shear, the load deflection curves can be represented by two straight lines
with different slopes". The first is the stiffness of the uncracked slab and the other is the stiffness of
the cracked slab. The stiffness of the uncracked slab is described as the slope of the load deflection
curves reaching loads of up to 0.2 times ultimate load. The stiffness of the cracked slab µ is the
slope of the load- deflection curve extending up to the load that causes first yielding of

Chapter 2: Review of Literature 25
reinforcement. Ductility was also defined as the ratio of the ultimate deflection to the deflection at
first yield.
The variables of their test were slab depth, reinforcement ratio and concrete compressive strength.
They defined three failure types as: pure flexural failure, pure punching failure and ductile shear
failure. Pure flexural failure took place in slabs when most of the reinforcement yielded before
punching occurred and the slab consequently experienced large deflections prior to failure. fu pure
shear failure, the slab showed small deflections, with the yielding of the tension steel being much
localized at the column head. The third type of failure was a transition between the two cases.
They reported a punching shear surface for most slabs forming at a distance of 1.2 to 1.6 times the
slab depth from the column face. One significant conclusion from their paper was that the influence
of concrete strength in the North American codes of practice is conservative and that adopting a
cubic root of the compressive strength will result in more accurate and consistent analysis.
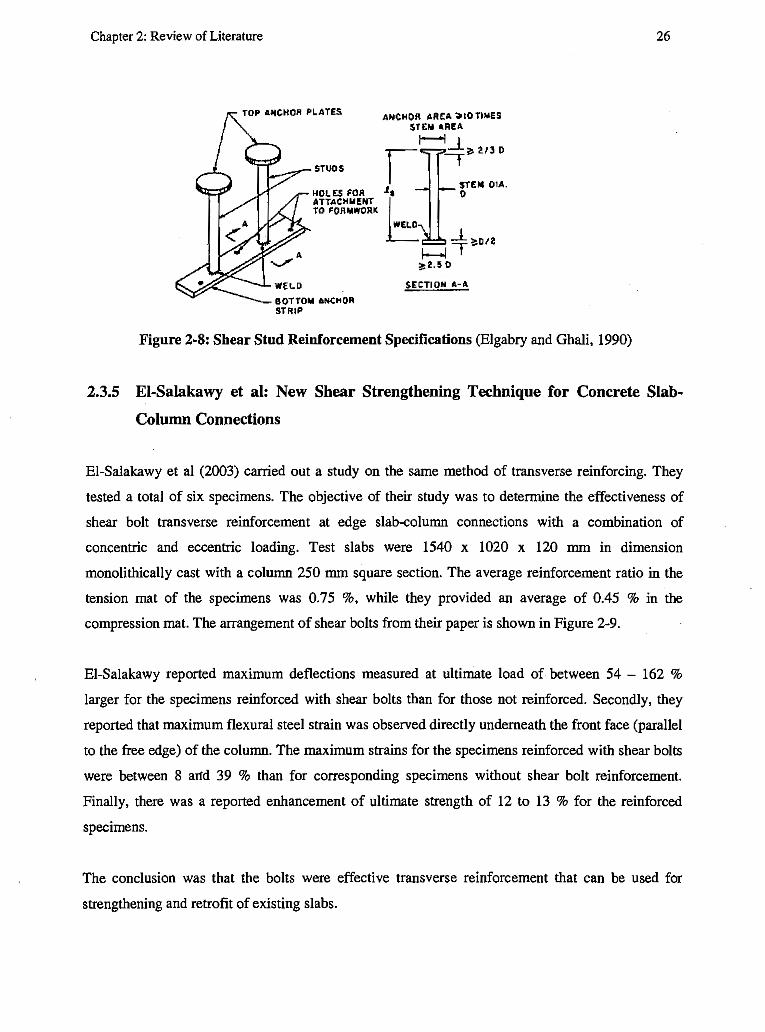
2.3.4 Elgabry and Ghali:Design of Stud-Shear Reinforcement for Slabs
Elgabry and Ghali (1990) presented design and detailing rules for use of shear stud reinforcement
based on previous experimental data. Based on extensive testing, they recommended the following
as illustrated in Figure 2-8:
• Bottom anchors should be in the form of steel strips and its width should be greater than 2.5D,
• Top anchors could be in the form of circular or square plates with the limitations that the areas
be at least 10 times the area of the stem,
• fu the direction parallel to a column face, the distance between anchor strips should not exceed
2d, d is the effective depth of the slab.
• Bottom anchor strips should be aligned parallel to column faces
• Minimum distance of the first peripheral line from the column s0 should be d/4. They suggested
upper limits for both s0 and the spacing s based on the value of the factored shear stress.
Chapter 2: Review of Literature
TOP UICHOFI PLATES A"'CHOR AREA ~IOT1¥ES STEM I\REA
11-"1 _j_;,. V3 D
STUDS I t $1"1EIIC 01A.
HOL E5 F"OA 1$ O ATTACHM!;NT b TO FORlilWORK
BOTTOM 6NCHOR STfUP
WELD, _j__
\--1 T!oD/2
~2-~0
S.ECTION A-A
Figure 2-8: Shear Stud Reinforcement Specifications (Elgabry and Ghali, 1990)
26
2.3.5 EI-Salakawy et al: New Shear Strengthening Technique for Concrete Slab
Column Connections
El-Salakawy et al (2003) carried out a study on the same method of transverse reinforcing. They
tested a total of six specimens. The objective of their study was to determine the effectiveness of
shear bolt transverse reinforcement at edge slab-column connections with a combination of
concentric and eccentric loading. Test slabs were 1540 x 1020 x 120 mm in dimension
monolithically cast with a column 250 mm square section. The average reinforcement ratio in the
tension mat of the specimens was 0.75 %, while they provided an average of 0.45 % in the
compression mat. The arrangement of shear bolts from their paper is shown in Figure 2-9.
El-Salakawy reported maximum deflections measured at ultimate load of between 54 - 162 %
larger for the specimens reinforced with shear bolts than for those not reinforced. Secondly, they
reported that maximum flexural steel strain was observed directly underneath the front face (parallel
to the free edge) of the column. The maximum strains for the specimens reinforced with shear bolts
were between 8 attd 39 % than for corresponding specimens without shear bolt reinforcement.
Finally, there was a reported enhancement of ultimate strength of 12 to 13 % for the reinforced
specimens.
The conclusion was that the bolts were effective transverse reinforcement that can be used for
strengthening and retrofit of existing slabs.

Chapter 2: Review of Literature
'
! Shear Bolts
(j) •
(!) 0 0 0
000 000
Figure 2-9: Typical Arrangement of Shear Bolts in El-Salakawy's Tests
(El-Salakawy et al, 2003)
27
2.3.6 Rankin and Long: Predicting the Punching Strength of Conventional Slab
Column Specimens
Rankin and Long (1987) proposed a method for predicting the strength of conventional slab-column
specimens from rational concepts of various failure modes. The failure modes were classified
broadly as flexural or shear. For either failure mode, in conventional specimens, experiments have
shown that the ultimate load capacity is reached when a truncated cone or pyramid of concrete is
punched through the slab by the loaded column (Rankin and Long).
Long (1975) suggested that punching strength is the lesser of either a flexural or shear criterion of
· failure. Rankin and Long's approach is a modification of Long (1975) in which the ultimate
moment capacity is derived as a (analytically based linear interpolative moment) factor of the yield
moment. The punching shear capacity was based on a semi-empirical relationship of the vertical
shear stress on the critical section for failure. Three possible modes of flexural failure are described
as full-yielding (yield-line), localized compression failure, and partial yielding. The shear mode of
failure is precipitated by internal diagonal tension cracking prior to the development of yielding of
the reinforcement or crushing of the concrete (Long, 1975).
The predicted punching strength of the conventional slab-column specimen was defined as a lesser
of the flexural failure mode or the shear failure mode.
Chapter3
Test Program
3.1 General Description
A total of six slabs of dimensions 1800 mm by 1800 mm by 120 mm were built and tested. A typical
specimen is shown in Figure 3-1. All specimens had the same amount and placement of orthogonal
longitudinal reinforcement. The specimens had column stubs through which the loading was applied
to the slab during testing. Each column had a square cross-section: 150 mm by 150 mm and a height
of 150 mm extending beyond the top and bottom face of the slab. All columns were reinforced with
four 20 mm bars enclosed in four 8 mm ties.
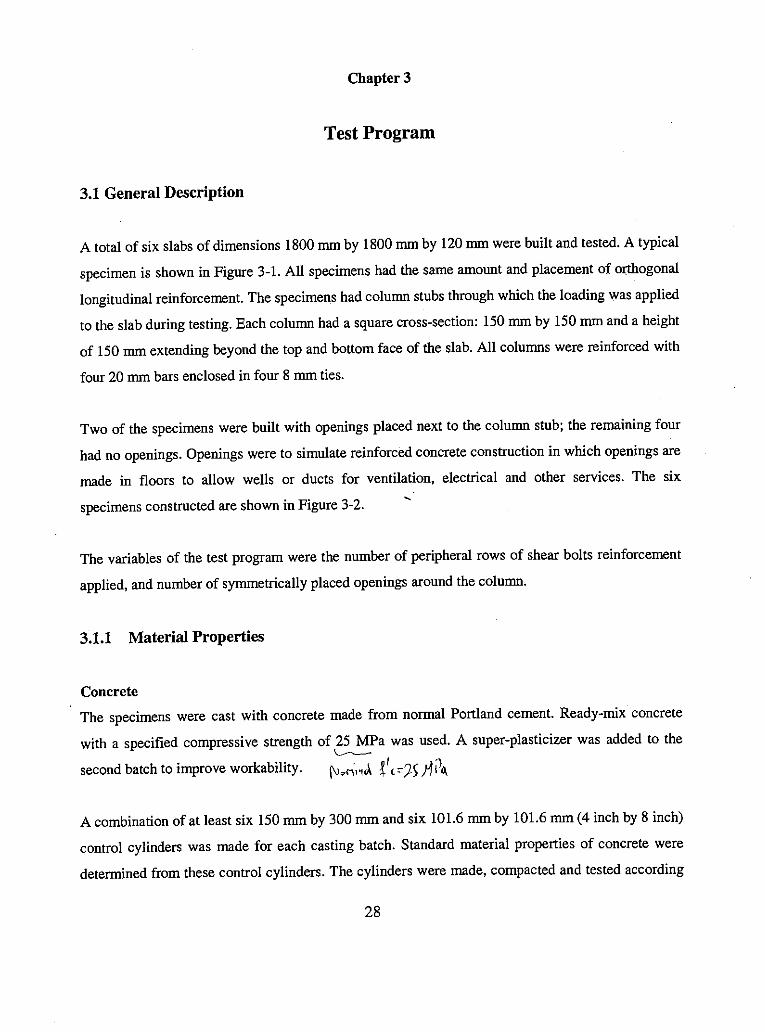
Two of the specimens were built with openings placed next to the column stub; the remaining four
had no openings. Openings were to simulate reinforced concrete construction in which openings are
made in floors to allow wells or ducts for ventilation, electrical and other services. The six
specimens constructed are shown in Figure 3-2. '
The variables of the test program were the number of peripheral rows of shear bolts reinforcement
applied, and number of symmetrically placed openings around the column.
3.1.1 Material Properties
Concrete
The specimens were cast with concrete made from normal Portland cement. Ready-mix concrete
with a specified compressive strength of 25 MPa was used. A super-plasticizer was added to the \...---
second batch to improve workability. (\l,n,,<A f 1 < =') 5 tf ~o.
A combination of at least six 150 mm by 300 mm and six 101.6 mm by 101.6 mm (4 inch by 8 inch)
control cylinders was made for each casting batch. Standard material properties of concrete were
determined from these control cylinders. The cylinders were made, compacted and tested according
28

Chapter 3: Research program 29
to Canadian Standard A23.3.2-9C and A23.3.2-13C, for the compressive strength and splitting
tensile strength of the specimens respectively.
"~ I
b
~---(l---,~=--=-----~- -----/
r--------------------------,tr'~'--------~
' ' ' ' ' ' ' ' ' ' ' '
D
' ' ' ' ' ' ' ' ' ' ' ' ' ' '
L--------------------------------------J
Colur,n
A ~1 [f A
E E E E
0 0 0 0
~ ~
I~
Figure 3-1: Typical Specimen in Plan and Elevation
sir,ple support lines
The control cylinders were cured under the same conditions as the test specimens and compression
tests were carried out at the end of the first test. Splitting tensile tests were carried out later. Table
3-1 lists the results from the material properties tests.
Chapter 3: Research program
r--------------------------------------, ' ' ' ' ' ' ; i ' ' ' ' ' ' ' i c7lmn i ' ' ' ' :
' D :
' ' : '
SB1
~--------------------------------------
r--------------------------------------, ' ' ' ' ' ' ' ' i i ' i ' i
•• •• •• .. ·o· ..
• • • • •• • • •• • •
SB3 ' ' : ' i ' ~--------------------------------------~
r--------------------------------------, ' ' ' ' ' ' ' ' ' ' ' ' ' ' ' ' ' ' I a a I
' ' : . . : : . . : ' Q ' ' ' i ::: ::: / : . : i : : SB5 ! ' ' ' ' ' . . ' ' ' ' ' ' ' ' ' ' ' ' ' ' ' ' ' ' ' ~--------------------------------------~
lab r--------------------------------------, i 1 ' ' : ' ' : ' i : ' : ' : ' : ' : ' ' ' ' j
• • • • ··o·· • • • • •• • •
SB2
~--------------------------------------J
r--------------------------------------1
•• •• •• • • . .. ·o· ...
• • • • • ••• • • •• • • •• SB4
' ' ' : ' ' ' ' ' ' ' ' ' ' ' ' i ' ' ' ' ' : ' ' ' ' ' ' ' ' ' ' ~--------------------------------------~
r--------------------------------------, ' ' ' ' : : ' ' ' ' ' ' ' ' ' ' I a a I
' ' I • • I
' ' ' ' ' ' ' i i ' : i ' ' '
•• •• ···~· . ... ~ ... •• •• •• • •
SB6
' ' ~--------------------------------------~
Figure 3-2: Specimens Tested
30
Shear bolts
Opening
Chapter 3: Research program 31
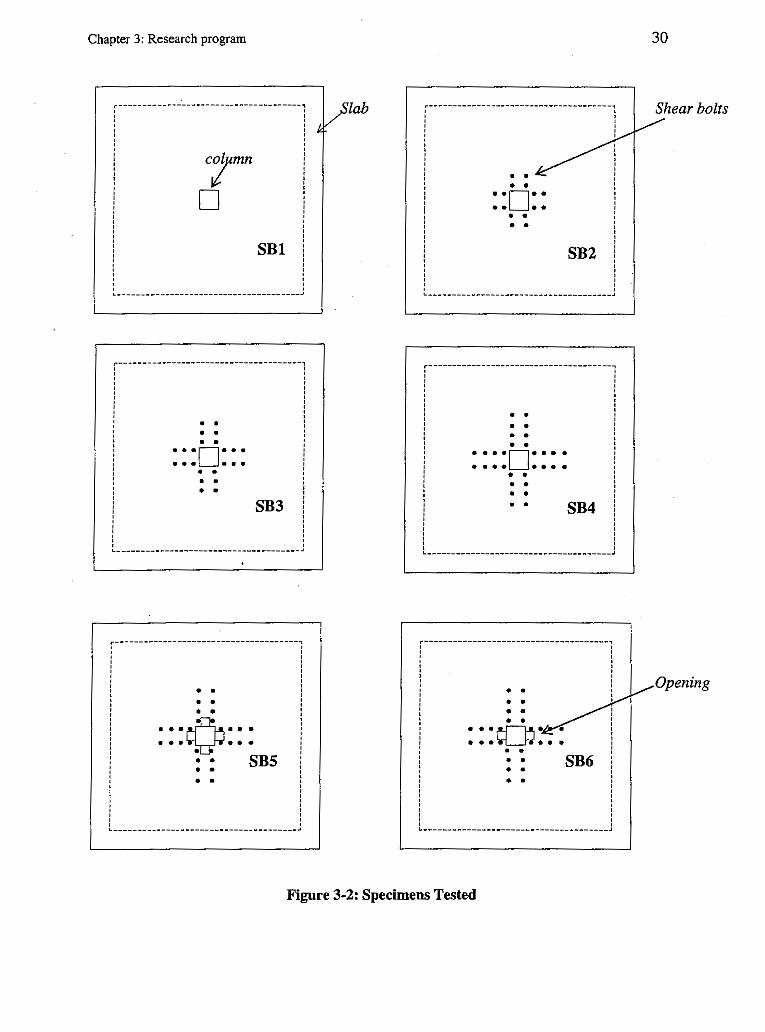
Table 3-1: Compressive Strength of Test Cylinders
Slab Specimens in Compressive Tensile Age at Description group Strength Strength
(MPa) (MPa) testing
4" X 8" 42.0 2.34 25 weeks
150 mm x 300 mm SB2, SB3, SB4 40.9 2.07
' 23 weeks
150 mm x 300 mm SBl, SB5, SB6 44.1 2.19
Reinforcing Steel
Steel used for longitudinal reinforcement was supplied on site pre-bent by Albrecht Steel Ltd. The
top and bottom longitudinal reinforcement mats consist of 10 mm bars. In the column, four 20 mm
bars were used enclosed by 8 mm plain bars as ties. Shear bolts were manufactured and donated by
Continental Steels (Decon). These were designated DECON STUD 3/8 x 5-7/8 in.
Tension tests from standard coupons were carried out to determine the strengths of the steel. The
longitudinal steel comprising of 10 mm ridged bars were tested using reduced cross-section coupons
prepared according to ASTM E 8M-00b. The Shear Bolts were tested without any alterations by
using a bracket in the jaws of the pulling device.
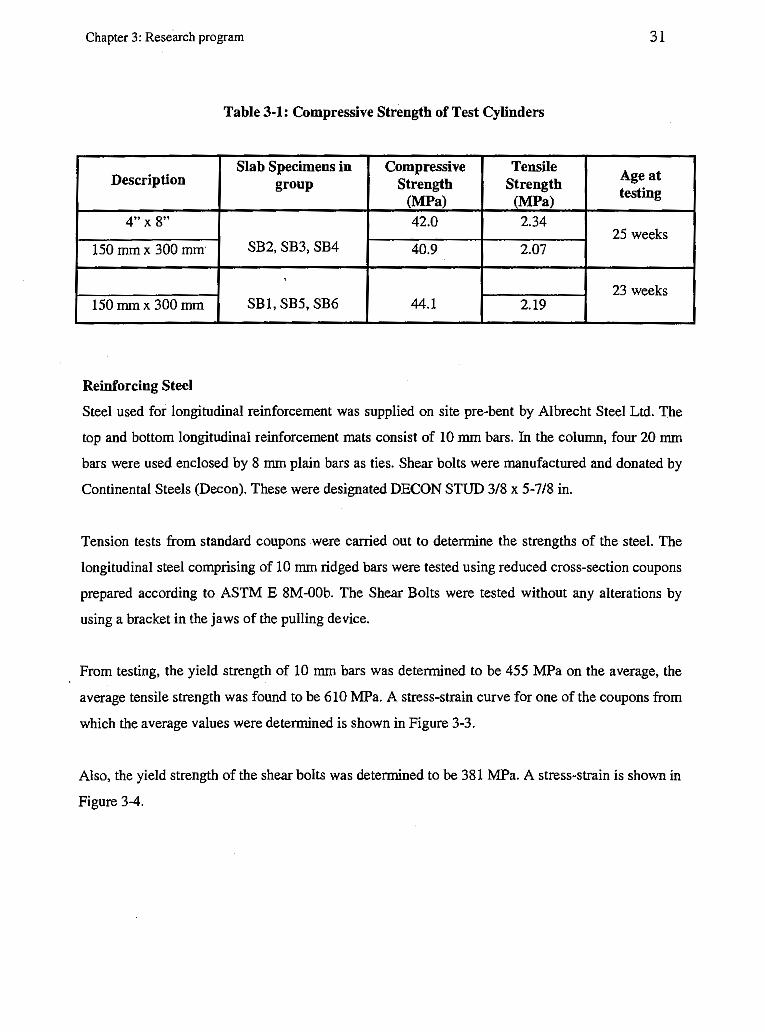
From testing, the yield strength of 10 mm bars was determined to be 455 MPa on the average, the
average tensile strength was found to be 610 MPa. A stress-strain curve for one of the coupons from
which the average values were determined is shown in Figure 3-3.
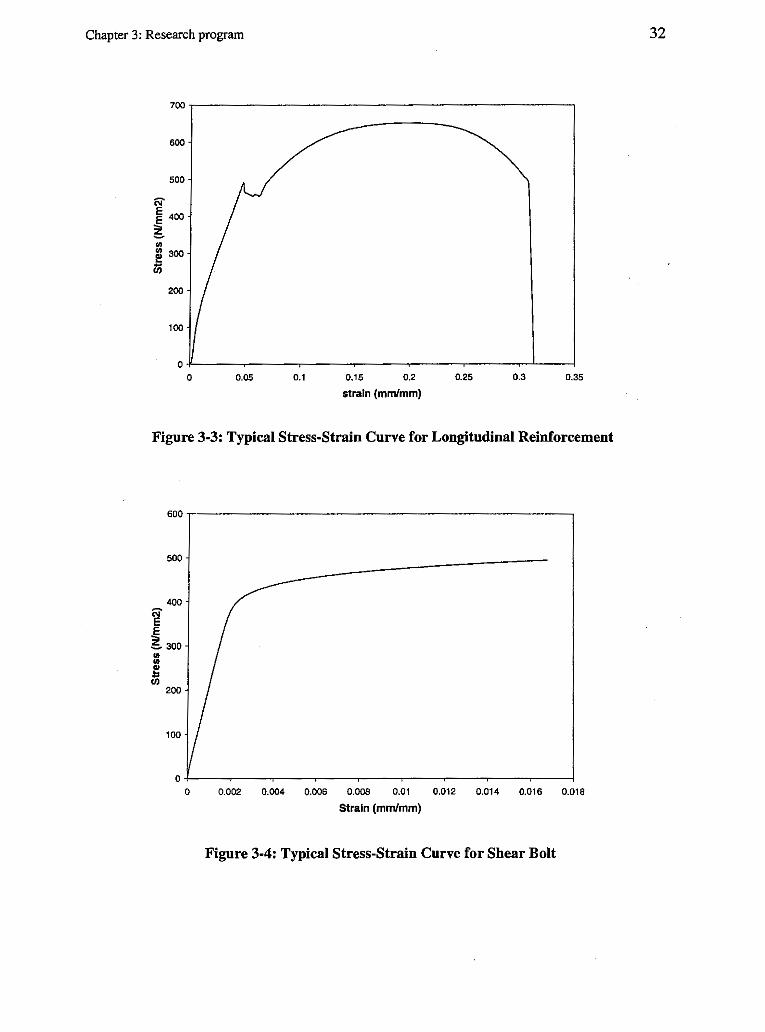
Also, the yield strength of the shear bolts was determined to be 381 MPa. A stress-strain is shown in
Figure 3-4.
Chapter 3: Research program
700
600
500
"' j •oo
.. e aoo Iii
200
100
0 0 0.05 0.1 0.15 0.2
strain (mm/mm)
0.25 0.3 0.35
Figure 3-3: Typical Stress-Strain Curve for Longitudinal Reinforcement
500
400
~ E ~ 300 .. .. i
200
100
0 0.002 0.004 0.006 0.008 0.01 0.012 0.014 0.016 0.018
Strain (mm/mm)
Figure 3-4: Typical Stress-Strain Curve for Shear Bolt
32
Chapter 3: Research program 33
3.2 Experimental Program
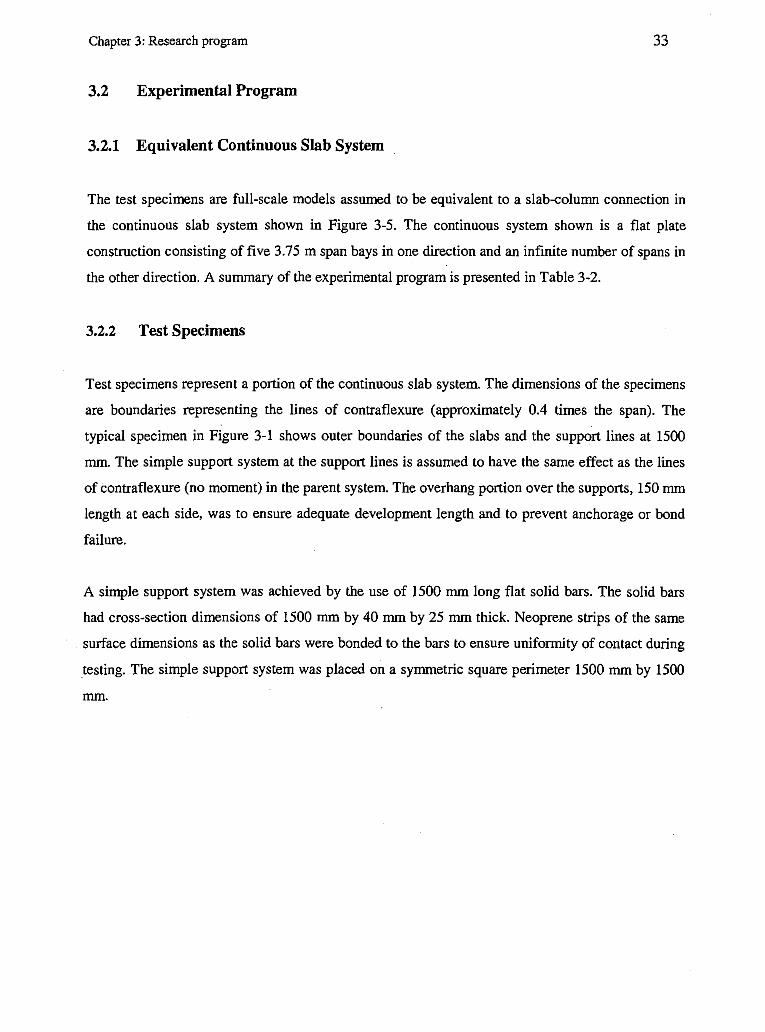
3.2.1 Equivalent Continuous Slab System
The test specimens are full-scale models assumed to be equivalent to a slab-column connection in
the continuous slab system shown in Figure 3-5. The continuous system shown is a flat plate
construction consisting of five 3.75 m span bays in one direction and an infinite number of spans in
the other direction. A summary of the experimental program is presented in Table 3-2.
3.2.2 Test Specimens
Test specimens represent a portion of the continuous slab system. The dimensions of the specimens
are boundaries representing the lines of contraflexure (approximately 0.4 times the span). The
typical specimen in Figure 3-1 shows outer boundaries of the slabs and the support lines at 1500
mm. The simple support system at the support lines is assumed to have the same effect as the lines
of contraflexure (no moment) in the parent system. The overhang portion over the supports, 150 mm
length at each side, was to ensure adequate development length and to prevent anchorage or bond
failure.
A simple support system was achieved by the use of 1500 mm long flat solid bars. The solid bars
had cross-section dimensions of 1500 mm by 40 mm by 25 mm thick. Neoprene strips of the same
surface dimensions as the solid bars were bonded to the bars to ensure uniformity of contact during
testing. The simple support system was placed on a symmetric square perimeter 1500 mm by 1500
mm.

Chapter 3: Research program 34
- n -~
I I ~
I I ~
I I :;;
I I I J D
I D
I D
I I ~ ~
IHI ,.;
lb D 101 D '" I I I I ~
~
I I "'
I J D I D I D
I I I I ~
I I :;;
I I
3.75 3.75 3.75 3.15
vV/ Figure 3-5: Test Specimen Shown in Equivalent Structure being Modelled (Units: 1fID)
Table 3-2: Summary of Experimental Program
p (%)
Specimen b* a* h* average d*
Number of Shear bolts (mm) (mm) (mm) of 2 layers (mm) Openings
SBl 1800 1500 120 1.2 88.7 0 none
SB2 1800 1500 120 1.2 88.7 0 8*2 rows
SB3 1800 1500 120 1.2 88.7 0 8*3 rows
SB4 1800 1500 120 1.2 88.7 0 8*4 rows
SB5 1800 1500 120 1.2 88.7 4 8*4 rows
SB6 1800 1500 120 1.2 88.7 2 8*4 rows
* See Figure 3-1

Chapter 3: Research program 35
3.2.3 Slab Flexural Reinforcement
The design consideration for the slabs was according to CSA A23.3-94. The specimens were
designed by varying the percentage of tensile reinforcement such that failure occurs in punching
before the flexural capacity is reached for the specimen without shear bolts.
All six specimens were reinforced with top and bottom layers running in orthogonal directions. The
tension layer was designed such that the slab was as close as possible to being orthotropic. This was
achieved by using slightly different spacing of reinforcement for the top and bottom layers of the
tension (bottom) mat. The average main reinforcement ratio pis 1.2 % ( p = A,. /bd ).
0 0 (U
@)
0 z
' ' L _J
10 No. 10 @ 200 (TT)
Figure 3-6: Top Mat (Compression Reinforcement)
Chapter 3: Research program
0 CJ'
@)
0 z 0 (\J
I ..
I
'
&a
1500 MM
I" M
L, u
18 No. 10 @100 <BB)
-' ,. I
I - j 0 ... ~
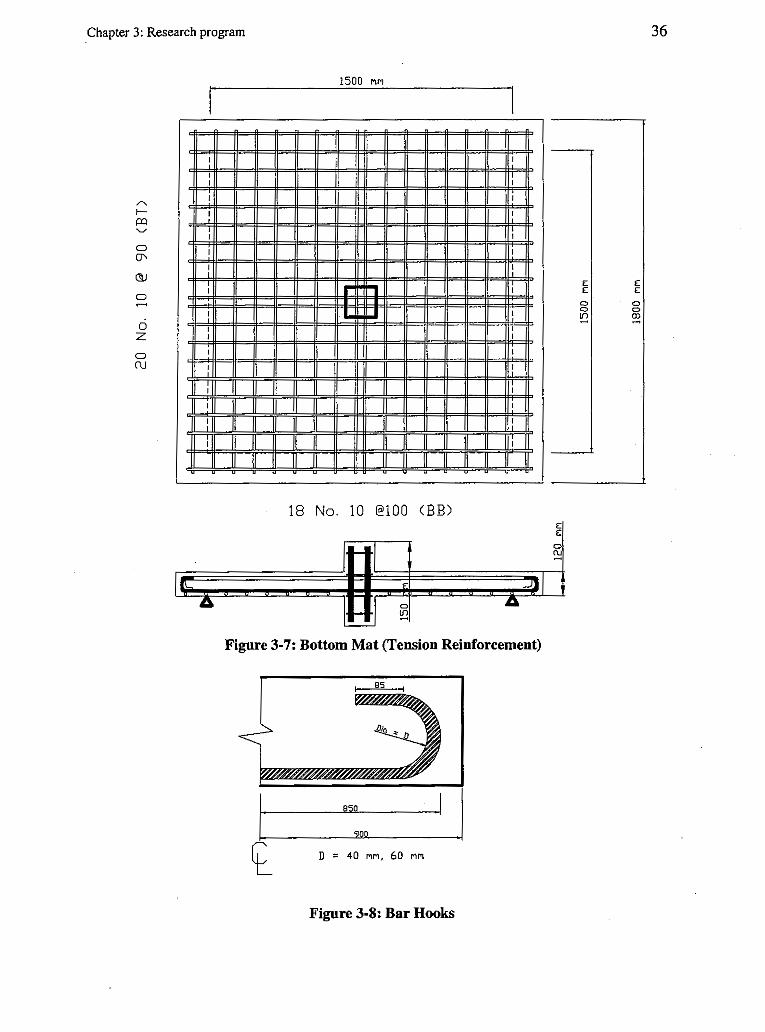
Figure 3-7: Bottom Mat (Tension Reinforcement)
85
I 850
CJOO
l_ D = 40 MM, 60 MM
Figure 3-8: Bar Hooks
E E
0 (\J
E E
0 0
~
E E
0 0 a,
36
Chapter 3: Research program 37
The tensile reinforcement used is as follows:
• The bottom mat lower layer was lOM bars at 100 mm centres. The upper layer was
1 OM bars at 90 mm centres.
• For the top mat lOM bars were used. The spacing for both layers was 200 mm.
The yield strength, as previously mentioned, was. determined to be 455 MPa. The clear cover at the
top and bottom of the slabs was taken to ·be 20 mm. It should be noted, that due to the experimental
set-up design, the slabs were tested in the "upside down" position when compared to the real slab
column system. The tension reinforcement was therefore placed on the bottom of the specimens.
Figures 3-6 and 3-7 below show the typical reinforcement layout for the slab specimens tested. For
each layer in both mats two 10 M bars in both directions pass through the column between the
column dowels, for purposes of structural integrity.
All the bars used were hooked at their ends to provide adequate anchorage. A sketch of the
anchorage hooks is shown in Figure 3-7 and blown up in Figure 3-8 for the two dimensions of
hooks used.
3.2.4 Slab Shear Reinforcement
Shear reinforcement for the slab specimens consist of a new type of device referred to as shear
bolts. They consist of a shaft with a forged circular head (30 _Il1!Il__<iiarm,t<:l.r) and a threaded end for
the nuts that hold them in place. Fabricated, non-standard circular washers ( 44 mm diamet~r. 10 mm
thick recommended) were used at the threaded end as anchor plates for the shear bolts. Shear bolts
are installed in holes drilled in the slab shortly before testing.
The holes were drilled perpendicular to the slab plane using 16 mm (5/8 inch) diamond coring bits.
The bolts were torqued to a strain between 5 - 10% (200-250 µe) of their yield strength just before
testing. The shear bolts were arranged in concentric rows parallel to the perimeter of the column,
following CSA A23.3 Clause 13.4.8.4. Each concentric row consist of eight bolts- two each parallel
to the faces of the square column. The first row was place at between 45 mm to 60 mm from the
Chapter 3: Research program 38
face of the column and subsequent rows were between 75 - 90 mm. A typical bolt is shown in the
Figure 3-9.
Figure 3-9: Typical Shear Bolt
3.2.5 Column Reinforcement
The reinforcement in the stub column consist of four 20 mm bars running from top to bottom
through the slab and enclosed by 8 mm ties placed at 100 mm spacing and tied to the column at the
comers.
3.3 Preparation of the Test Specimens
3.3.1 Form-work Building
Forms were designed and built using plywood and sectional lumber. Rigidity of the formwork was
achieved using bracing systems and double ply in some cases. Connections were done using screws,
nails and adhesives.
3.3.2 Caging
Caging was done in the laboratory. The reinforcement was ordered pre-bent from the supplier.
Uniformity was achieved by building rigs for arranging the reinforcement in place prior to tying,
which was done manually. The cages were then hoisted into place in the forms. A typical cage is
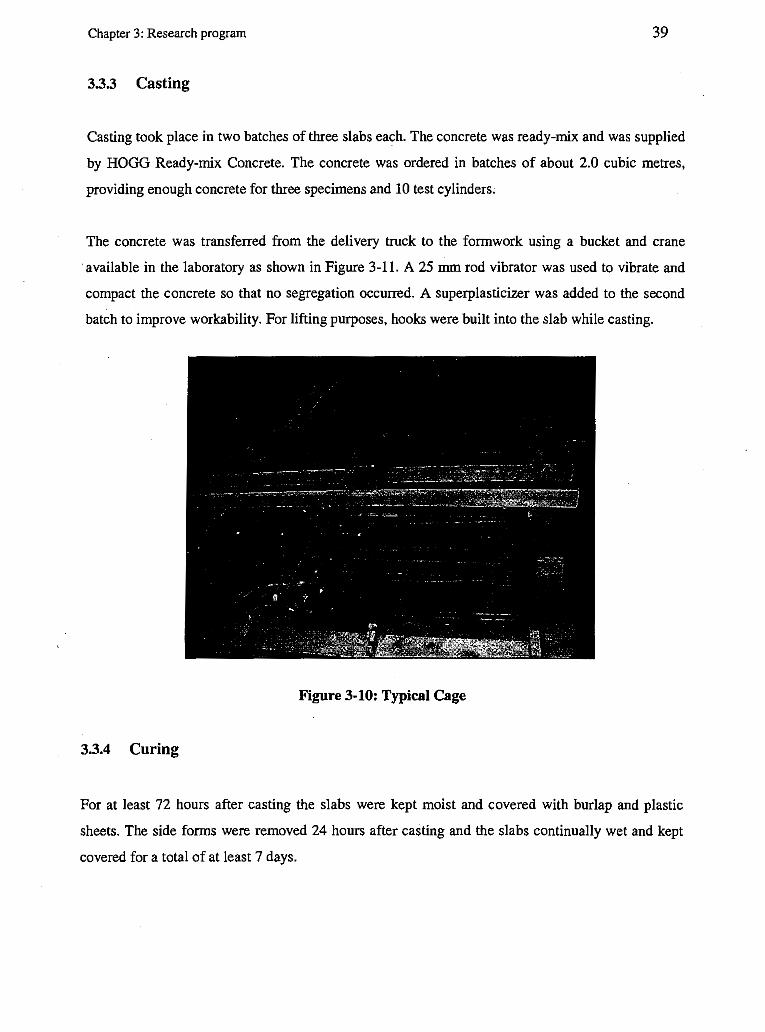
shown in Figure 3-10.
Chapter 3: Research program 39
3.3.3 Casting
Casting took place in two batches of three slabs each. The concrete was ready-mix and was supplied
by HOGG Ready-mix Concrete. The concrete was ordered in batches of about 2.0 cubic metres,
providing enough concrete for three specimens and 10 test cylinders,
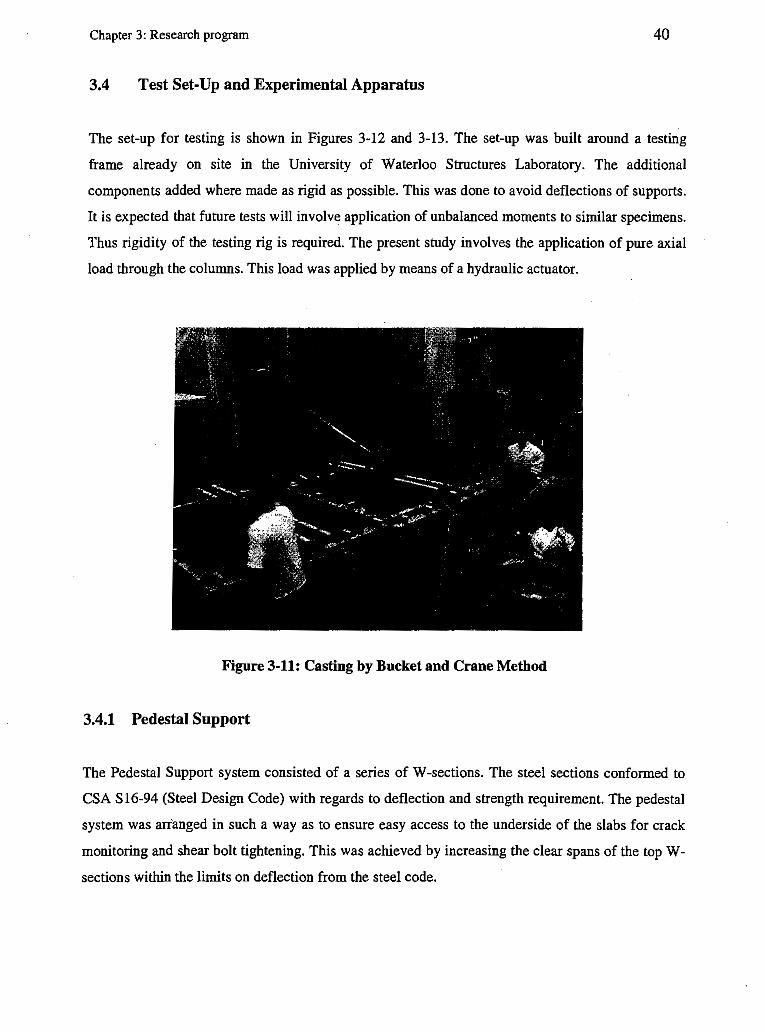
The concrete was transferred from the delivery truck to the forrnwork using a bucket and crane
available in the laboratory as shown in Figure 3-11. A 25 mm rod vibrator was used to vibrate and
compact the concrete so that no segregation occurred. A superplasticizer was added to the second
batch to improve workability. For lifting purposes, hooks were built into the slab while casting.
Figure 3-10: Typical Cage
3.3.4 Curing
For at least 72 hours after casting the slabs were kept moist and covered with burlap and plastic
sheets. The side forms were removed 24 hours after casting and the slabs continually wet and kept
covered for a total of at least 7 days.
Chapter 3: Research program 40
3.4 Test Set-Up and Experimental Apparatus
The set-up for testing is shown in Figures 3-12 and 3-13. The set-up was built around a testing
frame already on site in the University of Waterloo Structures Laboratory. The additional
components added where made as rigid as possible. This was done to avoid deflections of supports.
It is expected that future tests will involve application of unbalanced moments to similar specimens.
Thus rigidity of the testing rig is required. The present study involves the application of pure axial
load through the columns. This load was applied by means of a hydraulic actuator.
Figure 3-11: Casting by Bucket and Crane Method
3.4.1 Pedestal Support
The Pedestal Support system consisted of a series of W-sections. The steel sections conformed to
CSA S 16-94 (Steel Design Code) with regards to deflection and strength requirement. The pedestal
system was arranged in such a way as to ensure easy access to the underside of the slabs for crack
monitoring and shear bolt tightening. This was achieved by increasing the clear spans of the top W
sections within the limits on deflection from the steel code.

Chapter 3: Research program 41
11 11 11 11 11 11 11 11 11 11 11 11 11 11 11 11 11 11 11 11 11 11 11 11 11 E
E 11 11
0 11 11 11 11 '" E 11 11
E 11 11
0 11 11 "' 0 11 11 ru 11 11 11 nnnn 11 11 0 11 11 LJLJLJLJ ~ 11 11 11 11 nnnn 11 11 11
M
. I i;:48Q MM
Figure 3-12: Test Set-Up with Pedestals and Slab in Place (Front)
1240 MM
Figure 3-13: Testing Set-Up Frame Only (Side View)

Chapter 3: Research program 42
3.4.2 Boundary Conditions
The specimens were designed as simply supported slabs. Simple supports at the edges were
achieved by using 40 mm wide, 25 mm-think steel plates. Placing neoprene strips between the
bearing plates and the slab ensured uniformity of contact.
3.4.3 Corner Restraint
To simulate continuous slab construction and avoid the slab edges lifting during testing, tubular
sections were used at each comer. The comers of the slabs were held down by sections cut out of
standard tubular steel of dimension 76.2 mm square by 6.35 mm thickness (3 inch square by 1/.i inch
thickness). Restraint was achieved by bolting to the base plate. The restraint is to simulate the
continuity of a real continuous slab system. The comer restraints used are shown in Figure 3-15.
Figure 3-14: Testing Frame, Data Acquisition and Specimen in Place
Chapter 3: Research program 43
16 2 750
0 0
Figure 3-15: Dimensions of Corner Restraints and Connecting Rods (Dimensions in mm)
3.5 Instrumentation
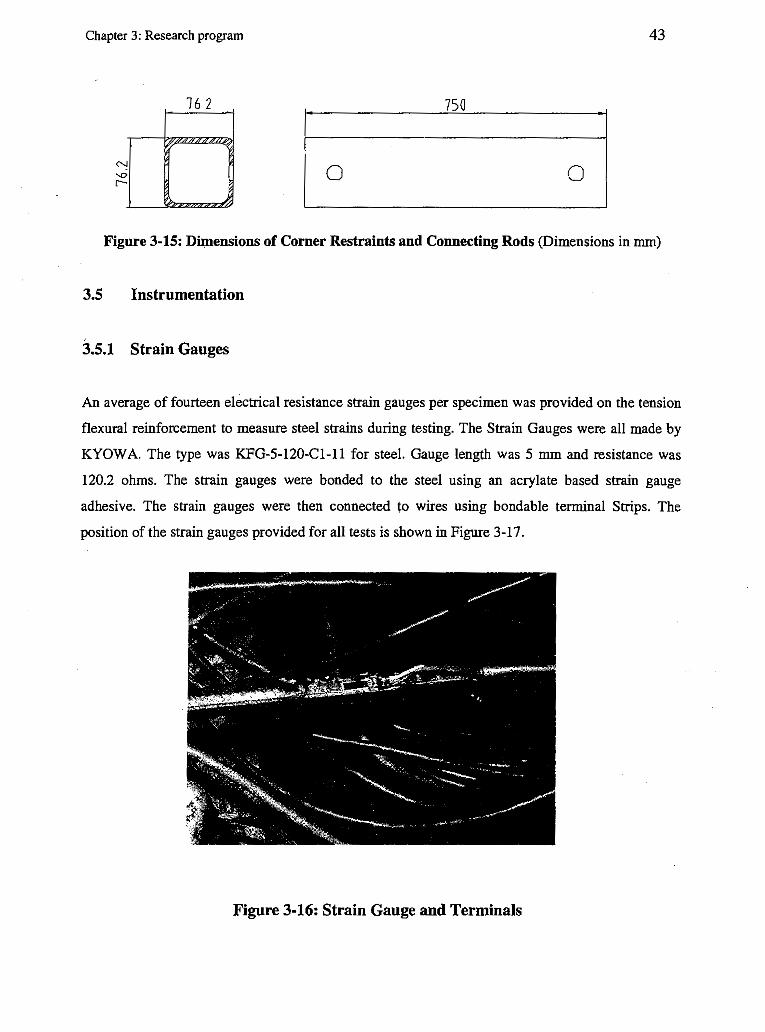
3.5.1 Strain Gauges
An average of fourteen electrical resistance strain gauges per specimen was provided on the tension
flexural reinforcement to measure steel strains during testing. The Strain Gauges were all made by
KYOWA. The type was KFG-5-120-C!-ll for steel. Gauge length was 5 mm and resistance was
120.2 ohms. The strain gauges were bonded to the steel using an acrylate based strain gauge
adhesive. The strain gauges were then connected to wires using bendable terminal Strips. The
position of the strain gauges provided for all tests is shown in Figure 3-17.
Figure 3-16: Strain Gauge and Terminals

Chapter 3: Research program
r---------------1 I I I I I I I I I I I I I I I I I I
: I I
0
"'
r ... r r - Ul
I LJ I I I I I I I I I I ~---------------
------------------,
90 135
6 U7 US
U3U4
I I I I I I I I I I I I I I I I I I I
: I I
I I I I I I I I I I I ------------------~
44
U - Upper Layer
L - Lower layer
Figure 3-17: Position of Strain Gauges on Longitudinal Reinforcement (Dimensions in mm)
3.5.2 Displacement Transducers
A scheme of Linear Variable Displacement Transformers (L VDT), Direct Current Displacement
Transformers (DCDT), and Potentiometers was used on each slab specimen to measure the
magnitude of the deflection profile during testing. The positions of transducers are shown in Figure
3-18. At three locations, 8, 9, 10, displacement transducers were placed both on top and bottom of
the slab. This was done to monitor opening of the internal inclined crack during testing. Differential
displacement readings from the top and bottom pairs gave an estimate of the vertical width of the
inclined shear cracks.

Chapter 3: Research program
;--------------------------------------,
' ' ' ' ' ' ' ' ' ' ' ' ' ' ' ' ' '
4o
3.
' '
' ' ' . ' L--------------------------------------~
* L VDT pairs a. t top o.nci bottoM of slab
Figure 3-18: Position of L VDT on a Typical Specimen (Dimensions in mm)
3.5.3 Video Camera
45
A video camera was mounted underneath the slab during testing to monitor the formation of cracks.
To enhance crack detection, the bottom of the slab was painted and a light source was used to
increase flexural crack visibility.
•
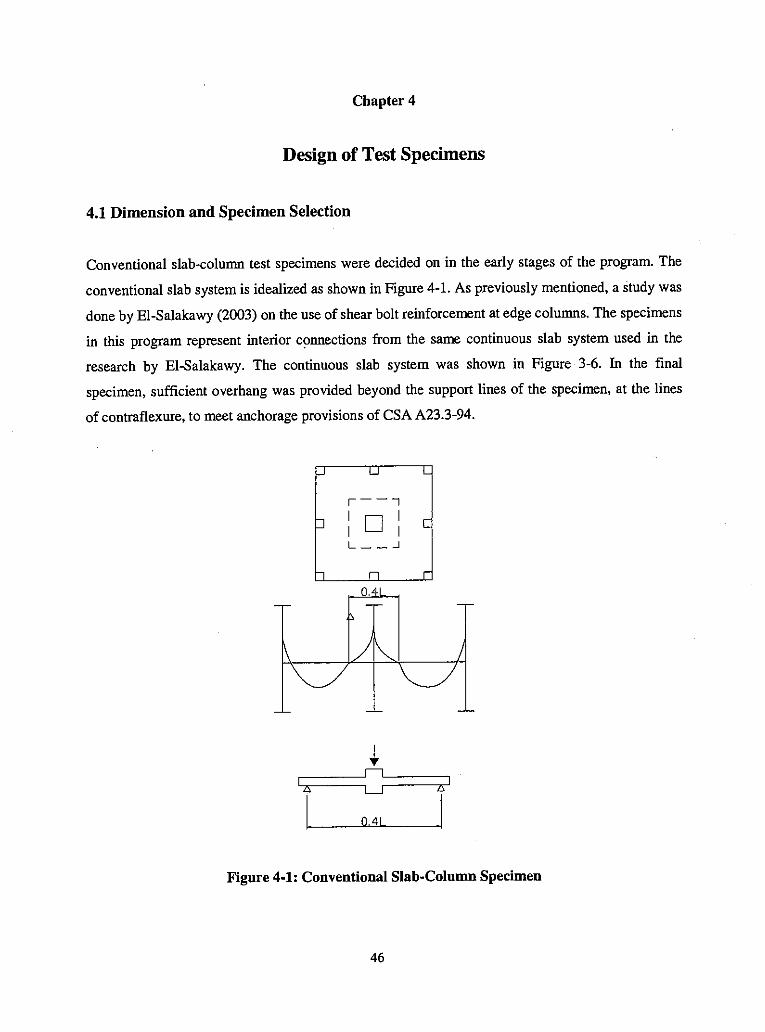
Chapter4
Design of Test Specimens
4.1 Dimension and Specimen Selection
Conventional slab-column test specimens were decided on in the early stages of the program. The
conventional slab system is idealized as shown in Figure 4-1. As previously mentioned, a study was
done by El-Salakawy (2003) on the use of shear bolt reinforcement at edge columns. The specimens
in this program represent interior connections from the same continuous slab system used in the
research by El-Salakawy. The continuous slab system was shown in Figure 3-6. In the final
specimen, sufficient overhang was provided beyond the support lines of the specimen, at the lines
of contraflexure, to meet anchorage provisions of CSA A23.3-94.
I 2S
I
,---, I D I I I L __ .J
rn + ~
Q.41
2S I
I
Figure 4-1: Conventional Slab-Column Specimen
46
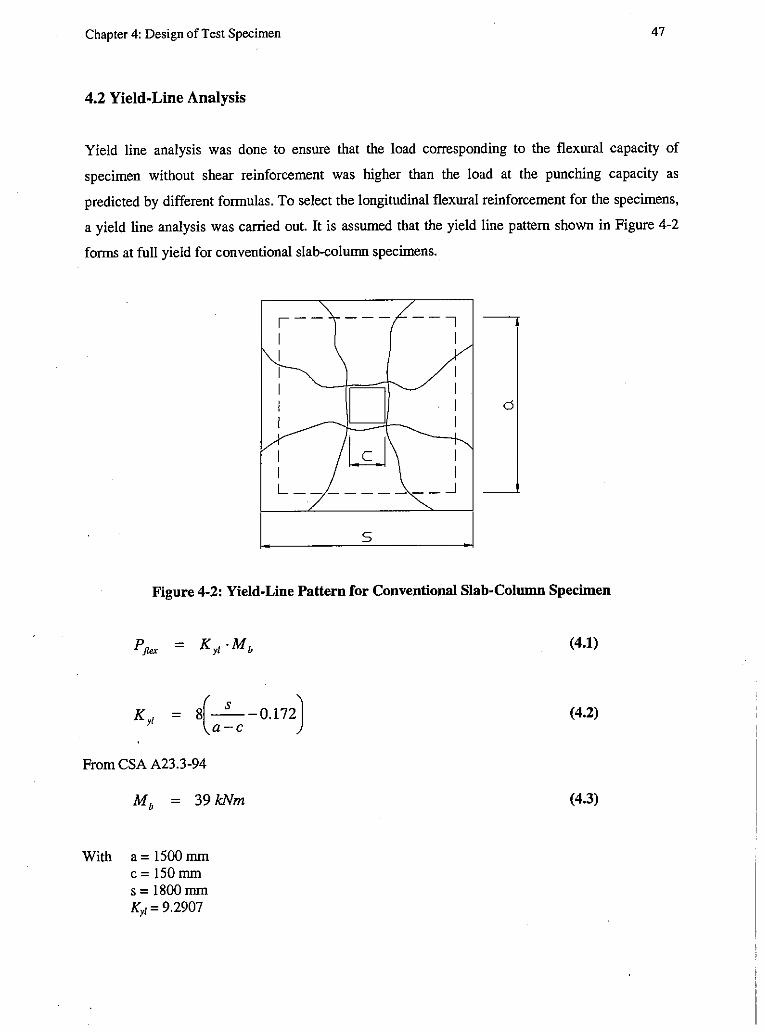
Chapter 4: Design of Test Specimen 47
4.2 Yield-Line Analysis
Yield line analysis was done to ensure that the load corresponding to the flexural capacity of
specimen without shear reinforcement was higher than the load at the punching capacity as
predicted by different formulas. To select the longitudinal flexural reinforcement for the specimens,
a yield line analysis was carried out. It is assumed that the yield line pattern shown in Figure 4-2
forms at full yield for conventional slab-column specimens.
,--1
I I I I I D
--, I
w I I I L _________ _J
5
d
Figure 4-2: Yield-Line Pattern for Conventional Slab-Column Specimen
K,, = s(-8 --0.112) a-c
From CSA A23.3-94
Mb = 39kNm
With a= 1500 mm c= 150mm s= 1800mm K,1= 9.2907
(4.1)
(4.2)
(4.3)

Chapter 4: Design of Test Specimen
And with!,= 455 MPa,f'c= 42 MPa
Assuming 10 M bars in both layers of the tension mat, d.,. = 90 mm
Pnox = 9.2907 Mb
The flexural reinforcement chosen for the specimens is as follows;
10 M @ 100 in the bottom layer of the tension mat, nominal moment capacity of 39.8 MPa
10 M @ 90 in the top layer of the tension mat, nominal moment capacity of 38.1 MPa
Therefore,
P flex = 362 kN
4.3 Structural Analysis of Continuous Slab System
48
A structural design of an equivalent continuous slab system was carried out. As mentioned
previously, it is shown that the tested slab represent portions of a slab with spans of 3.75 min each
direction. The unfactored service load was a unifonnly distributed load of 18.5 kPa. The analyzed -slab system consists of five spans in one direction and theoretically an infinite number of spans in
the other direction. A layout of the parent slab system was shown in Figure 3-5.
CSA A23.3 -94 specifies a number of methods for analyzing a flat plate slab system. The Direct
Design Method, which distributes the statical moment, M0 between positive and negative moment
regions, was used as a rough initial design. Since the slab contained relatively high percentage of
flexural reinforcement; it had to be designed for the high Live Loads. Therefore, to be consistent
with the CSA, the elastic frame method was also used to analyze the equivalent continuous slab
system. The slab was analyzed for a unifonnly distributed factored load over the slab area of 18.5
kPa.
4.3.1 Direct Design Method
The coefficients given by A23.3-94 for the computation of moments in a continuous slab system
without beams between columns are reproduced in Figure 4-4. For the factored load of 18.5 kPa,

Chapter 4: Design of Test Specimen 49
a total statical moment of 113 kNm is obtained. This moment is distributed between positive and
negative regions according to Figure 44. The moments are shown in Figure 4-5. The direct design
method is recommended for structures with regularity of topology and loading.
I\
0 70MA
0 2~Mo lJ
~
0 65Mo O 65Mo 0.70Mo
l\ ;1 ~ ~26Mo
~~ 0.52Mo 0.35Mo 0.52Mo
Figure 4-4: Moment Coefficients for the Direct Design Method (kNm)
79.1 79.1 29.4 29.4
58.8 39.6 58.8
Figure 4-5: Distribution of Statical Moment by the Direct Design Method (kNm)
4.3.2 Elastic Frame Analysis
Recommended in the CSA A23 .3 -94 is the elastic frame method as a more accurate method for
analyzing flat plates where the ratio of the live load to dead load exceeds 1.5. The analysis of the
parent slab system has been carried out using SODA®. A gravity load analysis was carried out. The
idealized frame analyzed is shown with the member section properties in Figure 4-6.
A printout of the input data and analysis output has been presented in appendix A.

__ Chapter 4: Design of Test Specimen
J :;: infinit le= 42000 00 mm4
I= 586000000 mm4
540000000 mm
Figure 4-6: Elastic Frame Model Showing Moment of Inertia of Members
10.3
66.4 End Span
88.7 85.9
~ 6:; ~
35.6
First Interior
70.7 70.0
~ ;j ~
4 3.0
Interior
Figure 4-7: Moments from Elastic Frame Analysis
The interior support moment from an elastic frame analysis was found to be about 71 kNm as
shown in Figure 4-7. This requires the approximate amount of reinforcement A,:
A "' M · 1926 mm2
., Jy X0.9d
50
For a column strip width of 1875 mm, twenty lOM bars will satisfy this reinforcement requirement.
This gives a ratio of 1.19 % which is equal to 1.2 % used in the specimens.
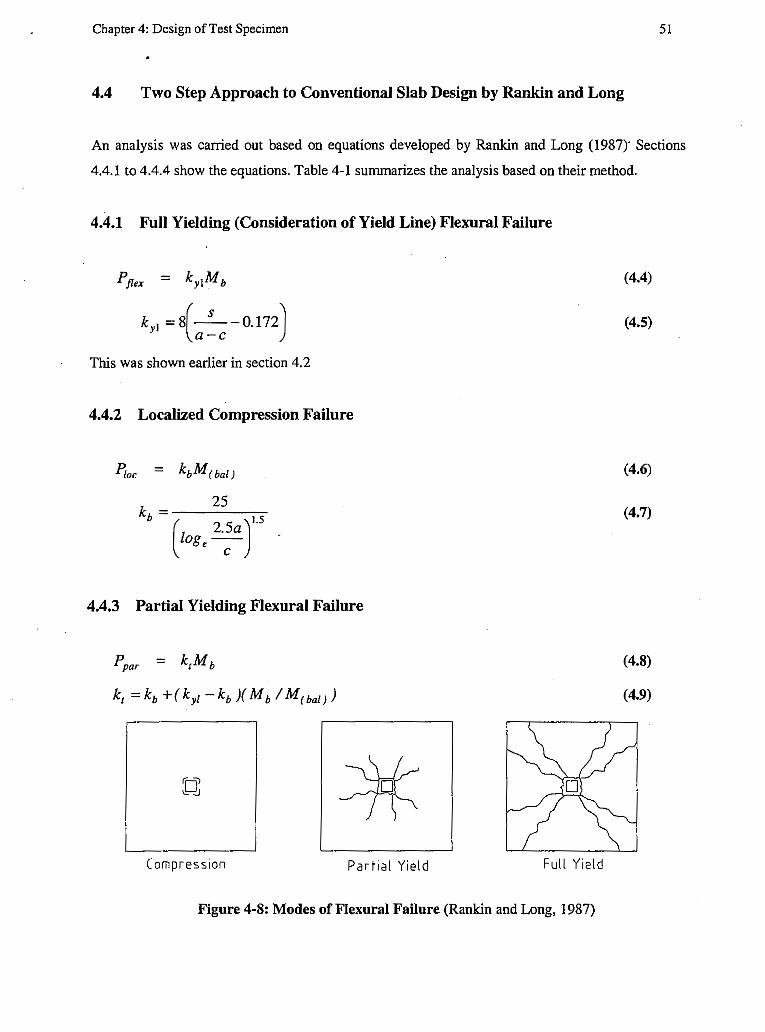
Chapter 4: Design of Test Specimen 51
4.4 Two Step Approach to Conventional Slab Design by Rankin and Long
An analysis was carried out based on equations developed by Rankin and Long (1987)" Sections
4.4.1 to 4.4.4 show the equations. Table 4-1 summarizes the analysis based on their method.
4.4.1 Full Yielding (Consideration of Yield Line) Flexural Failure
kyl =8(-s--o.112J a-c
This was shown earlier in section 4.2
4.4.2 Localized Compression Failure
k _ 25
b -( 2.5aJ1.s log,--
c
4.4.3 Partial Yielding Flexural Failure
Compression Partial Yield Full Yield
Figure 4-8: Modes of Flexural Failure (Rankin and Long, 1987)
(4.4)
(4.5)
(4.6)
(4.7)
(4.8)
(4.9)
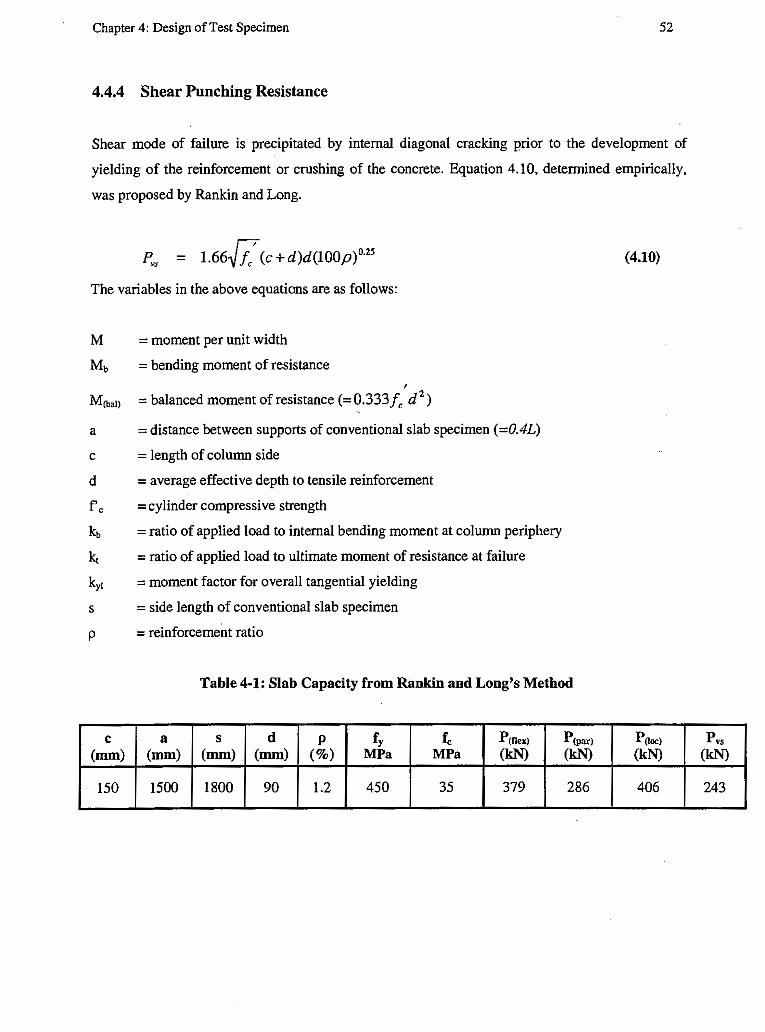
Chapter 4: Design of Test Specimen 52
4.4.4 Shear Punching Resistance
Shear mode of failure is precipitated by internal diagonal cracking prior to the development of
yielding of the reinforcement or crushing of the concrete. Equation 4.10, determined empirically,
was proposed by Rankin and Long.
P,., = 1.66.f.Z(c + d)d(100p) 0·25
The variables in the above equations are as follows:
M = moment per unit width
Mb = bending moment of resistance
' M(bal) = balanced moment ofresistance ( = 0.333 J, d 2 )
a = distance between supports of conventional slab specimen ( =0.4L)
c = length of column side
d = average effective depth to tensile reinforcement
f, = cylinder compressive strength
kb = ratio of applied load to internal bending moment at column periphery
kt = ratio of applied load to ultimate moment of resistance at failure
k,1 = moment factor for overall tangential yielding
s = side length of conventional slab specimen
p = reinforcement ratio
Table 4-1: Slab Capacity from Rankin and Long's Method
C a s d p fy f, Pcn,x> P(par) (mm) (mm) (mm) (mm) (%) MPa MPa (kN) (kN)
150 1500 1800 90 1.2 450 35 379 286
(4.10)
Pooc> (kN)
406
Pv, (kN)
243

Chapter 4: Design of Test Specimen 53
4.5 Shear Capacity by Code of Practice Approach
A review of the shear requirements from various codes of practice was examined in
Chapter 2. In this chapter, a standardized form of the same design specifications equations
are used as described in the FIB Bulletin (2001).
For ultimate limit state, the resistance of a section in shear needs to be greater the factored ultimate
shear stress. The total punching resistance is given by Equation 4.11.
(4.11)
The various codes give different formulae for the parameters in Equation 4.11. Generally speaking
in implicit form,
V,
where,
Tc ' k · f (p1) • U • d
= A · K · f · sin(a) sv s y
V, shear resistance of the reinforced concrete section
(4.12)
(4.13)
V c shear resistance of the reinforced concrete section without shear reinforcement or concrete
contribution of the punching resistance with shear reinforcement
V, Contribution of shear reinforcement to the resistance of the section
V ,,oui,ide shear resistance outside of the shear reinforced area
V max characteristic maximum shear resistance
<l>, resistance factor for concrete
<l>, resistance factor for steel
T, concrete shear stress [MN/m2]
k size effect factor of the effective depth
f(p1) function of the tension reinforcement
p1 tension reinforcement ratio [%]

Chapter 4: Design of Test Specimen 54
u control perimeter [mm]
d effective depth [mm]
A,v cross section area of the shear reinforcement [mm2]
K, efficiency of the shear reinforcement
fy yield strength of the shear reinforcement [MPa J a inclination of the shear reinforcement
The following tables show the shear resistance of the slab specimens (without transverse
reinforcement) according to various code provisions. Table 4-2 shows the resistances for a slab
without openings, Table 4-3 with two openings and Table 4-4 with four openings.
Summarized in Table 4-5 is the shear capacity of specimens reinforced with transverse bolt
reinforcement.
4.5.1 Shear Resistance without Openings/No Shear Reinforcement
Table 4-2: Shear Resistance of Specimens by Code Provisions
Tc k u f(p,) v. (MN/m") (mm) (kN)
Eurocode 0.423 1.511 1664 1.680 160
Model Code 0.417 2.000 2019 1.095 166
BS 8110 0.969 1.457 1664 1.063 223
ACI 2.139 1.000 955 1.000 181 0
CSA 2.592 1.000 955 1.000 220
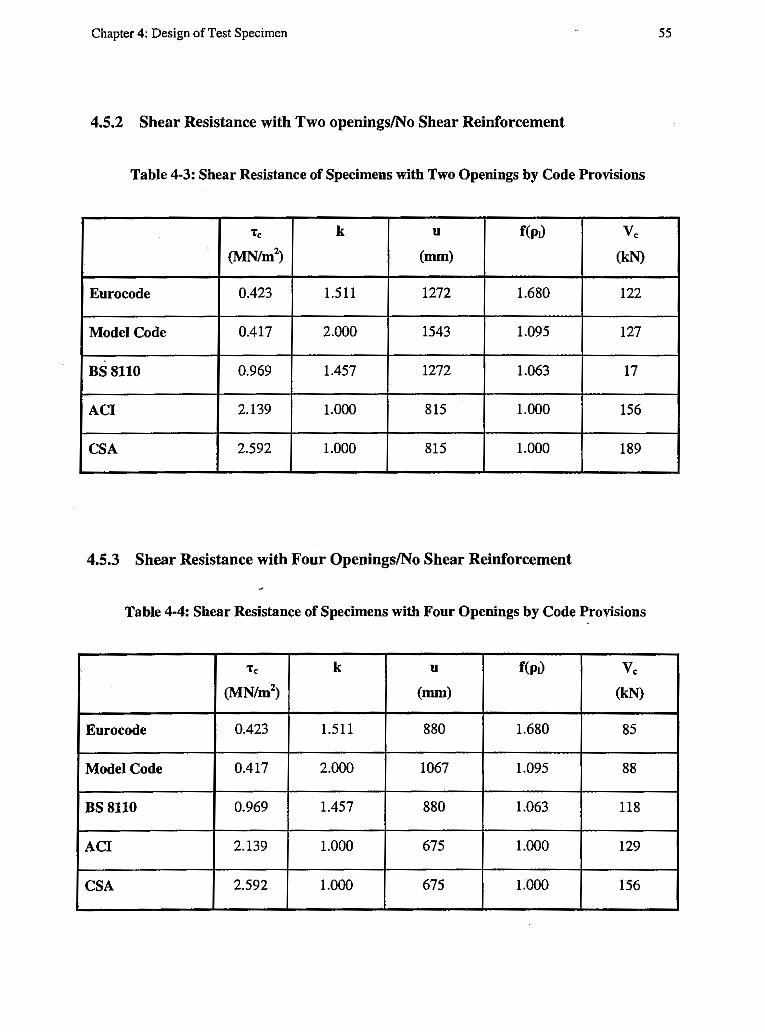
Chapter 4: Design of Test Specimen 55
4.5.2 Shear Resistance with Two openings/No Shear Reinforcement
Table 4-3: Shear Resistance of Specimens with Two Openings by Code Provisions
Tc k u f(p,) Ve
(MN/m2) (mm) (kN)
Eurocode 0.423 1.511 1272 1.680 122
Model Code 0.417 2.000 1543 1.095 127
BS8110 0.969 1.457 1272 1.063 17
ACI 2.139 1.000 815 1.000 156
CSA 2.592 1.000 815 1.000 189
4.5.3 Shear Resistance with Four Openings/No Shear Reinforcement
Table 4-4: Shear Resistance of Specimens with Four Openings by Code Provisions
Tc k u f(pi) Ve
(MN/m2) (mm) (kN)
Eurocode 0.423 1.511 880 1.680 85
Model Code 0.417 2.000 1067 1.095 88
BS 8110 0.969 1.457 880 1.063 118
ACI 2.139 1.000 675 1.000 129
CSA 2.592 1.000 675 1.000 156

Chapter 4: Design of Test Specimen 56
4.5.4 Shear Resistance of Slabs with Transverse Reinforcement by CSA-A23.3-94
Table 4-5: Shear Resistance of Specimens Reinforced with Shear Bolts
b. Av, Yr
(mm) (mm2) (kN)
SBl 955 562 219
SB2 955 562 261
SB3 955 562 321
SB4 955 562 380
SBS 675 562 334
SB6 815 562 359
The area of shear reinforcement per line was found to be 567 rnm2 for shear bolts with yield stress
of 381 MPa. A summary of the predicted capacity of the shear strengthened slab-column connection
is show in Table 4-5.

Chapters
Experimental Procedures and Observations
This chapter describes each test in detail. Testing procedures are presented first. Then the test
observations are presented in terms of deflections, cracking and reinforcement strains. Six
specimens were tested namely: SB 1, SB2, SB3, SB4, SB5 and SB6. A description of each test
specimen with regards to configuration and transverse reinforcement was given in Figure 3-2.
Initiation and propagation of cracks in a slab-column specimen consist of the following successive
stages:
• Initiation of flexural and shear cracks in the tension zone of the slab near the face of the
column,
• Yielding of tension steel close to the column,
• Extension of flexural and shear cracks into the compression zone,
• Failure due to rupture of the reduced compression zone.
5.1 Testing Procedures
Slab SB 1 was the first specimen to be tested. It served as a control specimen for this experimental
program. SB 1 is typical of all six specimens. It was without openings or transverse reinforcement.
All slabs were tested by displacement control. The displacement rate was chosen to approximately
follow the required load steps: 4 kN/min until about 70% of the anticipated ultimate load, and 2
kN/min from then on, until failure. While testing SB 1, the equipment experienced sudden (small)
jumps in the loading, which did not significantly affect the results of the test. The malfunction was
corrected for subsequent tests. Test time for SB 1 was 53 minutes.
Slab SB2 was the first transversely reinforced specimen with two peripheral rows of shear bolt
reinforcement. All shear bolts were torqued prior to commencing the test to a strain of within a
range of 5 - 15 % of yield strain (180 - 300 microstrains (µe)). While testing SB2, the slab had to
be unloaded and slowly reloaded four times. This was done because the load controller had to be re
started after reaching its full range. The data between the drops in load was deleted from the load
displacement graphs. Test time for SB2 was 230 minutes.
57

Chapter 5: Experimental Results and Observations 58
Slab SB3 was loaded by displacement control. SB3 had three peripheral lines of shear bolts. Test
time for SB3 was 182 minutes.
Slab SB4 had four peripheral lines of shear bolt reinforcement.
Slab SB 5 had two openings symmetrically positioned next to the column. It was reinforced
transversely with four peripheral lines of shear bolt reinforcement. At a load of 343 kN the
hydraulic lines supplying the actuator lost pressure. The load dropped down to 118 kN before
picking up again. The data between the drops in load have been deleted from that presented here.
Test time for SB5 was 122 minutes. While testing SB5, no deflection reading was taken at the
central bottom L VDT due to malfunction of the data acquisition system.
SB6 had two openings on opposite sides of the column and was reinforced transversely with four
peripheral lines of shear bolt reinforcement. At a load of 300 kN, the top displacement transducers
were adjusted because the framing crossbars were in the way of the actuator and had been pushed
down as the actuator went downwards. This somewhat affected the displacement readings taken
from that point on. Test time for SB6 was 77 minutes.
5.2 Test Observations
5.2.1 Slab SBl
Slab SBl failed in a sudden punching mode at a load of 253 kN. The load-displacement behavior
(Figure B-1), flexural crack pattern and strain data (Figure B-3) all confirm this mode of failure. At
failure, there was a complete loss of stiffness observed by the sudden drop in load. The data
collected during testing for slab SBl is presented in Appendix B, Figures B-1 to B-3.
Cracks were first noticed on the tension face of the slab along and perpendicular to the edges of the
stub column. The flexural cracks became visible at about 126 kN starting from the column comers
and extending a short distance towards the supports. At about 206 kN the flexural cracks had
extended all the way to the supports. The crack patterns after failure for specimen SB 1 are shown in
Figure 5-1.
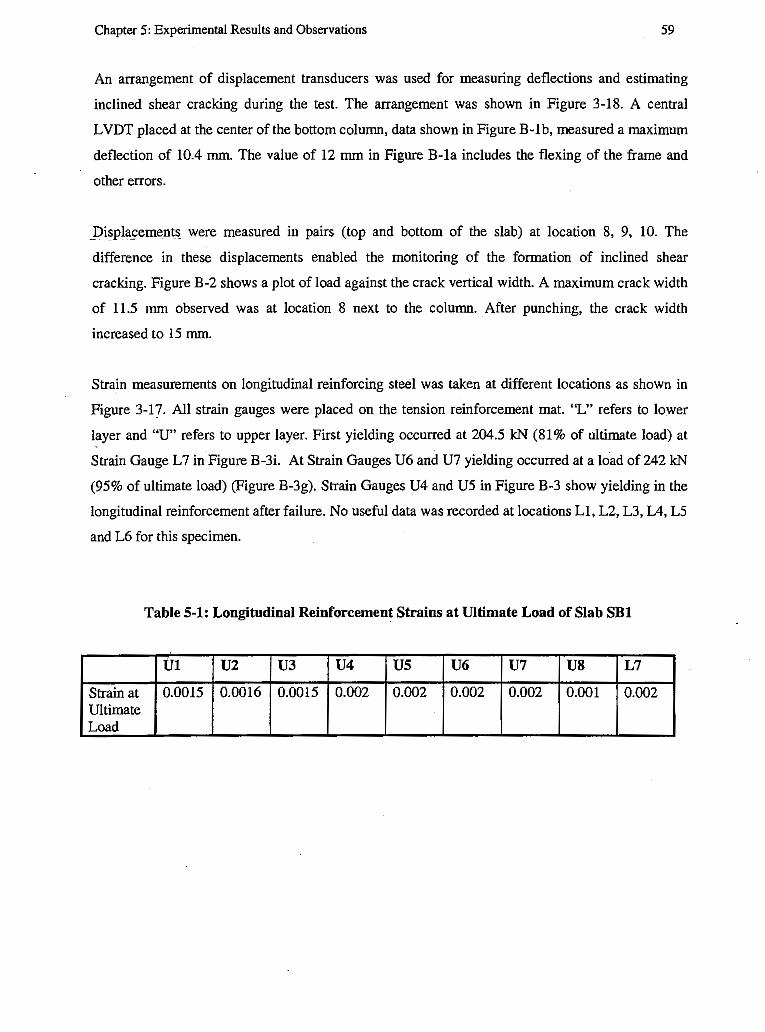
Chapter 5: Experimental Results and Observations 59
An arrangement of displacement transducers was used for measuring deflections and estimating
inclined shear cracking during the test. The arrangement was shown in Figure 3-18. A central
L VDT placed at the center of the bottom column, data shown in Figure B-1 b, measured a maximum
deflection of 10.4 mm. The value of 12 mm in Figure B-la includes the flexing of the frame and
other errors.
_I)isplasement~ were measured in pairs (top and bottom of the slab) at location 8, 9, 10. The
difference in these displacements enabled the monitoring of the formation of inclined shear
cracking. Figure B-2 shows a plot of load against the crack vertical width. A maximum crack width
of 11.5 mm observed was at location 8 next to the column. After punching, the crack width
increased to 15 mm.
Strain measurements on longitudinal reinforcing steel was taken at different locations as shown in
Figure 3-17. All strain gauges were placed on the tension reinforcement mat. "L" refers to lower
layer and "U" refers to upper layer. First yielding occurred at 204.5 kN (81 % of ultimate load) at
Strain Gauge L 7 in Figure B-3i. At Strain Gauges U6 and U7 yielding occurred at a load of 242 kN
(95% of ultimate load) (Figure B-3g). Strain Gauges U4 and U5 in Figure B-3 show yielding in the
longitudinal reinforcement after failure. No useful data was recorded at locations Ll, L2, L3, L4, LS
and L6 for this specimen.
Table 5-1: Longitudinal Reinforcement Strains at Ultimate Load of Slab SBl
01 U2 U3 U4 us U6 U7 us L7
Strain at 0.0015 0.0016 0.0015 0.002 0.002 0.002 0.002 0.001 0.002 Ultimate Load

Chapter 5: Experimental Results and Observations
5LM5B1 I /f<:{>,l II'.fo/,'.~
F:~L ?51.H!
Figure 5-1: Crack Pattern after Failure of Specimen SB1
60
Top of Slab
Underside of Slab
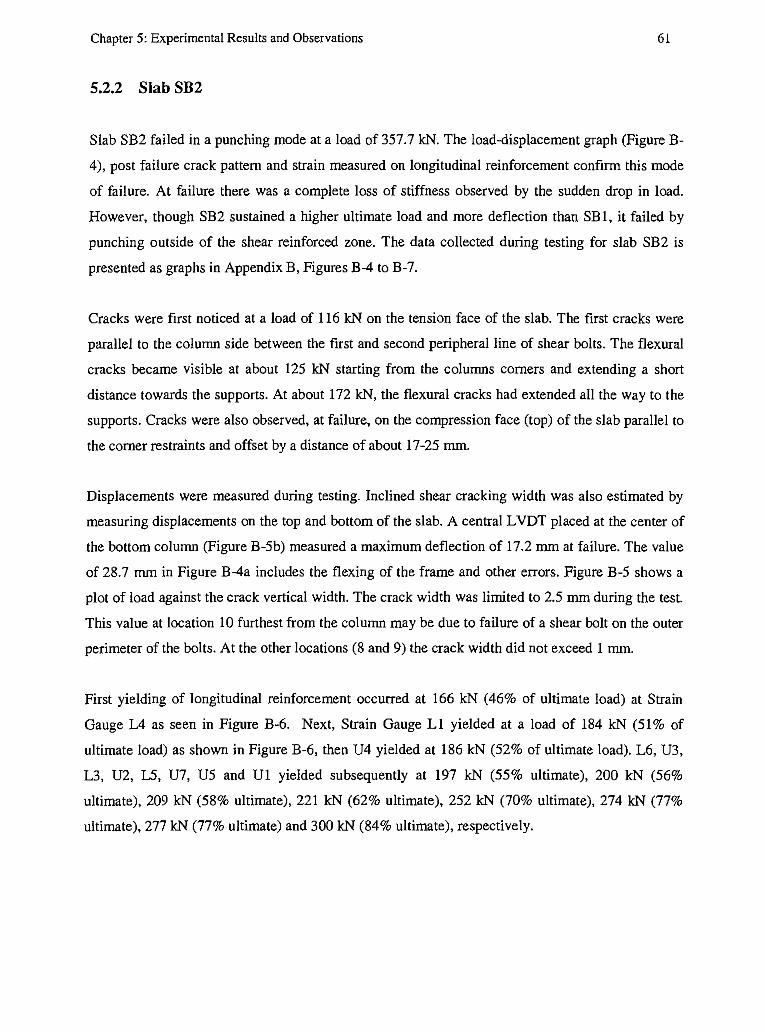
Chapter 5: Experimental Results and Observations 61
5.2.2 Slab SB2
Slab SB2 failed in a punching mode at a load of 357.7 kN. The load-displacement graph (Figure B-
4 ), post failure crack pattern and strain measured on longitudinal reinforcement confirm this mode
of failure. At failure there was a complete loss of stiffness observed by the sudden drop in load.
However, though SB2 sustained a higher ultimate load and more deflection than SBl, it failed by
punching outside of the shear reinforced zone. The data collected during testing for slab SB2 is
presented as graphs in Appendix B, Figures B-4 to B-7.
Cracks were first noticed at a load of 116 kN on the tension face of the slab. The first cracks were
parallel to the colunm side between the first and second peripheral line of shear bolts. The flexural
cracks became visible at about 125 kN starting from the colunms comers and extending a short
distance towards the supports. At about 172 kN, the flexural cracks had extended all the way to the
supports. Cracks were also observed, at failure, on the compression face (top) of the slab parallel to
the comer restraints and offset by a distance of about 17-25 mm.
Displacements were measured during testing. Inclined shear cracking width was also estimated by
measuring displacements on the top and bottom of the slab. A central L VDT placed at the center of
the bottom colunm (Figure B-5b) measured a maximum deflection of 17.2 mm at failure. The value
of 28.7 mm in Figure B-4a includes the flexing of the frame and other errors. Figure B-5 shows a
plot of load against the crack vertical width. The crack width was limited to 2.5 mm during the test.
This value at location 10 furthest from the colunm may be due to failure of a shear bolt on the outer
perimeter of the bolts. At the other locations (8 and 9) the crack width did not exceed 1 mm.
First yielding of longitudinal reinforcement occurred at 166 kN (46% of ultimate load) at Strain
Gauge L4 as seen in Figure B-6. Next, Strain Gauge Ll yielded at a load of 184 kN (51 % of
ultimate load) as shown in Figure B-6, then U4 yielded at 186 kN (52% of ultimate load). L6, U3,
L3, U2, LS, U7, US and Ul yielded subsequently at 197 kN (55% ultimate), 200 kN (56%
ultimate), 209 kN (58% ultimate), 221 kN (62% ultimate), 252 kN (70% ultimate), 274 kN (77%
ultimate), 277 kN (77% ultimate) and 300 kN (84% ultimate), respectively.

Chapter 5: Experimental Results and Observations 62
Top of Slab
Underside of Slab
Figure 5-2: Crack Patterns after Failure of Specimen SB2

Chapter 5: Experimental Results and Observations 63
The strains at the strain gauge locations at failure load are shown in Table 5-2. For this specimen no
data was collected at locations U6, U8, L2 and L 7 due to damaged strain gauges.
Table 5-2: Longitudinal Reinforcement Strains at Ultimate Load of Slab SB2
Ul U2 U3 us U7 Ll L3 L4 LS L6
Failure 0.002 0.004 0.007 0.003 0.003 0.003 0.004 0.003 0.006 0.021 Strain
5.2.3 Slab SB3
Slab SB3 failed at a load of 376 kN after considerable deflection. The final failure (loss of strength)
happened through a punching cone. SB3 had three peripheral lines of shear bolts. The load
displacement graph in Figure B-8, post failure crack patterns, and strains measured on longitudinal
reinforcement confirm this mode of failure. At failure, there was a virtually complete loss of
strength observed by the sudden drop in load. The data collected during testing for slab SB3 is
presented as graphs in Appendix B, Figures B-8 to B-11.
Cracks were first noticed at a load of 108 kN on the tension face of the slab. The flexural cracks
became clearly visible at about 149 kN starting from the columns comers and extending a short
distance towards the supports. At about 193 KN the flexural cracks had extended all the way to the
supports. Final crack patterns are shown in Figure 5-3. Cracks were also observed, at failure, on the
compression face (top) of the slab parallel to the comer restraints and offset at a distance of about
15-20mm.
A central L VDT placed at the center of the bottom column (Figure B-8b) measured a maximum
deflection of 26 mm at failure. The value of 33 mm deflection in Figure B-8a includes the flexing of
the frame and other errors. Figure B-9 shows a plot of load against the crack vertical width. Crack
width was limited to about 1 mm at all three locations during testing. The difference between crack
widths at locations 8, 9 and 10 monitored during testing was very small.
Strain measurements on longitudinal reinforcing steel were done at different locations as shown in
Figure 3-17. All strain gauges were placed on the tension mat. First yielding occurred at 194 kN

Chapter 5: Experimental Results and Observations 64
(52% of ultimate load) at Strain Gauge LI as seen in Figure B-10. Next Strain Gauge L2 yielded at
a load of214 kN (57% of ultimate load) as shown in Figure B-!Oj, then U4 yielded at
Top of Slab
Figure 5.3: Crack Patterns after Failure of Specimen SB3
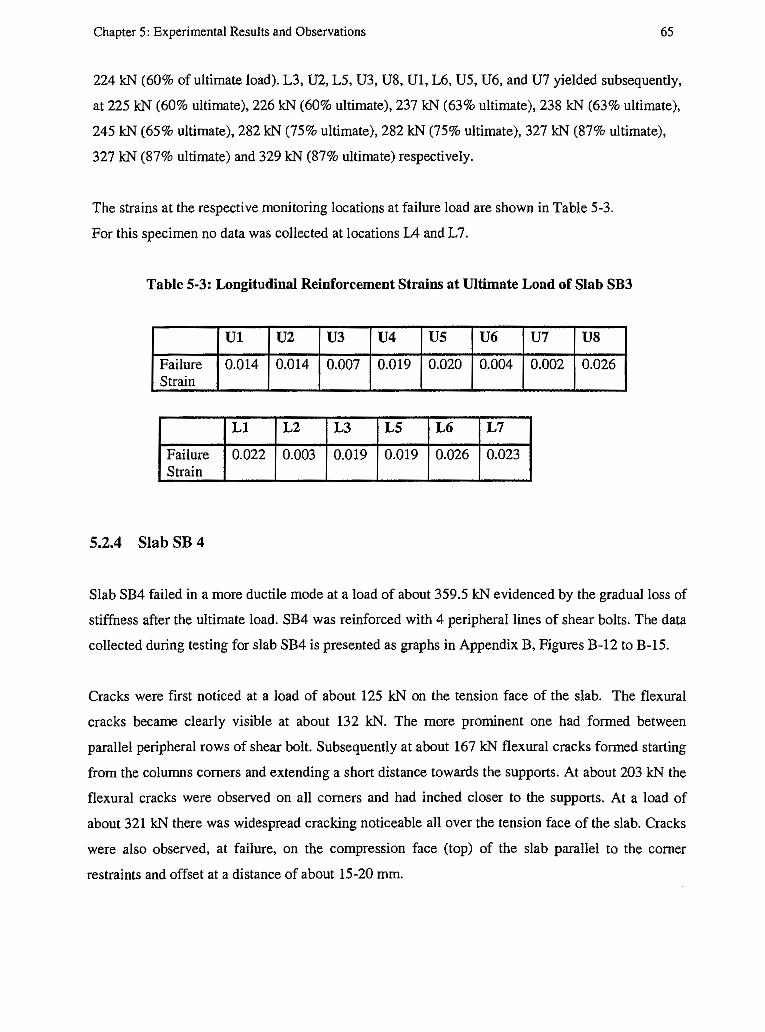
Chapter 5: Experimental Results and Observations 65
224 kN (60% of ultimate load). L3, U2, LS, U3, US, Ul, L6, US, U6, and U7 yielded subsequently,
at 225 kN (60% ultimate), 226 kN (60% ultimate), 237 kN (63% ultimate), 238 kN (63% ultimate),
245 kN (65% ultimate), 282 kN (75% ultimate), 282 kN (75% ultimate), 327 kN (87% ultimate),
327 kN (87% ultimate) and 329 kN (87% ultimate) respectively.
The strains at the respective monitoring locations at failure load are shown in Table 5-3.
For this specimen no data was collected at locations L4 and L 7.
Table 5-3: Longitudinal Reinforcement Strains at Ultimate Load of Slab SB3
Ul U2 U3 U4 us U6 U7 us Failure 0.014 0.014 0.007 0.019 0.020 0.004 0.002 0.026 Strain
Ll L2 L3 LS L6 L7
Failure 0.022 0.003 0.019 0.019 0.026 0.023 Strain
5.2.4 Slab SB 4
Slab SB4 failed in a more ductile mode at a load of about 359.5 kN evidenced by the gradual loss of
stiffness after the ultimate load. SB4 was reinforced with 4 peripheral lines of shear bolts. The data
collected during testing for slab SB4 is presented as graphs in Appendix B, Figures B-12 to B-15.
Cracks were first noticed at a load of about 125 kN on the tension face of the slab. The flexural
cracks became clearly visible at about 132 kN. The more prominent one had formed between
parallel peripheral rows of shear bolt. Subsequently at about 167 kN flexural cracks formed starting
from the columns comers and extending a short distance towards the supports. At about 203 kN the
flexural cracks were observed on all comers and had inched closer to the supports. At a load of
about 321 kN there was widespread cracking noticeable all over the tension face of the slab. Cracks
were also observed, at failure, on the compression face (top) of the slab parallel to the comer
restraints and offset at a distance of about 15-20 mm.
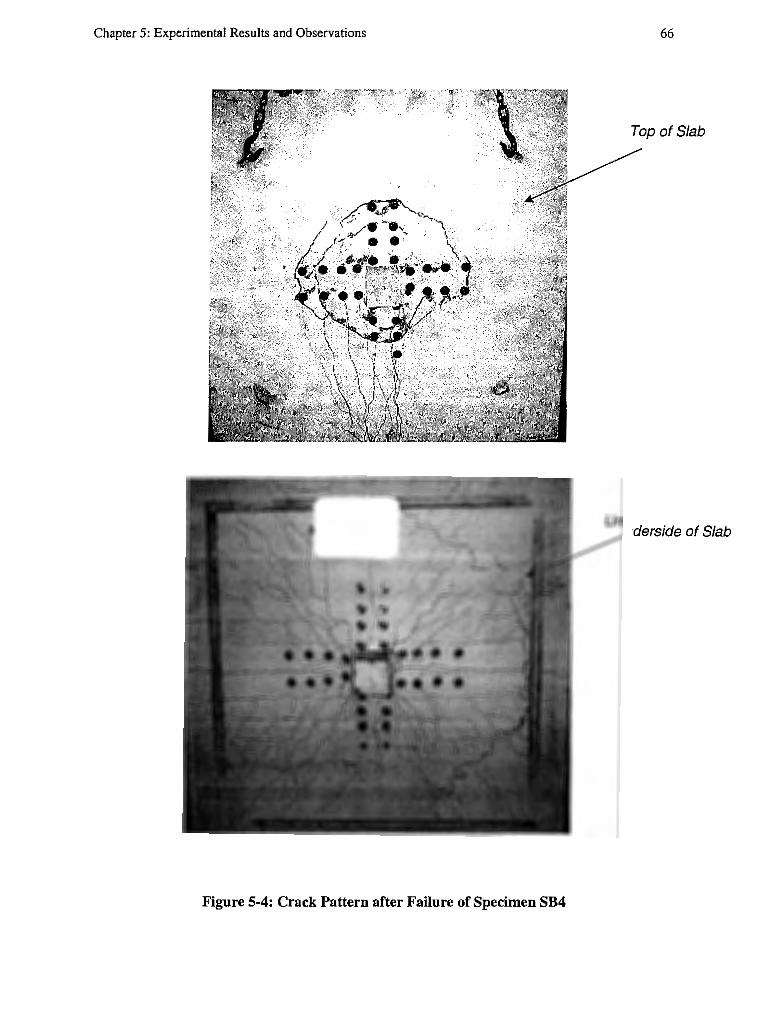
Chapter 5: Experimental Results and Observations 66
Underside of Slab
Figure 5-4: Crack Pattern after Failure of Specimen SB4

Chapter 5: Experimental Results and Observations 67
The LVDT placed at the center of the bottom column (Figure B-12b) measured a maximum
deflection of 31 mm at ultimate load. Figure B-13 shows a plot of load against the crack vertical
width. The crack widths at locations 8, 9, 10 were the same until about 175 kN. A maximum width
of about 4 mm was observed at location 10. The lowest was at location 8.
First yielding in the longitudinal reinforcement occurred at 182 kN (51 % of ultimate load) at Strain
Gauge U7 as seen in Figure B-14. Next Strain Gauge U5 yielded at a load of 197 kN (55% of
ultimate load) as shown in Figure B-14, then Ul yielded at 224 kN (62% of ultimate load). U6, L6,
L4, Ll and LS yielded subsequently at 241 kN (67% ultimate), 242 kN (67% ultimate), 265 kN
(74% ultimate), 270 kN (75% ultimate) and 284 kN (79% ultimate) respectively. There was no
yielding at U4 and US. The strains at the strain gauge locations at ultimate load are shown in Table
5-4. No data was collected at locations U2, U3, L2 and L3.
Table 5-4: Longitudinal Reinforcement Strains at Ultimate Load of Slab SB4
Ul U4 us U6 U7 us Failure 0.011 0.026 0.006 0.006 0.025 0.002 Strain
LI L4 LS L6
Failure 0.003 0.026 0.020 0.018 Strain
5.2.5 Slab SB 5
Slab SB5 failed in a ductile mode at a load of about 353 kN. At ultimate load, there was a
constantly increasing deflection at constant load. This is typical of a flexural failure. Load
Displacement graphs in Figure B-16, post failure crack pattern and strain measured on longitudinal
reinforcement confirm a more ductile flexural failure mode. Data collected while testing slab SB5
is presented as graphs in Figures B-16 to B-19.
Cracks were first noticed at a load of about 125 kN on the tension face of the slab. At a load of 150
kN cracks were noticed to be forming from the corners of openings around the columns. Flexural

Chapter 5: Experimental Results and Observations 68
cracks became visible at about 125 kN starting from the colunms and comers of the holes and
extending a short distance towards the supports. At about 193.8 kN the flexural cracks were
observed to be extending from the comers of the openings towards the edge of the slab. Inclined
cracks became visible inside the openings at a load of about 299 kN. At a load of about 353 kN,
there was a narrow punch perimeter indicating failure on the compression face of the slab roughly
falling between the first and second peripheral lines of shear bolts around the openings.
The maximum central displacement of this slab measured by an internal L VDT was 30.2 mm as
shown in Figure B-16a. Figure B-17 show a plot of load against the crack vertical width. Crack
width was limited to a low value of 2.5 mm at all three locations during the test. Location 8 had a
slightly larger vertical crack width than the two other locations.
First yielding in longitudinal reinforcement was noticed at 232 kN (65% of ultimate load) at Strain
Gauge Ul as seen in Figure B-18a. Next Strain Gauge L3 yielded at a load of 236 kN (67% of
ultimate load) as shown in Figure B-18h, then U4 yielded at 248 kN (70% of ultimate load). Ll, U2,
U3, U7, L2 and LS yielded subsequently at 250 kN (71 % ultimate), 255 kN (72% ultimate), 269 kN
(76% ultimate), 319 kN (90% ultimate), 323 kN (92% ultimate) and 343 kN (97% ultimate)
respectively. Yielding was noticed after ultimate load at L4, L6 and L7. The strains at the strain
gauge locations at ultimate load are shown in Table 5-5. For this specimen no data was collected at
locations US, U6 and US.
Table 5-5: Longitudinal Reinforcement Strains at Ultimate Load of Slab SBS
Ul U2 U3 U4 U7
Strain at 0.008 0.000 0.002 0.013 0.004 Ultimate Load
Ll L2 L3 LS L6 L7
Strain at 0.015 0.000 0.001 0.003 0.000 0.000 Ultimate Load

Chapter 5: Experimental Results and Observations 69
Top of Slab
. ...
Figure 5-5: Crack Pattern after Failure of Specimen SB5

Chapter 5: Experimental Results and Observations 70
5.2.6 Slab SB 6
Slab SB6 failed in a ductile flexural mode at a load of about 336 kN evidenced by the gradual loss
of stiffness after the ultimate load and more intensive formation of cracks around the column as
opposed to a punch through pattern on the tension face. SB6 was the most ductile of all slabs tested.
Load-displacement graphs in Figure B-20, post failure crack patterns, and strains measured on
longitudinal reinforcement all indicate a flexural failure mode. Data collected while testing slab
SB6 is presented as graphs in Appendix B, Figures B-20 to B-23.
Cracking was first noticed at a load of about 103 kN on the tension face of the slab. Flexural cracks
were seen starting from the columns and corners of openings and extending a short distance towards
the supports. At a load of 176 kN there was widespread cracking all over the tension face of this
specimen. At about 250 KN the flexural cracks had extended almost all the way to the edges of the
slab. At 336 kN, there was a failure evidenced by a narrow punch perimeter on the compression
face of the slab almost coincident with the first peripheral line of studs. At failure the concrete
closest to the column had disintegrated, had lost all strength and disintegrated exposing the
longitudinal reinforcement towards the latter stages of the test.
A central LVDT placed at the center of the bottom column (Figure B-20b) measured a maximum
deflection of about 22 mm at ultimate load. The value of 26 mm in Figure B-20a is the
displacement of the testing frame cross piece. Figure B-21 shows a plot of load against the crack
vertical width. A maximum crack width of 10-15 mm was observed at location 9. Location 8 and 10
had lower crack widths.
First yielding of longitudinal reinforcement occurred at 244 kN (73% of ultimate load) at Strain
Gauge L2 as seen in Figure B-22h. Next Strain Gauge L 7 yielded at a load of 250 kN (74% of
ultimate load) as shown in Figure B-22m, US then yielded at 279 kN (83% of ultimate load). U4
yielded subsequently at 303 kN (90% ultimate). Yielding occurred after ultimate load was reached
at locations U3, U6, U7, Ll, L3, L4, LS and L6. No yielding was observed at UL The strains at the
strain gauge locations at ultimate load 336 kN are shown in Table 5-6. For this specimen, because
U2 and U8 were damaged, no data was collected at these locations.
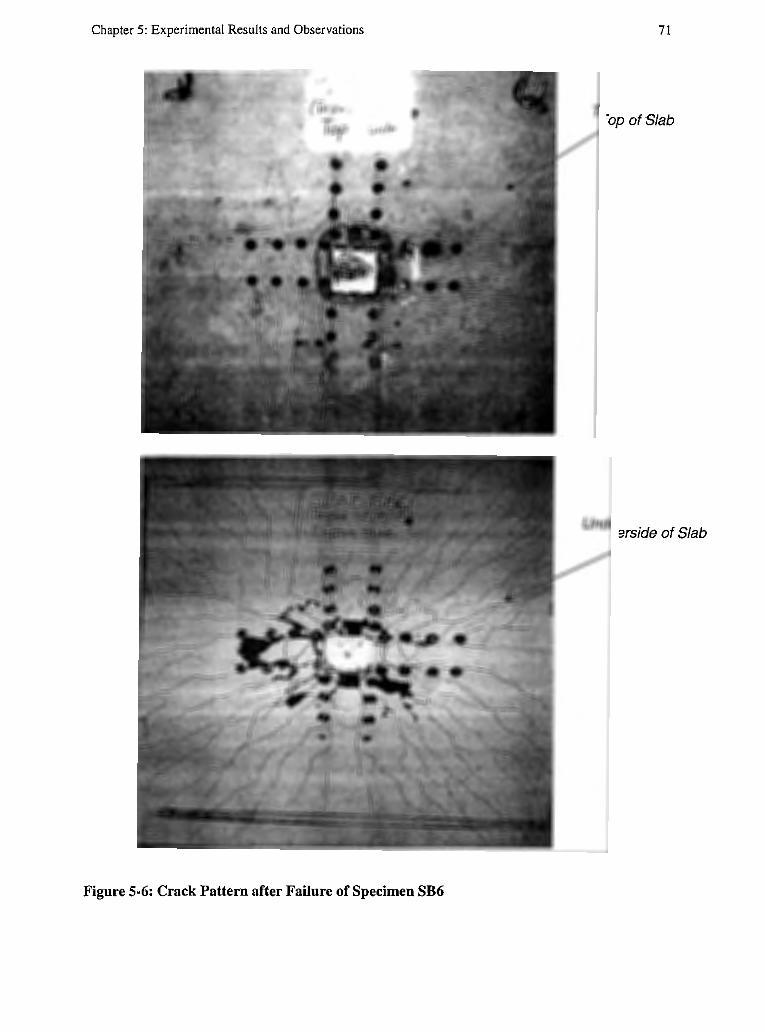
Chapter 5: Experimental Results and Observations 71
(F,,, •. Top -.,,,j"'
Top of Slab
Underside of Slab
Figure 5-6: Crack Pattern after Failure of Specimen SB6

Chapter 5: Experimental Results and Observations 72
Table 5-6: Longitudinal Reinforcement Strains at Ultimate Load of Slab SB6
Ul U3 U4 us U6 U7 Ll L2
Strain at 0 0 0.012 0.005 0.001 0 0.001 0.003 Ultimate Load
L3 L4 LS L6 L7
Strain at 0.001 0.001 0.001 0.001 0.001 Ultimate Load
It is important to note that the diameter and thickness of washers used as anchors on the threaded
end of the shear bolts appeared to influence the distribution of cracking at the connection. Though
varying sizes of washers was not investigated, it was observed that smaller (thickness and diameter)
washers resulted in more cracking around the bolts and a slightly lower ultimate load at the
connection. It may be that smaller size washers prevent the attainment of the yield strength of the
bolts before crushing of the concrete.

Chapter6
Analysis of Experimental Results
This chapter summarises and analyses the relevant data collected from the slab tests carried out.
Inferences are drawn and comparisons made to values predicted from empirical and analytical
equations presented in Chapter 2.
The data is analysed based on the crack pattern, deflection behaviour, stiffness, ductility and strain.
The crack patterns at failure for the specimens tested were presented in Chapter 5. These patterns
sometimes reflect the mode of failure.
6.1 Comparison of Various Code Predictions and Theoretical Analysis
The provisions from the codes of practice have been compared to the empirical failure loads in
Table 6-1: Test Specimens, Code Predictions and Experimental results
= § SBl SB2 SB3 SB4 SB5 SB6
"'·-8 1a. Rows of shear 0 2 3 4 4 4 ·o ·c "' " bolts "' "' [JJ "' Noof i::i 0 0 0 0 4 2
Openines
;,, Eurocode 159 259 324 375 299 337 .Q "' .0 ~ 164 250 305 360 ·- ·- Model Code 345 373 " -" " "' " " ... ui,..
AC! 181 309 309 309 282 295 "' ... "'
" 0 ]U CSA 220 361 321 380 334 358
[JJ
Yield- Flexural 362 362 362 362 362 362 Line Canacitv
s Failure Load P 253 358 376 360 353 336 = "' 23 8 -·- - = ... if! ~ ~ Failure Mode Punching Punching Punching/ Flexure Flexure Flexure
&1 Flexure
73
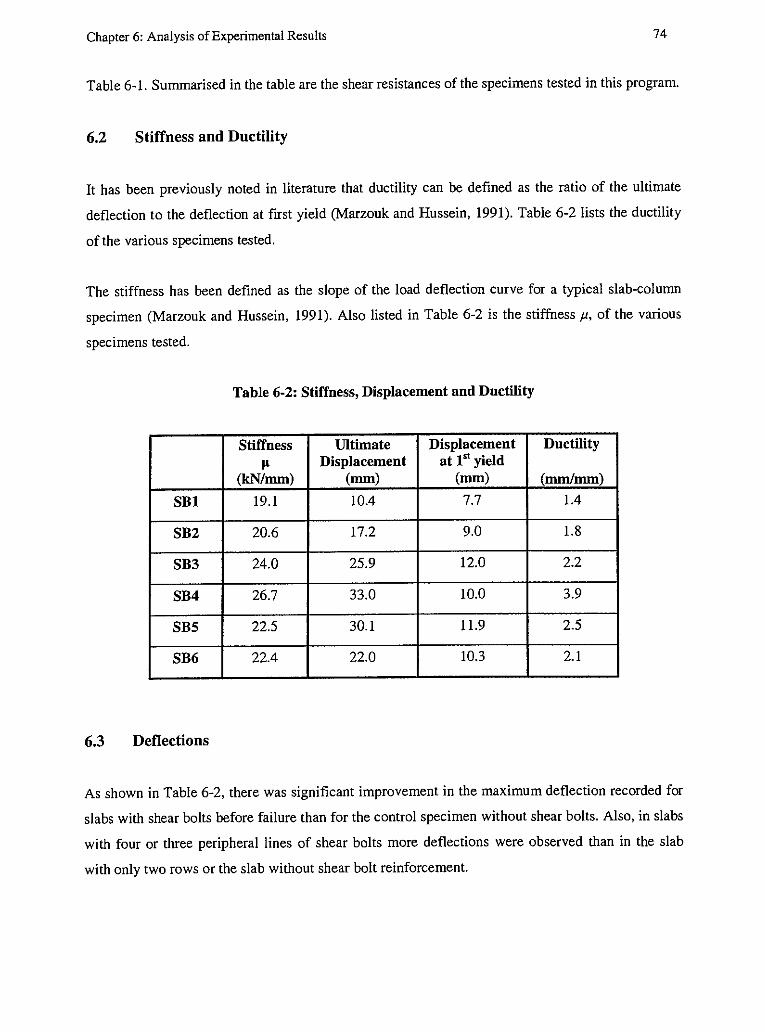
Chapter 6: Analysis of Experimental Results 74
Table 6-1. Summarised in the table are the shear resistances of the specimens tested in this program.
6.2 Stiffness and Ductility
It has been previously noted in literature that ductility can be defined as the ratio of the ultimate
deflection to the deflection at first yield (Marzouk and Hussein, 1991). Table 6-2 lists the ductility
of the various specimens tested.
The stiffness has been defined as the slope of the load deflection curve for a typical slab-column
specimen (Marzouk and Hussein, 1991). Also listed in Table 6-2 is the stiffnessµ, of the various
specimens tested.
Table 6-2: Stiffness, Displacement and Ductility
Stiffness Ultimate Displacement Ductility µ Displacement at 151 yield
(kN/mm) (mm) (mm) (mm/mm)
SBl 19.1 10.4 7.7 1.4
SB2 20.6 17.2 9.0 1.8
SB3 24.0 25.9 12.0 2.2
SB4 26.7 33.0 10.0 3.9
SBS 22.5 30.l 11.9 2.5
SB6 22.4 22.0 10.3 2.1
6.3 Deflections
As shown in Table 6-2, there was significant improvement in the maximum deflection recorded for
slabs with shear bolts before failure than for the control specimen without shear bolts. Also, in slabs
with four or three peripheral lines of shear bolts more deflections were observed than in the slab
with only two rows or the slab without shear bolt reinforcement.
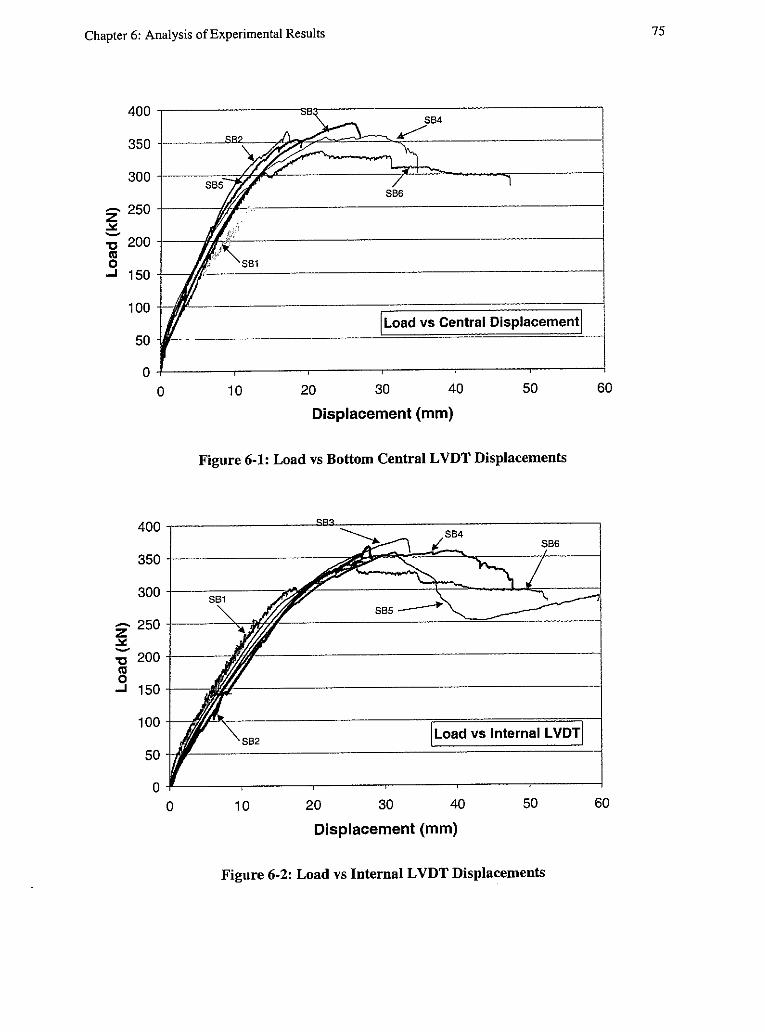
Chapter 6: Analysis of Experimental Results 75
400 SB4
350 ~
300 SB6
- 250 z ~ -"O 200 al 0
..J 150
100
50
0
!Load vs Central Displacement!
l 0 10 20 30 40 50 60
Displacement (mm)
Figure 6-1: Load vs Bottom Central L VDT Displacements
400 SB6
350
300 SB1
- 250 z ~ -"O 200 al 0
..J 150
100 !Load vs Internal LVDTI
50
0 0 10 20 30 40 50 60
Displacement (mm)
Figure 6-2: Load vs Internal LVDT Displacements

Chapter 6: Analysis of Experimental Results
400 83 --· SB4 /'
350
300 S82
S86 ~ 250 ~ :;' 200 Btrn
"' 0 ..;i 150
100 tsp acements at 8 (bottom of Slab)
50
0 0 10 20 30 40 50 60
Displacements (mm)
Figure 6-3: Load vs Displacement at L VDT 8
100 irf;fj-----------==========;--1 !Load-Displacement at LVDT sl
50 JJ/l-~~~~~~~~~===:::::::::::::::::::::::::::::::::::::::::::::::::=---1
0+----~---~---~----~---~-----1
0 10 20 30
Displacement (mm)
40
Figure 6-4: Load vs Displacement at L VDT 9
50 60
76

Chapter 6: Analysis of Experimental Results 77
Figures 6-1 to 6-4 show the deflections for all slabs measured at the locations indicated and
previously described in Chapter 3. Unless otherwise specified, the measurements are from the
bottom LVDT's. In Figure 6-1, the deflection SBl has been shifted by 2.5 mm. The LVDT did not
record any deflection until the load of 80kN. Therefore, the displacement at this load was estimated
as approximately 2.5 mm and the deflection data was shifted accordingly.
6.4 Strains in Longitudinal reinforcement
The strains in the longitudinal reinforcement showed some variation in the location at which first
yield occurred. Table 6-3 shows the locations with respect to Figure 3-17. The loads at which
yielding in the longitudinal reinforcement was first observed is also shown, as well as the other
strain gauge location at which yielding was observed at ultimate load. Figure 6-5 shows the strains
at the L VDT L6 location.
The load at which first yielding occurs is an indicator of the stiffness of the specimen. Also, the
strain at first yield is an indicator of the ductility of the specimen being tested.
Table 6-3: Test Results: Yielding of Longitudinal Reinforcement
Specimen Failure Mode Load at 1" Location of Yielding at Load Yield first Yield Failure (kN) (kN)
SBl 253 Punching 204 L7 U6, U7
SB2 358 Punching 166 L4 Ll,U4,L6,U3,L3, U2,LS,U7,US
SB3 376 Flexure/ 194 LI L2,U4,L3,U2,LS, Punching U3,U8,L6,U6,U7
SB4 360 Flexure 182 U7 US,Ul,U6,L6, L4,Ll,LS
SBS 353 Flexure 232 Ul L3,U4,U3,U7 ,L2 ,LS
SB6 336 Flexure 250 L7 L2,US,U4
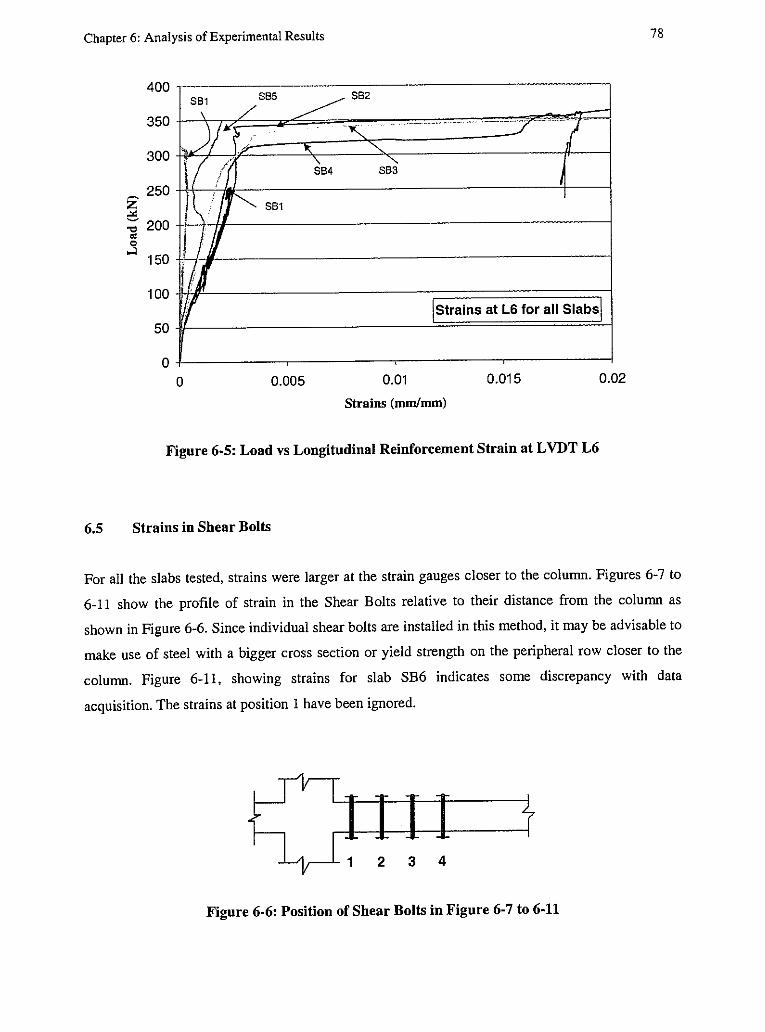
Chapter 6: Analysis of Experimental Results
400
350
300
~ 250
S81 S85 ~S82
' /
1/", / ' .. _, __ ,,_H~•'' ., ....
j' ? / y " " I // ' "' S84 S83
! z e 200 "O
"' 0 ..:i
150
'\ S81
I h !
' {J 100 }!
!strains at LS for all Slabs! 50
0 0 0.005 0.01
Strains (mm/mm)
0.015
Figure 6-5: Load vs Longitudinal Reinforcement Strain at L VDT L6
6.5 Strains in Shear Bolts
0.02
78
For all the slabs tested, strains were larger at the strain gauges closer to the column. Figures 6-7 to
6-11 show the profile of strain in the Shear Bolts relative to their distance from the column as
shown in Figure 6-6. Since individual shear bolts are installed in this method, it may be advisable to
make use of steel with a bigger cross section or yield strength on the peripheral row closer to the
column. Figure 6-11, showing strains for slab SB6 indicates some discrepancy with data
acquisition. The strains at position I have been ignored.
1 2 3 4
Figure 6-6: Position of Shear Bolts in Figure 6· 7 to 6-11

Chapter 6: Analysis of Experimental Results
0.002---
0.0016
.!:0.0008 f! i'ii
0.0004
0.25Fu 1 -e-0.5Fu -+-0.75Fu -o.95Fu
0 +---------------------~ 0 1 2
Position
Figure 6-7: Bolt Strain Relative to Distance from the Column of Specimen SB2
0.002
0.0016 -E E eo.0012
E -.!:0.0008 Ol .. ... u,
0.0004
0 0 2
Position
· + ·0.25Fu · ·, 0.5Fu ~0.75Fu -*-0.95Fu
3
Figure 6-8: Bolt Strain Relative to Distance from the Column of Specimen SB3
79

Chapter 6: Analysis of Experimental Results
0.002
0.0016 -E io.0012
E -,50.0008 m .. .... en
0.0004
0 0 2
Position 3
· + ·0.25Fu ··J;--Q.5Fu ----o.75Fu -0.95Fu
4
Figure 6-9: Bolt Strain Relative to Distance from the Column of Specimen SB4
0.0025
0.002
E E
E°.0015
E -.5 0.001 E
c'ii 0.0005
0 ~
0 2 Position
3
•.
.
-+-0.25Fu -o.5Fu
0.75Fu · 0.95Fu
. .,
4
Figure 6-10: Bolt Strain Relative to Distance from the Column of Specimen SBS
80

Chapter 6: Analysis of Experimental Results
0.002
0.0016
- 0.0012 E E e 0.0008
E -C 0.0004 ·ca a.. - 0 en
-0.0004
-0.0008 Position
0.25Fu -111-Q.5Fu ~0.75Fu ~0.95Fu
4
Figure 6-11: Bolt Strain Relative to Distance from the Column of Specimen SB6
6.6 Effectiveness of Shear Bolts in Reducing Crack Width
81
Cracks were monitored as described in Section 3.5.2. Shear bolts effectively prevented propagation
of shear cracking in slabs reinforced with shear bolts. Table 6-4 gives a comparison of the shear
crack width for the control specimen and the other specimens with transverse shear reinforcement.
Figure 6-12 is a graph of the crack widths for SBl.
Table 6-4: Maximum Crack Widths
Specimens Maximum Observed Crack Width
SBl 10-12 mm
SB2 <2.5 mm
SB3 <2.5 mm
SB4 <2.5 mm
SB5 1.5-2.0 mm
SB6 -
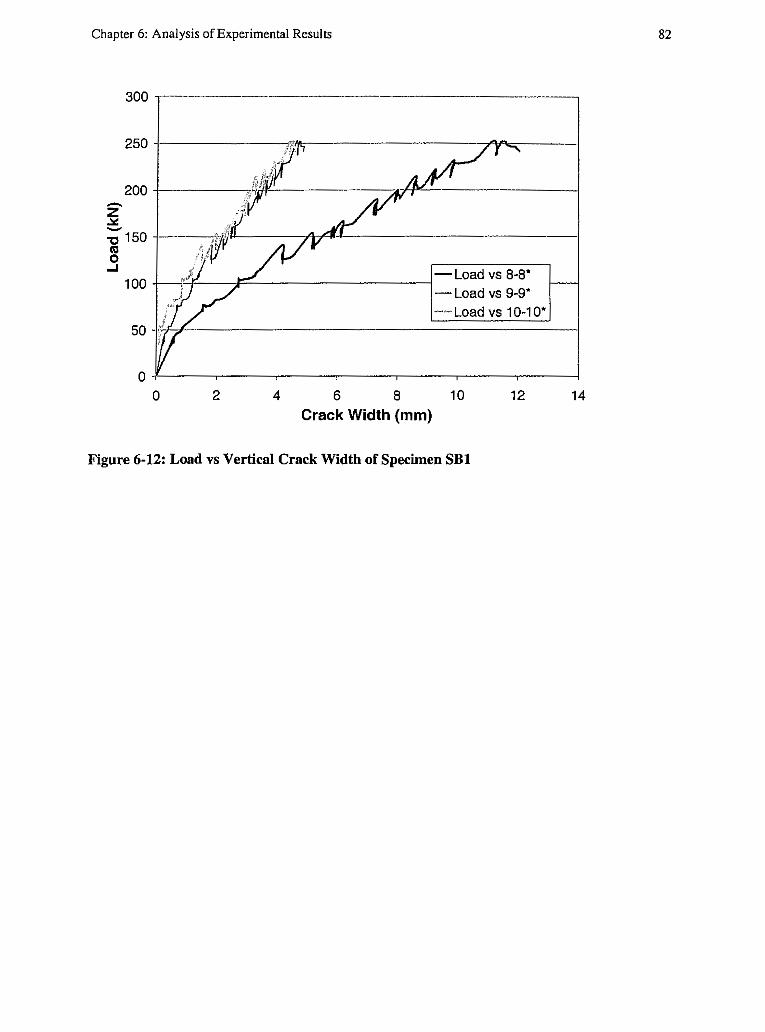
Chapter 6: Analysis of Experimental Results 82
300 ---------- ------------------~
0-1--------------------------; 0 2 4 6 8 10 12 14
Crack Width (mm)
Figure 6-12: Load vs Vertical Crack Width of Specimen SBl

Chapter7
Conclusions and Recommendations
The feasibility and effectiveness of using shear bolt as a new method of transverse reinforcement
has been examined in this research program. While previous research (El-Salakawy, 2003) had
verified the feasibility of the use, this program was focused on determining the behavior of an
interior slab-column connection when reinforced transversely with shear bolts.
7 .1 Conclusions
The data collected during testing and other visual observations made, as described in this thesis,
resulted in the following inferences:
• The experimental setup and procedures that were adopted for testing the interior slab-column
connections subjected to pure axial load is practical. Throughout the course of testing, there
were no major failures or malfunction of equipment. The procedures gave results very
consistent with predictions. The results collected for the specimens showed very little
deviations.
• Shear bolts are effective in preventing punching shear failure in slab-column interior
connections.
• The use of shear bolts as transverse reinforcement allowed the slab-column connection to attain
flexural capacity and increased the ductility of the connection.
• Shear bolts are effective in enhancing the strength of a slab-column connection that has been
subjected to a reduction in strength due to construction of openings and ducts after a structure
has been built. Specimens SB5 and SB6 both failed in flexural mode.
• It was observed that the diameter of the washers (which serve as anchor plates) had an effect on
the ultimate strength of the connections by affecting the ability of the shear bolt to attain yield
before failure at the connection.
83

Chapter 7: Conclusions and Recommendations 84
7.2 Recommendations
• Further testing should be carried out to collect more information on the use of shear bolts as
transverse reinforcement. Different configurations and varied number of studs per peripheral
row may be tested to provide more data.
• Further testing should also consider reversed cyclic loading in order to establish the
effectiveness of the shear bolt in providing ductility in seismic zones.
• In future testing, code of practice requirements with regards to the minimum distance of the
first row of bolts from the column ( d/2), and the maximum spacing between rows of transverse
reinforcement should be followed. If possible code of practice requirements for shear studs
should be adopted for shear bolts pending additional testing to determine specific requirements
for shear bolts.
• Design procedures for shear bolts should be developed. This should include size of bolt, size of
the head, size of the opening drilled in the slab and layout of the shear bolts around the column.
• In future tests, the edge hold down system should have a uniform specified torque. This is to
avoid inconsistencies that may have arisen from different degrees of tightening.

Appendix A
Elastic Frame Analysis in SODA®
A.1 Input File
************************************************************************* I N P U T DAT A E C H 0
*************************************************************************
PROJECT TITLE Continuous Slab System Design
PROJECT DESCRIPTION 2-d elastic frame analysis according to CSA A23.3-94. The continuous slab system consists of 5 spans·in one direction and infinite number of spans in the other direction.
GENERAL DATA Dimension
2-D
Analysis
First Order
STRUCTURE DATA Members
51
NODE DATA Node Name
1 xOyO 2 x3y0 3 x6y0 4 x9y0 5 x12y0 6 x15y0 7 xOyl 8 x0y2 9 x0y4 10 x0y5 11 x0y6 12 xly3 13 x2y3 14 x3yl 15 x3y2 16 x3y3 17 x3y4 18 x9yl
Structure Action Design Code Output
Normal
Units
Frame
Sway
Groups
4
Analysis
Database
None
Nodes
52
X-Coordinate (m)
Y-Coordinate (m )
0 0 3.75 0 7.5 0 11.25 0 15 0 18.75 0 0 0.06 0 2.64 0 2.76 0 5.34 0 5.4 0.075 2.7 3.675 2.7 3.75 0.06 3.75 2.64 3.75 2.7 3.75 2.76 11.25 0.06
85
kN;m
Foreign Sections
Not Included
Load Cases
1
Support Type
Fixed Fixed Fixed Fixed Fixed Fixed
Fixed
Supports
12
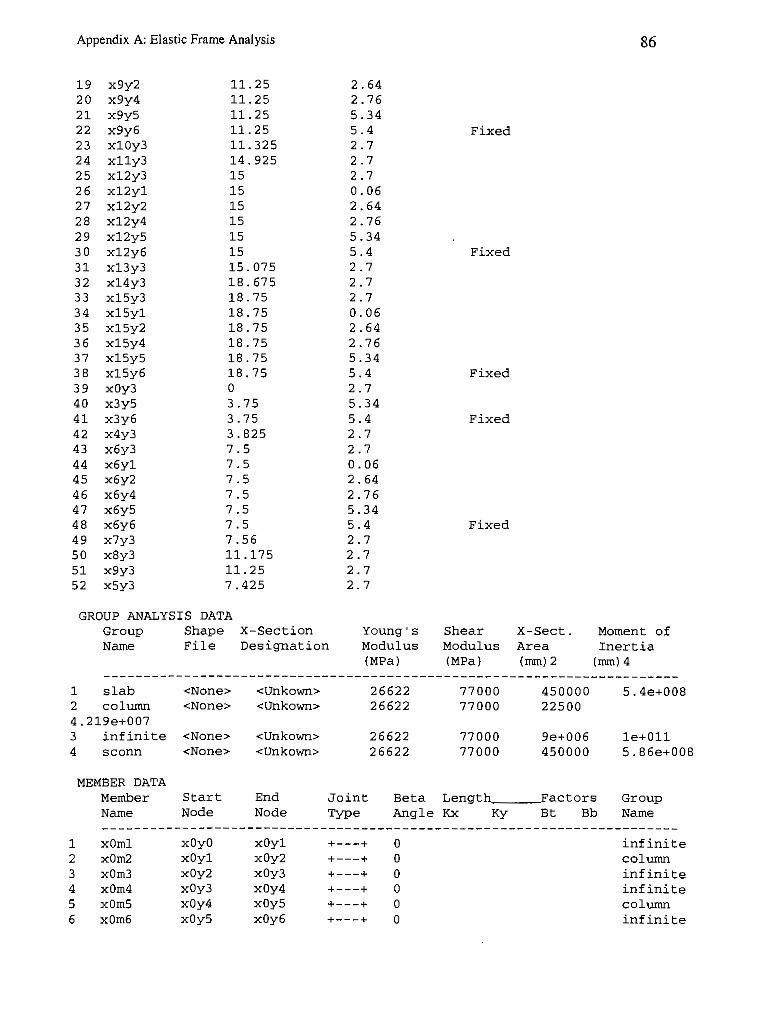
Appendix A: Elastic Frame Analysis 86
19 x9y2 11. 25 2.64 20 x9y4 11. 25 2.76 21 x9y5 11.25 5.34 22 x9y6 11. 25 5.4 Fixed 23 xl0y3 11. 325 2.7 24 xlly3 14. 925 2.7 25 xl2y3 15 2.7 26 xl2yl 15 0.06 27 xl2y2 15 2.64 28 xl2y4 15 2.76 29 xl2y5 15 5.34 30 xl2y6 15 5.4 Fixed 31 xl3y3 15.075 2.7 32 xl4y3 18.675 2.7 33 xl5y3 18.75 2.7 34 xl5yl 18.75 0.06 35 xl5y2 18.75 2.64 36 xl5y4 18.75 2.76 37 xl5y5 18.75 5.34 38 xl5y6 18. 75 5.4 Fixed 39 x0y3 0 2.7 40 x3y5 3.75 5.34 41 x3y6 3.75 5.4 Fixed 42 x4y3 3.825 2.7 43 x6y3 7.5 2.7 44 x6yl 7.5 0.06 45 x6y2 7.5 2.64 46 x6y4 7.5 2.76 47 x6y5 7.5 5.34 48 x6y6 7.5 5.4 Fixed 49 x7y3 7.56 2.7 50 x8y3 11.175 2.7 51 x9y3 11.25 2.7 52 x5y3 7.425 2.7
GROUP ANALYSIS DATA Group Shape X-Section Young's Shear X-Sect. Moment of Name File Designation Modulus Modulus Area Inertia
(MPa) (MPa) (mm) 2 (mm) 4 -----------------------------------------------------------------------
1 slab <None> <Unkown> 26622 77000 450000 5.4e+008 2 column <None> <Unkown> 26622 77000 22500 4.219e+007 3 infinite <None> <Unkown> 26622 77000 9e+006 le+Oll 4 sconn <None> <Unkown> 26622 77000 450000 5.86e+008
MEMBER DATA Member Start End Joint Beta Length Factors Group Name Node Node Type Angle Kx Ky Bt Bb Name
1 xOml xOyO xOyl +---+ 0 infinite 2 x0m2 xOyl x0y2 +---+ 0 column 3 x0m3 x0y2 x0y3 +---+ 0 infinite 4 x0m4 x0y3 x0y4 +---+ 0 infinite 5 x0m5 x0y4 x0y5 +---+ 0 column 6 x0m6 x0y5 x0y6 +---+ 0 infinite

Appendix A: Elastic Frame Analysis 87
7 mly3 x0y3 xly3 +---+ 0 sconn 8 m2y3 xly3 x2y3 +---+ 0 slab 9 m3y3 x2y3 x3y3 +---+ 0 sconn 10 m4y3 x3y3 x4y3 +---+ 0 sconn 11 x3m3 x3y2 x3y3 +---+ 0 infinite 12 x3m4 x3y3 x3y4 +---+ 0 infinite 13 x3m5 x3y4 x3y5 +·---+ 0 column 14 x3m6 x3y5 x3y6 +---+ 0 infinite 15 x6ml x6y0 x6yl +---+ 0 infinite 16 x6m2 x6yl x6y2 +---+ 0 column 17 x6m3 x6y2 x6y3 +---+ 0 infinite 18 x6m4 x6y3 x6y4 +---+ 0 infinite 19 x6m6 x6y5 x6y6 +---+ 0 infinite 20 x6m5 x6y4 x6y5 +---+ 0 column 21 x9ml x9y0 x9yl +---+ 0 infinite 22 x9m2 x9yl x9y2 +---+ 0 column 23 x9m3 x9y2 x9y3 +---+ 0 infinite 24 x9m4 x9y3 x9y4 +---+ 0 infinite 25 x9m5 x9y4 x9y5 +---+ 0 column 26 x9m6 x9y5 x9y6 +---+ 0 infinite 27 x12ml xl2y0 x12yl +---+ 0 infinite 28 x12m2 x12yl x12y2 +---+ 0 column 29 x12m3 xl2y2 x12y3 +---+ 0 infinite 30 xl2m4 xl2y3 x12y4 +---+ 0 infinite 31 x12m5 x12y4 x12y5 +---+ 0 column 32 xl2m6 xl2y5 x12y6 +---+ 0 infinite 33 xl5ml x15y0 x15yl +---+ 0 infinite 34 xl5m2 x15yl x15y2 +---+ 0 column 35 x15m3 x15y2 x15y3 +---+ 0 infinite 36 x15m4 xl5y3 x15y4 +---+ 0 infinite 37 x15m5 x15y4 x15y5 +---+ 0 column 38 x15m6 xl5y5 x15y6 +---+ 0 infinite 39 m5y3 x4y3 x5y3 +---+ 0 slab 40 m6y3 x5y3 x6y3 +---+ 0 sconn 41 m7y3 x6y2 x7y3 +---+ 0 sconn 42 m9y3 x8y3 x9y3 +---+ 0 sconn 43 ml0y3 x9y3 x10y3 +---+ 0 sconn 44 m8y3 x7y3 x8y3 +---+ 0 slab 45 mlly3 xl0y3 xlly3 +---+ 0 slab 46 m12y3 xlly3 x12y3 +---+ 0 sconn 47 ml3y3 x12y3 x13y3 +---+ 0 sconn 48 m14y3 x13y3 x14y3 +---+ 0 slab 49 m15y3 x14y3 x15y3 +---+ 0 sconn 50 x3ml x3y0 x3yl +---+ 0 infinite 51 x3m2 x3yl x3y2 +---+ 0 column
LOAD NAME DATA Member Load: udl Member w@Start Start w@Finish Finish Orient- Load Type Name (kN Im ) (L/100) (kN /m ) (L/100) ation
-----------------------------------------------------------------------1 m2y3 -69.4 0 -69.4 1 y FULL UNIDL 2 m10y3 -69.4 0 -69.4 1 y FULL UNIDL 3 mlly3 -69.4 0 -69.4 1 y FULL UNIDL 4 ml2y3 -69.4 0 -69.4 1 y FULL UNIDL 5 ml3y3 -69.4 0 -69.4 1 y FULL UNIDL
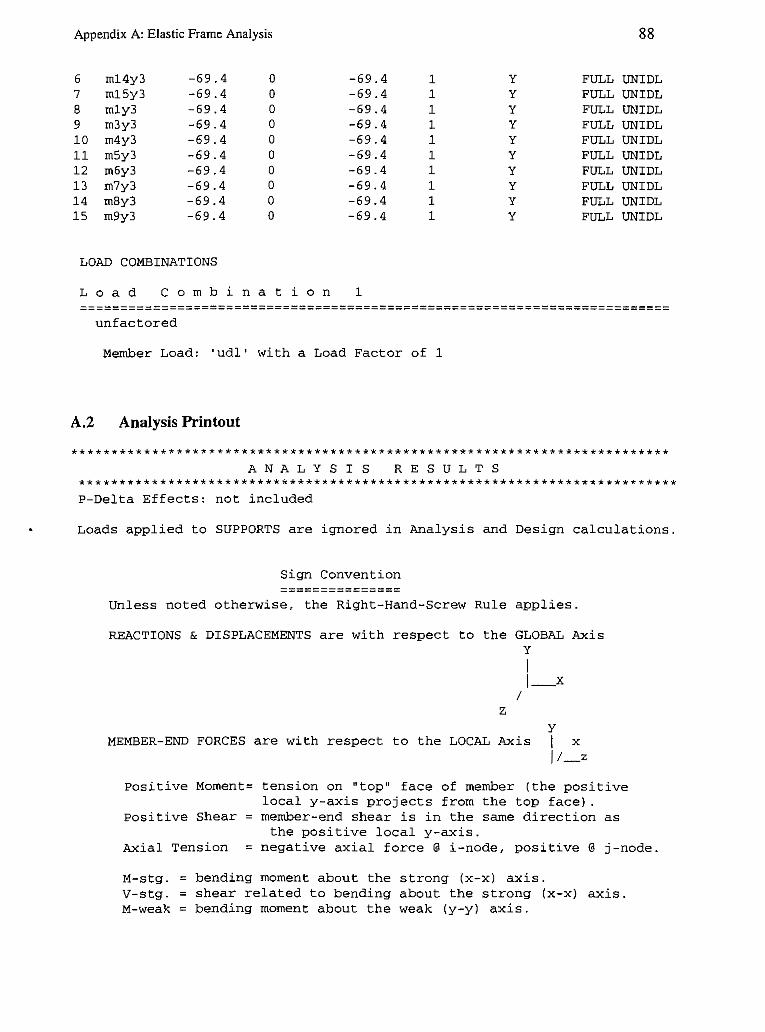
Appendix A: Elastic Frame Analysis 88
6 m14y3 -69.4 0 -69.4 1 y FULL UNIDL 7 m15y3 -69.4 0 -69.4 1 y FULL UNIDL 8 mly3 -69.4 0 -69.4 1 y FULL UNIDL 9 m3y3 -69.4 0 -69.4 1 y FULL UNIDL 10 m4y3 -69.4 0 -69.4 1 y FULL UNIDL 11 m5y3 -69.4 0 -69.4 1 y FULL UNIDL 12 m6y3 -69.4 0 -69.4 1 y FULL UNIDL 13 m7y3 -69.4 0 -69.4 1 y FULL UNIDL 14 m8y3 -69.4 0 -69.4 1 y FULL UNIDL 15 m9y3 -69.4 0 -69.4 1 y FULL UNIDL
LOAD COMBINATIONS
L o a d C o m b ination 1 ===========---=-------------------------=----==---=---------====-========
unfactored
Member Load: 'udl' with a Load Factor of 1
A.2 Analysis Printout
************************************************************************** ANALYSIS RESULTS
************************************************************************** P-Delta Effects: not included
Loads applied to SUPPORTS are ignored in Analysis and Design calculations.
Sign Convention =========:::;;:;::;::;::;::::;;
Unless noted otherwise, the Right-Hand-Screw Rule applies.
REACTIONS & DISPLACEMENTS are with respect to the GLOBAL Axis y
I z
I J_x
y MEMBER-END FORCES are with respect to the LOCAL Axis J x
J/_z
Positive Moment= tension on 11 top 11 face of member (the positive local y-axis projects from the top face).
Positive Shear= member-end shear is in the same direction as the positive local y-axis.
Axial Tension = negative axial force@ i-node, positive@ j-node.
M-stg. : bending moment about the strong (x-x) axis. v-stg. : shear related to bending about the strong (x-x) axis. M-weak: bending moment about the weak (y-y) axis.
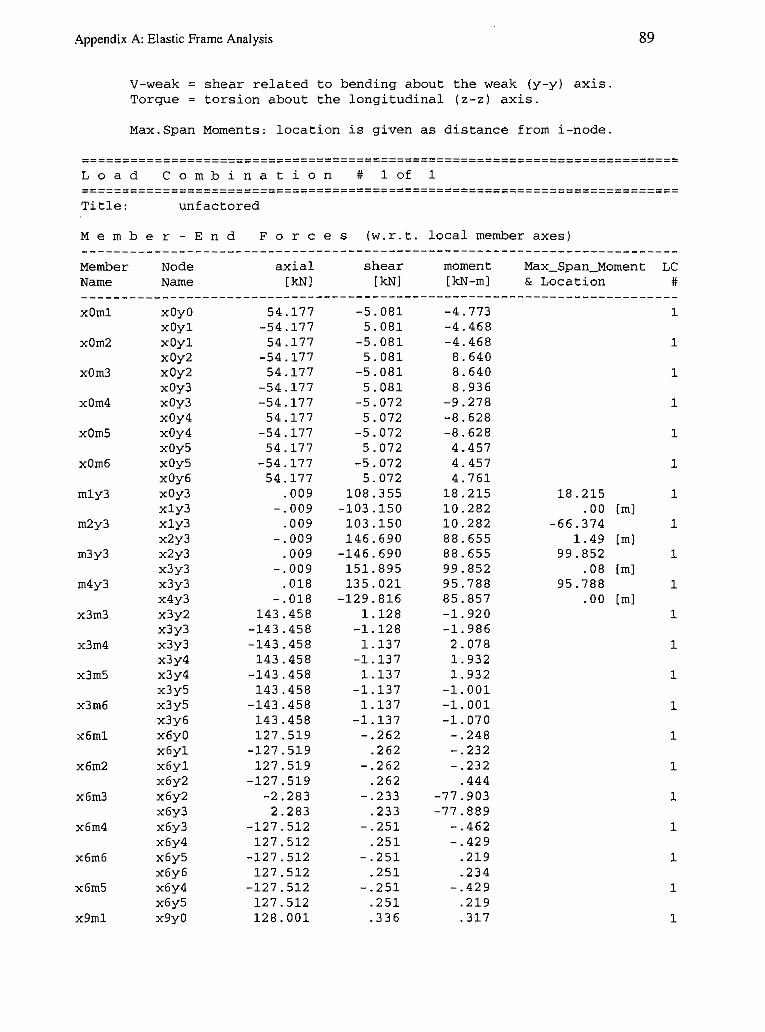
Appendix A: Elastic Frame Analysis
V-weak; shear related to bending about the weak (y-y) axis. Torque torsion about the longitudinal (z-z) axis.
Max.Span Moments: location is given as distance from i-node.
89
======-====--============-==----------------=--=--=====================---L o a d C o m b i n a t i o n # 1 of 1
Title: unfactored
M e m b e r - E n d Forces (w.r.t. local member axes)
Member Name
xOml
x0m2
x0m3
x0m4
x0m5
x0m6
mly3
m2y3
m3y3
m4y3
x3m3
x3m4
x3m5
x3m6
x6ml
x6m2
x6m3
x6m4
x6m6
x6m5
x9ml
Node Name
xOyO xOyl xOyl x0y2 x0y2 x0y3 x0y3 x0y4 x0y4 x0y5 x0y5 x0y6 x0y3 xly3 xly3 x2y3 x2y3 x3y3 x3y3 x4y3 x3y2 x3y3 x3y3 x3y4 x3y4 x3y5 x3y5 x3y6 x6y0 x6yl x6yl x6y2 x6y2 x6y3 x6y3 x6y4 x6y5 x6y6 x6y4 x6y5 x9y0
axial [kNl
54.177 -54.177 54.177
-54.177 54 .177
-54.177 -54.177 54.177
-54.177 54.177
-54.177 54 .177
.009 -.009
.009 -.009
.009 -.009
.018 -.018
143.458 -143.458 -143.458
143.458 -143.458 143.458
-143.458 143.458 127.519
-127.519 127.519
-127.519 -2.283 2.283
-127.512 127.512
-127.512 127.512
-127.512 127.512 128.001
shear [kNl
-5.081 5.081
-5.081 5.081
-5.081 5.081
-5.072 5.072
-5.072 5. 072
-5. 072 5.072
108.355 -103.150 103.150 146.690
-146.690 151.895 135. 021
-129.816 1.128
-1.128 1.137
-1.137 1.137
-1.137 1.137
-1.137 -.262
.262 -.262
.262 -.233
.233 -.251
.251 -.251
.251 -.251
.251
.336
moment [kN-ml
-4. 773 -4.468 -4.468 8.640 8.640 8.936
-9.278 -8.628 -8.628
4.457 4.457 4.761
18.215 10.282 10.282 88.655 88.655 99.852 95.788 85.857 -1.920 -1.986 2. 078 1. 932 1. 932
-1.001 -1.001 -1. 070 -.248 -.232 -.232
.444 -77.903 -77.889
-.462 -.429
.219
.234 -.429
.219
. 317
Max_Span_Moment LC & Location #
18.215 .00 [ml
-66.374 1. 49 [ml
99.852 .08 [ml
95.788 .00 [ml
1
1
1
1
1
1
1
1
1
1
1
1
1
1
1
1
1
1
1
1
1

Appendix A: Elastic Frame Analysis 90
x9yl -128.001 -.336 .297
x9m2 x9yl 128.001 .336 .297 1
x9y2 -128.001 -.336 -.569
x9m3 x9y2 128.001 .336 -.569 1
x9y3 -128.001 -.336 -.589 x9m4 x9y3 -128.001 .326 .599 1
x9y4 128.001 -.326 .556
x9m5 x9y4 -128.001 .326 .556 1
x9y5 128.001 -.326 -.285
x9m6 x9y5 -128.001 .326 -.285 1
x9y6 128.001 - . 326 -.304
x12ml x12y0 143.265 -1.146 -1. 074 1
x12yl -143.265 1.146 -1.005
x12m2 x12yl 143.265 -1.146 -1.005 1
x12y2 -143.265 1.146 1. 951
x12m3 x12y2 143.265 -1.146 1. 951 1
x12y3 -143.265 1.146 2.018
x12m4 x12y3 -143.265 -1.155 -2 .111 1
x12y4 143.265 1.155 -1.963
x12m5 x12y4 -143.265 -1.155 -1.963 1
x12y5 143.265 1.155 1. 018
x12m6 x12y5 -143.265 -1.155 1. 018 1
x12y6 143.265 1.155 1. 087
x15ml x15y0 54.208 5.088 4.780 1
x15yl -54.208 -5.088 4 .475
x15m2 x15yl 54.208 5.088 4.475 1
x15y2 -54.208 -5.088 -8.652
x15m3 x15y2 54.208 5.088 -8.652 1
x15y3 -54.208 -5.088 -8.949
x15m4 x15y3 -54.208 5.078 9.290 1
x15y4 54.208 -5.078 8.639
x15m5 x15y4 -54.208 5. 078 8.639 1
x15y5 54.208 -5.078 -4.462
x15m6 x15y5 -54.208 5.078 -4.462 1
x1Sy6 54.208 -5. 078 -4.767
m5y3 x4y3 .018 129.816 85.857 -35.557 1
x5y3 -.018 120.024 68.231 1.87 [ml
m6y3 x5y3 .018 -120.024 68.231 77.428 1
x6y3 -.018 125.229 77.428 .08 [ml
m7y3 x6y2 91.805 91. 763 78.347 78.347 1
x7y3 -88.860 -88.818 70.686 .00 [ml
m9y3 x8y3 .029 -125. 243 69.973 79.561 1
x9y3 -.029 130.448 79.561 .08 [ml
m10y3 x9y3 .019 125.553 78.374 78.374 1
x10y3 -.019 -120.348 69.153 .00 [ml
m8y3 x7y3 .029 125.638 70.686 -43.038 1
x8y3 -.029 125.243 69.973 1.81 [ml
mlly3 x10y3 .019 120.348 69.153 -35.197 1
xlly3 -.019 129. 492 85. 611 1. 73 [ml
m12y3 xlly3 .019 -129.492 85.611 95.518 1
x12y3 -.019 134. 697 95.518 .08 [ml
m13y3 x12y3 .010 151. 834 99.646 99.646 1
x13y3 - . 010 -146.629 88.454 .00 [ml
m14y3 x13y3 .010 146.629 88.454 -66.445 1
x14y3 - .010 103. 211 10.303 2 .11 [ml
m15y3 x14y3 .010 -103. 211 10.303 18.239 1
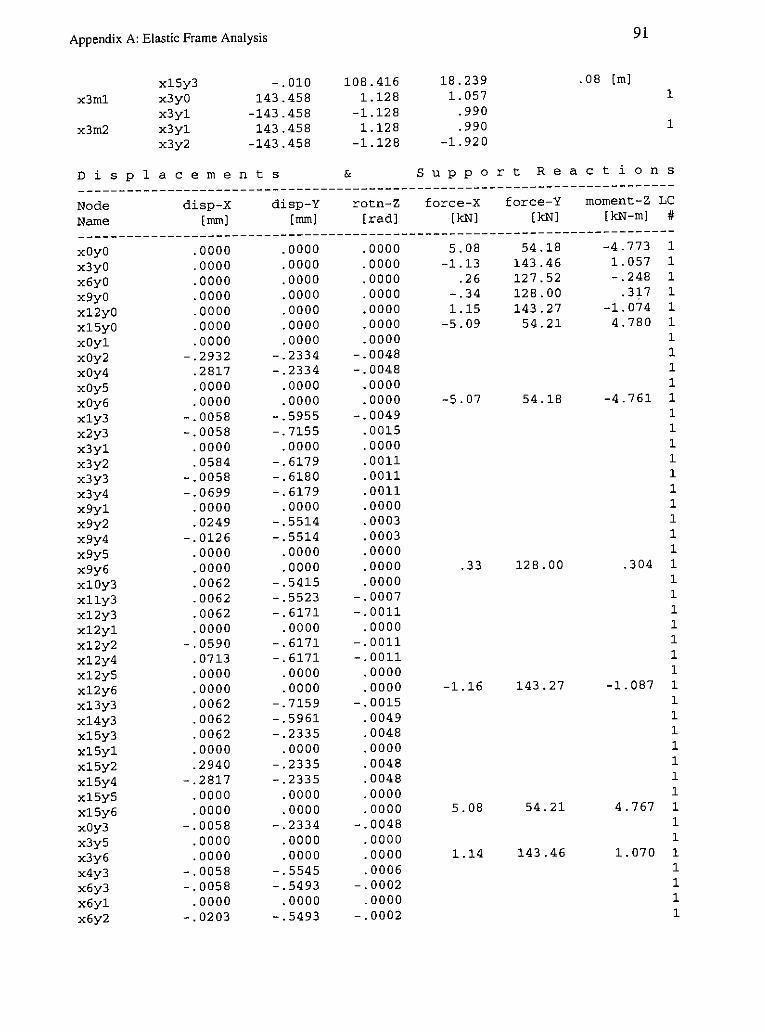
Appendix A: Elastic Frame Analysis
x3rnl
x3rn2
x15y3 x3y0 x3yl x3yl x3y2
-.010 143.458
-143.458 143.458
-143.458
D i s p 1 a c e rn e n t s
108.416 1.128
-1.128 1.128
-1.128
&
18.239 1.057
.990
.990 -1.920
. 08 (ml
91
1
1
S u p p o r t R e a c t i o n s
--------------------------------------------------------------------------Node Name
disp-X [mm]
disp-Y [mm]
rotn-Z [rad]
force-X [kNJ
force-Y [kN]
rnornent-Z LC [kN-rn] #
--------------------------------------------------------------------------xOyO x3y0 x6y0 x9y0 x12y0 x15y0 xOyl x0y2 x0y4 x0y5 x0y6 xly3 x2y3 x3yl x3y2 x3y3 x3y4 x9yl x9y2 x9y4 x9y5 x9y6 x10y3 xlly3 x12y3 x12yl x12y2 x12y4 x12y5 x12y6 x13y3 x14y3 x15y3 x15yl x15y2 x15y4 x15y5 x15y6 x0y3 x3y5 x3y6 x4y3 x6y3 x6yl x6y2
.0000
.0000
.0000
.0000
.0000
.0000
.0000 -.2932
.2817
.0000
.0000 -.0058 -.0058
.0000
.0584 -.0058 -.0699
.0000
.0249 -.0126
.0000
.0000
.0062
.0062
.0062
.0000 -.0590
. 0713
.0000
.0000
.0062
.0062
.0062
.0000
.2940 -.2817
.0000
.0000 -.0058
.0000
.0000 -.0058 -.0058
.0000 -.0203
.0000
.0000
.0000
.0000
.0000
.0000
.0000 -.2334 -.2334
.0000
.0000 -.5955 - . 7155
.0000 -.6179 -.6180 -.6179
.0000 -.5514 -.5514
.0000
.0000 -.5415 -.5523 - . 6171
.0000 - . 6171 - . 6171
.0000
.0000 -.7159 -.5961 -.2335
.0000 -.2335 -.2335
.0000
.0000 -.2334
.0000
.0000 -.5545 -.5493
.0000 -.5493
.0000
.0000
.0000
.0000
.0000
.0000
.0000 -.0048 -.0048
.0000
.0000 -.0049
.0015
.0000
. 0011
. 0011
. 0011
.0000
.0003
.0003
.0000
.0000
.0000 -.0007 - . 0011
.0000 -.0011 - . 0011
.0000
.0000 -.0015
.0049
.0048
.0000
.0048
.0048
.0000
.0000 -.0048
.0000
.0000
.0006 -.0002
.0000 -.0002
5.08 -1.13
.26 -.34 1.15
-5.09
-5.07
.33
-1.16
5.08
1.14
54.18 143.46 127.52 128.00 143.27
54.21
54.18
128.00
143.27
54.21
143.46
-4.773 1 1. 057 1 -.248 1
.317 1 -1. 074 1
4.780 1 1 1 1 1
-4.761 1 1 1 1 1 1 1 1 1 1 1
.304 1 1 1 1 1 1 1 1
-1. 087 1 1 1 1 1 1 1 1
4.767 1 1 1
1. 070 1 1 1 1 1

Appendix A: Elastic Frame Analysis
x6y4 x6y5 x6y6 x7y3 x8y3 x9y3 x5y3
.0087
.0000
.0000
.0062
.0062
.0062 -.0058
- . 5493 .0000 .0000
-.5767 -.5886 -.5514 -.5446
-.0002 .0000 .0000
-.0006 .0007 .0003 .0001
-.25 127.51
92
1 1
-.234 1 1 1 l 1
Sum of Input Loads I Sum of Reactions [kNJ
force-X = force-Y =
.oo I -1301. 25 I
.00 1301. 25
--------------------------------------------------------------------------For ALL Lo ad Combinations --------------------------------------------------------------------------MAXIMUM Member - End Forces (w.r.t. local member axes)
Member Name
xOml x0m2 x0m3 x0m4 x0m5 x0m6 mly3 m2y3 m3y3 m4y3 x3m3 x3m4 x3m5 x3m6 x6ml x6m2 x6m3 x6m4 x6m6 x6m5 x9ml x9m2 x9m3 x9m4 x9m5 x9m6 xl2ml xl2m2 xl2m3 xl2m4 xl2m5
tension [kN] (LC)
• 0 ( 0) . 0 ( 0) . 0 ( 0)
54 .2 ( 1) 54 .2 ( 1) 54 .2 ( 1)
. 0 ( 0)
. 0 ( 0) • 0 ( 0) • 0 ( 0) • 0 ( 0)
143.5 ( 1) 143.5 ( 1) 143. 5 ( 1)
. 0 ( 0)
. 0 ( 0) 2. 3 ( 1)
127.5 ( 1) 127.5 ( 1) 127.5 ( 1)
. 0 ( 0)
. 0 ( 0)
. 0 ( 0) 128.0 ( 1) 128.0 ( 1) 128.0 ( 1)
• 0 ( 0) . 0 ( 0) . 0 ( 0)
143. 3 ( 1) 143. 3 ( 1)
comp 1 n [kNJ (LC)
-54.2 ( 1) -54.2 ( 1) -54.2 ( 1)
. 0 ( 0)
. 0 ( 0)
. 0 ( 0)
. 0 ( 1)
. 0 ( 1)
. 0 ( 1)
. 0 ( 1) -143.5 ( 1)
. 0 ( 0)
.0 ( 0)
. 0 ( 0) -127 .5 ( 1) -127 .5 ( 1)
. 0 ( 0)
.0 ( 0)
.0 ( 0)
.0 ( 0) -128.0 ( 1) -128.0 ( 1) -128.0 ( 1)
. 0 ( 0)
. 0 ( 0)
. 0 ( 0) -143 .3 ( 1) -143.3 ( 1) -143.3 ( 1)
. 0 ( 0)
. 0 ( 0)
shear end-moment [kN] (LC) [kN-m] (LC)
5 .1 ( 1) 5 .1 ( 1) 5.1 ( 1) 5 .1 ( 1) 5 .1 ( 1) 5 .1 ( 1)
108.4 ( 1) 146.7 ( 1) 151.9 ( 1) 135.0 ( 1)
1.1 ( 1) 1.1 ( 1) 1.1 ( 1) 1.1 ( 1)
.3 ( 1)
.3 ( 1)
.2 ( 1)
. 3 ( 1)
.3 ( 1)
.3 ( 1)
. 3 ( 1)
. 3 ( 1)
. 3 ( 1)
.3 ( 1)
. 3 ( 1)
.3 ( 1) 1.1 ( 1)
1.1 ( 1) 1.1 ( 1) 1.2 ( 1) 1.2 ( 1)
4.8 ( 1) 8. 6 ( 1) 8. 9 ( 1) 9. 3 ( 1) 8.6 ( 1) 4. 8 ( 1)
18 .2 ( 1) 88. 7 ( 1) 99.9 ( 1) 95.8 ( 1) 2. 0 ( 1) 2 .1 ( 1) 1.9 ( 1) 1.1 ( 1)
.2 ( 1)
. 4 ( 1) 77.9 ( 1)
.5 ( 1)
.2 ( 1)
.4 ( 1)
. 3 ( 1)
. 6 ( 1)
.6 ( 1)
. 6 ( 1)
. 6 ( 1)
. 3 ( 1) 1.1 ( 1) 2.0 ( 1) 2.0 ( 1) 2.1 ( 1) 2 .0 ( 1)
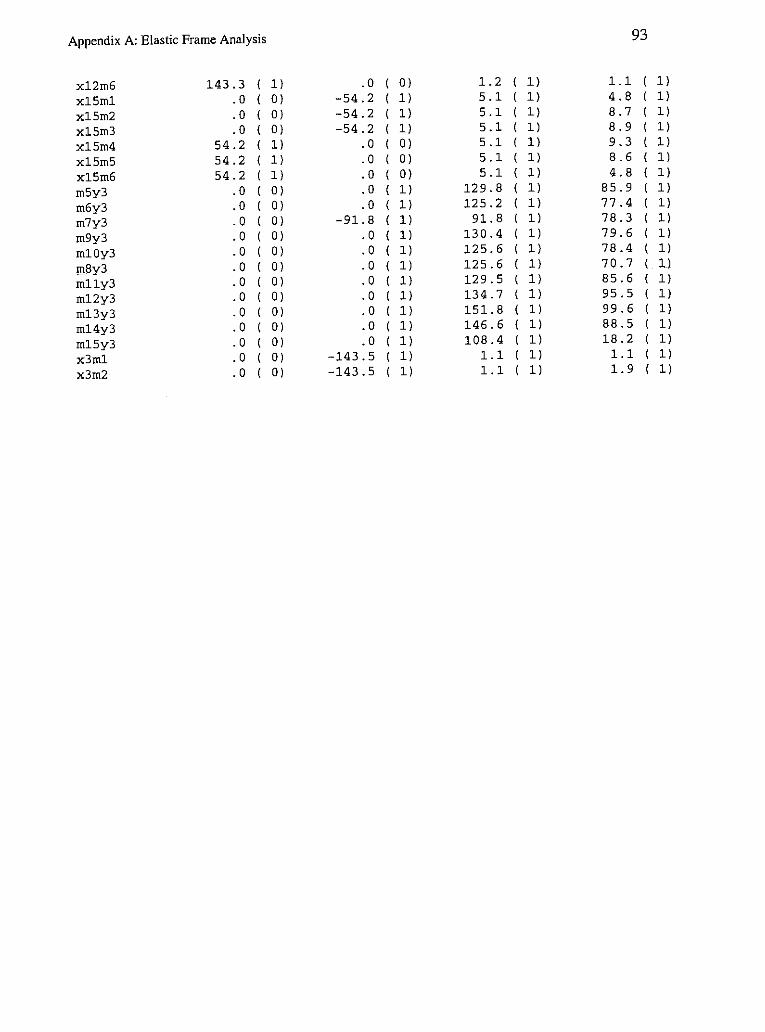
Appendix A: Elastic Frame Analysis 93
x12rn6 143.3 ( 1) .0 ( 0) 1.2 1) 1.1 1)
x15rnl .0 ( 0) -54.2 ( 1) 5.1 1) 4.8 1)
x15rn2 .0 ( 0) -54.2 ( 1) 5.1 1) 8.7 1)
x15rn3 .0 ( 0) -54.2 ( 1) 5.1 1) 8.9 1)
x15rn4 54.2 ( 1) . 0 ( 0) 5.1 1) 9.3 1)
x15rn5 54.2 ( 1) .o ( 0) 5.1 1) 8.6 1)
x15rn6 54.2 ( 1) .0 ( 0) 5.1 1) 4.8 1)
rn5y3 . 0 ( 0) .0 ( 1) 129.8 1) 85.9 1)
rn6y3 .0 ( 0) .0 ( 1) 125.2 1) 77.4 1)
rn7y3 . 0 ( 0) -91.8 ( 1) 91. 8 1) 78.3 1)
rn9y3 . 0 ( 0) . 0 ( 1) 130.4 1) 79.6 1)
rn10y3 . 0 ( 0) . 0 ( 1) 125.6 1) 78.4 1)
rn8y3 . 0 ( 0) . 0 ( 1) 125.6 1) 70.7 1)
rnlly3 . 0 ( 0) . 0 ( 1) 129.5 1) 85.6 1)
rn12y3 . 0 ( 0) .0 ( 1) 134. 7 1) 95.5 1)
rn13y3 . 0 ( 0) .0 ( 1) 151.8 1) 99.6 1)
rn14y3 . 0 ( 0) .0 ( 1) 146.6 1) 88.5 1)
rn15y3 . 0 ( 0) .0 ( 1) 108.4 1) 18.2 1)
x3rnl . 0 ( 0) -143.5 ( 1) 1.1 1) 1.1 1)
x3rn2 . 0 ( 0) -143.5 ( 1) 1.1 1) 1.9 1)

A.3 Node Labels in Elastic Frame Model
xoy6 fcy5
xty4
xoy1 joyo
Figure A-1: Node Labels
x3y6
Tx1ys
~3y4
x3y1 3yc
'"'
.,
x6y6 Tx6ys
XS) "!eJ!~~y 3
x6y3/ I
x6y1 x6yc
x9y6 p9yS
19y4 i,gy}e ext!
x9y2"
x9y"i/ I
x9y1 x9yo
x12y6 Tx12y5
~12y4
/112y2 x12y
x12y1 i12yo
x15y_·
x1Sy6
"l"1sys
~ 1Sy4
/}1Sy2
X 15y ,-tSyo
i "' g e, >< ~ tr] ;;, ~
5· ~ " s " > ::, !:!. '< ~-~
~
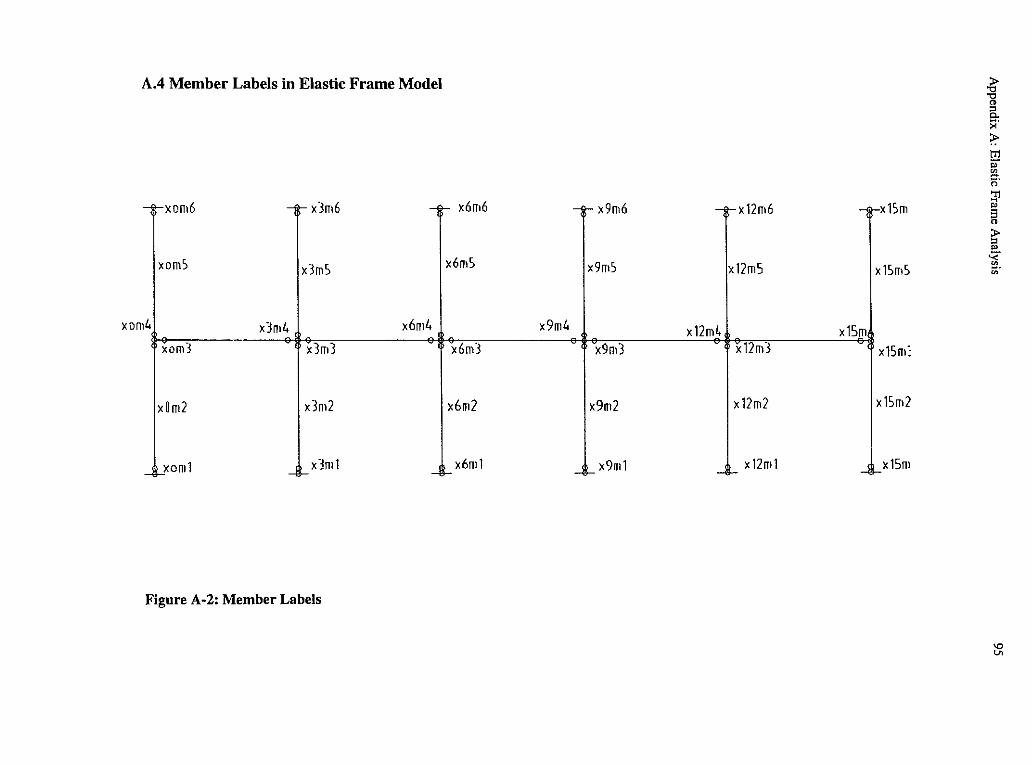
A.4 Member Labels in Elastic Frame Model
--+-xom6 -it- x3m6 __,,_ x6m6
xom5 x3m5 x6m5
xom41 x3m4 x6m4 x9m4
xom3 x3m3 x6m3
x0m2 x3m2 I'·' ____xom 1 _j_X3ml x6m1
Figure A-2: Member Labels
--+- x9m6 -il-X12m6
x9m5 x12m5
X 12ml, x9m3 x12m3
I'"'' x9m1 I"''
x12m1
-it-X 15m
x15m5
x15m 'f x15m:
x15m2
lx15m
I ;;· ~ t!l " ~ (';'
~ ~ ~ e.. ~. ~
~

Appendix B
Experimental Results
96

Appendix B: Experimental Results
400
350
300
100
50
--------------·---------~
I - Load vs Internal LVDT I
o:r-------~------------l
350
300
_2so
!200 al _9150
100
50
97
---,
I
j -Load vs Central btm ~
o.)---------------------1 0 10 20 30 40
Displacement (mm) 50 60 0 10 20 30 40
Displacement (mm) 50 60
(a.) Load vs Internal LVDT
400 ----·-------------------~ 350
300
.-250 z "' :;200 .. 0 ..J1so
100
50
0 0 10
• • •LoadvsLVDTBTop ·" - Load vs LVDT 8 btm
23 30 4P lsplacement (mm)
50
(c.) Load vs LVDT 8 Top, 8 Btm
60
400~------------------~
350
300
_,so I :iii -200
~ 150
100 ·
50 I .. - LoadvsLVDT10Topl - Load vs LVDT 10 Btm
0.)----------~---------l
400
350
300
250 z '=200 'O .. _9150
100
50
0 0
400
350
300
250 z e:!200 'O .. ,9150
100
50
0
0 10 20 30 40 Displacement (mm)
50 60
(e.) Load vs LVDT 10 Top, 10 Btm
0
(b.) Load vs Central LVDT
10
• • ·LoadvsLVDT9Top -LoadvsLVDT9btm
20 30 40 Displacement (mm)
50
(d.) Load vs LVDT 9 Top, 9 Btrn
ti/ I
10
···Load vs LVDT 12 -Load VS LVDT2
20 30 40 Displacement (mm)
50
(f.) Load vs LVDT 12, 2
Figure B-1: Load-Displacement Graphs of Specimen SB1
60
60
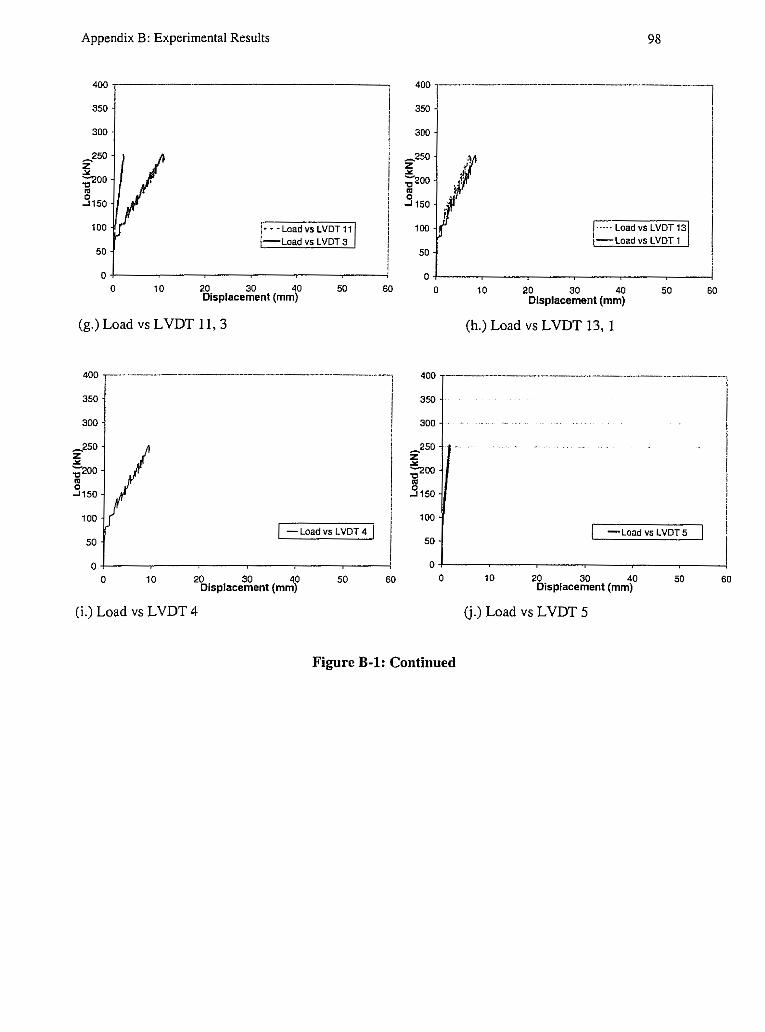
Appendix B: Experimental Results 98
400
350
300
_250 z "' efOO .. ,3150
100
50
0 0 10
• • - Load vs LVOT 11 -LoadvsLVOT3
20 30 40 Displacement (mm)
50
(g.) Load vs LVDT 11, 3
400
350
300
_2so z "' '.i;'200 .. 0 .J150
100
50 / -Load vs LVDT 4 /
0 0 10 20 30 40
Displacement (mm) 50
(i.) Load vs L VDT 4
60
60
400 ---------------·------.
350
300
50
····· Load vs LVDT 13 -Load VS LVDT 1
0-1----------------------' 0 10 20 30 40 50 60
Displacement (mm)
(h.) Load vs L VDT 13, I
400 ----------·---------------------------
350
300
[250
;-200 .. .S1So
100
50 -- Load vs LVDT 5
0+--------------------0 10 20 30 40
Displacement (mm)
(j.) Load vs LVDT 5
50 60
Figure B-1: Continued
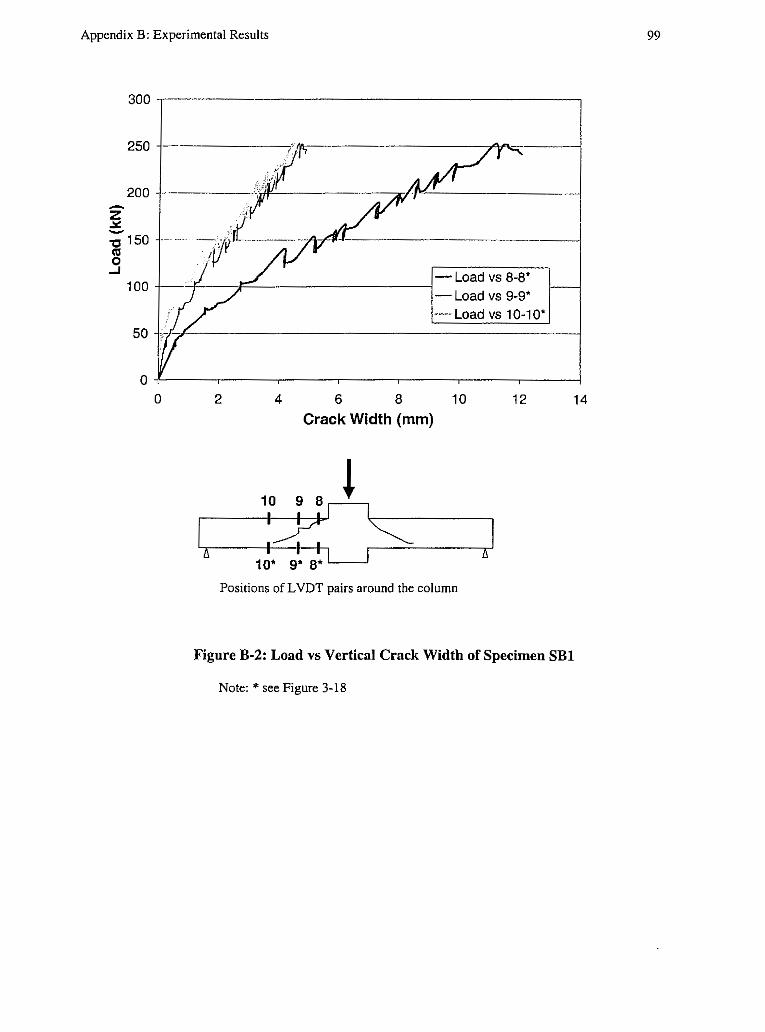
Appendix B: Experimental Results 99
0-'-------------------------' 0 2 4 6 8 10 12 14
Crack Width (mm)
I ti
Positions of L VDT pairs around the column
Figure B-2: Load vs Vertical Crack Width of Specimen SBl
Note: * see Figure 3-18

Appendix B: Experimental Results
400
3SO
300
-2SO z " :;;-200 • 0 ...J150
100
50
0 0 0.005 0.01
Strain (mmlmm)
(a.) Load vs Ul Strain Gauge
400 --------"--·-----·---
350
300
_250 i2 :;;-200 • 0 ...J150
100
50
I -Load vs u1
O.Q15 0.02
-Loadvsu3
o+---------------------.; 0 0.005 0.01 O.D15
Strain (mm/mm)
(c.) Load vs U3 Strain Gauge
400~---
350
300
_250 z " -200 1il 0
...J 150
100
50 I-Load vs us I
0.02
o+---------------------l 0.015 0 0.005 O.Q1
Strain (mm/mm) 0.02
(e.) Load vs US Strain Gauge
JOO
400 ----------·--------!
350 I 300 !
-250 z " :;;-200 • 0
...J 150
100 -Load vs u2
50
0 0 0.005 O.Q1 O.Q15 0.02
Strain (mm/mm)
(b.) Load vs U2 Strain Gauge
400
350
300
_2so z " ;,aoo • 0 ...J150
100
-Loadvsu4 50
0 0 0.005 0.01 0.015 0.02
Strain (mm/mm)
( d.) Load vs U4 Strain Gauge
400
350
300
_2so z " :;;-200
• 0 ...J150
100 !-Load vs us I
50
0 0 0.005 0.01 O.Q15
Strain (mm/mm) 0.02
(f.) Load vs U6 Strain Guage
Figure B-3: Load-Longitudinal Reinforcement Strain Graphs of Specimen SBl
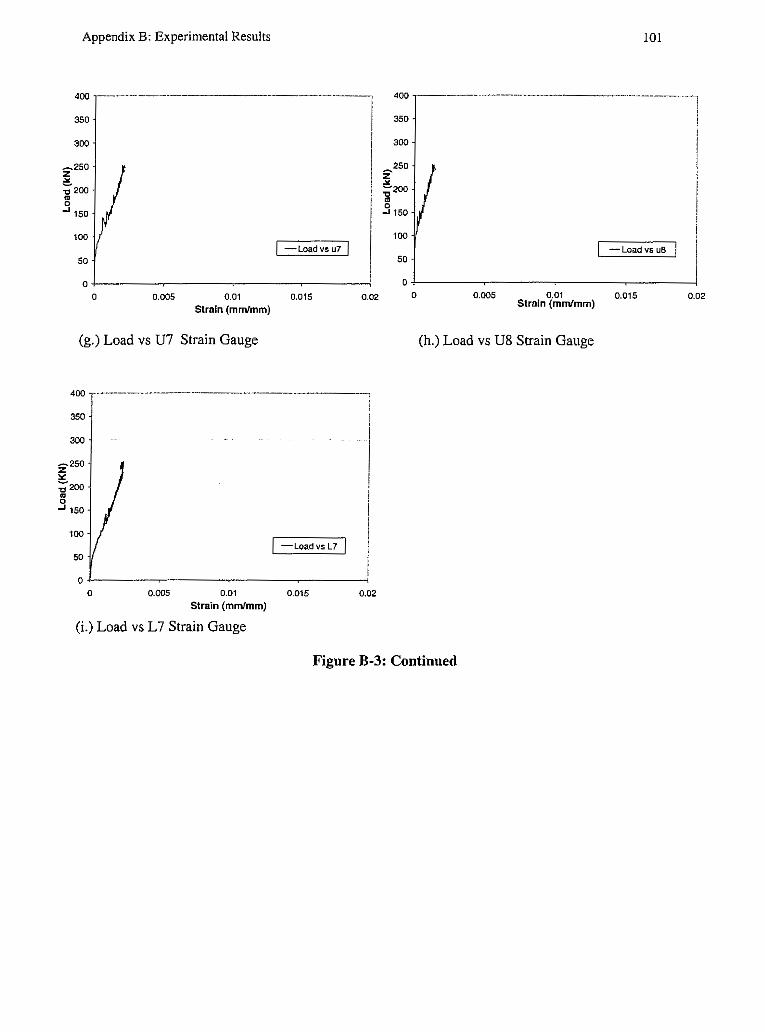
Appendix B: Experimental Results
400
350
300
. l -250 g 'C 200 ~
...J 150
100
50 [ -Loadvsu7 f
o-'------------------------' 0 0.005 0.01 0.015 0.02
Strain (mm/mm)
(g.) Load vs U7 Strain Gauge
400
350
300
-250 z "" ;-200 m 0 -' 150
100
50 I -Loadvsl7
0 0 0.005 0.01 O.D15 0.02
Strain (mm/mm)
(i.) Load vs L7 Strain Gauge
z "'
400
350
300
250
-200 'll 0
...J 150
100
50
0 0
101
-------~---------------------i
!
i
-Load vs uB
0.005 0,01 0.015 Strain (mm/mm)
0.02
(h.) Load vs US Strain Gauge
Figure B-3: Continued
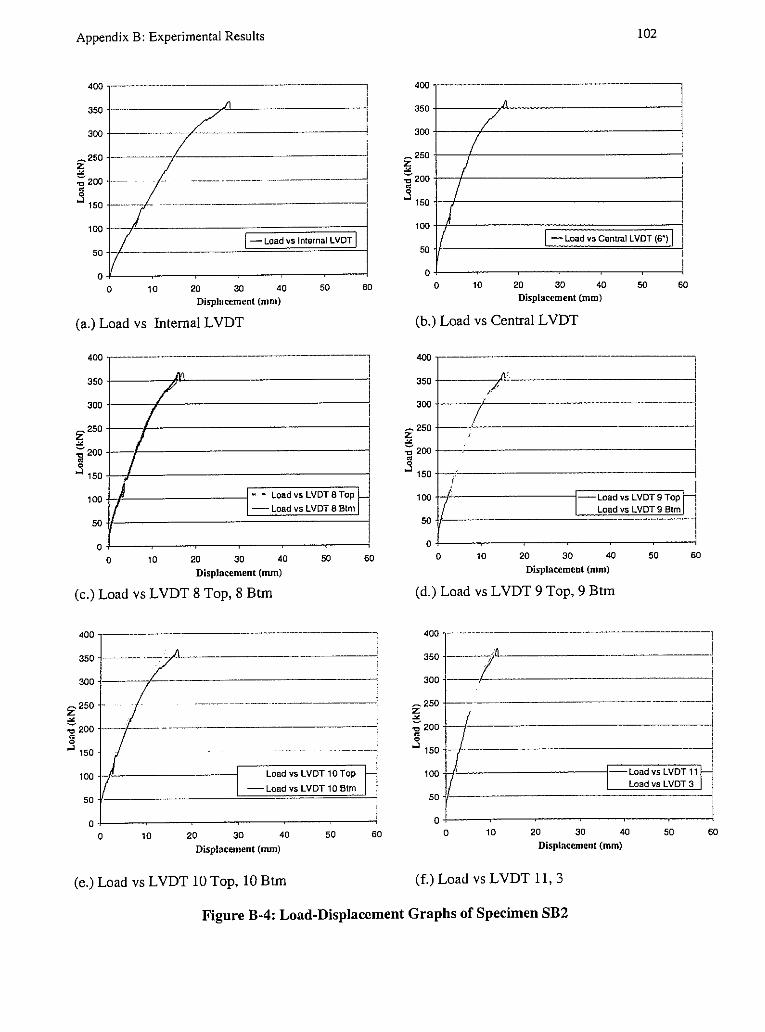
Appendix B: Experimental Results
3SO
300
,.....250 z
-----/---------------" i
~
;200 ····------__J • ;l 150
100j---j'-------~;::::==========::;-i I -Load vs Internal LVDT I 50 - -·---------"=========='....;
o+-----------------~ 0 10 20 30 40 50 60
Displacement (mm)
(a.) Load vs Internal LVDT
400
350
300
2250
~
;200 • 0
..J 150
100 -1-.J"---------< .... Load vs LVDT 8 Top
- Load vs LVDT 8 Btm
50
0 0 10 20 30 40 50 60
Displacement (mm)
(c.) Load vs LVDT 8 Top, 8 Btm
::: ~--=---~~=-~:-·------------·--i 300 l---,/--- ----------------i
I z 250 · --·-·----·----- ------·-----! e 'O 200 g ..J 150 · ---·---!
-Load VS LVDT 10Btm 50 -----·---------"========='-
0 +--------------------l 0 10 20 30 40 50 60
Displacement (mm)
(e.) Load vs LVDT 10 Top, 10 Btm
400
350
300
,....250
~ .. 200 • ;l 150
100
50
0 0
, /
I 7 7 f I
10
102
i I
' ' ' I I ' I l
! I - Load VS Central LVDT cs·) I I
I i
I 20 30 40 50 60 Displacement (mm)
(b.) Load vs Central LVDT
400 ---· I 350 /, ~· ·-----j
, I 300
I i
z2so I I
~ I ;200 • I ;l 150
' I i 100
I Load vs LVDT9 Top H Load VS LVDT 9 Btm 1
50 ' I
0 0 10 20 30 40 50 60
Displacement (mm)
(d.) Load vs LVDT 9 Top, 9 Btrn
400 ---·---·--·--------------------------·-,
' 350
300 7 '
-250 z e 'ti 200 • 0
..J 150
100
50
--!
.J..../•-----------l1-LoadvsLVDT11Hi . LoadvsLVOT3. 1
-!
0 0 10 20 30 40 50 60
Displacement (mm)
(f.)Load vsLVDT 11, 3
Figure B-4: Load-Displacement Graphs of Specimen SB2
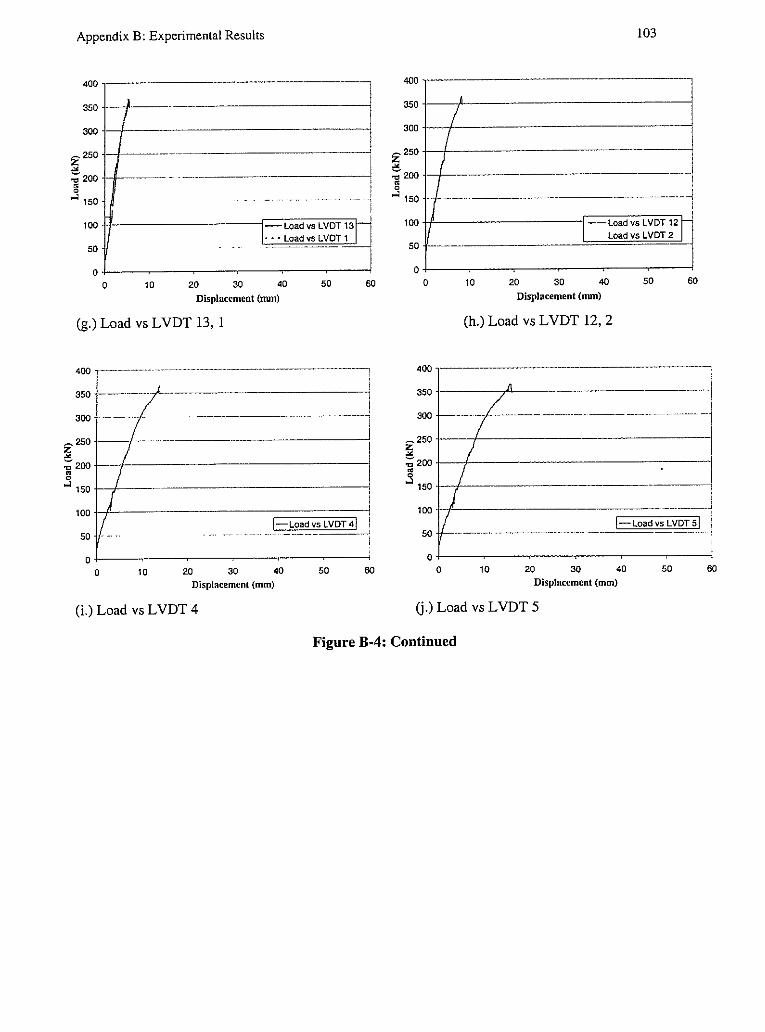
Appendix B: Experimental Results
400,---------------------
350 l-l-------------------1 300
z250
"' - ------·----------------__j
:; 200 g ..J 150
1ool:J------------11
:=~L~o~a"d~vs~L~V"OTIT~1~3'1~~1 • • - Load vs LVOT 1
50 I I
0 +----~-------~----"""" 0 10 20 30 40 50 60
Displacement (nun)
(g.) Load vs L VDT 13, I
400
350 --·--···
300
,__ 250 , __ _,__
~ :;2001-~<-------------------~ • 0
..J 150 I-+---
1001-t'------------;:::============:;--i I-Load vs LVDT 41
50
01------~------~-------; 0 10 20 30 40 50 60
Displacement (mm)
(i.) Load vs LVDT 4
400
350 300
I I
103
-----, •
z250
c I ~ -,, 200 I i g ...;i 150 -----
________________________ J i
100
50
0
1
·------
0
i
I Load vs LVDT 12 r Load vs LVDT 2
10 20 30 40 50 60
Displacement (mm)
(h.) Load vs L VDT 12, 2
400 ,--------------------------------------------------,
350 fl
300 1--- /
I ----------------- --·
~250 /
.,,2001---+7------------------I
.s 150 -1-7-1--------------i 1: [ _______ __ -------- __ !-Loadvs-L-;_~--J
0 10 20 30 40 50 60
Displacement (mm)
G-) Load vs LVDT 5
Figure B-4: Continued
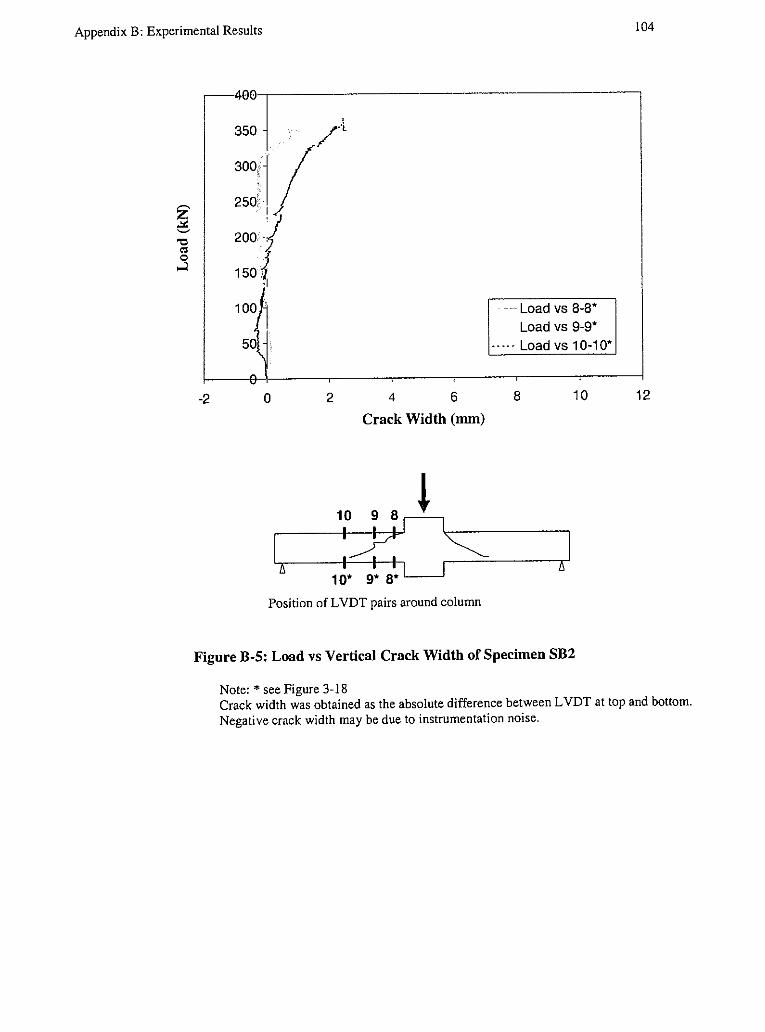
Appendix B: Experimental Results 104
r-4e,e,:;,--------------------~
-2
' 350 · .. · /""
:::J/ • I
200 -I 150!
•I
100/1 50
0
I 6
2 4 6
Crack Width (mm)
Position of L VDT pairs around column
· · · Load vs 8-8* Load vs 9-9*
····· Load vs 10-10*
8 10 12
Figure B-5: Load vs Vertical Crack Width of Specimen SB2
Note: * see Figure 3-18 Crack width was obtained as the absolute difference between L VDT at top and bottom. Negative crack width may be due to instrumentation noise.

Appendix B: Experimental Results
400
350 . J ---------1 300 '1·-------------!1
,..., 250 >--;/----------------------< [ ~2001--1-------------------'
~ I ,.,l 150 -h'---------------------~
1oot1---·------::::::::::::::::;--jl I-Loadvsu1\ I
so
o-1------------------i 0 0.005 0.01
Strain (mm/mm)
(a.) Load vs Ul Strain Gauge
0.015 0.02
400~------------------,
350<-------'b--)"q-----------' l ' 300
---------------"
100 -------------====::---! I-Load vs U31
so-!+-------------'====---!
o-1----~----~---------' 0 0.005 0.01
Strain (mm/mm)
( c.) Load vs U3 Strain Gauge
400
350
300
I
r---.
J
0.0,S 0.02
,....250
I ~ ::; 200 • 0
..J 150
100
so
0
t------ ~--------
0 0.005 0.01
Strain (nun/mm)
(e.) Load vs U5 Strain Gauge
j-Loadvsusl
O.Q15 0.02
400
350 ,----_
300
,....250 z I " ;' 200 • I ~ 150
J 100
I so
0 0 0.005 0.01
Strain (mm/mm)
(b.) Load vs U2 Strain Gauge
400
350
300 ,J
~
C
105
i i I I
i i
----------!-Load vs u2 j
0.015 0.02
' I I --, I
,-. 250
[ ~ 200 • 0
,..;i 150
I I --- ----------------------1
100
so
0 0
I J
0.005 0.01
Strain (mm/mm)
(d.) Load vs U4 Strain Gauge
400
350
300
100
so
0 0
f I
( I I
' )
0.005 0.01
Strain (mm/mm)
(f_) Load vs U7 Strain Gauge
I
I
I-LoadvsU41 I I I
0.015 0.02
i ___j
' i I . i
I-LoadvsU71 I I
0.015 0.02
Figure B-6: Load-Longitudinal Reinforcement Strain Graphs of Specimen SB2
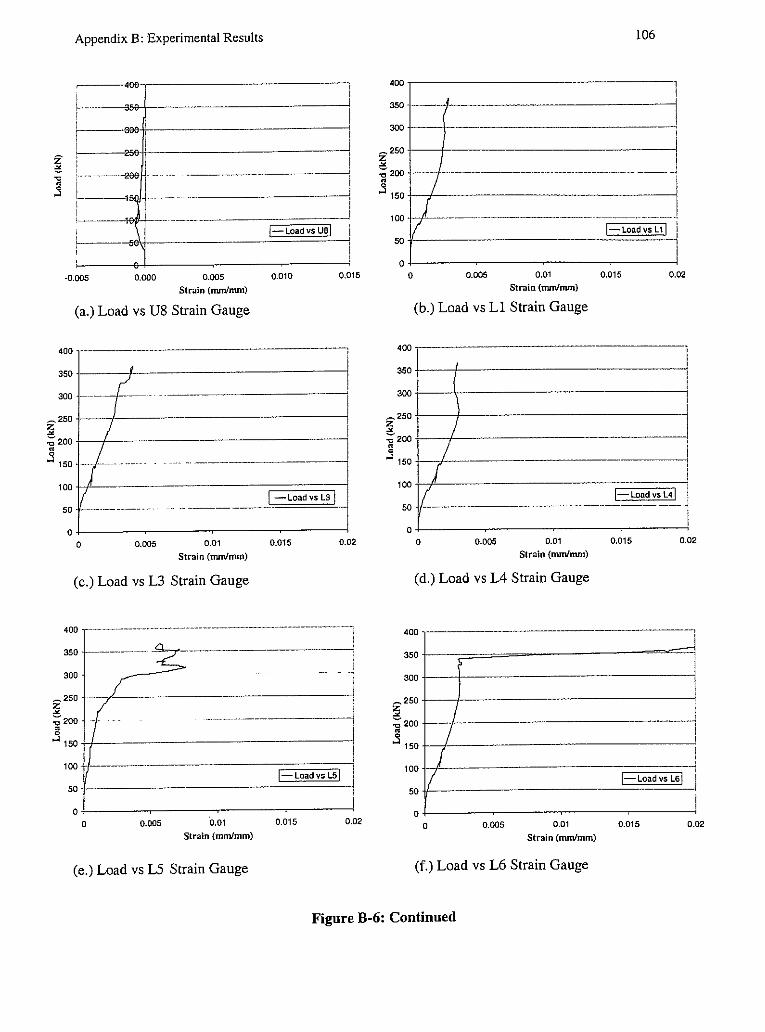
Appendix B: Experimental Results
! l ! I as
i 00 ! I I
-----------------~-: i :----15, I !-------l<l l ····-··
!-Load vs ual '-----se~l----------'======--
--0.005 0.000 0.005
Strain (mm/mm)
(a.) Load vs US Strain Gauge
0.010 0.015
400 --------·---·------------------------
3500----1
300 ----------~-- ----·-----------<
,-.250 +---1-----------------'ri :;;200 +-~!-----------------~ 150
i 100 I -Load vs L3 I j 50 -------~- - -
o+---------~----~----l 0 0.005 0.01
Strain (mm/mm)
(c.) Load vs L3 Strain Gauge
400
350
300
0.015 0.02
. I l _,
I .-.250 i-~L-----------------l 'ri :;; 200 ------------·------~
a ...1 ,so!-/-------------------!
100 ------··---------;::===::;-1 I-Load vs LSj
50 .1-------------'==========='__j o+---------~----~----
0 0.005 ·0.01
Strain {mm/mm)
(e.) Load vs LS Strain Gauge
0.015 0.02
400
350
300
22so
~
:;; 200 a
'
-7-----
106
I
i
-~ ...l 150
100
50
0
IJ __________________________ _1
I-Load vs L1 I i
0 0.005 0.01
Strain (mm/nun)
(b.) Load vs Ll Strain Gauge
400
350
300
,-., 250
;g "C 200 " 0
...l 150
100
50
0
-·--------
/
I I
I
0 0.005
-
0.01
Strain (mm/mm)
(d.) Load vs L4 Strain Gauge
400
350
300
~250
:;; 200 a ...l 150
100
50
0
~
I I
0
J
I
0.005 0.01
Strain (mm/mm)
(f.) Load vs L6 Strain Gauge
O.Q15 0.02
-
1 I l
I I
I ' i I I
I-LoadvsL41 I ---------- .!
I 0.015 0.02
I I
i I ! l
I I
; ' --"
I-LoadvsL6! ' I I
' i 0.015 0.02
Figure B-6: Continued

Appendix B: Experimental Results
400 -----------------------~
350
300
100
50
0 0
"-· '.' ------··
··· · · Load vs Bolt s14 --- ---------- ------_-_- ~~=~ ~: :~:: :~ ~ -- -I Load vs Bolt s17
I 0.001 0.002 0.003 0.004
Bolt Strain (nun/mm)
Figure B-7: Load-Bolt Strain Graphs of Specimen SB2
107

Appendix B: Experimental Results
350 -----·----~--~
300<--
- 250 z i!\ ""'200 • 0
.:I 150 +----1-----------------1
1001--t----------;:====================;~ I-Load vs Internal LVDTI
o.i-------------~------1 0 10 20 30 40 50 60
Displacement (nun)
(a.) Load vs Internal LVDT
400 ,------·--------------
3504-------y"'----'---------~
300 +-----,/----------------,
z:250
"' :;' 200 •
,.S 150
100 +-f----------f..-;.-:.,Lo;;;a;;;d-;;v",;"si,LV"Diir'iai""'T;:;o;;pi--j Load vs LVDT 8 btm
50
o+---------------------1 0 10 20 30 40 50 60
Displacement (nun)
(c.) Load vs LVDT 8 Top, 8 Btm
400 ,------------------)
350 ------ ··-----,-~~------------,
300 ----- ~----~------------------i
z2so i!\ -o 200 • ,.S 150
100+.-/-----------J~--~-~L~o;ad~v;s~L~VTID~T10~TT<o;;;"]p Load vs L VDT 10 Btm
o+--------------------, 0 10 20 30 40 so 60
Displacement (mm)
(e.) Load vs LVDT 10 Top, 10 Btm
108
400
/\ 350
/ 300
I I - 250 z .,.
;;; 200
I • 0
.:I 150
I I
L j-LoadvsCentralLVDTI J i
100
50
0 ' 0 10 20 30 40 50 60
Displacement (nun)
(b.) Load vs Central LVDT
400
350
300
-250 z ~ 'C 200 .. 0 ..J 150
100
50
0
+---.//-----------------------
0 10 20 30
······LoadvsLVDT9Top - Load VS L VDT 9 Btm
40 50 Displacement (mm)
60
(d.) Load vs L VDT 9 Top, 9 Btm
400
350
300
z:250 .,. ;' 200 • 0
~ 150
100 -LoadvsLVDT11 ,
50 - • • Load VS LVDT 3 ____ J
i 0
0 10 20 30 40 50 60 Displacement (nun}
(f.) Load vs LVDT II, 3
Figure B-8: Load-Displacement Graphs of Specimen SB3
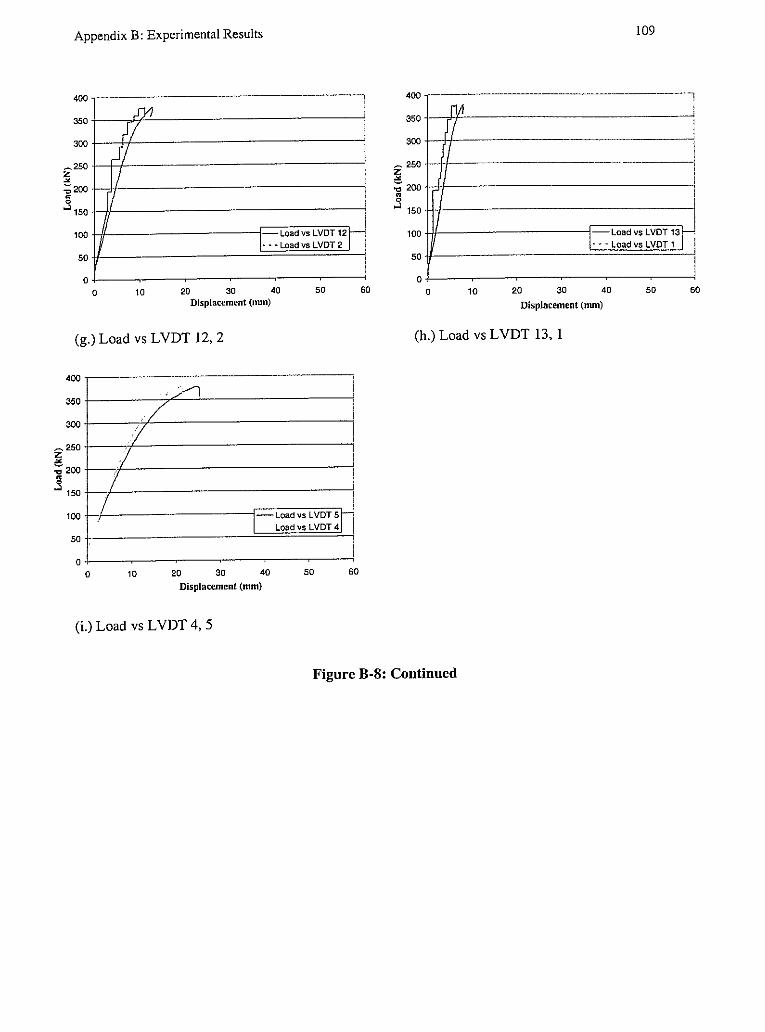
Appendix B: Experimental Results
400
350
300
.-..250
?i :;; 200 • 0
..l 150
------
J11
I/
400
350
300
~ 250
; 200 • ~ 150
109
-·-------- ----------·, 1A
'
' - -----· ·-· ~
i I
100
50
0
u Load vs LVDT 12 r 1--·LoadvsLVDT2
100
50
0
! Load vs LVDT 13 • • • Load vs LVDT 1 i
0 10 20 30 Displacement (mm)
(g.) Load vs L VDT 12, 2
400
350
300
~250
"'200 ~ ..l 150
100
50
0
I
0
.,·~~
,/ I
I I
I
10 20 30 40
Displacement (mm)
(i.) Load vs L VDT 4, 5
! :
40 50 60 0 10 20 30 40 50 60
Displacement (nun}
(h.) Load vs L VDT 13, 1
' i I
! i
Load vs L VDT ~ r Load VS LVDT 4 i
i I
50 60
Figure B-8: Continued

Appendix B: Experimental Results
,----------------4BA---~----------,
~ --------..~""-"""j 1-----"------------35'9"'""'"""---"lr-------j
'~------------j 1 ~-----------+slH~c------------1
-3
Load vs 8-8·
• • • Load VS 9.9• ··-- Load vs 10-1 o•
-2 -1 0
Crack Width (mm)
Positions of L VDT pairs around the column
1
Figure B-9: Load vs Vertical Crack Width of Specimen SB3
Note: *See Figure 3-18
2
110
Crack width was obtained as the absolute difference between L VDT at top and bottom. Negative crack width may be due to instrumentation noise.

Appendix B: Experimental Results
400
350
300
z' 250 ~
:; 200
.s 150
100
50
0
I I
0
} I
I
0.005 0.01
Strain (mm/nun)
(a.) Load vs U I Strain Gauge
400
350
300
,....,250
~ -o 200 • j 150
-----
"
I
'
j-LoadvsU1)
0.015
100
50
0
f--------- - -- ---------.
0 0.005 0.01
Strain (mm/mm)
(c.) Load vs U3 Strain Gauge
400
350
300
1-Loadvsusl
O.Q15
I
0.02
I I I
I I I
0.02
i250 - ------ ---------------,
:; 200 1--1-------• 0 --'150-H---
100 ---······· ------,====;--i 1-Loadvsusl
50
0 0.005 0.01
Strain (mm/mm)
(e.) Load vs US Strain Gauge
O.Q15 0.02
111
400
350
300
~- ------·--,
~250
.., 200 §
..:I 150
100
50
0
400
350
300
,.....250
~ -o 200 •
0
I I
I I
~ ------------------··-i
-
0.005 0.01 Strain (nun)
I-Loadvsu2I
O.Q15 0.02
(b.) Load vs U2 Strain Gauge
··1 I I
I I
I ---i i
I I I j 150
100
50
0
-!----------- I - - _, I-LoadvsU41 I
I
0
400
350
300
~250
.., 200 §
...1 150
100
50
0 0
0.005 0.01
Strain (mm/mm) O.D15
i 0.02
(d.) Load vs U4 Strain Gauge
' /
I I
--
•
0.005 0.01
Strain (mm/mm)
(f.) Load vs U6 Strain Gauge
I I
I I ' I •
i -i
I-Load vs uel .. ----- -· ---·
i O.Q15 0.02
Figure B-10: Load-Longitudinal Reinforcement Strain Graphs of Specimen SB3

Appendix B: Experimental Results
350 -- ~· -·---- ·-------:
50
0 l---------------------4' 0 0.005 0.01
Strain (mm/mm)
(g.) Load vs U7 Strain Gauge
0.015
350L---'>"=========:::::::::::::::::::::::::===::::::::::J
0.02
100
50 Load vs L1 I
·-----------==='='--I o-l-----------~---------4
0 0.005 0.01 0.015
Strain (mm/mm)
(i.) Load vs Ll Strain Gauge
400
350
300
100
50
0
-------·
/ I I I I
0 0.005 O.Q1 0.015
Strain (nun/mm)
(k.) Load vs L6 Strain Gauge
0.02 0.025
- -J
I
i
I-LoadvsL6j
I 0.02 0.025
112
400
350
300
----------·----··--··-----· --.
,...250
~ "O 200 s ...l 150
100
so
0
0
350
100
50
0
I I
r I I
I I
I
I
I I I
0
0.005 0.01
Strain (mm/mm)
1-Loadvsuaj
O.Q15
(h.) Load vs US Strain Gauge
I I
! I
I ' : : I I
0.02
I i I
' I ' I ' I i
! I-Loadvsl2j I
0.005 0.01
Strain (mm/mm)
0.015
G.) Load vs L2 Strain Gauge
; i
0.02
Figure B-10: Continued

Appendix B: Experimental Results
400
350
300
~250
~ :; 200
'" "' ,-l 150
100
50
0
. -"·-··--···----------·---------·----------------------------
I ·-t .-- -~
f ';
- -11·
I Load vs Bolt s14 ·I-- ,_ ~
Load vs Bolt s 15 ···-- Load vs Bolt s16 r--
, . ---- Load vs Bolt s17 I
Load vs Bolt s18 - r--..... Load vs Bolt s19
0 0.001 0.002 0.003 0.004
Bolt Strain (mm/mm)
Figure B-11: Load-Bolt Strain Graphs of Specimen SB3
113
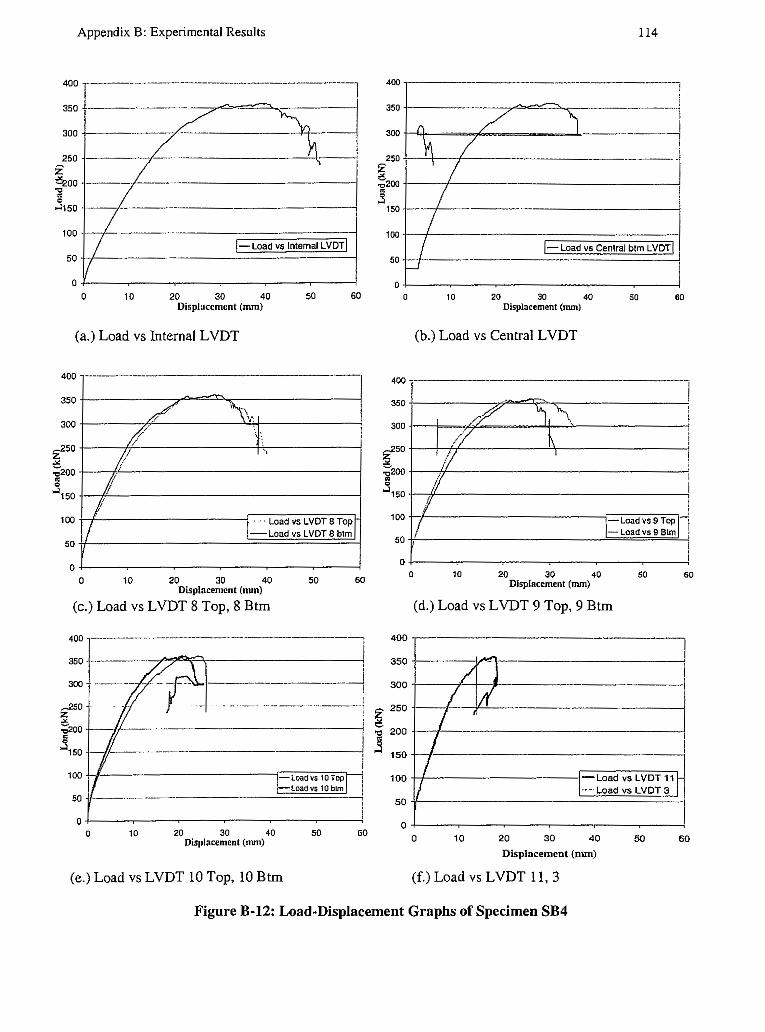
Appendix B: Experimental Results
400 ---------------1
250 --
z ~oo+-----r----------------j ii 0
..2150 ,----1------------------j
o+---------------------, 0 10 20 30 40 50 60
Displacement (mm)
(a.) Load vs Internal LVDT
400
350
300
z250
~ 't:1200 ~
,..2150
100
50
0
--------
/ ~" J ..
II ' I
I I
t · .. ·Load vs LVDT 8 Top - Load VS L VDT 8 blm
o 10 m m ~ 50 Displacement (nun)
(c.) Load vs LVDT 8 Top, 8 Btm
60
400 ·---·---------··-·-----·----·----------------·------------
300
--250 z
-- - . ~
:;200+----.'1---
.§150 ,--If--
100 i-/[__------------f_=,l;;;oa;;;,;;;,.;,,nOT<To;;;pri -Loadvs10blm
50 ---~----------
o+--------------------j 0 10 20 30 40 50 60
Displacement (mm)
(e.) Load vs LVDT 10 Top, 10 Btm
114
400 --------
~ / " r, I
\.\ / =l I I I
I I /-Load vs Central btm LVDT!
350
300
250
~ ]200
.3 150
100
50 w I 0
0 10 20 30 40 so 60 Displacement (mm)
(b.) Load vs Central LVDT
400 ------------ ·----------·-
300
z-250 ~
:;;'200
!,so 100
50
0
400
350
300
~ 250
3 200
150
100
50
0
-Loadvs9Top -- Load vs 9 Btm
0 10 20 30 40 50 60 Displacement (mm)
(d.) Load vs LVDT 9 Top, 9 Btm
/ j I ;(
I I
I I
I I
/. LoadvsLVDT111 I - Load vs LVDT 3
0 10 20 30 40 50 60
Displacement (mm)
(f_) Load vs LVDT 11, 3
Figure B-12: Load-Displacement Graphs of Specimen SB4

Appendix B: Experimental Results
350 ---------------------'
300
z250
" ;200 • 0
..J150
100 --- Load VS LVDT 12 -Load VS LVDT 2
50
0 0 10 20 30 40 50 60
Displacement (mm)
(g.) Load vs L VDT 12, 2
400 -- '
350
/ -300
/ ,...250
I z " :;ioo
I • .s150
I 100 I Load vs L VDT 41 50
0 10 20 30 40 50 60 Displacement (mm)
(i.) Load vs L VDT 4
115
400
350
300
-----·--------·------------
100
50
0
-I I fl
0
,.
/I l ;1
ff t , -·~-
l Load vs LVDT 13 -Load vs LVDT 1
10 20 30 40 50 Displacement {mm)
(h.) Load vs LVDT 13, 1
400
' -1
I
I I
I I i I l I
i 60
i " 350
300 / ----~J
z250
~ "Cl200 g
I I
/ I
I I
~ ..J150
100
50
0
-------1 -f----- -----------I-Load ,s LVDT 51-1
I
I 0 10 20 30 40
Displacement (mm) 50 60
(j.) Load vs LVDT 5
Figure B-12: Continued
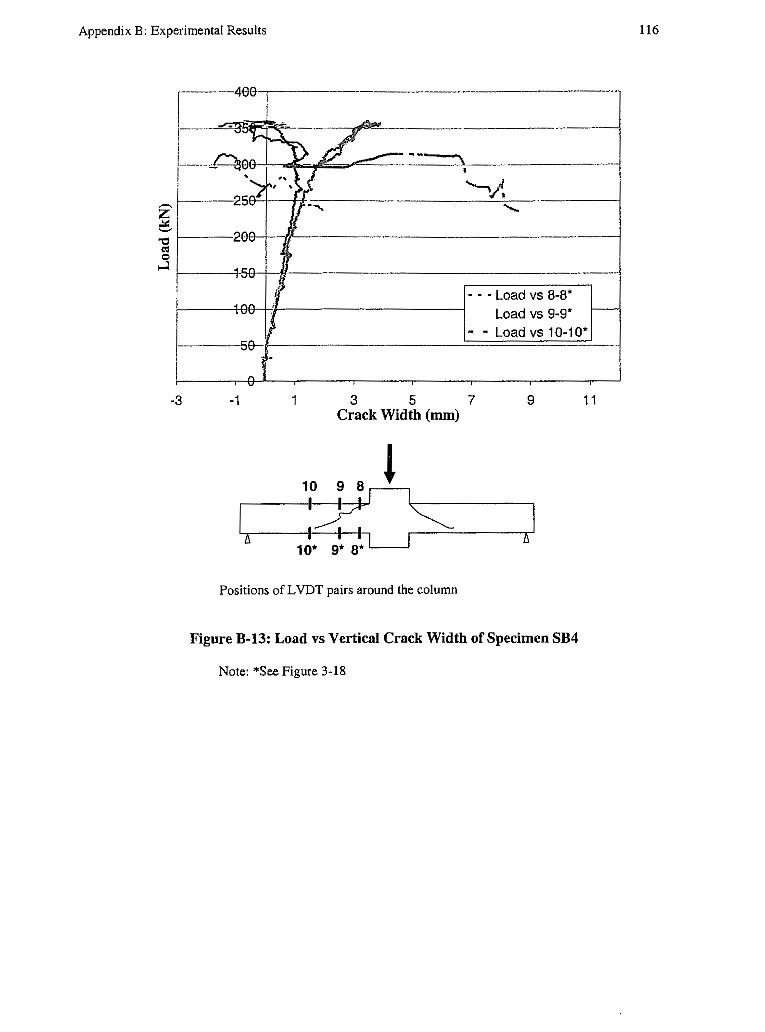
Appendix B: Experimental Results
,-----_ 4-00
--I --,_ "'- /
-• "'i D, I Aee
.......•. ' , __
I -~J • ' "' .... ' ~ ~ - - J. ,. ....... .......
---
• . ' ;
J - - - Load VS 8-8*
Load VS 9-9* -t:: J • • Load VS 10-10*
I -3
-~
V ' ' -1 3 5 7 9
Crack Width (mm)
I 6
Positions of L VDT pairs around the column
Figure B-13: Load vs Vertical Crack Width of Specimen SB4
Note: *See Figure 3-18
--
11
116

Appendix B: Experimental Results
,r 3004---1------~'------------/
I ,..250 1---1-------l-----------' z ~
;200 ----------- ·-------------~ " .s150
100 -- .. ----~~-· ~ 1-Loadvsui! '
50 -------·----------'====~ o+-----~----~----~----/
400
300
~ 250
oc, 200
" 0
..,;i 150
100
50
0
400
350
300
,..250 z "' "C200 ~ ...:i,so
100
50
0
0 0.005 0.01 Strain (mm/mm)
(a.) Load vs Ul Strain Gauge
r I
I I
0
~
<'.--, -r
0.005 0.01 Strain (nun/mm)
( c.) Load vs US Strain Gauge
I I
I
0
I
0.005 0.01 Strain (nun/nun)
( e.) Load vs U7 Strain Gauge
O.Q15 0.02
I-Load vs usl
0.015 0.02
I
I I I
I-Load vs u7 I
0.015 0.02
117
400 -------·---------------· sso+,..~~~~~~~~~~~~~~~~-.:
300 tt-------------------1 .-,250 I
g ~ I "0200 f--~------·---------·----------__J j
150 ----------------------- -·--·
10017/1----------------:=======:j 50 .j/---------------'=1-==Lo=a=d ="="=4'-il i ol---------~---~---~
0 0.005 0.01 Strain (nun/nun)
0.015
(b.) Load vs U4 Strain Gauge
400
350
300
z 250 ,!:. 't:J 200
~ -' 150
100
50
0
C I
7 I I I 1-Loadvsusl
0 0.005 Q.Q1 0.015
Strain (mm/mm)
(d.) Load vs U6 Strain Gauge
0.02
i
I I ; • i
I !
I !
0.02
400 ·---·-----·-------------------- I
350
300
,..250
~ :;;;,oo • .s150
100
50
0
- :
+-l--1-----------·_J 1-1-1-----------------1
I
I I -----
0
l
I-Load vs ua! --------------------- ------
0.005 0,01 Strain (mm/mm)
O.Q15 0.02
(f.) Load vs U8 Strain Gauge
Figure B-14: Load-Longitudinal Reinforcement Strain Graphs of Specimen SB4

Appendix B: Experimental Results
300 _______ " ______ ··---------------1 £250
" ;; 200 • 0
..J 150
100
50
0 0 0.005 0.01 0.015 0.02
Strain (mm/mm)
(g.) Load vs LI Strain Gauge
400r-··-·-----·-·-····-··---------··------·-·--,
....250 z " :;200 • 0
..J150
100
50
0 0
- ---- --- --·----------~! I :
-------··-··--------------! i
0.005 0.01 0.015 Strain (mm/mm)
I-Load vs LSj
0.02
'
0.025
(i.) Load vs L5 Strain Gauge
118
400
350
300 ; ,...250 z " ;'200 • 0
I I ..:i,so
100 Z-----·---·- -: I-Load vs L41 \
50
0 0 0.005 0.01
Strain (mm/mm)
(h.) Load vs L4 Strain Gauge
0.015 0.02
400
350
300
--·--------------·---·--I
100
50
0
--f I
I I
0 0.005 0.01 Strain (mm/mm)
G,) Load vs L6 Strain Gauge
/ 7 I I .l ..... ·, :
' ___J'
i :
I-Load vs LS! I '
O.Q15 0.02
Figure B-14: Continned
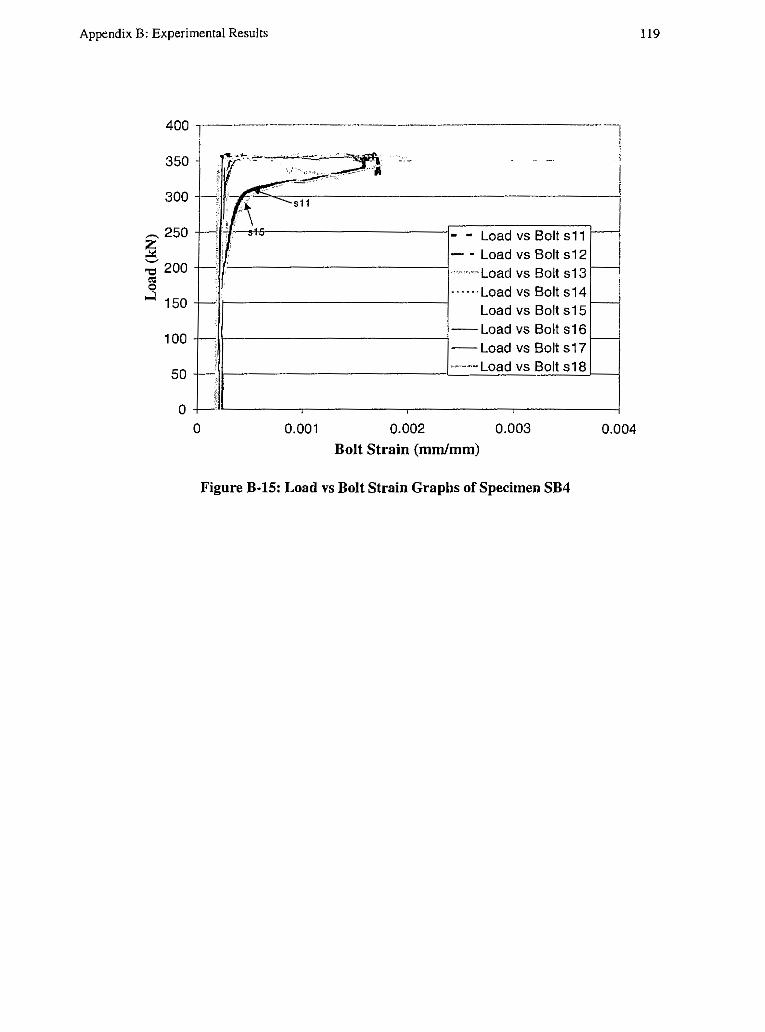
Appendix B: Experimental Results
400
350
300
~ 250
?2 :; 200 1'l
...l 150
100
50
0
r-··~ - -i ~-~- -- II ,_ -
- -,:\ ~.11 c· .,,
',,. - - Load vs Bolt s11 - - Load VS Bolt S12
' -- ··-Load VS Bolt s 13 ------Load vs Bolt s14
Load vs Bolt s 15 --Load vs Bolt s16 -- Load vs Bolt s17
' ------ Load VS Bolt s18 -$
'
0 0.001 0.002 0.003
Bolt Strain (mm/mm)
Figure B-15: Load vs Bolt Strain Graphs of Specimen SB4
119
i I ' I
I
-
~ I _,
-
0.004
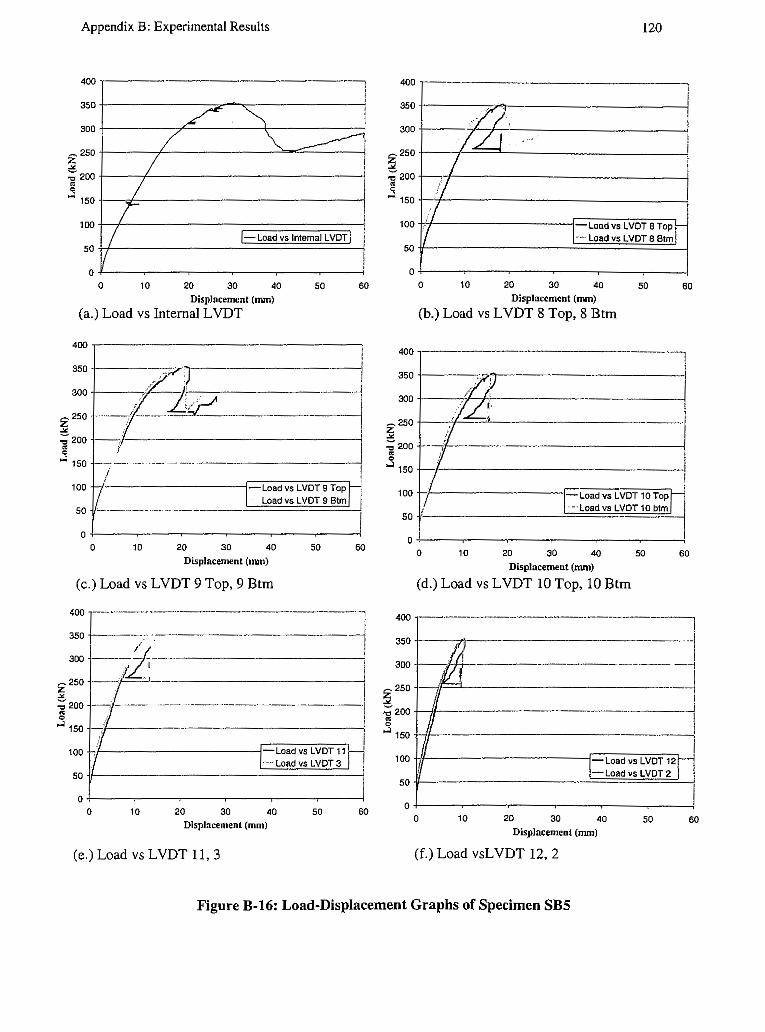
Appendix B: Experimental Results
400
350
300
22so
" ::;; 200 s
...i: 150 I I
~ ~ / \_
I ~
I I
100
50
0
I I-Load vs Internal LVDTI
I ;
0 10 20 30 40 50 60 Displacement (mm)
(a.) Load vs Internal LVDT
400,------------------~
.~-_::.~:-~=~L·----------~ "ti 200 ~ j'
...l: 150
/ 100
50 --·---l=-Load vs LVOT 9 TopH
Load vs LVDT 9 Btml I I
0 +---~--~-----~--~---;' 0 10 20 30 40 50 60
Displacement (nun)
(c.) Load vs LVDT 9 Top, 9 Btm
400
350 +----
300 --~ 2 2so
" :;; 200 -. ----- ----- -·---------·-----j
" ,S 150 -'1-------------------1
100 +,f--------------<-Load vs LVDT 11 .. , Load vs LVOT 3
50 j/ __________ __::::::::::::::::::::::::::::::::'......j
o+------~--~--~---~----l 0 10 20 30 40 50 60
Displacement (mm)
(e.) Load vs LVDT 11, 3
400
350
300
z250
" :; 200
" ,S 150
100
50
0
400
350
300
~250
"Cl 200 g
...:i 150
100
50
0
400
350
300
z250
" ::;; 200
" 0
...i: 150
100
50
0
120
-Load vs LVDT 8 Top --, Load VS LVDT 8 Btm
0 10 20 30 40 50 60 Displacement (nun)
(b.) Load vs LVDT 8 Top, 8 Btm
,1/D ~-!
2J' j ., ff ~
f I !
I/ I Load vs LVDT 10 To~r ·-·Load vs LVDT 10 btm
0 10 20 30 40 50 60 Displacement (mm)
(d.) Load vs LVDT 10 Top, 10 Btm
I -I
lli i --·-----~
JJLJ ~ u I j
#
J: Load vs LVOT 121 -Load vs LVDT 2
I 0 10 20 30 40 50 60
Displacement (mm)
(f.) Load vsLVDT 12, 2
Figure B-16: Load-Displacement Graphs of Specimen SBS

Appendix B: Experimental Results
350 1- ,-------------------,
300 ~--
,..._250 +-<-~----------·--------,· '::i :;; 200 !-,---~--··----------------; g
..;i 150 ++-------------------., I
100,1------------;:=========;--1 I-Load vs LVDT 11 I
50 ./.---~~~~~~~.'::::::====:::=::===---J! 0 +----~--~--------------;
0 10 20 30 40 50 60
Displacement (mm)
(g.) Load vs LVDTI
400 ---------------·-·------·-----------------·,
300
.-. 250 '::i :;; 200 • ,S 150 +---+--------------------;
o+--------~--~---------., 0 10 20 30 40 50 60
Displacement (mm)
(i.) Load vs LVDT 5
400
350
300
2 2so i!\ "i::I 200 g ~ 150
100
50
0
.
0
I I
I I
121
-
/ I ~
I-LoadvsLVDT4j
10 20 30 40 50 Displacement (mm)
(h.) Load vs LVDT 4
Figure B-16: Continued
i I
--1 ~
I
I
I . ! 60

Appendix B: Experimental Results
F,~------r---B91A-I--.J------------------!
I 25
I f----29 ]I
3 ,: ----4'-A--#--l------------------------1 ~ 159
/ - Load vs 8-8 C-. --"1.ciee--1.· ,__,_ ___________ __, ~···- Load VS 9-9 h • • Load VS 10-10
I •
-2 0 2 4 6 8 10
Crack Width (mm)
10 9 8 l ,~;;;=>=: I I
6 6
Positions of L VDT pairs around the column
Figure B-17: Load vs Vertical Crack Width of Specimen SBS
Note: *See Figure 3-18
12
122
Crack width was obtained as the absolute difference between L VDT at top and bottom. Negative crack width may be due to instrumentation noise.
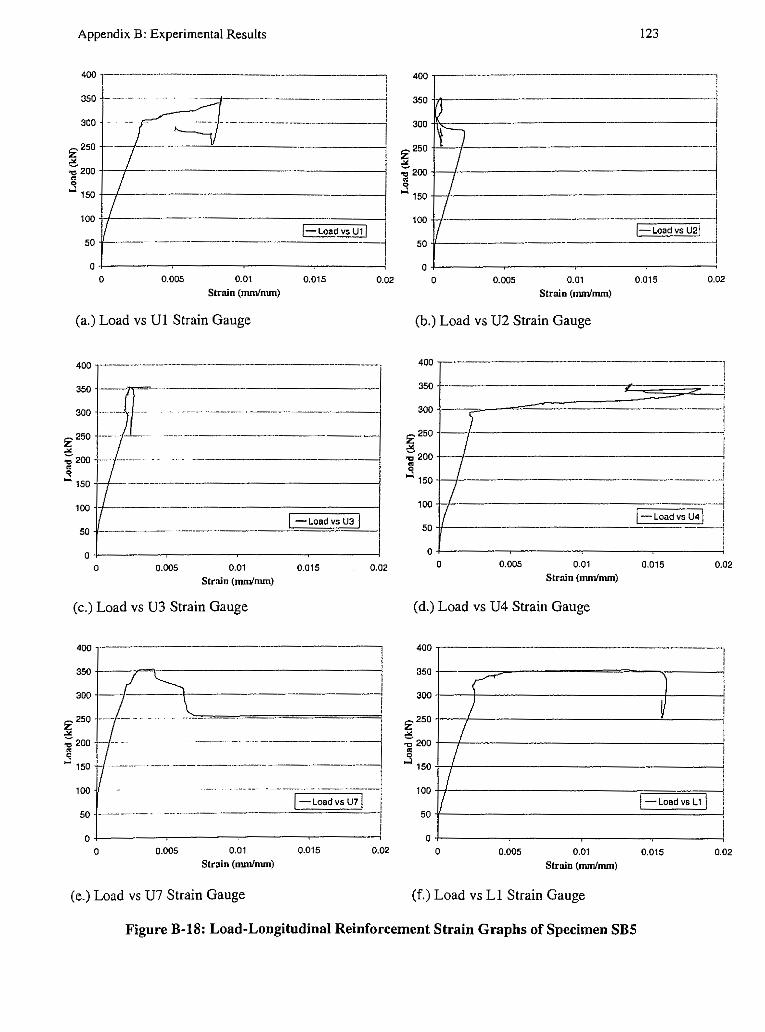
Appendix B: Experimental Results
400
I 350
300
-----------------1 I ---·-----------------j
z250
e -o 200 +---+------------------! g
,-J; 150 j-j----------------------l
1001-t----------~======:::;---: I-Loadvsu1I
50 ----
1 o+-----------------------, 0 0.005 0.01
Strain (mm/nun)
(a.) Load vs Ul Strain Gauge
0.015 0.02
400 ------------------------------1 350 !--.,.,..~-
! 300 _ ...... ___ _ " . -------··--------------;
z250 [-----.,. ;;200 -- --- -
3 ::: -------
J -LoadvsU3 J
50 ----------------'======'---!
o+--------------------; 0 0.005 0.01
Strain (nun/nun)
( c.) Load vs U3 Strain Gauge
400-----
0.015 0.02
' z250
e 'tl 200 -- -- ··-----------------1 g
,-J; 150
100
50 ------·
1 ;::====::;·-' I-Load vs u1 I I
o+--------------------< 0 0.005 O.Q1
Strain (nun/nun)
(e.) Load vs U7 Strain Gauge
0.015 0.02
123
400
350
300
------------------------,
z250
e -,, 200 g
...l: 150
100
50
0 0
:1 I I I
I
0.005 O.Q1
Strain (mm/nun)
(b.) Load vs U2 Strain Gauge
400
350
300
z250 )
I .,. ;; 200
i ---1
I I
j I I
. I I-Load vs u2! I
' i I
0.015 0.02
i
• 0
,-J; 150
100
I I
I
i -t-1----------_j--l,
I-Loadvsu41 . 50 <l----------------------4
0 0 0.005 0.01
Strain (mm/mm)
(d.) Load vs U4 Strain Gauge
400
350
300
z250 .,. ;; 200 • ,:l 150
100
50
0
I
0
~
I I I
0.005 Q,01
Strain (mm/mm)
(f.) Load vs Ll Strain Gauge
0.015 0.02
-, I I I
I I
I I
I I
I i
j
1-Loadvsul I
:
i 0.Q1S 0.02
Figure B-18: Load-Longitudinal Reinforcement Strain Graphs of Specimen SBS
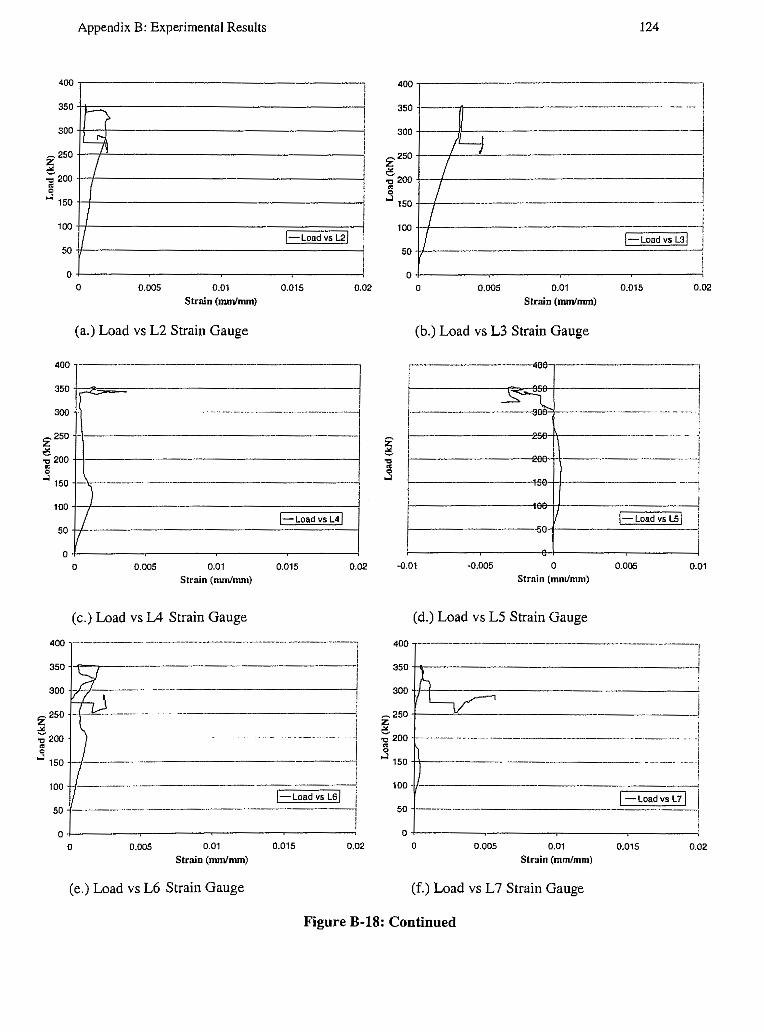
400
350
300
22so
,:, 'C 200 ~
..:i 150
100
50
0
Appendix B: Experimental Results
l I
~ i ' . L--9 I I I
i
I I
I !-LoadvsL21 !
' ' !
0 0.005 O.Ql
Strain (nun/mm) O.Q15 0.02
(a.) Load vs L2 Strain Gauge
::t-~-~-~-;;aa-~-~------~-------====_-_--_-_-_-_-_~_~---_-__ - __ -_-__ -_--__ -_-,1 2250 ++----------------------! " :;;200++----------------------1 ~ .J 150 r·------
100 /
50 I-LoadvsL41
0 0.005 0.01
Strain (mm/mm) O.Q15 0.02
(c.) Load vs L4 Strain Gauge
2250 -
" :;;' 200
" 0
.J 150
50 ---~----- · 1-LoadvsLBI
0./------------------i 0 0.005 0.01
Strain (mm/mm) 0.015 0.02
124
... i 400
350
300
/4 --JI
2250
" I I !
I :;; 200 ~ .J 150 I ____ .J
100
50
0
I ! i I
i !
I
'
I I
0 0.005 0.01
Strain (nun/mm)
(b.) Load vs L3 Strain Gauge
--400
.s l... --ooa
s.
---150
1
-.Q.01 ·0.005 0
Strain (mm/mm)
(d.) Load vs LS Strain Gauge
' ~ !-Load vs L3I i
' ! I I
0.015 0.02
I I -- - --- I
l -------"·- -·
1 ---1
' ! -·-j
I
I-Load vs LSI I !
i 0.005 0.01
400 ·-·--------·-----·---·---·------------------1
350 +,,,------------------~! 300 tt--i-------::----------------1
L.~ ! .-.2501--~~------------------1
8 'C 200 f-------,---- ------ ----·----------- ----------
~ .J 150 ---------------- -- --------
100 t/--------------.:====~ I -Load vs L7 ( so
0 0.005 0.01
Strain (mm/mm) 0.015 0.02
(e.) Load vs L6 Strain Gauge (f.) Load vs L 7 Strain Gauge
Figure B-18: Continued
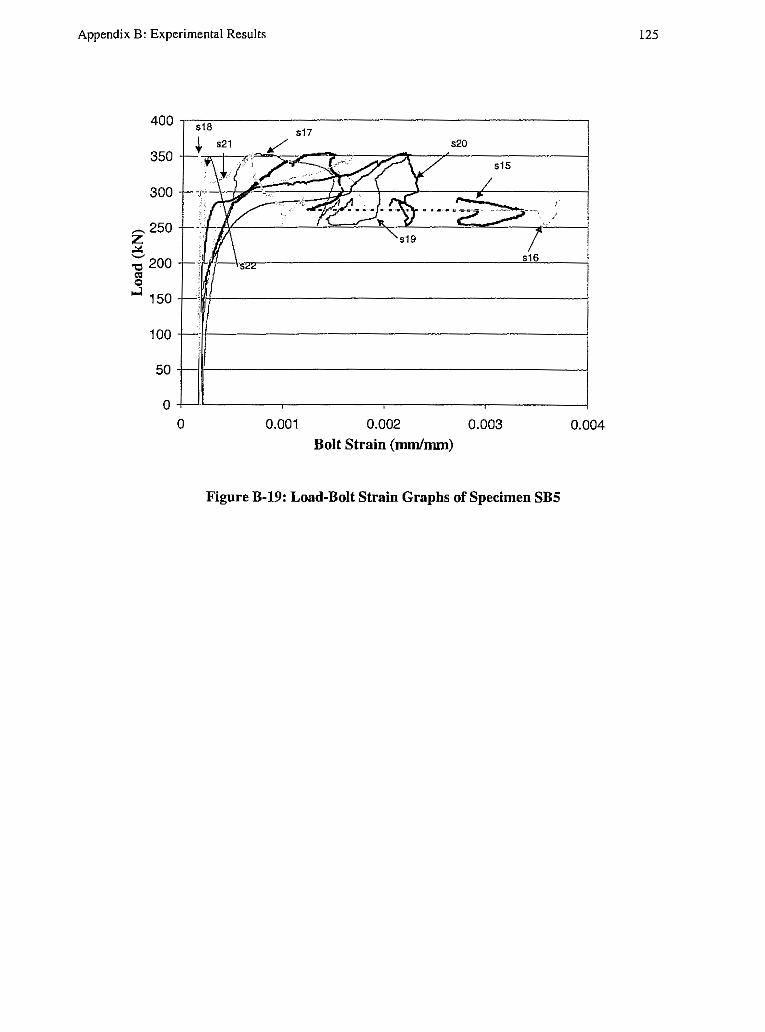
Appendix B: Experimental Results 125
400
350
300
~250 z .:.:: ~
"C 200 OS
" '"'150
100
50
0 0 0.001 0.002 0.003 0.004
Bolt Strain (mm/mm)
Figure B-19: Load-Bolt Strain Graphs of Specimen SB5

Appendix B: Experimental Results
400
3SO
300
.-. 250 z " :; 200 • ,5 150
100 )-Load VS Internal LVDT)
50
0 0 10 20 30 40
Displacement (mm)
(a.) Load vs Internal LVDT
50 60
350 - ---------·----------------,
300
z2so 0 't:I 200 ~
..J 150 H·------------------1
100+-----------1-=i:c;oa~d~v;sL'LVVI0'1T~8L'T~o;;;Jp - Load vs LVDT 8 Btm
50<---
o+--------------------< 0 10 20 30 40 50 60
Displacement (mm)
(c.) Load vs LVDT 8 Top, 8 Btm
400
350
··-·······--·-···-······--------·-----··--·····-·--·-·-·1
I
300 ! !
,......250 ---1-·- -· z !
. ···-·------·-------!
0 't:I 200 • 0
,-J 150 --· - -· ___________________ ,
100 -Load vs LVOT 10 Top
50 -Load vs LVDT 10 Btm ·-·-·----'===========-1
0 0 10 20 30 40 so 60
Displacement (nun)
(e.) Load vs LVDT 10 Top, 10 Btm
126
400
350
_/ / ' 300 ---··; 1 i
.-. 250 i
z I i
" __j :; 200
I • I
,5 150
I I
100 I
I I-Load vs Central LVDTI I 50 --,
I 0
0 10 20 30 40 50 60 Displacement (mm)
(b.) Load vs Central L VDT
400
350
300
z2so
" :;200 • 0
,-J 150
100 -Load vs LVDT 9 Top - Load vs LVDT 9 Btm
50
0 0 10 20 30 40 50 60
Displacement (nun)
(d.) Load vs LVDT 9 Top, 9 Btm
400
350
300
~
~250
"0200 g
...:i 150
100
50
0
0
.,,.,....-\
l I I [
I l
' i
!
I t
I /. Load vs LVOT 1 ti -LoadvsLVOT3
' I '
10 20 30 40 50 60 Displacement (nun)
(f.) Load vs LVDT 11, 3
Figure B-20: Load-Displacement Graphs of Specimen SB6
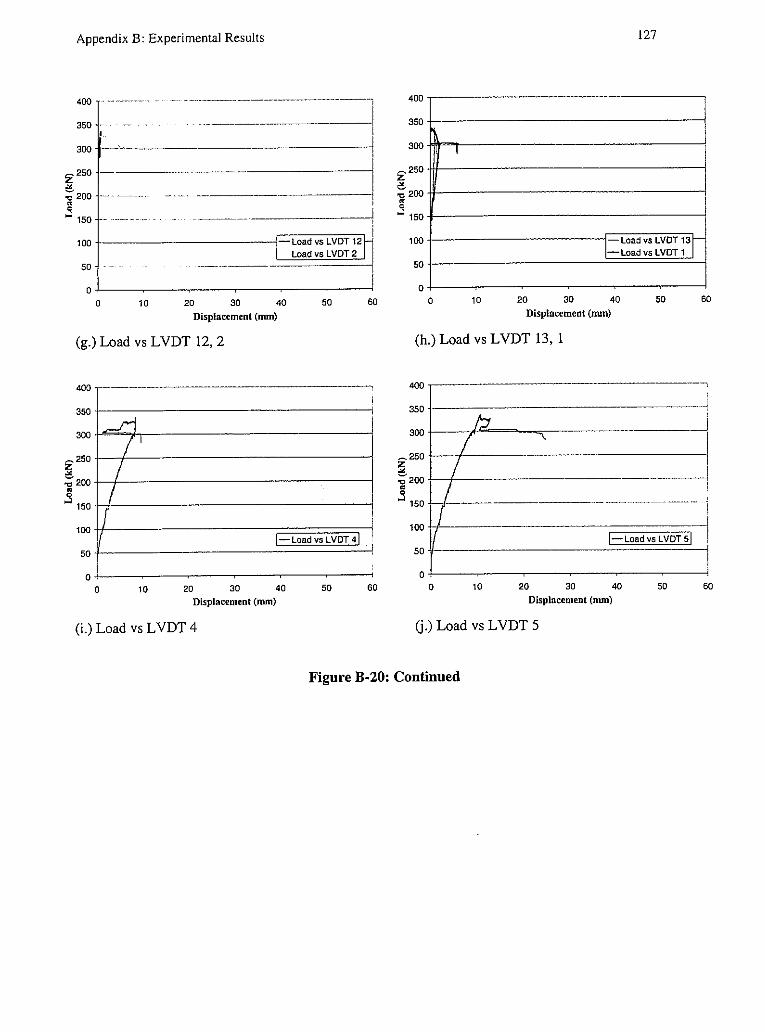
Appendix B: Experimental Results 127
350 · ------------ 350
300 - _,_, 300 I ' '
:z:,250 ----------------------!
e 'C 200 ··-·-------------l • 0
~ 150
100
50
0
_______________ _, i +-------------r=1=-clo01aicidvvssl'LVIEDYTTC,12l-2H
. LoadvsLVDT2 ~
- I 0 10 20 30 40 50 60
Displacement (nun)
(g.) Load vs L VDT 12, 2
400
350
300
,.....250
~ "Cl 200 • ,S 150
100
50
0
----·------·-·-----------------·------------!
.ri /'
I I f
I-LoadvsLVDT41 '
0 10 20 30 40 50 60
Displacement (mm)
(i.) Load vs L VDT 4
:z:,250
e -o 200 • 0
~ 150
100
50
0 0 10
i 1. Load vs LVOT 13r -Load vs LVDT 1
20 30 40 50 60
Displacement (nun)
(h.) Load vs L VDT 13, I
400
350
300
_...250
~ -o 200 • ,S 150
100
50
0
--------------·-----·----------·-, ' ....j
b ' I ! "\
I I I
1 I 7
---- -·~---- --- ·- i .
1-LoadvsLVDTsll ·1
' 0 10 20 30 40 50 60
Displacement (mm)
G-) Load vs LVDT 5
Figure B-20: Continued

Appendix B: Experimental Results
~ 250 +-----~-/ _____ ,,__ _________ ---j
~ i 200 -1----f--·-----_,,.C:.:...----------i
j1W ~ Load vs 8-8
100 +-,,;t-.----=""'---------------1-Load vs 9-9
0
-Loadvs10-10
0 2 4 6 8 10 12
Crack Width (mm)
10 9 8 l ,;::t;~ I I
ti ti
Positions ofLVDT pairs around the column
Figure B-21: Load vs Vertical Crack Width of Specimen SB6
Note: *See Figure 3-18
14
128

Appendix B: Experimental Results
400
350
300
,-. 250 z c "'200 • j 150
100
50
0
c.. - -,
0 0.005 0.01
Strain (mm/mm)
(a.) Load vs Ul Strain Gauge
350
300 )
.-..250
I z c "'200 I • C
.J 150
100
l
!-Loadvsu1I j ----~--- ---1
I
129
r----400~---------·--·--------·-----·--·--·------,i ~5,A-fv---------------l
~=--u='--,------------<
r----25,A-fvl---------------l.
I ~ / ' "' ' . J-,'.l-1sH~---------·----,
, !-Load vs U3j i _i ---5"-'v---·-----------------1
i O.Q15 0.02 -0.005 0 0.005 0.01 0.015 0.02
Strain (mm/mm)
(b.) Load vs U3 Strain Gauge
r·------·---400
I I s
z c • .s
50
-...:-===:.;- -Load vs U41 -- ---· --------====-- I 1-Loadvsusl
0 I V
l !
I ' i I ' !
i 1 !
0 0.005 O.Q1
Strain (mm/mm) 0.015 0.02 -0.02 ·0.015 -0.01 -0.005 0 0.005 Q,01 D.Q15 0.02
(c.) Load vs U4 Strain Gauge
300.1--\-------------------<
2 250
c .,,200-l-1--------------------g .J 150 L-------------------
100 t)---------------;:::::======:--1-Loadvsusl 50 '{___ ___________ _'::::::':':":::'::::':!.....l
oj_ _________________ l 0 0.005 0.0,
Strain (nun/mm)
(e.) Load vs U6 Strain Gauge
O.Q15 0.02
Strain (mm/mm)
(d.) Load vs US Strain Gauge
400 J 350 +--------------------1
' 300 • ....:~r-::;,,__ ______________ --1
z' 250 ,_, ____________________ _
c "Cl 200 --------------------··----g .J 150 -11--------------------,
1oot------------;c=======;-I-LoadvsL1I i
50 +-------------'===========--i o+---------==---------1
0 0.005 0.01
Strain (nun/mm)
(f.) Load vs LI Strain Gauge
0.015 0.02
Figure B-22: Load-Longitudinal Reinforcement Strain Graphs of Specimen SB6

Appendix B: Experimental Results
400 - ----~--- ·-
---- -----------'
300
,..250 z " :;J,oo " .3,50
100
50
0 0 o.oos 0.01
Strain (mm/mm)
!-LoadvsL2j
0.015
(g.) Load vs L2 Strain Gauge
400
350
300
........ 250
~ ;200 ~
..J 150
100
50
0
400
350
300
2 250
0 "Cl 200
" Q
..J 150
100
50
0
I
I-Load vs L4I
0 0.005 0.01 O.D15 Strain (mm/mm)
(i.) Load vs L4 Strain Gauge
-------------·--
!-LoadvsL6 /
I
0.02
I I
I ' I
' '
' i I I
0.02
i
I
I
I i
0 0.005 0.01 O.D15 0.02
Strain (nun/mm)
(k.) Load vs L6 Strain Gauge
130
! ~ -ae-
/ .....
J._ I
·--'""
.l 1-LoadvsL;n
:a- / . ,,.
l -0.001 ·0.0005 0 0.0005 0.001 0.0015 0.002
400
350
300
250 z :=.200 "' ~ ..J 150
100
50
0
Strain (mm/mm)
(h.) Load vs L3 Strain Gauge
- : I ! I
= I !-Load vs LSI I
··-·--i i
I 0 0.005 0.01 O.D15 0.02
400
350
300
22so
" :;-200 • Q
..J 150
100
so
0
Strain (mm/mm)
G.) Load vs LS Strain Gauge
;5'"\
0
I
I I
I
0.005 0.01
Strain (mm/mm)
(I.) Load vs L7 Strain Gauge
I I
! '
---~--~-
~ I I I I
-------i
/-Load VS L71 / i '
0.015 0.02
Figure B-22: Continued

Appendix B: Experimental Results 131
I 4--
S20 s16
I as: I I
j ,I .. J. ..... ~ ii_ 2: / · 1 ,······;)! "-~---"·-
f' '\s17 : '
,i ...___,15
' ; ·.·
S18-
" ,
I S19 -+\ s21
. : . .
... .. . .
-0.001 0 0.001 0.002 0.003 0.004
Strain (mm/mm)
Figure B-23: Load-Bolt Strain Graphs of Specimen SB6

References
ACI 318-99, ACI 318-77, ACI 318-63 "Building Code Requirements for Reinforced Concrete
(ACI 318-89)", American Concrete Institute, Detroit, 1999, 1977, 1963
Alexander, S.D.B, and Simmonds, S.H., "Bond Model for Concentric Punchlng Shear", ACI
Structural Journal, v.89, no. 3, May-June 1992, pp. 325-334
Alexander, S.D.B, and Simmonds, S.H., 1987 "Ultimate Strength of Slab-Column
Connections", ACI Structural Journal, v.84, No.3, May-June 1987, pp. 255-261
ASTM E 8M-00b, "Standard Test Method for Tension Testing of Metallic Materials [Mellie]",
2000
Bazant, Z.P., and Cao, Z., "Size Effect in Punching Shear Failure of Slabs", ACI Structural
Journal, v.84, no.I, Jan-Feb. 1987, pp. 44-53
Bortolotti, L., "Punching Shear Strength in Concrete Slabs", ACI Structural Journal, v.87, no.2,
Mar-Apr. 1990, pp 208-219
Braestrup, M.W., Nielsen, M.P., Jensen, B.C. and Bach, F., "Axisymmetric Punching of Plain
and Reinforced Concrete", Report No. 75, Structural Research Laboratory, Technical
University of Denmark, 1976, 33 pp.
Broms, C.E., "Punching of Flat Plates-A Question of Concrete Properties in Biaxial
Compression and Size Effect", ACI Structural Journal, v.87, no.3, May-June 1990, pp.292-304
Canadian Standards Association, "Design of Concrete Structures for Buildings", CAN3 A23.3-
M94, A23.3-M77, Rexdale, Ontario, 1994, 1977
Canadian Standards Association, "Limit States Design of Steel Structures", CSA S16-M94,
Rexdale, Ontario, December 1994
132

133
Canadian Standards Association, "Splitting Tensile Strength of Cylindrical Concrete
Specimens", A23.3.2-13C, Rexdale, Ontario, September 2000
Canadian Standards Association, "Compressive Strength of Cylindrical Specimens", A23.3.2-
9C, Rexdale, Ontario, September 2000
CEB Comite Euro-International Du Beton, "CEB-FIP Model Code 1990 - Final Draft",
Bulletin d'Information, No.203 -205, Lausanne, Switzerland, 1990
Cope, R.J., and Clark, L.A, "Concrete Slabs Analysis and Design", Elsevier Applied Science
Publishers, London and New York, 1984
Dilger, W.H., and Ghali A., "Shear Reinforcement for Concrete Slabs", Proceedings, ASCE,
Journal of Structural Division, v.107, no. ST12, December 1981, pp.2403-2420
Elgabry, A.A. and Ghali, A., "Design of Stud-Shear Reinforcement for Slabs" ACI Structural
Journal, v.87, no.3, 1990 pp.350-361
El-Salakawy, E.F, "Shear Behaviour of Reinforced Concrete Flat Slab-Column Edge
Connections with Openings", Thesis, Menoufia University, Egypt, 1998
El-Salakawy, Ehab F., Polak, Maria A., Soudki, K.A., "New Shear Strengthening
Technique for Concrete Slab-Column Connections" ACI Structural Journal, v 100, n 3, May
June, 2003, pp. 297-304
Eurocode2, "Design of Concrete Structures-Part!: General Rules and Rules for Buildings",
ENV !992-1-1:1991, Comite Europeen de Normalisation, Brussels
FIB Bulletin XX., "Punching of Structural Concrete Slabs-A State-of-the-art report", FIB Task
Group 4.3, Lausanne, Switzerland, 2001

134
Ghali, A, Sargious, M.A, and Huizer, A, "Vertical Prestressing of Flat Plates Around
Columns", Shear in Reinforced Concrete, ACI Special Publication SP-42, Vol.2, 1974, pp. 905-
920
Kinnunen, S., and Nylander, H., "Punching of Concrete Slabs without Shear Reinforcement",
Transactions of the Royal Institute of Technology (Sweden), no.158, Stockholm, 1960, 112 pp.
Long A.E., "A Two-Phase Approach to the Prediction of the Punching Strength of Slabs", ACI
Journal, v.73, No.2, February 1975, pp. 37-45
Macgregor J.G., Bartlett F.M., (2000), "Reinforced Concrete, Mechanics and Design", l"
Canadian Edition, Prentice Hall Canada Inc, Scarborough, Ontario
Marzouk , H., and Hussein, A, ''Experimental Investigation on the Behaviour of High-Strength
Concrete Slabs", ACI Structural Journal, v.88, No.6, November-December 1991, pp. 701-713
Moe, J., "Shearing Strength of Reinforced Concrete Slabs and Footings under Concentrated
Loads", Development Department Bulletin D47, Portland Cement Association, Skokie, Illinois,
April 1961, 130 pp.
Rankin, G.I.B, and Long, A.E, "Predicting the Punching Strength of Conventional Slab-Column
Specimens, Proceedings Institution of Civil Engineers, Part l, 82, April 1987, pp.327-346
Reagan, P.E., "Design for Punching Shear", The Structural Engineer, No.6, Volume 52, June
1974, pp.197-207
Shehata, I.A.E.M, and Regan, P.E. (1989). "Punching in R.C. Slabs" Journal of Structural
Engineering, Vol.115, No. 7, July, 1989, pp. 1726-1739
Structural Use of Concrete, Part 1: Code of Practice for Design and Construction (BS 8110),
British Standards Institution, London, 1985, 126 pp.
Recommended