1
A New Model for Nurse Practitioner Utilization in Primary Care:
Increased Efficiency and Implications
Nan Liu, PhD Assistant Professor
Department of Health Policy and Management
Mailman School of Public Health
Columbia University
600 W. 168th
St., 6th
Floor, New York, NY 10032
Email: [email protected]
Phone: 212 304 5591
Stacey R. Finkelstein, PhD Assistant Professor
Department of Health Policy and Management
Mailman School of Public Health
Columbia University
600 W. 168th
St., 6th
Floor, New York, NY 10032
Email: [email protected]
Phone: 212 305 3405
Lusine Poghosyan, PhD, MPH, RN Assistant Professor
Columbia University School of Nursing
617 W. 168th
St., GB 306, New York, NY 10032
Email: [email protected]
Phone: 212 305 7081
Key words: nurse practitioner, primary care, productivity, cost-efficiency, queueing theory
2
Abstract
Background: Nurse practitioners (NPs) play an important role in providing quality primary care.
However, little is known about organizational processes that best utilize NPs in care delivery and
what kind of resources and support NPs need to deliver quality care within their organizations.
In primary care settings, NPs often receive little support from ancillary personnel compared to
physicians.
Purpose: This article compares the productivity and cost-efficiency of NP utilization models
implemented in primary care sites with and without medical assistant (MA) support.
Methodology/Approach: We develop queueing models for these NP utilization models, of
which the parameters are extracted from literature or government reports. Appropriate analyses
are conducted to generate formulas and values for the productivity and cost-efficiency.
Sensitivity analyses are conducted to investigate different scenarios and to verify the robustness
of findings.
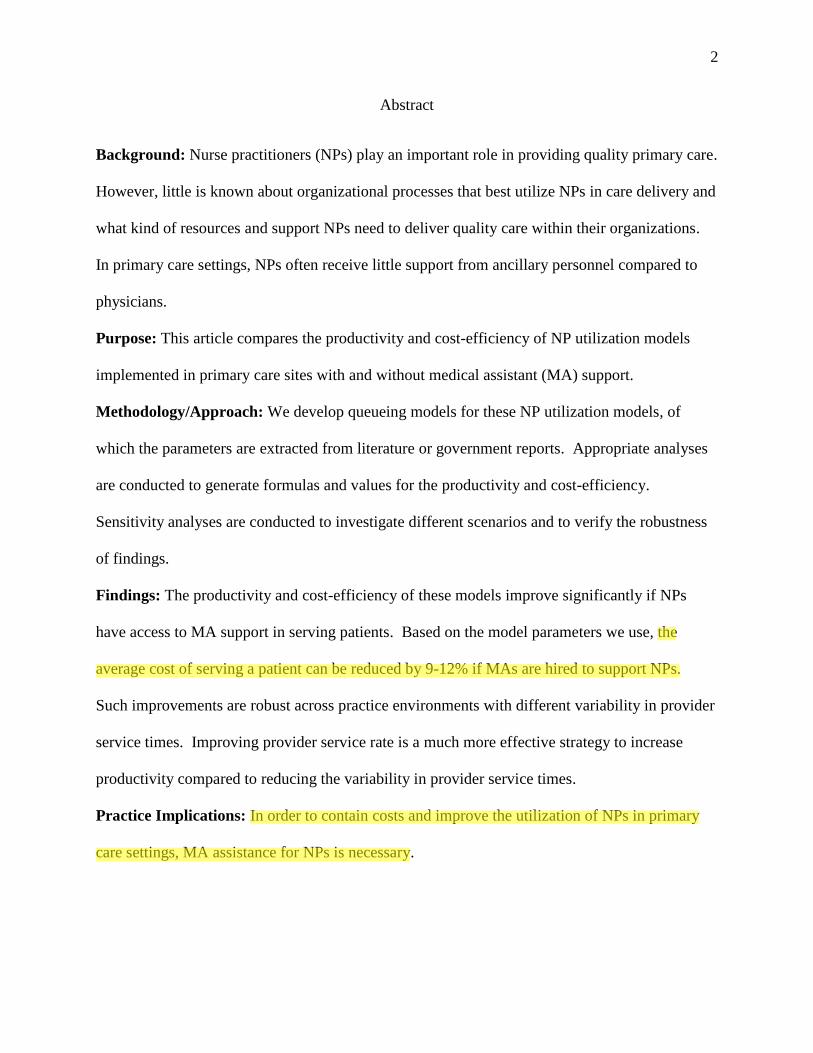
Findings: The productivity and cost-efficiency of these models improve significantly if NPs
have access to MA support in serving patients. Based on the model parameters we use, the
average cost of serving a patient can be reduced by 9-12% if MAs are hired to support NPs.
Such improvements are robust across practice environments with different variability in provider
service times. Improving provider service rate is a much more effective strategy to increase
productivity compared to reducing the variability in provider service times.
Practice Implications: In order to contain costs and improve the utilization of NPs in primary
care settings, MA assistance for NPs is necessary.

3
A New Model for Nurse Practitioner Utilization in Primary Care:
Increased Efficiency and Implications
Policy makers and many other stakeholders are constantly searching for ways to reduce the
cost of health care delivery while increasing timely access and providing high quality patient
care. The US health care system does not rank highly among the health care systems of
developed countries, mainly due to its high cost and poor outcomes (Murray & Frenk, 2010;
Schoen, Osborn, How, Doty, & Peugh, 2009). While costs are steadily increasing, delays in
receiving high quality care continue to be a challenge in the US. For example, 32% of Medicare
beneficiaries and 31% of privately insured patients had an unwanted delay in obtaining an
appointment for routine care in 2008 (Medicare Payment Advisory Commission, 2009).
Additionally, the average wait time for a new patient to obtain an appointment to see an internist
was 31 days in 2008 in Massachusetts (Massachusetts Medical Society, 2008). Finally, a 2009
survey shows that the average wait time to an appointment for a routine physical in Los Angeles
area is 59 days (Merritt Hawkins & Associates, 2009).
Delays in access to primary care pose a significant threat to patients, providers, and the
health care system. Long lead-time to get an appointment disrupts the patient-provider
relationship and breaks continuity of care, ultimately reducing the quality of care (Ulmer &
Troxler, 2006). Additionally, it can upset patients and result in a higher rate of missed
appointments (Green & Savin, 2008), which pose administrative inconvenience, scheduling
difficulties, and financial loss (Moore, Wilson-Witherspoon, & Probst, 2001). Also, poor access
to primary care is associated with more visits to the emergency department and worse health
outcomes (Tang, Stein, Hsia, Maselli, & Gonzales, 2010).

4
There is a significant public debate about challenges to primary care delivery, including the
severe shortage of internal and family medicine physicians (Rittenhouse, Shortell, & Fisher,
2009) and increased demand. The volume of patients will increase with the recent health care
reform bill (Patient Protection and Affordable Care Act, March 23, 2010) when more than 30
million Americans are expected to be included in health plans. Also, the epidemic of chronic
diseases and an increase in the aging population present a challenge for the health care system
(Boult, Counsell, Leipzig, & Berenson, 2010). The demand for quality primary care is expected
to surge in the near future, but a limited primary care workforce constitutes a capacity bottleneck
in providing timely and quality care.
During the past four decades, in addition to physicians, other health care providers have
delivered primary care, including physician assistants (PAs) and nurse practitioners (NPs).
Currently, NPs are the fastest growing group of practitioners (Auerbach, 2012). They are
formally and rigorously trained to coordinate and deliver comprehensive primary care (Kotthoff,
1981). Many studies show that NPs provide high quality care and that clinical outcomes do not
differ for patients receiving services from NPs compared to physicians (Mundinger et al., 2000;
Newhouse et al., 2011).
Recognizing the significant role that NPs play in providing primary care, the Patient
Protection and Affordable Health Care Act (PPACA) authorized a $50 million grant program for
the development and operation of Nurse-Managed Health Centers. These centers are
community-based primary care clinics in which NPs are the main service providers. Also, the
Institute of Medicine (2010) released a report on the future of nursing which calls for expansion
of the NP workforce in primary care as the key to providing timely high quality care.
5
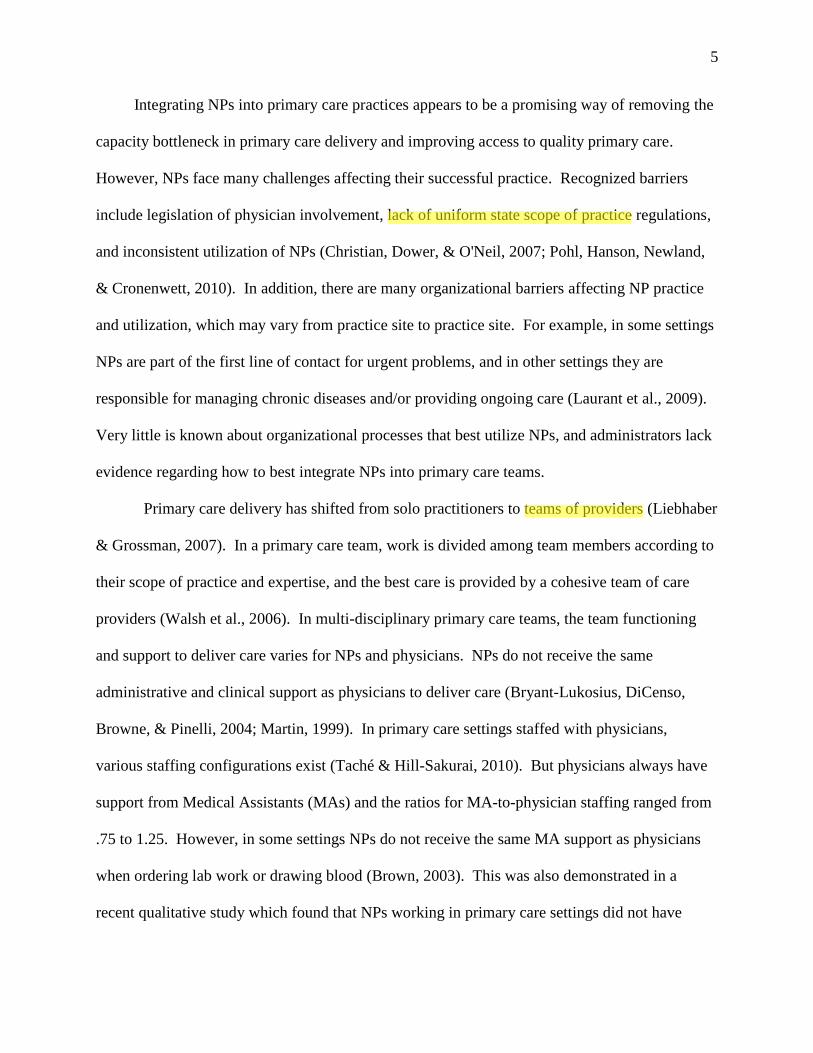
Integrating NPs into primary care practices appears to be a promising way of removing the
capacity bottleneck in primary care delivery and improving access to quality primary care.
However, NPs face many challenges affecting their successful practice. Recognized barriers
include legislation of physician involvement, lack of uniform state scope of practice regulations,
and inconsistent utilization of NPs (Christian, Dower, & O'Neil, 2007; Pohl, Hanson, Newland,
& Cronenwett, 2010). In addition, there are many organizational barriers affecting NP practice
and utilization, which may vary from practice site to practice site. For example, in some settings
NPs are part of the first line of contact for urgent problems, and in other settings they are
responsible for managing chronic diseases and/or providing ongoing care (Laurant et al., 2009).
Very little is known about organizational processes that best utilize NPs, and administrators lack
evidence regarding how to best integrate NPs into primary care teams.
Primary care delivery has shifted from solo practitioners to teams of providers (Liebhaber
& Grossman, 2007). In a primary care team, work is divided among team members according to
their scope of practice and expertise, and the best care is provided by a cohesive team of care
providers (Walsh et al., 2006). In multi-disciplinary primary care teams, the team functioning
and support to deliver care varies for NPs and physicians. NPs do not receive the same
administrative and clinical support as physicians to deliver care (Bryant-Lukosius, DiCenso,
Browne, & Pinelli, 2004; Martin, 1999). In primary care settings staffed with physicians,
various staffing configurations exist (Taché & Hill-Sakurai, 2010). But physicians always have
support from Medical Assistants (MAs) and the ratios for MA-to-physician staffing ranged from
.75 to 1.25. However, in some settings NPs do not receive the same MA support as physicians
when ordering lab work or drawing blood (Brown, 2003). This was also demonstrated in a
recent qualitative study which found that NPs working in primary care settings did not have

6
access to the same resources, including help from MAs, as physicians to provide the same care.
Most NPs reported that while physicians had assigned MAs, NPs did not (Poghosyan, Nannini,
Stone, & Smaldone, 2012). NPs explained this discrepancy in support by the misconception that
NPs are registered nurses and therefore are capable of carrying out basic tasks such as taking a
patient’s weight, height and vital signs. However, it may no longer be efficient for NPs to carry
out such basic tasks, especially when the literature shows that MAs have sufficient expertise on
these to assure efficient clinic flow and promote patient satisfaction (Taché & Hill-Sakurai,
2010). The underutilization of NP workforce and inefficient use of NP time and skills may have
a concomitant negative impact on organizational performance that could lead to increased time
for patient processing, wasted costs, and reduced employee morale.
A common finding in the literature that examines NP practices is that NPs typically have
longer consultation length and hence lower service rates compared to physicians (Laurant et al.,
2009). Though not rigorously stated or investigated in the literature, there could be two possible
explanations. One is that NPs provide more information on illness and more advice to patients
on self-management during the consultation (Kinnersley et al., 2000; Shum et al., 2000). The
second is that NPs need to spend more time in processing tasks that would have been delegated
to MAs if the patient were seen by physicians. Kinnersley et al. (2000) show that NP
consultation time drops on average 17% if excluding breaks in their service due to tasks like
getting prescription authorized, but is still on average 40% longer than physician consultation
times. Thus, NP consultation time can be reduced if they get more support, but they are still
likely to have longer consultation times than physicians.
Since the demand for primary care will increase in the near future, a more efficient model
of NP utilization that optimizes the allocation of time and resources NPs have available to

7
deliver quality care is essential. We recognize that providing NPs with additional support,
including MA assistance, will improve their service rate and thus overall productivity; however,
it may also increase staffing costs. Hence the cost-efficiency of hiring additional MAs to assist
NPs may not be immediately visible. In this paper, we will quantify the productivity and cost
impact of hiring additional MAs to assist NPs. In particular, this paper seeks to answer the
question of whether supporting NPs with MAs allows NPs to be more productive to a degree that
confers a net financial benefit in saving staffing costs.
NP Workforce Utilization Models
NPs provide comprehensive primary care, which includes preventive, chronic, and
episodic care (McClellan, Hansen-Turton, & Ware, 2010), to millions of patients in various
primary care settings including private physicians’ offices, large primary care networks, retail
clinics, and nurse-managed centers. In some of these settings, NPs work with physicians in the
same site (e.g., physician office, academic centers) whereas in other settings NPs work alone and
are solely responsible for all primary care (e.g., retail clinics, nurse-managed centers). When
NPs work with physicians in the same practice site, they can either collaboratively manage the
same panel of patients, or they can manage a different group of patients and can be recognized as
primary care providers for that particular group (Commonwealth of Massachusetts, 2008). In the
latter case, NPs manage their own panel of patients. Thus, NP utilization models can largely be
categorized into two types where: 1) NPs practice without physicians (for brevity we will call
them MDs, i.e., medical doctors) and 2) NPs work together with MDs and they collaboratively
manage the same panel of patients.
To operationalize these conceptual models, we consider two models with specific staffing
configurations shown in Figure 1. The first model is a group practice model of two NPs. The
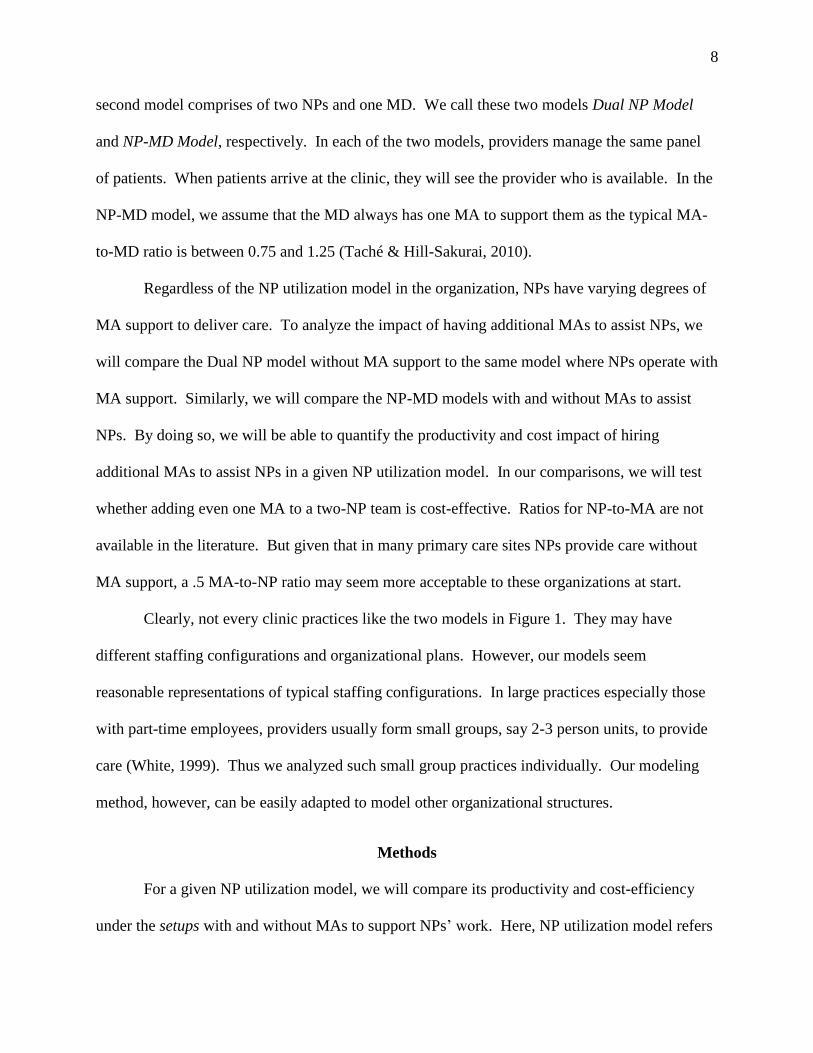
8
second model comprises of two NPs and one MD. We call these two models Dual NP Model
and NP-MD Model, respectively. In each of the two models, providers manage the same panel
of patients. When patients arrive at the clinic, they will see the provider who is available. In the
NP-MD model, we assume that the MD always has one MA to support them as the typical MA-
to-MD ratio is between 0.75 and 1.25 (Taché & Hill-Sakurai, 2010).
Regardless of the NP utilization model in the organization, NPs have varying degrees of
MA support to deliver care. To analyze the impact of having additional MAs to assist NPs, we
will compare the Dual NP model without MA support to the same model where NPs operate with
MA support. Similarly, we will compare the NP-MD models with and without MAs to assist
NPs. By doing so, we will be able to quantify the productivity and cost impact of hiring
additional MAs to assist NPs in a given NP utilization model. In our comparisons, we will test
whether adding even one MA to a two-NP team is cost-effective. Ratios for NP-to-MA are not
available in the literature. But given that in many primary care sites NPs provide care without
MA support, a .5 MA-to-NP ratio may seem more acceptable to these organizations at start.
Clearly, not every clinic practices like the two models in Figure 1. They may have
different staffing configurations and organizational plans. However, our models seem
reasonable representations of typical staffing configurations. In large practices especially those
with part-time employees, providers usually form small groups, say 2-3 person units, to provide
care (White, 1999). Thus we analyzed such small group practices individually. Our modeling
method, however, can be easily adapted to model other organizational structures.
Methods
For a given NP utilization model, we will compare its productivity and cost-efficiency
under the setups with and without MAs to support NPs’ work. Here, NP utilization model refers

9
to either the Dual NP model or the NP-MD model; while model setup relates to whether NPs
receive support from MAs within a given NP utilization model. Following the work of Liu and
D’Aunno (2012), we measure the productivity of a model of a given setup using two equivalent
metrics: 1) the average number of patients that a model setup can serve per day; and 2) the panel
size (i.e., the total number of patients) a model setup can be held accountable for.
To compare the productivity of a given NP utilization model under different setups (with
and without MA’s support to NPs), we ensure that the average appointment delays that patients
experience in both setups is equal. Appointment delay, a direct measure for timeliness to care, is
defined as the time lapse from when a patient makes an appointment and her actual appointment
date. For a given model setup, an increase in panel size leads to more patients seeking care per
day and longer average appointment delays for all patients. Thus it is not straightforward to
conclude that a model setup serving a larger panel size but with longer appointment delays is
more productive than a model setup serving a smaller panel size but with shorter appointment
delays, because the former setup may still have longer appointment delays if its panel size were
to shrink to the same level of the latter setup. To ensure a fair comparison, we keep a same level
of average appointment delay experienced by patients across different setups within a model. If
we hold average patient appointment delay constant across our model setups, then a more
productive setup is able to 1) serve more patients a day and 2) be held accountable for a larger
panel size.
To measure the cost-efficiency of the model, we assume that all providers are salaried to
make cost accounting simple. Thus the major cost component is staffing costs (i.e., provider
salaries). Given the panel size and total annual staffing costs in a model, cost-efficiency is

10
defined as the average staffing cost per patient in the panel. The smaller the average staffing cost
per patient, the more cost-efficient the model setup.
To evaluate the productivity and cost-efficiency of an NP utilization model setup while
controlling for average patient appointment delay, we need methods that can estimate patient
appointment delay based on patient demand and each model’s service capacity. Queueing
theory, an advanced mathematical modeling technique that can estimate waiting times in a
system (Green, 2006; Gross & Harris, 1985), is an ideal analysis tool for this task. To illustrate
how queueing theory functions in primary care settings, imagine a primary clinic which serves a
patient population. Patients make appointment requests throughout the day, and their names are
registered on the appointment schedule, which is considered as the queue. This queue is for
scheduled appointments, and can be regarded as a virtual list of scheduled patients yet to be seen
by providers. The waiting time measured in such a queue is related to the number of patients
registered in the appointment schedule and thus corresponds to the appointment delay. During
the day, providers in the clinic serve the patients on the schedule and make the queue shorter.
When the clinic is closed, no patients call in to join the queue and no patients are served or leave
the queue either; the queue remains unchanged. Observing this, we can “drop” the non-office
hours of the clinic and “connect” the office hours together to consider a continuous queueing
process. The length of the queue varies over time. It increases when new appointments arrive
and decreases when patients are served. The variability of the queue length thus comes from two
sources that can involve randomness: patient arrival and provider service. To analyze such a
queueing process, we need to specify these two sources: how patients arrive (i.e., arrival process)
and how providers see patients (i.e., service process). These will be the topics of the next
section.

11
Queueing models
Arrival process
We assume that the appointment request (demand) from each patient in the panel can be
modeled as a Poisson Process (Gross & Harris, 1985) with rate requests per day. If the panel
size is and we assume that each patient raises her appointment request independently of others,
then the overall arrival of appointment requests faced by the system is also a Poisson Process
with rate requests per day. The Poisson Process is a widely used, empirically validated
customer arrival model, especially in situations where customers arrive one at a time and where
each arrival is independent of others (Gross & Harris, 1985). These assumptions hold well in our
outpatient appointment settings, and several previous studies have used this process to model the
arrival of outpatient appointment requests (Green & Savin, 2008; Liu & D'Aunno, 2012).
Using properties of the Poisson Process, we know that the mean daily arrival is
requests. Recall that the panel size and the average daily appointment arrival (i.e., the average
number of patients the practice team will see) are the two measures for the productivity of an NP
utilization model. Given the individual request rate , the average daily arrival rate is
proportional to panel size . Hence, these two measures are equivalent to each other, meaning
that one directly implies the other and vice versa.
Service process
We assume that the appointment requests in the queue are served in a first-come-first-
served (FCFS) order. This implies that each appointment request is registered immediately after
its predecessor. We acknowledge that this is a simplification of real appointment scheduling
practice, as not all patients may take the next available appointment slot. Queueing studies often
make such simplifications to make models tractable; more importantly, a previous study

12
demonstrates that queueing models with the FCFS assumption leads to relatively accurate
estimates for panel sizes by comparing the estimates from queueing models with those generated
by simulation models, which consider patient preference and other daily scheduling details
(Green & Savin, 2008). Recall that panel size is the measure for productivity in our study. Thus
assuming FSFS service order would not lead to notable bias in estimating the productivity and
cost-efficiency of our models.
In practice, appointments are usually set in advance. However, there may still be some
variation in the number of patients seen every day. One important reason is that different
patients may demand different amounts of service time. For example, appointment slots for new
patients are usually longer than those of established ones (Harper & Gamlin, 2003). If more new
patients are scheduled in a day, then fewer patients can be seen on that day. Such variability in
service duration can depend on the mix of patients served by the clinic. To model such
variability in provider service duration, we consider the following two cases.
1. Random service time case: We consider that a provider’s service time for each patient is
random and follows an exponential distribution. Under this assumption, the number of patients
that can be seen in a day is a Poisson random variable, of which the mean equals the variance.
This suggests that: 1) if the number of patients that a provider sees fluctuates over days and 2) if
the mean of this random number is close to its variance, then the exponential assumption for
service times could be reasonable. One advantage of considering such service times is that it
makes the analysis of queueing models more tractable; closed-form formulas exist for systems
performance measures, which can easily be evaluated in a spreadsheet tool like Excel.
2. Deterministic service time case: We also consider a case where a provider’s service time for
each patient is the same and deterministic, e.g., 15 minutes. This corresponds to the situation

13
where the time allotted to each appointment slot is fixed and hence the number of patients seen
by a provider is the same throughout days. This assumption may appear more realistic in
practices that are well established and face a more homogeneous patient population. Queueing
models under such an assumption do not lead to closed-form representations of system
performances.
Following conventional terminology in queueing theory, we call models with
deterministic service time non-Markovian models and those with exponential service times
Markovian models. Markovian models involve larger variability in service times compared to
non-Markovian models, and hence lead to more conservative estimates for systems performance.
For example, given the same requirement on average appointment delay, the productivity under
Markovian models is typically smaller than that under non-Markovian models. These two types
of models enable us to investigate the impact of variability in provider service times on system
productivity and cost-efficiency. Such variability in the service process might be driven by
practice environment, e.g., patient mix. If the results are consistent under these two types of
models, it implies that our findings are robust across practice environments with different
variability in provider service times.
Model configurations
For each NP utilization model (i.e., Dual NP model and NP-MD model), we will compare
the situations where NPs receive assistance from MAs and where NPs do not have such support.
We capture the differences between these two situations by using different NP service rates.
Clearly, NPs can provide care to more patients per day if they receive support from MAs (see
more discussions below). Crossing with the two service time distributions we will use, we will

14
consider four scenarios for each NP utilization model (with or without support from MAs two
service time assumptions).
Model analysis
For each NP utilization model, we develop either analytical or numerical methods to
evaluate patient average appointment delay given the demand rate . Using these
methods, we can recover the productivity, i.e., the largest panel size under which patient
average appointment delay is not exceeding a given threshold. The cost-efficiency is then
simply the average staffing costs with respect to the panel size . We defer these technical
details to the Appendix.
Model parameters
We exact model parameters based on a review of literature. We focus on primary care
NP practices and consider visits to general and family practice, internal medicine, and pediatrics
as primary care visits. The 2006 National Ambulatory Medical Care Survey (NAMCS) data
(Cherry, Hing, Woodwell, & Rechtsteiner, 2008) suggest that the annual number of such visits
made per person in the United States is 2.9. This is translated to 0.012 visit per person per
business day, which we use as the daily rate of appointment requests per patient, i.e., .
Another study using MAMCS data and American Medical Association’s Socioeconomic
Monitoring Systems (SMS) data demonstrated that the mean length of office visits to primary
care physicians was around 16–18 minutes in the U.S. (Mechanic, McAlpine, & Rosenthal,
2001). Accordingly, we set the service rate of MDs to be patients a day, i.e., 15
minutes per visit. Though NPs spend longer consultation time than MDs, how much they differ
can vary (Kinnersley et al., 2000; Shum et al., 2000). However, no literature seems to report
how NP consultation length would change if NPs were supported by MAs. The only relevant

15
study we are aware of is Kinnersley (2000), which reported that the ratio of MDs’ consultation
times to NPs’ ranged from .46-.90 with mean .61 (including breaks in NP consultation to get
prescriptions authorized or for other similar reasons) and from .57-.94 with mean .74 (excluding
breaks). NPs’ consultation times are reduced excluding breaks, but are still longer than MDs’.
In this study, we used the ratio of excluding breaks as a proxy for the one if NPs were supported
by MAs. Accordingly, we suppose that NPs see 18 patients a day without help from MAs
(corresponding to the mean consultation time ratio including breaks), and they see 25 patients a
day with help from MAs (corresponding to the mean ratio excluding breaks). In a typical
primary care site, each MD has an assigned full-time MA (Taché & Hill-Sakurai, 2010); and we
suppose that one full-time MA can assist two NPs on a daily basis for reasons discussed above.
Regarding salary, we use the national median wage reported by the U.S. Bureau of Labor
Statistics (2012) and set NP, MA and MD annual salaries to be $65,000, $30,000 and $160,000,
respectively.
Based on our interaction with many clinics that use NPs, these parameters are consistent
with their practice. Table 1 lists the key parameters we use to populate our models and their
references. We set the service level requirement so that the average appointment delay should
not exceed one day when evaluating and comparing different NP utilization model setups.
Although we use the parameters specified above, other values of these parameters, if deemed
appropriate for a given practice, can also be used.
Findings
The productivity (measured by average daily throughput) and cost-efficiency (measured
by annual staffing cost per patient) of Dual NP models with and without support from MAs is
plotted in Figure 2 and detailed comparison statistics are tabulated in Table 2. The productivity

16
of the Dual NP Model is improved by 40% when hiring an MA to support the work of two NPs.
This improvement is due to the fact that MA assistance reduces the time that NPs need to spend
with every patient. Since the improvement in productivity is significantly higher than the 23%
increase in annual staffing costs due to hiring an additional MA, the cost-efficiency of the model
improves. More specifically, the annual staffing cost per patient drops by 12%, reducing the
staffing cost per patient from about $44 to $39 after hiring an MA (see Table 2). The percentage
improvements in both productivity and cost-efficiency are consistent across both Markovian and
non-Markovian models, suggesting that clinics can get similar percentage improvements in their
productivity and cost-efficiency by hiring MAs to support NPs, regardless of the variability in
their provider service times. In other words, improvements resulted from supporting NPs with
MAs are robust across practice environments with different variability in provider service times.
Under the same service level requirement on average patient appointment delay, the non-
Markovian model, as expected, provides a slightly larger estimate for productivity compared to
the Markovian model. However, estimates from both models are close, indicating that variability
in provider service rate does not seem to have a significant impact on the model’s productivity in
the long run, as long as the mean provider service rates are the same. This is in accordance with
previous findings (Liu & D'Aunno, 2012), and suggests that improving provider service rate is a
much more effective strategy to increase productivity compared to reducing the variability in
provider service times. Having MAs to support NPs can be one of such effective strategies.
In addition, since the estimates from Markovian and non-Markovian cases are close to
each other, these estimates provide robust information for managers to use. For example, the
estimated panel sizes of Dual NP Model after hiring an MA are 4083 and 4125 for Markovian
and non-Markovian cases, respectively, compared to 2917 and 2958 without MAs. Then the

17
manager would know that the target panel size for a Dual NP Model can be raised to about
4083~4125, if she decides to hire a new MA to support NPs.
Results for NP-MD model are presented in Table 2 and Figure 2. Similarly, we see that
Markovian and non-Markovian models provide consistent estimates for the productivity and
cost-efficiency. In both setups, the productivity of the model improves by 21% after hiring an
additional MA. Despite a 9% increase in annual staffing costs, a much stronger gain in
productivity leads to a 10% improvement in cost-efficiency. Thus, providing MA support to NPs
can also significantly improves productivity and cost-efficiency when NPs and MDs work in the
same care team.
Discussion
Health care providers need adequate support to deliver high quality care and achieve
better outcomes. Unequal distribution of organizational resources among providers that carry
out similar responsibilities and lack of support may challenge the quality and cost-effectiveness
of care. This study uses an innovative methodology, widely applied in other disciplines, to
estimate the productivity and cost-efficiency of primary care delivery models using NPs as care
providers, and finds that hiring additional MAs to support NPs significantly improves the
productivity of care delivery in primary care practices where NPs manage their own panel of
patients or they collaboratively manage the same panel of patients with physicians. In either
model of NP utilization, productivity increases if NPs have access to MA support to carry out
patient care tasks that they usually carry out for the physicians’ patients. More importantly, the
inclusion of MAs to assist NPs significantly improves the cost-efficiency of the organization,
implying that this is a promising way to expand primary care service capacity while also

18
achieving cost savings. This is a significant finding as administrators and policy makers are
searching for ways to assure access to high quality and cost-effective primary care.
Our study focuses on salaried practices and internal costs; future research can consider
the revenue side and possible savings recovered by payers as well. We only discuss one
organizational barrier that hinders NPs’ abilities to practice in clinical settings: access to support.
More research is needed to better understand what factors contribute to productive NP-MA work
relationships, and how to best integrate NPs in primary care teams and assure patient-centered
care.
Practice Implications
To contain costs and improve access to care, organizations should focus on better
utilizing the NP workforce and developing innovative models to more efficiently utilize the skill
set of their employees. As the number of NP providers will significantly increase in the near
future, organizations should find better ways to improve their productivity as primary care
providers. New models aimed at improving efficiency need to consider the entire organizational
system. Specifically, organizations should consider patient outcomes and the optimal workforce
mix as well as maintaining a focus on containing costs given the increased demand placed on the
healthcare system. We propose that if NPs are given the appropriate resources that harness their
advanced skill sets, as is the case when NPs are assisted by MAs, then clinics will operate at a
more cost-efficient and productive level. In this case, NPs are no longer underused to conduct
basic tasks in primary care settings but rather can provide a high level of care that draws on their
advanced knowledge and experience. To achieve this, organizations need to play an active role
in opening lines of communication and reducing status differentials between NPs and other
health care providers. In organizations that foster open communications, NPs will have an

19
increased ability to communicate when their skills are being underused for basic tasks and can
delegate these tasks to other health care providers whose function is more appropriate to carry
out these types of tasks.
Given that in many primary care sites, NPs provide care without MA support and
organizations may resist in providing NPs with equal MA support as physicians, we suggest that,
as a starting point, one MA can be shared between two NPs to improve the productivity of two
health care providers; and larger MA to NP ratios can be used if deemed helpful and appropriate
in the future. The distribution of organizational resources should be conducted based on the best
ways of delivering care. If NPs deliver the same high quality care independently, then they
should have access to comparable resources as physicians. Lack of access to organizational
resources might affect NPs’ perceptions on how they are valued by their organizations and may
lead to poor NP outcomes such as job dissatisfaction and high turnover rates.
In conclusion, this study investigates the productivity and cost-efficiency of possible
primary care models utilizing NPs and demonstrates that primary care organizations will benefit
from providing NPs with necessary MA support to deliver care. To our knowledge, this is the
first study that specifically looks at the lack of MA support for NPs and the potential impact on
cost and productivity. In order to expand the NP workforce in primary care to meet the increased
demand, more research is needed to better understand the resources and organizational support
that NPs need to deliver high quality care.

20
Table 1.
Parameters for NP Utilization Models
Model parameters Value References
Individual patient demand rate
(requests per person per business day) 0.012 Cherry et al. (2008)
MD service rate
(patients per day) 32 Mechanic et al. (2001)
NP service rate (without MA support)
(patients per day) 18 Kinnersley et al. (2000)
NP service rate (with MA support)
(patients per day) 25 Kinnersley et al. (2000)
MD annual salary ($) 160,000 The U.S. Bureau of Labor Statistics (2012)
NP annual salary ($) 65,000 The U.S. Bureau of Labor Statistics (2012)
MA annual salary ($) 30,000 The U.S. Bureau of Labor Statistics (2012)

21
Table 2.
Comparison of NP Utilization Models with and without Support from MAs
Dual NP Model 2 NP 2 NP + 1 MA % of Increase
Annual staffing costs $130,000 $160,000 23%
Requirement on appointment delay ≤ 1 day ≤ 1 day NA
Markovian model
Average daily demand (throughput) 35 49 40%
Panel size 2917 4083 40%
Annual staffing cost/patient $44.6 $39.2 -12%
Non-Markovian model
Average daily demand (throughput) 35.5 49.5 39%
Panel size 2958 4125 39%
Annual staffing costs/patient $43.9 $38.8 -12%
NP-MD Model 2 NP + MD + MA 2 NP +MD + 2 MA % of Increase
Annual staffing costs ($) $320,000 $350,000 9%
Requirement on appointment delay ≤ 1 day ≤ 1 day NA
Markovian model
Average daily demand (throughput) 67 81 21%
Panel size 5583 6750 21%
Annual staffing cost/patient ($) 57.3 51.9 -10%
Non-Markovian model
Average daily demand (throughput) 67.7 81.8 21%
Panel size 5642 6814 21%
Annual staffing costs/patient ($) 56.7 51.4 -9%

22
Figure 1 Nurse Practitioner Utilization Models
(In the figure, represents patient demand rate; and represent NP service rates without
and with MA support; represents MD service rate.)
Dual NP Model
NP NP
NP-MD Model
NP NP MD+MA
Models without
MA support to NPs
Models with
MA support to NPs
NP NP
Dual NP Model NP-MD Model
MA MA NP NP MD+MA

23
Figure 2 Productivity and Cost-efficiency of NP Utilization Models with and without Support
from MAs
35 35.5
49 49.5
Markovian models non-Markovian models
Daily throughput of dual NP model
2 NPs 2 NPs + 1 MA
44.6 43.9
39.2 38.8
Markovian models non-Markovian models
Annual cost per patient of dual NP model ($)
2 NPs 2 NPs + 1 MA
67 67.7
81 81.8
Markovian models non-Markovian models
Daily throughput of NP-MD model
2 NPs + MD + MA 2 NPs + MD + 2 MAs
57.3 56.7
51.9 51.4
Markovian models non-Markovian models
Annual cost per patient of NP-MD model ($)
2 NPs + MD + MA 2 NPs + MD + 2 MAs

24
References
Auerbach, D. I. (2012). Will the NP workforce grow in the future? New forecasts and
implications for healthcare delivery. Medical Care (in press).
Boult, C., Counsell, S. R., Leipzig, R. M., & Berenson, R. A. (2010). The urgency of preparing
primary care physicians to care for older people with chronic illnesses. Health Affairs, 29(5),
811-818.
Brown, M. A. (2003). Experiences of pioneer nurse practitioners in establishing advanced
practice roles. Journal of Nursing Scholarship, 35(4), 391-397.
Bryant-Lukosius, D., DiCenso, A., Browne, G., & Pinelli, J. (2004). Advanced practice nursing
roles: Development, implementation and evaluation. Journal of Advanced Nursing, 48(5),
519-529.
Cherry, D., Hing, E., Woodwell, D., & Rechtsteiner, E. (2008). National ambulatory medical
care survey: 2006 summary. National Health Statistics Reports(3).
Christian, S., Dower, C., & O'Neil, E. (2007). Overview of nurse practitioner scopes of practice
in the United States -- Discussion. San Francisco, CA: UCSF Center for the Health
Professions.
Commonwealth of Massachusetts. (2008). Chapter 305 of the Acts of 2008: An act to promote
cost containment, transparency and efficiency in the delivery of quality health care, from
http://www.mass.gov/legis/laws/seslaw08/sl080305.htm
Green, L. (2006). Queueing analysis in healthcare. In R. W. Hall (Ed.), Patient flow: Reducing
delay in healthcare delivery (pp. 281-308). New York, NY: Springer-Verlag.
Green, L., & Savin, S. (2008). Reducing delays for medical appointments: A queueing approach.
Operations Research, 56(6), 1526-1538.

25
Gross, D., & Harris, C. (1985). Fundamentals of queueing theory. New York, NY: John Willey
and Sons, Inc.
Harper, P., & Gamlin, H. (2003). Reduced outpatient waiting times with improved appointment
scheduling: a simulation modelling approach. OR Spectrum, 25(2), 207-222.
Institute of Medicine. (2010). The future of nursing: Leading change, advancing health.
Retrieved December 10, 2011, from http://www.iom.edu/Reports/2010/The-Future-of-
Nursing-Leading-Change-Advancing-Health.aspx
Kelton, W. D., & Law, A. M. (2000). Simulation modeling and analysis (3 ed.). Boston, MA:
McGraw Hill.
Kinnersley, P., Anderson, E., Parry, K., Clement, J., Archard, L., Turton, P., . . . Rogers, C.
(2000). Randomised controlled trial of nurse practitioner versus general practitioner care for
patients requesting "same day" consultations in primary care. BMJ, 320(7241), 1043-1048.
Kotthoff, M. E. (1981). Current trends and issues in nursing in the United States: the primary
health care nurse practitioner. International Nursing Review, 28(1), 24-28.
Laurant, M., Harmsen, M., Wollersheim , H., Grol, R., Faber, M., & Sibbald, B. (2009). The
impact of nonphysician clinicians: Do they improve the quality and cost-effectiveness of
health care services? Medical Care Research and Review, 66(6), 36S-89S.
Liebhaber, A., & Grossman, J. M. (2007). Physicians moving to mid-sized, single-specialty
practices. Track Rep, 18, 1-5.
Liu, N., & D'Aunno, T. (2012). The productivity and cost-efficiency of models for involving
nurse practitioners in primary care: A perspective from queueing analysis. Health Services
Research, 47(2), 594-613.

26
Martin, P. D. (1999). Nurse practitioners and the problem of discounting. Journal of Advanced
Nursing, 29(1), 9-17.
Massachusetts Medical Society. (2008). 2008 Physician Workforce Study. Waltham, MA:
Massachusetts Medical Society.
McClellan, F., Hansen-Turton, T., & Ware, J. M. (2010). Nurse practitioners in primary care.
Temple Law Review, 82, 1235-1263.
Mechanic, D., McAlpine, D. D., & Rosenthal, M. (2001). Are patients' office visits with
physicians getting shorter? NEJM, 344(3), 198-204.
Medicare Payment Advisory Commission. (2009). Report to the Congress: Medicare payment
policy. Washington, DC: MedPAC.
Merritt Hawkins & Associates. (2009). 2009 Survey of Physician Appointment Wait Times.
Irving, TX: Merritt Hawkins & Associates.
Moore, C. G., Wilson-Witherspoon, P., & Probst, J. C. (2001). Time and money: Effects of no-
shows at a family practice residency clinic. Family Medicine, 33(7), 522-527.
Mundinger, M. O., Kane, R. L., Lenz, E. R., Totten, A. M., Tsai, W. Y., Cleary, P. D., . . .
Shelanski, M. L. (2000). Primary care outcomes in patients treated by nurse practitioners or
physicians. JAMA, 283(1), 59-68.
Murray, C. J. L., & Frenk, J. (2010). Ranking 37th — Measuring the performance of the U.S.
health care system. NEJM, 362(2), 98-99.
Newhouse, R. P., Stanik-Hutt, J., White, K. M., Johantgen, M., Bass, E. B., Zangaro, G., . . .
Weiner, J. P. (2011). Advanced practice nurse outcomes 1990-2008: A systematic review.
Nursing Economics, 29(5), 1-22.

27
Patient Protection and Affordable Care Act. (March 23, 2010). Act of 2010. Public Law 111-148,
124 Stat. 119 thru 124 Stat. 1025.
Poghosyan, L., Nannini, A., Stone, P., & Smaldone, A. (2012). Organizational climate in
primary care settings: Implications for nurse practitioner workforce. Manuscript submitted
for publication.
Pohl, J. M., Hanson, C., Newland, J. A., & Cronenwett, L. (2010). Unleashing nurse
practitioners’ potential to deliver primary care and lead teams. Health Affairs, 29(5), 900-
905.
Rittenhouse, D. R., Shortell, S. M., & Fisher, E. S. (2009). Primary care and accountable care —
Two essential elements of delivery-system reform. NEJM, 361(24), 2301-2303.
Schoen, C., Osborn, R., How, S. K. H., Doty, M. M., & Peugh, J. (2009). In chronic condition:
Experiences of patients with complex health care needs, in eight countries, 2008. Health
Affairs, 28(1), w1-w16.
Shum, C., Humphreys, A., Wheeler, D., Cochrane, M. A., Skoda, S., & Clement, S. (2000).
Nurse management of patients with minor illnesses in general practice: multicentre,
randomised controlled trial. BMJ, 320(7241), 1038-1043.
Taché, S., & Hill-Sakurai, L. (2010). Medical assistants: the invisible "glue" of primary health
care practices in the United States? Journal of Health Organization and Management, 24(3),
288-305.
Tang, N., Stein, J., Hsia, R. Y., Maselli, J. H., & Gonzales, R. (2010). Trends and characteristics
of US emergency department visits, 1997-2007. JAMA, 304(6), 664-670.
U.S. Bureau of Labor Statistics. (2012). Occupational employment statistics query system.
Retrieved March 2, 2012, from http://data.bls.gov/oes/

28
Ulmer, T., & Troxler, C. (2006). The economic cost of missed appointments and the open access
system. Gainesville, FL: University of Florida Area Health Education Centers Program.
Walsh, J. M. E., McDonald, K. M., Shojania, K. G., Sundaram, V., Nayak, S., Lewis, R., . . .
Goldstein, M. K. (2006). Quality improvement strategies for hypertension management: A
systematic review. Medical Care, 44(7), 646-657.
White, B. (1999). A part-time practice success story. Family Practice Management, 6(6), 22-24.

29
Appendix: Analysis of Queueing Models
Non-Markovian models
Under the deterministic service time assumption, Dual NP model becomes an M/D/c
model where c represents the number of servers. The readers may refer to Gross and Harris
(1985) for notations used in queueing theory. Here, because two NPs work in the model.
We can use generating function methods to analyze this system, and many existing queueing
analysis software (e.g., QtsPlus) are equipped with such methods (Gross & Harris, 1985).
For NP-MD model, if the NP service rate is the same as the MD service rate, then this
model is also an M/D/c model with and can be analyzed in the same way as above.
However, NP and MD typically have different service rates (Laurant et al., 2009). In this case,
the M/D/c queueing analysis does not work. We develop discrete-event simulation programs to
analyze such a queueing model. The readers may refer to Kelton and Law (2000) for more
detailed information on such techniques.
Markovian models
If service times follow exponential distributions, we can obtain closed-form formulas to
evaluate the productivity and cost-efficiency of an NP utilization model. These formulas can be
easily implemented in spreadsheet tools. To start, let and represent the average number of
patients that can be seen by an NP and an MD in a day, respectively.
Dual NP Model. This model becomes a classic M/M/c queueing model (Gross & Harris, 1985)
with c=2. For a fixed individual appointment request rate and panel size , we define
and . The system is stable only if . We use to represent the
average patient appointment delay and it can be shown to have the following form:
30
(
( ) )
where is the % of patients who sees an empty appointment schedule and is calculated as:
(
( ) )
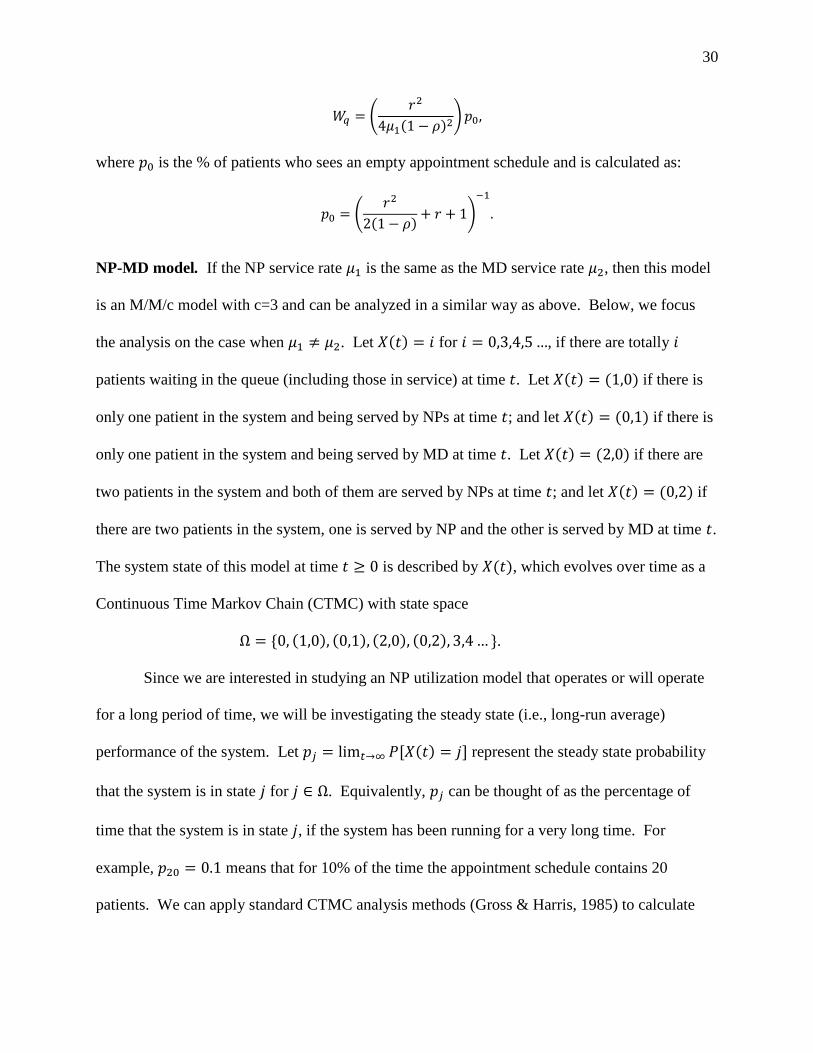
NP-MD model. If the NP service rate is the same as the MD service rate , then this model
is an M/M/c model with c=3 and can be analyzed in a similar way as above. Below, we focus
the analysis on the case when . Let ( ) for , if there are totally
patients waiting in the queue (including those in service) at time . Let ( ) ( ) if there is
only one patient in the system and being served by NPs at time ; and let ( ) ( ) if there is
only one patient in the system and being served by MD at time . Let ( ) ( ) if there are
two patients in the system and both of them are served by NPs at time ; and let ( ) ( ) if
there are two patients in the system, one is served by NP and the other is served by MD at time .
The system state of this model at time is described by ( ), which evolves over time as a
Continuous Time Markov Chain (CTMC) with state space
( ) ( ) ( ) ( ) .
Since we are interested in studying an NP utilization model that operates or will operate
for a long period of time, we will be investigating the steady state (i.e., long-run average)
performance of the system. Let ( ) represent the steady state probability
that the system is in state for . Equivalently, can be thought of as the percentage of
time that the system is in state , if the system has been running for a very long time. For
example, means that for 10% of the time the appointment schedule contains 20
patients. We can apply standard CTMC analysis methods (Gross & Harris, 1985) to calculate

31
’s by solving the following balance equations for ( ) . To simplify notation, we let
(the total appointment demand rate).
,
( ) ,
( )
( )
( )
( )
Solving the above linear equation system yields that ( ) , ,
, , ( ) ( ) and for , where
( )( )
( )
We can substitute as a function of into the normalization condition that ∑ to
calculate the value of , and eventually solve all values of ’s. Let represent the long-run
average number of patients registered in the appointment schedule yet to be seen by the
providers. It then follows from Little’s Law (Gross & Harris, 1985) that
∑ ( )
( )

32
We now have closed-form formulas to evaluate patient average appointment delay
given the demand rate in both Dual NP Model and NP-MD Model, for the Markovian
cases. Then we can back calculate the productivity, i.e., the largest panel size under which
patient average appointment delay is not exceeding a given threshold. The cost-efficiency is
simply the average staffing cost with respect to the panel size .
Recommended