F
3 4q5b 0314825 2
b
d
~~ --__- .... . ~ ~ ~ .......
ORNL/ TM-1153 1
CONCEPT FOR
A NEUTRON SPECTROMETER BASED ON OPTICAL DETECTION
OF 3He(n,p)3H REACTIONS IN A GAS
J. E. Turner*, R. N. Hamm*, T. E. Huston**, H. A. Wright*$ W. A. Gibsont, and G. S. Hurst*t
*Health and Safety Research Division, Oak Ridge National Laboratory, P. 0. Box 2008,Oak Ridge, TN 37830-6123
**Summer participant in Nuclear Energy Research Associates Program sponsored by Oak Ridge Associated Universities.
'Pellissippi International, Inc., 10521 Research Drive, Knoxville, TN 37932
*]Present address: Consultec Scientific, Inc., Pellissippi Center, Suite 110, 725 Pellissippi Parkway, Knoxville, T N 37932-3300
Date Published -June 1990
Prepared €or the Office of Health and Environmental Research
Budget Activity No. KP 01 01 00 0
Prepared by the OAK RJDGE NATIONAL LABORATORY
Oak Ridge, Tennessee 37831 operated by
MARTIN MARIETTA ENERGY SYSTEMS, INC. for the
U.S. DEPARTMENT OF ENERGY under contract DE-A CO 5-84 0 R2 1400
3 Y45h 0334825 2


... 111
TABLE O F CONTENTS
Abstract . . . . . . . . . . . . . . . . . . . . . . . . . . . . . . . . . . . . . . . . . . . . . . . . . . . . . . . . . . 1
1 . Introduction . . . . . . . . . . . . . . . . . . . . . . . . . . . . . . . . . . . . . . . . . . . . . . . . . . . . . 2
2 . Optical Detector for Charged-Particle Tracks in a Gas . . . . . . . . . . . . . . . . . . . . . 2
3 . Neutron Spectrometry Based on Observation of 3He(n, p)3H Reactions . . . . . . . . . . . 3
4 . Thermal-Neutron Monitoring . . . . . . . . . . . . . . . . . . . . . . . . . . . . . . . . . . . . . . . . 5
5.Summary . . . . . . . . . . . . . . . . . . . . . . . . . . . . . . . . . . . . . . . . . . . . . . . . . . . . . . . 6
Appendix . . . . . . . . . . . . . . . . . . . . . . . . . . . . . . . . . . . . . . . . . . . . . . . . . . . . . . . . 6
References . . . . . . . . . . . . . . . . . . . . . . . . . . . . . . . . . . . . . . . . . . . . . . . . . . . . . . . . 14
Figure Captions . . . . . . . . . . . . . . . . . . . . . . . . . . . . . . . . . . . . . . . . . . . . . . . . . . . . 15
Figuresl-11 . . . . . . . . . . . . . . . . . . . . . . . . . . . . . . . . . . . . . . . . . . . . . . . . . . . . . . 17
Distribution List . . . . . . . . . . . . . . . . . . . . . . . . . . . . . . . . . . . . . . . . . . . . . . . . . . . 28

1
Concept for a Neutron Spectrometer Based on Optical Detection of 3He(n,p)sH Reactions in a Gas
J. E. Turner, R. N. Hamm, T. E. Huston, H. A. Wright, W. A. Gibson, and G. S. Hurst
Abstract. The conceptual framework is described for a new type of neutron spectrometer,
based on the recently demonstrated principle of optical detection of charged-particle tracks
in a gas. Whereas the elastic scattering of a neutron gives rise to the single track of a
charged recoil particle, the reaction 3He(n,p)3H produces an event in which two tracks
(those of the proton and triton) diverge from a common vertex at the capture site. The
optical detection method, which allows direct visualization of tracks, could be used to
distinguish between one- or two-pronged events. The measured total light output from an
absorption event would be proportional to T, + Tt, the sum of the initial kinetic energies
of the proton and triton. Independently of its incident direction, the energy of the
absorbed neutron would be given by T = T, + Tt - Q, where Q = 765 keV is the energy
released by the reaction.

2
INTRODUCTION
For the past several years we have been exploring ways to measure the numbers of
subexcitation electrons produced along the track of a charged particle in various volume
elements that span an ionization chamber. If the charged particle is a recoil nucleus
produced by a neutron interaction, then important dosimetric information, such as energy
deposited and linear energy transfer (LET) can be inferred from this information (172) .
Hunter has proposed an optical device for making such meas~rements(~) . The principle of
operation, which has recently been successfully d e m o n ~ t r a t e d ( ~ > ~ ) , is summarized in the
next section. In this paper, we show how such a device, incorporating 3He in the chamber
gas, can be used as a simple, directionally-independent neutron spectrometer.
OPTICAL DETECTOR FOR CHARGED-PARTICLE TRACKS IN A GAS
A charged particle produces a number of electrons along its path in a gas. These
electrons are degraded almost immediately to subexcitation energies, below the threshold
for electronic transitions in the gas. In the optical-detection the appearance
of a charged particle triggers an externally applied, highly damped RF field ( ~ 2 0 kV and 10
MHz). Before appreciable diffusion occurs, the subexcitation electrons oscillate in response
to the field, producing additional local ionizations and excitations of the gas molecules.
The net response of the device is the copious emission of photons in all directions from the
immediate positions of the individual subexcitation electrons in the particle track, Suitable
collection and imaging of the light (e.g., by using two digital vidicon cameras to scan the
chamber in perpendicular directions), permits reconstruction of track details for physical
analysis.
The detailed design parameters for several gases and chamber components are
presented in Ref. (3). We have constructed a preliminary device and demonstrated the
3
proof of principle by photographing tracks of alpha particles emitted from a radioactive
source (4,5)s The pictures were made with a chamber containing a mixture of Ar with
several percent Xe at a total pressure of 58 kPa (500 torr).
NEUTRON SPECTROMETRY BASED ON OBSERVATION OF 3He(n,p)3H
REACTIONS
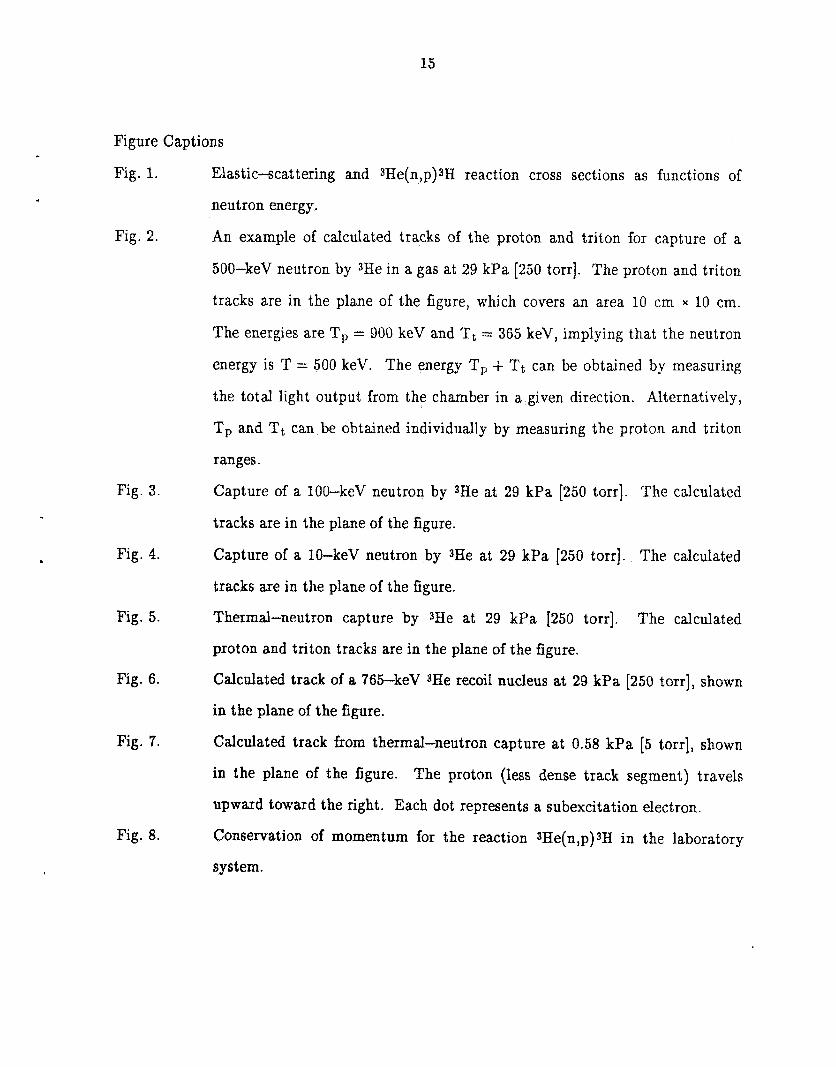
The cross sections for neutron interactions with We are shown in Fig. 1. For
neutron energies below about 100 keV, the elasticscattering cross section is smaller than
that for the (n,p) reaction. In the MeV range, elastic scattering is more probable. There
is, in addition, a small probability (a few percent of the total cross section) that neutron
absorption will produce two deuterons, the threshold energy being 4.36 MeV. This reaction
will be neglected.
Elastic scattering of a neutron by 3He in a gas chamber produces a straight-line
track of ionizations from the recoil nucleus. In contrast, the (n,p) reaction following
neutron absorption produces the two straight tracks of the proton and triton, which emerge
from a common vertex at the capture site. Visualization of the tracks in an optical
detector exposed to neutrons will enable one to distinguish between the single-pronged
elastic-scattering events and the two-pronged absorption events. In the latter case, if the
initial kinetic energies of the proton and triton are denoted by T, and Tt, then the energy
of the absorbed neutron is given by T = T, + Tt - Q, where Q = 765 keV is the energy
released by the reaction.
As seen below, with moderate chamber size and gas pressure, most tracks can be
contained completely in a gas. The amount of light emitted following an absorption event
is then proportional to the number of electrons in the proton and triton tracks(3). Thus
the amount of light emitted in a given solid angle is proportiond to T, + Tt; its
4
measurement, therefore, gives the value of T, the energy of the absorbed neutron.
Alternatively, the energies T, and Tt can also be inferred individually from the observed
ranges of the particles in the gas in order to obtain T. (Commonly encountered I1wall
effects" that occur in conventional proportional counters can be handled in the optical
chamber by rejection of events that are seen to involve tracks that intersect a wall.)
As an example, Fig. 2 shows the calculated tracks of the proton and triton following
capture of a 500-keV neutron by 3He at 29 kPa [250 torr]. (Further study is needed to
determine the range of optimum mixtures of He with other gases for the optical chamber.
For the present computations we used an available Monte Carlo transport code that we
developed earlier(') for particle transport in methane.) In this example, the proton and
triton separate in the plane of the figure at an angle Q! = 139' with energies T, = 900 keV
and Tt = 365 keV, their sum implying that T = T, + Tt - Q = 900 + 365 - 765 = 500
keV. The ranges of the proton and triton are, respectively, 1.7 x lO-3g cm-2 and
3.8 x 10⁻⁴ g cm-2, or 7.4 cm and 1.6 cm in the gas at 29 kPa [250 torr]. Such a
two-pronged event would be distinguished in the optical chamber from the single-pronged
elastic scattering events.
As shown by the kinematic analysis for neutron reactions given in the Appendix, a
range of values of the separation angle Q is possible from 180' down to a minimum that
depends on the neutron energy T. As the neutron energy decreases, the minimum value of
a increases, approaching 180'. Thus, with decreasing neutron energy, the vertex becomes
generally less and less discernible. In addition, the prongs become generally shorter.
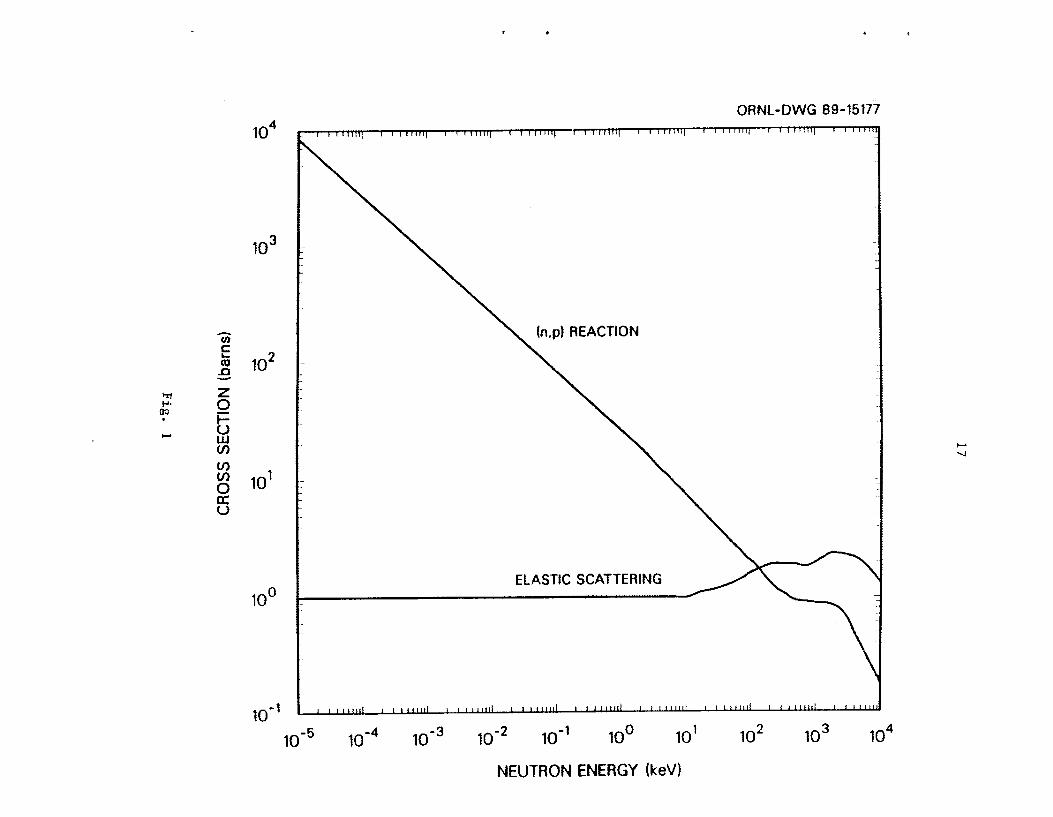
Figures 3 and 4 show examples for capture of a 100-keV and a 10-beV neutron at 250 torr.
Again, the tracks are in the plane of the figures. In Fig. 4, the vertex is just visible. At
the low-energy extreme is capture of a thermal neutron. The proton and triton then come

5
off "back to back," with the unique energies, T, = 574 keV and Tt = 191 keV, and
cy = 180'. The appearance of the capture event for a thermal neutron is shown in Fig. 5.
These figures illustrate how the appearance of the two-pronged capture event
approaches that of a single-prong, as would also result from the elastic scattering of a
neutron. For a neutron of energy T, elastic scattering from 3He produces a continuum of
recoil energies from zero to 3T/4. Since thermal capture releases 765 keV, all events with
light emission below this value are the result of elastic scattering and can be ignored.
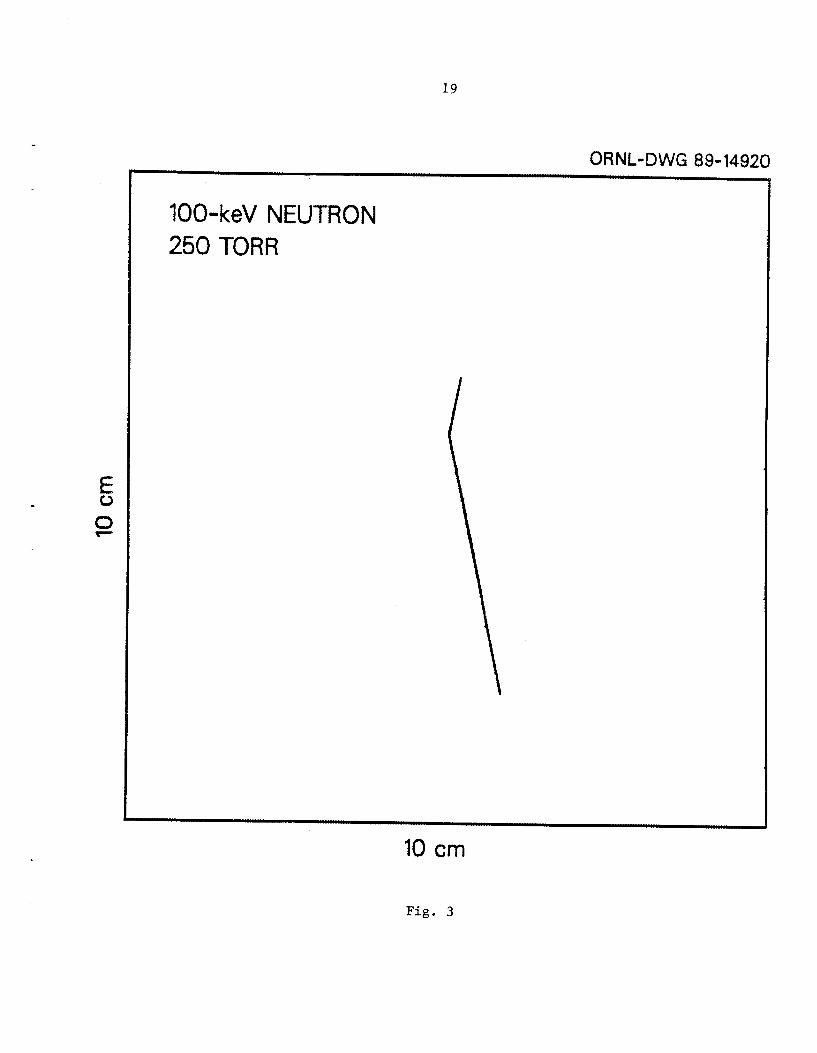
Moreover, the track of a 765-keV 3He recoil nucleus, shown in Fig. 6, is quite different in
appearance from Fig. 5, although the same amount of light is emitted. The doubly charged
3He nucleus is much more densely ionizing than the singly charged proton and triton.
The tracks in Figs. 2-6 are shown to their best advantage, as it were, in the plane of
the figure. Viewed at 90' with respect to this plane, two prongs would appear along the
same straight line and could overlap. In order to distinguish clearly between one- and
two-pronged cases, each event should be simultaneously observed from at least two
mutually perpendicular directions.
THERMAL-NEUTRON MONITORING
In some applications, only thermal neutrons are present; and one needs to measure
only their fluence or fluence rate, The track produced from capture of a thermal neutron
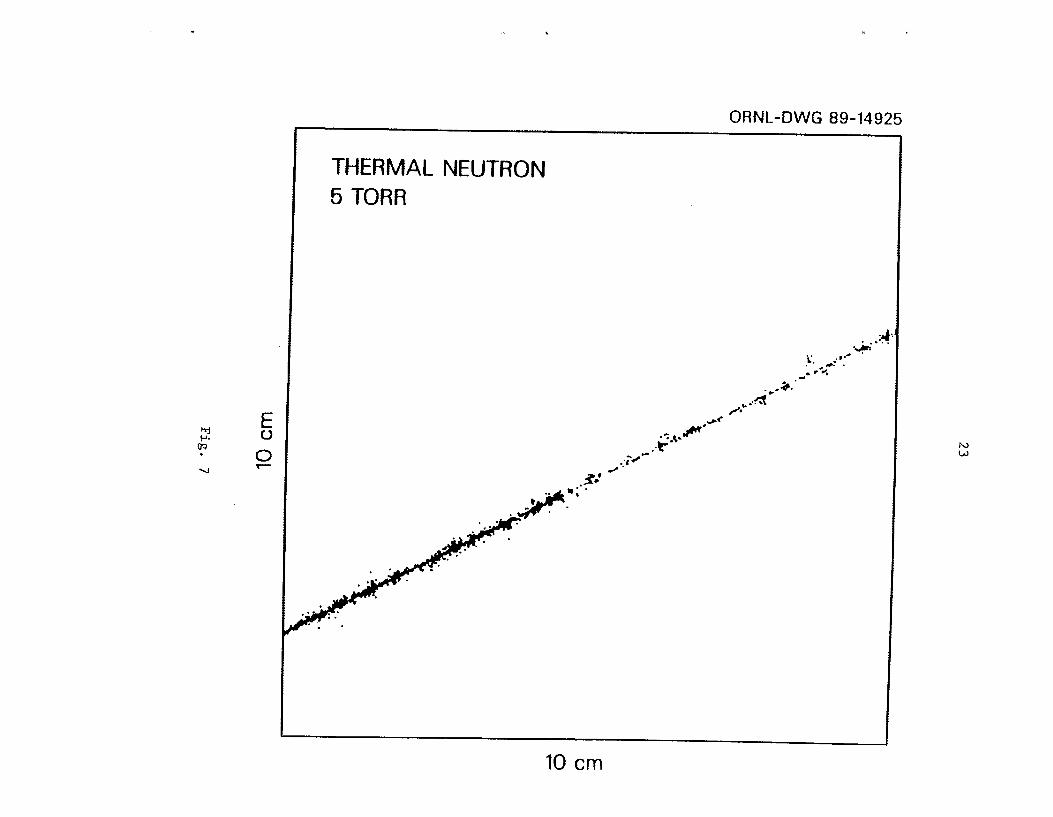
by 3He has a unique feature not found in a recoil track produced by elastic scattering.
Although the former is also a straight line, it is composed of two segments of different LET
that originate from the capture site. This structure can be seen clearly under high
resolution, such as that illustrated in Fig. 7, where the pressure is 0.58 kPa [5 torr]. Each
dot in the figure represents a subexcitation electron. (In principle, high-resolution digital
cameras could also be used with the chamber.) The capture site is near the center of the

6
figure. The less-dense track of the proton is seen on the right and the more dense track of
the triton on the left. For monitoring thermal neutrons with this detector, it is not
necessary for the track to be wholly contained in the gas. A straight track with two
different LET segments can be differentiated from any elastic recoil track that crosses the
chamber ~
SUMMARY
Figures 2-6 indicate that the unique signature of the 3He(n,p)3H reaction should
permit useful measurements of neutron energies over the range from thermal to ~ 2 0 MeV
by optical means. Since the reaction releases 765 keV, a discriminator setting at this level
could eliminate a large fraction of the uninteresting elastic-cattering events from analysis.
Above that level, the above figures indicate that elastic-scattering events differ markedly
in visual appearance from the reactions. The energy resolution would be poorest, of course,
for low-energy neutrons. For absorption of a 10-keV neutron, the energy released relative
to that for thermal-neutron capture is only 7751765 = 1.013. Above 10 keV, this factor
becomes more favorable; the total track length of the proton and triton increases and the
two-pronged character of the event becomes more marked (cf. Figs. 3 and 4).
For monitoring slow or thermal neutrons alone, the observation of a track having
two distinct LET components, as shown in Fig. 7, should suffice.
APPENDIX
Kinematics of 3He(n,p)3H Reaction
Figure 1 gives directly the probabilities for the occurrence of a one- or two-pronged
event in 3He gas exposed to a neutron of given energy T. In addition, it is of interest to
know the probability distributions for proton and triton energies as well as the angles
7
giving their directions of travel. In this section we give some kinematic details about the
reaction under the assumption that the proton and neutron are emitted isotropically in
their center-of-mass coordinate system.
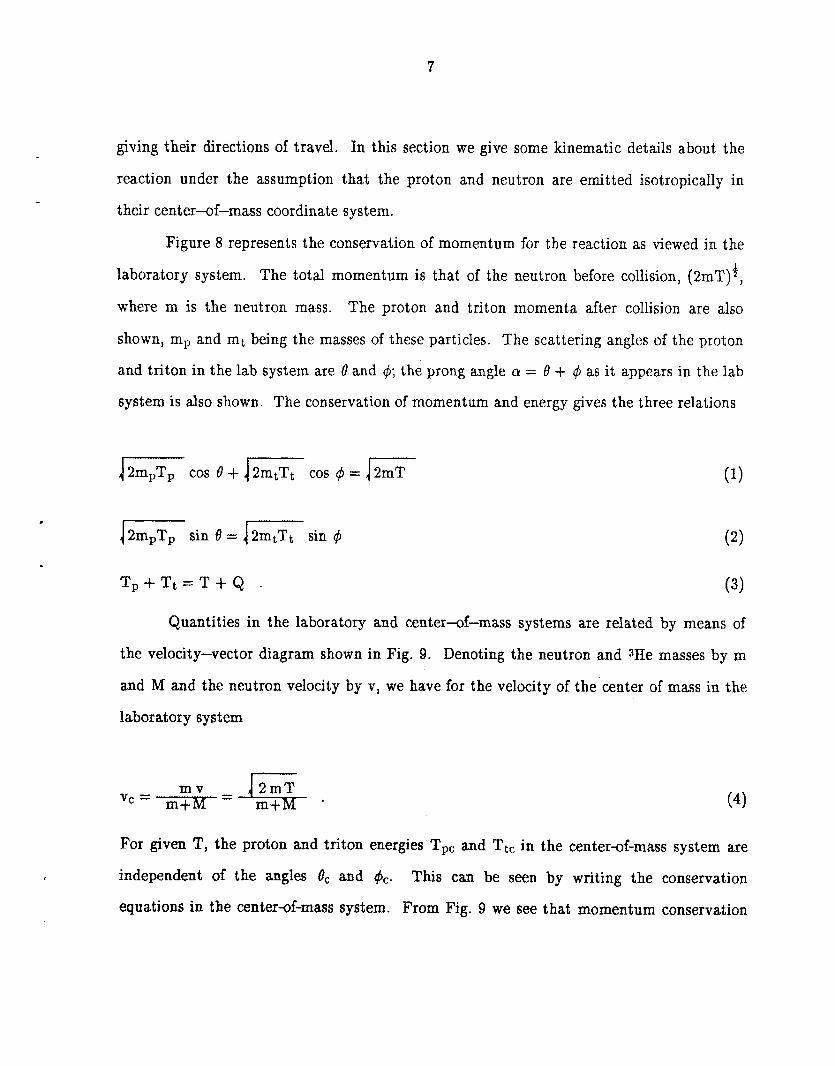
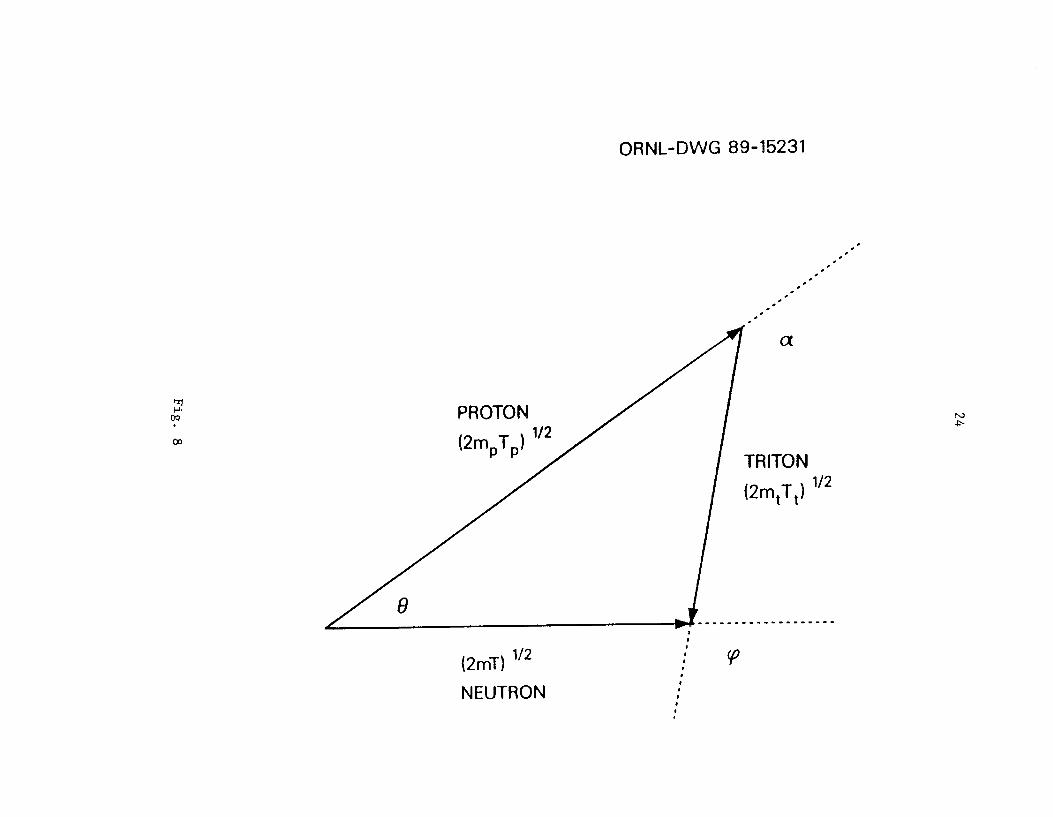
Figure 8 represents the conservation of momentum for the reaction as viewed in the
laboratory system. The total momentum is that of the neutron before collision, (2mT)2,
where m is the neutron mass. The proton and triton momenta after collision are also
shown, mp and mt being the masses of these particles. The scattering angles of the proton
and triton in the lab system are 6 and 4; the prong angle Q = 0 + $I as it appears in the lab
system is also shown. The conservation of momentum and energy gives the three relations
L
12m,T,- cos 0 + cos f$ = /= T , + T t = ~ + ~
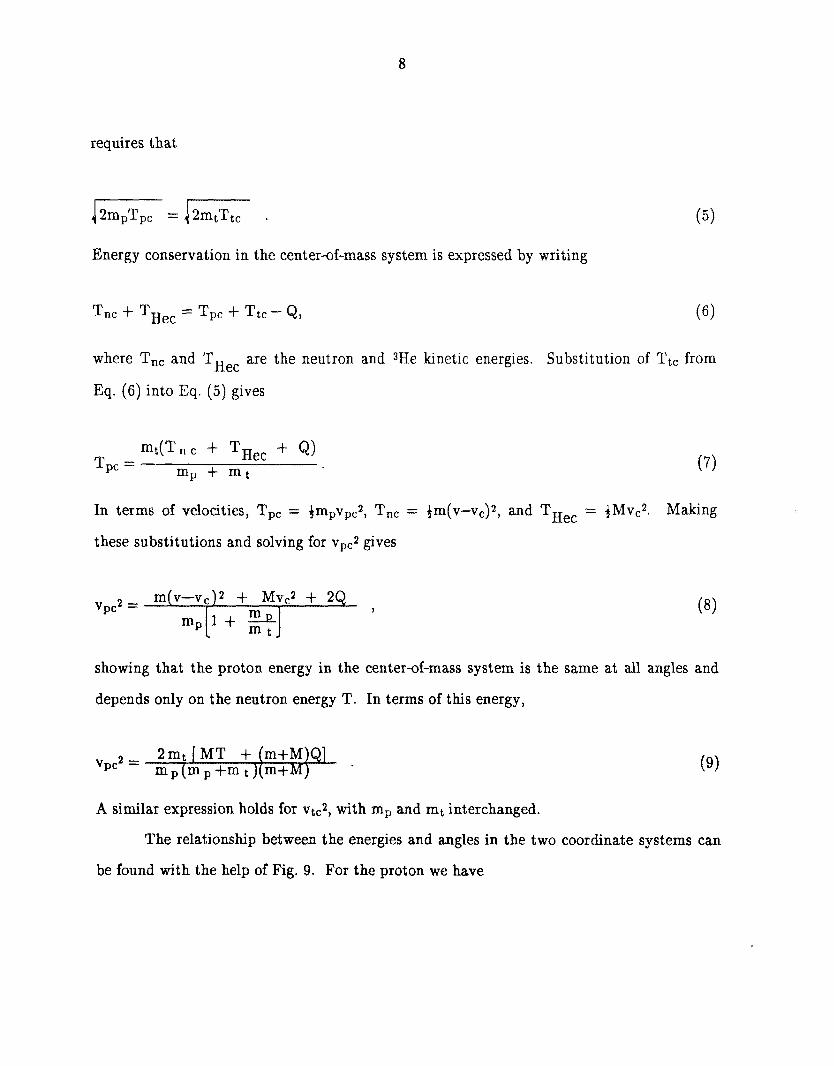
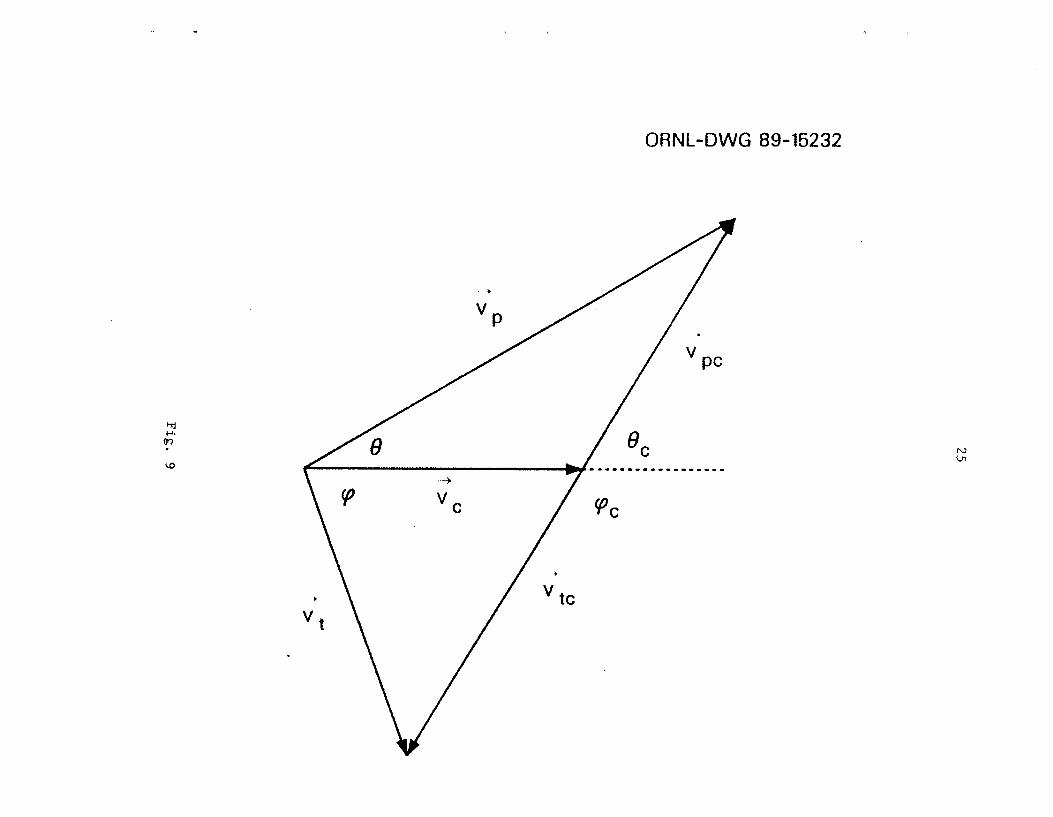
Quantities in the laboratory and center-of-mass systems are related by means of
the velocity-vector diagram shown in Fig. 9. Denoting the neutron and 3He masses by m
and M and the neutron velocity by v, we have for the velocity of the center of mass in the
labor ator y system
For given T, the proton and triton energies Tpc aad Tt, in the center-of-mass system are
independent of the angles OC and &. This can be seen by writing the conservation
equations in the center-of-mass system. From Fig. 9 we see that momentum conservation
8
requires that
Energy conservation in the center-of-mass system is expressed by writing
where T n c and THec are the neutron and 3He kinetic energies. Substitution of Ttc from
Eq. (6) into Eq. (5) gives
mt(Tnc + TBec + Q) mp + m t Tpc =
In terms of velocities, T,, = +mpvpc2, T n c = +m(v-vc)2, and THec = +Mvc2.
these substitutions and solving for vpc2 gives
Making
vpc2 =
showing that the proton energy in the center-of-mass system is the same at all angles and
depends only an the neutron energy T. In terms of this energy,
2mt [ MT i- (m+M)Q] m (m +m t )(m+M)
vpc2 = (9)
A similar expression holds for vtc2, with rnp and mt interchanged.
The relationship between the energies and angles in the two coordinate systems can
be found with the help of Fig. 9. For the proton we have
9
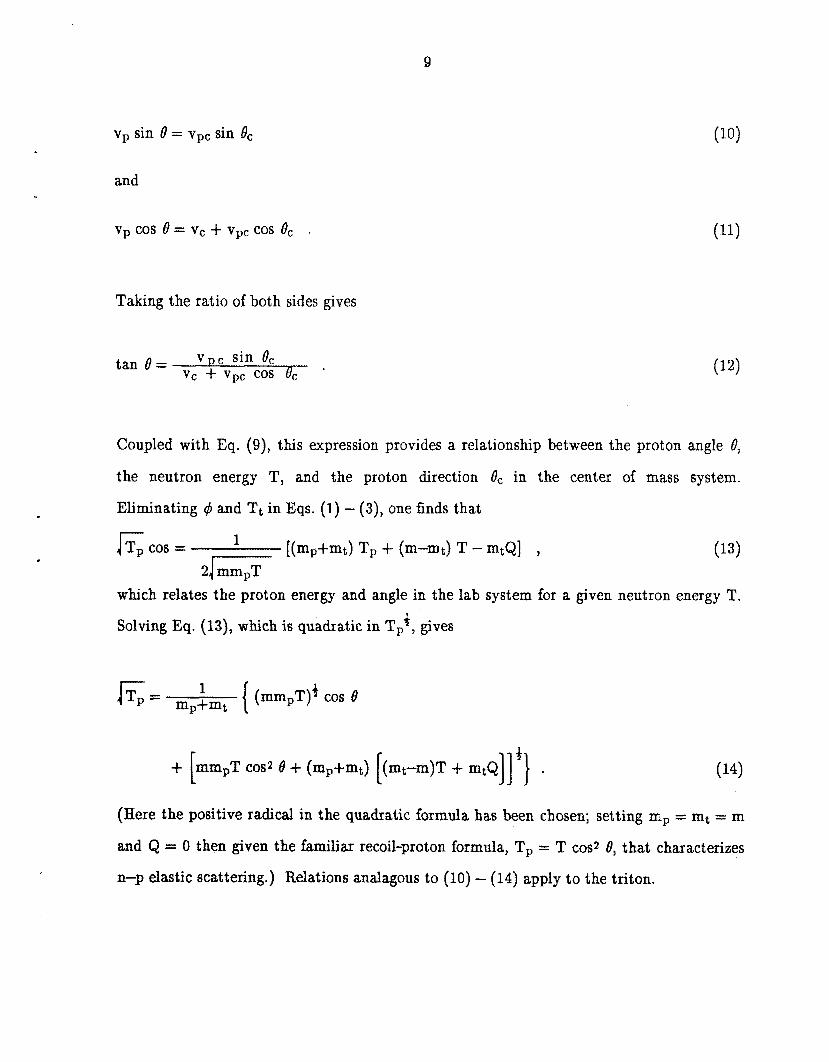
v, sin 0 = vpc sin BC
and
vp COS o = vc + vpc cos ec .
Taking the ratio of both sides gives
v p c sin 8, tan 9 = vc + vpc cos 0,
Coupled with Eq. (9), this expression provides a relationship between the proton angle 8,
the neutron energy T, and the proton direction 0, in the center of mass system.
Eliminating 4 and Tt in Eqs. (1) - (3), one finds that
[(mp+mt) T p + (m-mt) T -mtQ] 1 T COS =
2 J Z L
Solving Eq. (13), which is quadratic in T, 3 , gives
which relates the proton energy and angle in the lab system for a given neutron energy T.
{ (mmpT) 3 cos 8 EC== m,+mt
mm,T cos2 8 + (mp+mt) [(mt-m)T + m
(Here the positive radical in the quadratic formula has been chosen; setting mp = mt = m
and Q = 0 then given the familiiar recoil-proton formula, T, = T cos2 0, that characterizes
n-p elastic scattering.) Relations analagous to (10) - (14) apply to the triton.
10
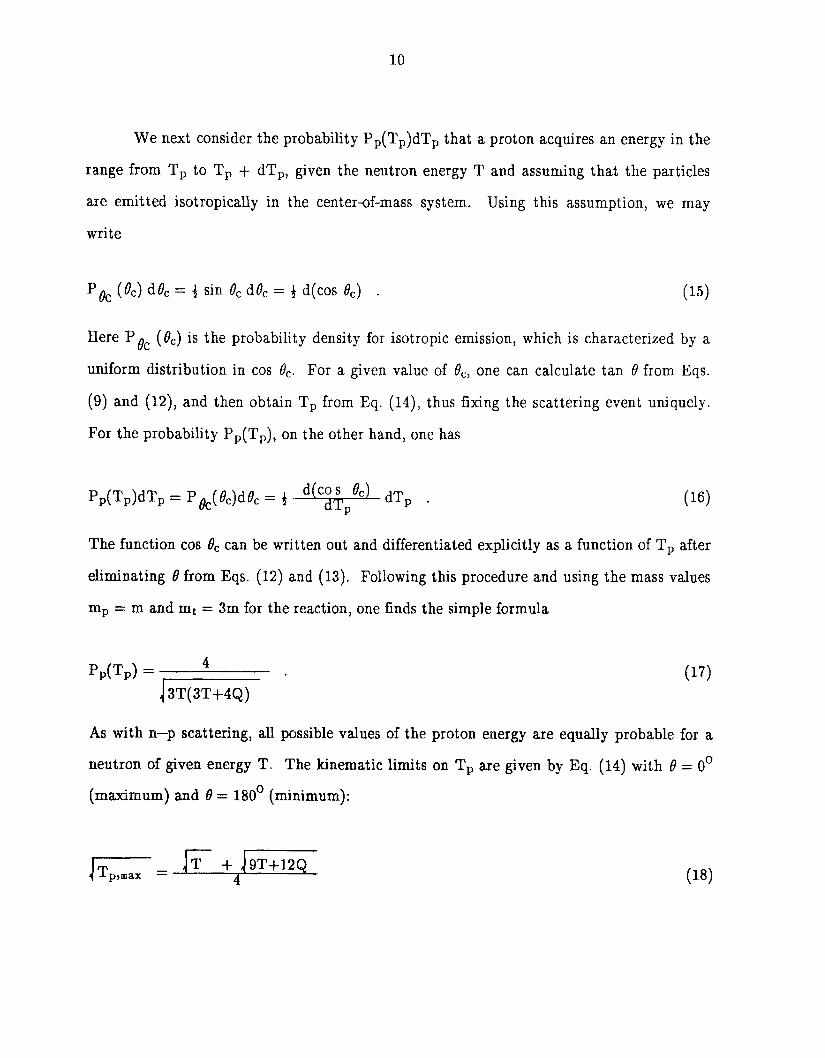
We next consider the probability P,(T,)dT, that a proton acquires an energy in the
range from T, to T, + dT,, given the neutron energy T and assuming that the particles
are emitted isotropically in the center+f-mass system. Using this assumption, we may
write
P oc (8,) d8, = 3 sin 0, d8, = 3 d(cos 8,) . (15)
Here Pec (8,) is the probability density for isotropic emission, which is characterized by a
uniform distribution in cos 8,. For a given value of Oc, one can calculate tan 0 from Eqs.
(9) and (12), and then obtain T, from Eq. (14), thus fixing the scattering event uniquely.
For the probability Pp(Tp), on the other hand, one has
The function cos 8, can be written out and differentiated explicitly as a function of T, after
eliminating t9 from Eqs. (12) and (13). Following this procedure and using the mass values
mp = m and mt = 3m for the reaction, one finds the simple formula
4 PP(TP) =
As with n-p scattering, all possible values of the proton energy are equally probable for a
neutron of given energy T. The kinematic limits on Tp are given by Eq. (14) with 8 = 0'
(maximum) and 0 = 180' (minimum):

11
and
The function (17) is normalized when integrated between these limits. Similar relations
can be found for the triton.
Whereas T, can be inferred either from the light output by the proton track or from
the range of the proton in the optical chamber, the angle 0 cannot be measured, since the
direction of travel of the neutron is unknown. The angle observed is that between the
proton and triton tracks, a = B + 4. Given Pp(Tp), we can obtain the probability
distribution in a, Pa(.), by writing
where it is implied that Pp(Tp) and T, must first be obtained explicitly as functions of a.
Since P, (Tp) does not depend on a! [Eq. (17)], we need only to find T, as a function of a.
Using Eq. (13) for 0 and its analogue for 4 and substituting values for the masses, we have
4TD - 2T - 3Q cos i?=
and
4Tt - & cos (6 = r
These expressions yield
12
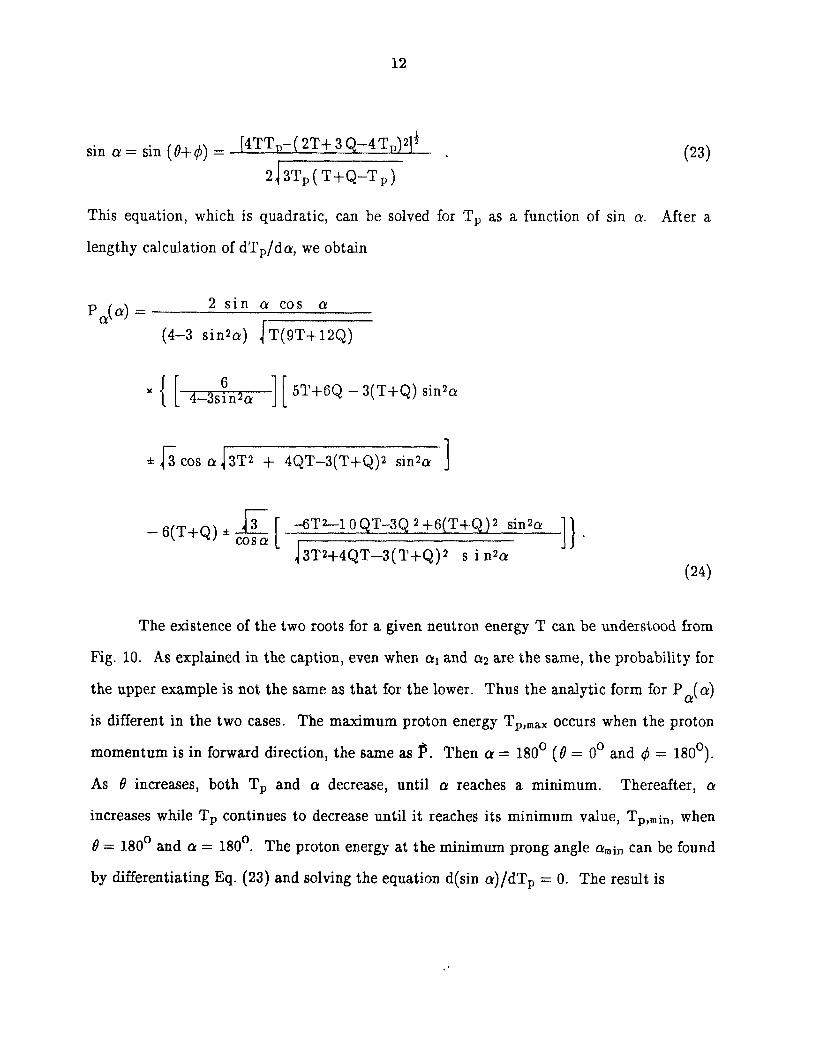
4TTI1- ( 2T+ 3 Q-4 T,)'] 3 sin a = sin ( o + ~ I =
\ 8 ,
2/3Tp( T+Q-T,)
This equation, which is quadratic, can be solved
lengthy calculation of dTp/da, we obtain
2 s i n IY cos (Y P&Q) =
(4-3 sin2cr) /T(ST+12Q)
ir T, as a function of sin a. A
] [ 5T+6Q - 3(T+Q) sin2ct x { [ 4-3sinza
* cos Q 13T2 + 4QT-3(T+Q)2 s i n k 1 4 T 2 - 1 OQT-3Q 2+6(T+Q)
-6(T+Q) * & [ 4 3T2+4$T--3( T+Q)2 s i n2a
(23)
ter a
(24)
The existence of the two roots for a given neutron energy T can be understood from
Fig. 10. As explained in the caption, even when a1 and or2 are the same, the probability for
the upper example is not the same as that for the lower. Thus the analytic form for Pa(.>
is different in the two cases. The maximum proton energy Tp,max occurs when the proton
momentum is in forward direction, the same as P. Then a = 180' (8 = 0' and 4 = 180').
As 0 increases, both T, and a decrease, until Q reaches a minimum. Thereafter, Q
increases while Tp continues to decrease until it reaches its minimum value, Tp,min, when
0 = 180* and Q = 180'. The proton energy at the minimum prong angle Q m i n can be found
by differentiating Eq. (23) and solving the equation d(sin a)/dTp = 0. The result is
13
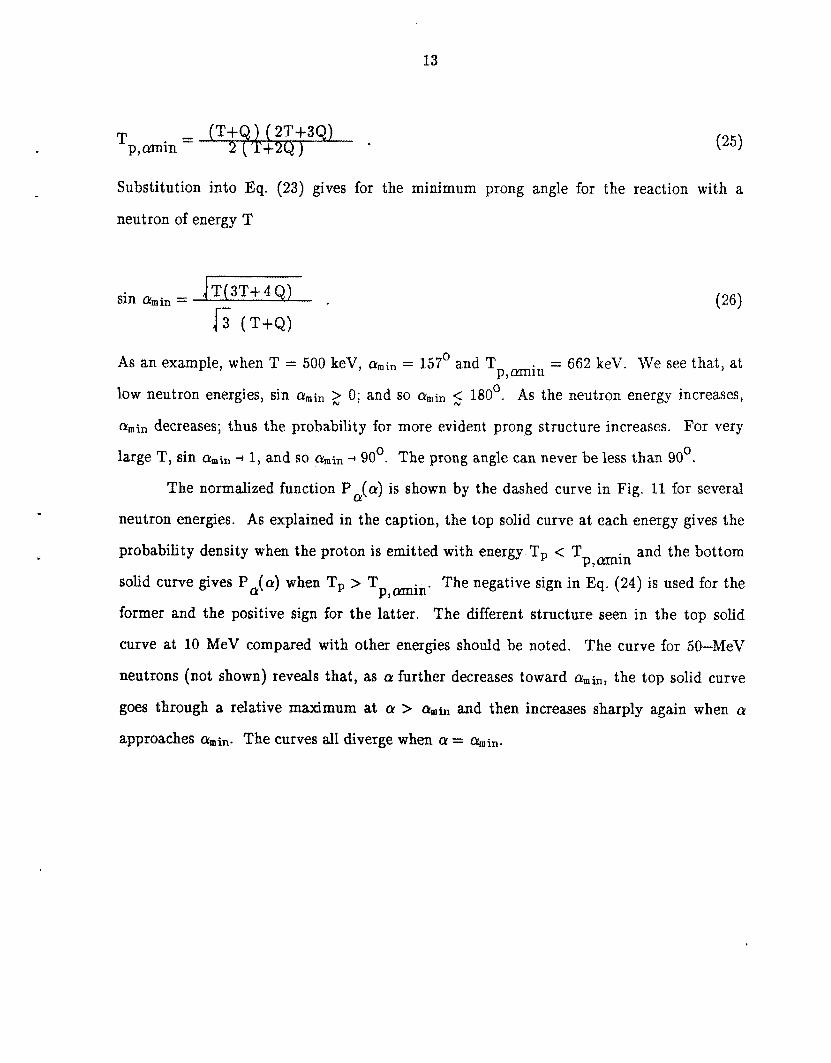
- - (T+Q) ( 2Tf3Q) p , m i n 2 T+2Q 1 T
Substitution into Eq. (23) gives for the minimum prong angle for the reaction with a
neutron of energy T
- 662 keV. We see that, at As an example, when T = 500 keV, amin = 157' and T
low neutron energies, sin amin 2 0; and so amin 5 180 . As the neutron energy increases,
amin decreases; thus the probability for more evident prong structure increases. For very
large T, sin amin 4 1, and so amin 4 90'. The prong angle can never be less than 90'.
p,mnin - 0
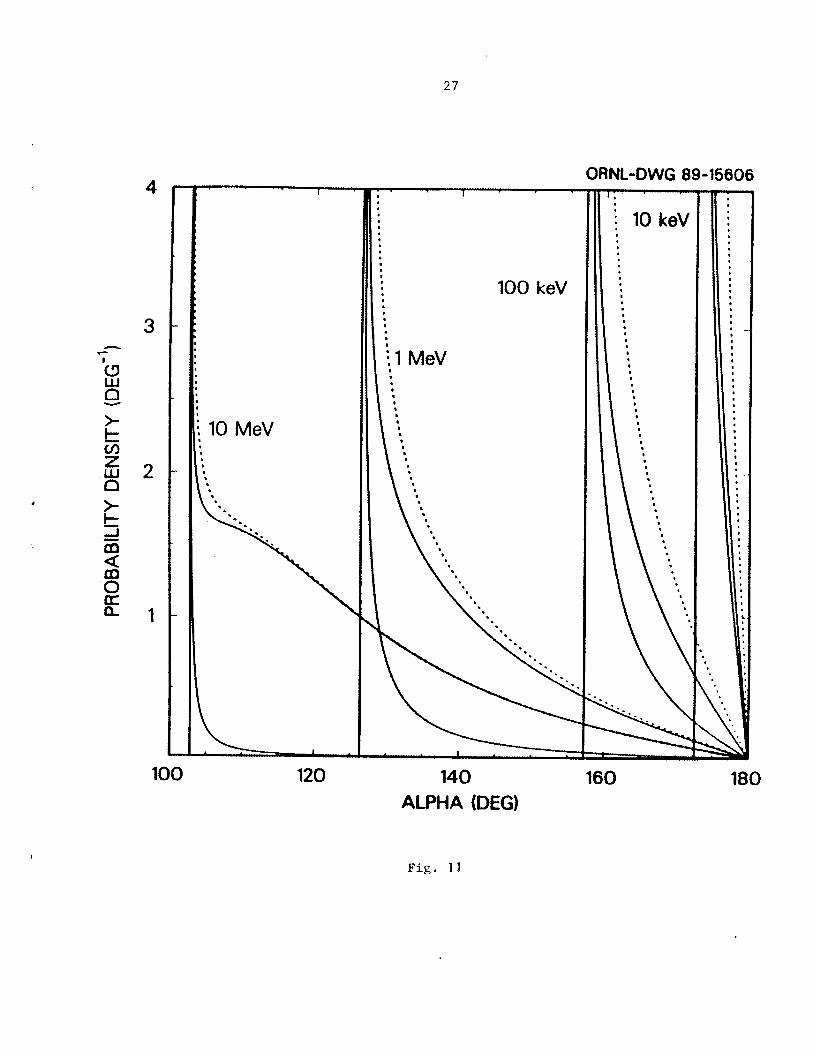
The normalized function Pa(,) is shown by the dashed curve in Fig. 11 for several
neutron energies. As explained in the caption, the top solid curve at each energy gives the
probability density when the proton is emitted with energy T, 4 Tp,mnin and the bottom
solid curve gives Pa(.) when T, > Tp,mnin. The negative sign in Eq. (24) is used for the
former and the positive sign for the latter. The different structure seen in the top solid
curve at 10 MeV compared with other energies should be noted. The curve for 50-MeV
neutrons (not shown) reveals that, as a further decreases toward amb, the top solid curve
goes through a relative maximum at Q > amin and then increases sharply again when cy
approaches amin. The curves all diverge when (I! = amin.

14
REFERENCES
1.
2.
3.
4.
5.
Turner, J. E., Hamm, R. N., Hurst, G. S., Wright, H. A., and Chiles, M. M. Digital
Characterization of Particle Tracks for Microdosimetry. Radiat. Prot. Dosim. 13
4 5 4 8 (1985).
Bolch, W. E., Turner, J. E., Hamm, R. N., Wright, H. A., and Hurst, G. S. A
Method of Obtaining Neutron Dose and Dose Equivalent from Digital Measurements
and Analysis of RecoiGParticle Tracks. Health Phys. 53 241-253 (1987).
Hunter, S. R.
Nucl. Instr. and Meth. A260 469477 (1987).
Turner, J. E., Hunter, S. R., Hamm, R. N., Wright, H. A . , Hurst, G. S., and
Gibson, W. A. Digztal Characterization of Recoil Charged-Particle Tracks for
Neutron Measurements. Nucl. Instr. and Meth. B40/41 1219-1223 (1989).
Turner, J. E., Hunter, S. R., Hamm, R. N., Wright, H. A., Hurst, G. S., and
Gibson, W. A. Radiat.
Prot. Dosim. 29 9-14 (1989).
Evaluation of a Digital Optical Ionizing Radiation Particle Track.
Development of an Optical Digital Ionization Chamber.
15
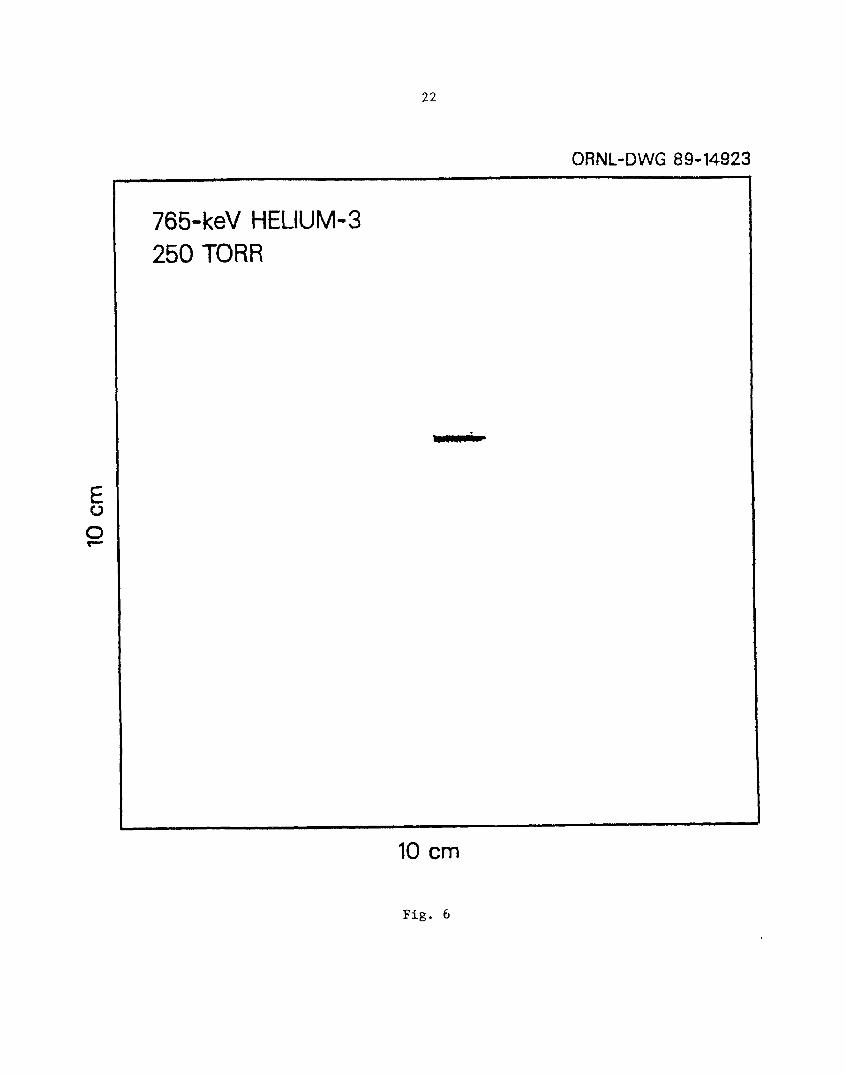
Fig. 3.
Fig. 4.
Fig. 5 .
Fig. 6.
Fig. 7.
Figure Captions
Fig. 1. Elastic-scat tering and 3He(n,p)3H reaction cross sections as functions of
neutron energy.
An example of calculated tracks of the proton and triton for capture of a
500-keV neutron by 3He in a gas at 29 kPa [250 torr]. The proton and triton
tracks are in the plane of the figure, which covers an area 10 cm x 10 crn.
The energies are T, = 900 keV and Tt = 365 keV, implying that the neutron
energy is T = 500 keV. The energy T, + Tt can be obtained by measuring
the total light output from the chamber in a given direction. Alternatively,
T, and Tt can be obtained individually by measuring the proton and triton
ranges.
Capture of a 100-keV neutron by 3He at 29 kPa [250 torr]. The calculated
tracks are in the plane of the figure.
Capture of a IO-keV neutron by 3Ee at 29 kPa [250 torr]. The calculated
tracks are in the plane of the figure.
Thermal-neutron capture by 3He at 29 kPa I250 torr].
proton and triton tracks are in the plane of the figure.
Calculated track of a 765-keV 3He recoil nucleus at 29 kPa [250 torr], shown
in the plane of the figure.
Calculated track from thermal-neutron capture a t 0.58 kPa [5 torr], shown
in the plane of the figure. The proton (less dense track segment) travels
upward toward the right. Each dot represents a subexcitation electron.
Conservation of momentum for the reaction 3He(n,p)3H in the laboratory
system.
Fig. 2.
The calculated
Fig. 8.

16
Fig. 9. Relationship of the proton and triton velocities f, and 2, and scattering
angles 8 and 4 in the laboratory and in the center-of-mass coordinate
systems. Here Gc is the velocity of the center of mass in the lab system, G,,
and Gt, are the velocities of the proton and triton in the center-of-mass
system, and 8, and 4, give the directions of the proton and triton in the
center-of-mass system.
Fig. 10. Two ways of conserving momentum for an incident neutron of given
momentum P. In the upper example, T, > Tp,mnin, . in the lower, T, <
In either case, P = PPI + = P,z + Pt2, where P P I and P,, are p , m i n ' T
the proton momenta and P t , and P t z are the triton momenta. When
a = a1 = az, the probability densities for the two examples are different,
even though the prong angle is the same.
Probability density Pa(a) as a function of the prong angle Q for neutron
energies of 10 MeV, 1 MeV, 100 keV, and 10 keV. The top solid curve for
each neutron energy gives PQ(a) when, as in the lower example in Fig. 10,
the proton is emitted with T, < Tp,olmin. The bottom solid curve gives
Pa(,> when the proton is emitted with T, > Tp,crmin (upper example in
F'lg. 10). The sum of the two curves at each neutron energy is the dotted
curve, which is normalized to unit area.
Fig. 11.
17
m 0
c
N 0
- 0 0
.-
t 0
c
0 0
v
N 0
c
c
0
F
0 0 .-
L-
1 0
.-
7 0
F
f;] 0
7
P 0
t-
Y 0
c
Fig. 1

18
0 R N L- D WG 89-14919
500-keV NEUTRON 250 TORR
10 cm
Fig. 2
19
ORNL-DWG 89-14920
100-keV NEUTRON 250 TORR
10 cm
Fig. 3

20
ORNL-DWG 89-14921
10-keV NEUTRON 250 TORR
10 cm
Fig. 4

21
E 0 0
ORNL-DWG 89-14922 1
THERMAL NEUTRON 250 TORR
10 cm
Fig. 5
22
ORNL-DWG 89-14923
765-keV HELIUM-3 250 TORR
10 cm
Fig. 6
23
T
E 0
0
F
24
.
P n I -.I Z
(L 0
---._
.-I
h(
%
w- c.
P
N
E -c
Fig. 8
25
c3 3 n z
a
0 I 1
I
Fig. 9

26
ORNL-DWG 89-15233
-+ P
-s
P
Fig. 10
27
4
3
2
1
100
-
10 MeV
L 120
I . I
i l I MeV I :
100 keV
140 ALPHA (DEG)
ORNL-OWG 89-15606 w .
i 10 keV
. . I
. I
160 180
Fig. 11

29
ORNL/TM-1153 1
INTERNAL DISTRIBUTION
1-5. 6-10.
11-15. 16-20. 2 1 4 0 . 4 1 4 5 .
46. 47. 48. 49. 50. 51.
52.
53-55.
56.
57.
58. 59. 60. 61.
62.
63.
64.
65-74.
W. A. Gibson R. N. Hamm G. S. Hurst T. E. Huston J. E. Turner H. A. Wright Central Research Library ORNL Y-12 Technical Library Document Reference Section Laboratory Records Laboratory Records-RC ORNL Patent Section
EXTERNAL DISTRIBUTION
Office of Assistant Manager for Energy Research and Development , Department of Energy, Oak Ridge Operations Office, Oak Rrdge, TN 37831 W. E. Bolch, Dept. of Nuclear Engineering, Texas A&M University, College Station, TX 77843-3133 J. Booz, Institut fuer Medizin, KFA Juelich, Postfach 1913, D-5170, Juelich, Federal Republic of Germany R. S. Caswell, National Institute of Standards and Technology, Gaithersburg, MD 20899 F. Hajnal, U.S. DOE, EML, 376 Hudson Street, New York, NY 10014 W. M. Lowder, U.S. DOE, EML, 376 Hudson Street, New York, NY 10014 H. Ing, Chalk River Nuclear Laboratories, Chalk River, Canada E€. G. Paretzke, GSF, Institute fuer Strahlenschutz, D-8042, Neuherberg, Federal Republic of Germany U. Schrewe, Physikalisch-Technische Bundesanstalt , Bundesallee 100, D-3300 Braunschweig, Federal Republic of Germany M. Vaxma, Office of Health and Environmental Research, ER-70, U.S. Department of Energy, Washington, DC 20585 D. J. Galas, Office of Health and Environmental Research, ER-70, U.S. Department of Energy, Washington, D.C. 20585 Office of Scientific and Technical Information, Oak Ridge, T N 37831
I
Recommended