Active Response
A Network Optimisation Approach
Real Time Network Reconfiguration
for Operations’ Flexibility
Visit Innovation.ukpowernetworks.co.uk

Introductions: On The Webinar Today
John Dirkman, Nexant Product Manager
Luca Grella, Active Response Project Lead
Hamdi Shishtawi, Active Response ANM Lead
Mark Jaggassar, SGS Director of Grid Analytics

15:00IntroductionHamdi Shishtawi
15:05Active ResponseLuca Grella
15:15ANM Implementation and IntegrationMark Jaggassar and Hamdi Shishtawi
15:30Optimisation Engine DemonstrationJohn Dirkman
15:50 Q+A
Agenda

8.3M homes and businesses28% of UK Total
9.3GW Distributed Generation Connected32% of UK Total
16GW Peak Demand28% of UK Total
About UK Power Networks

About Smarter Grid Solutions
Global software company with European Headquarters
Implementing and managing 500 MW of DER under management with an additional 1 GW of contracts in delivery
Flexible technology create unique partner IP propositions
Multi-use case DERMS interfacing to the grid and market unlocks the true value of DER
Continuous R&D on top of proven platform ensures market leadership
World-class reference customers operationally using our technology
Breadth and depth of team covering technical and commercial aspects
Flexible architecture to configure and scale deployments
Our purpose is to develop and deliver the most flexible and scalable DER management software platform that enables energy companies to create and implement solutions for the transition to net zero carbon emissions.

About Nexant – At A Glance
Innovative Technology-Enabled Services, Software, and Consulting.
60+Electric and Gas Utility Clients
Wide Breadth of Program
ServicesFrom Grid
Operations to the Customer
Our Clients: Utilities & ISOs
750M+Annual kWh
Savings Delivered
20 Years of Proven Expertise in Technology
Enabled Program Design, Delivery,
and Grid Management
History:
• Founded in 2000• 380 Employees• 11 Offices 80+
Energy and Electrical Engineers

Active Response
Luca Grella

The Active Response Project - Introduction
Hardware Development and
Deployment
• Design, install, commission new SOP and SPB PEDs on HV & LV
Software Development and
Deployment
• Develop software and algorithms to coordinated solution
Project Planning, Trials
and Analysis
• Four live trials between mid-2019 and 2021
• Analyse benefits
Learning & Dissemination
• Document and share learning from live trials and research
Work Packages1. 2. 3. 4.
About
The project will demonstrate the following two
methods in four separate trials (2020-2021) to
maximise capacity:
• Network Optimise – Optimisation and
Automatic reconfiguration of HV & LV networks
in combination, using remote control switches
and Soft Open Points (SOPs).
• Primary Connect – Controlled transfers
between primary substations using a Soft
Power Bridge (SPB) to share loads and
optimise capacity.
ObjectivesLead:
Partners & suppliers:
Funded by Ofgem’s
Network Innovation
Competition (NIC).
• Duration: 2018-2022
• Five project partners,
lead: UKPN
• Total cost: ~£18.2m
• NIC funded: ~£13.8m
• UKPN funded: ~£3m
• External funds: ~£1.3m

Project Deliverables and Benefits
Increased network flexibility
Network optimisation
Network control benefits
Reduced CIs & CMLs
Network reinforcement
deferral
Spare capacity [kVA] release
Significant financial, capacity, and carbon benefits associated
with deferral
Reduction in customer disruption
Faster and more cost-effective distributed
generation connection offers
Ref Deliverable
1High Level Design Specification of Advanced Automation Solution
2 Trial Site Selection Criteria and Process Outcome
3 Learning from Hardware factory tests
4Learning from Commissioning and Operation of Active Response Software Solution tools
5Initial Learning from the Installation and Commissioning of Active Response Hardware
6Project technology handover, rollout and adoption into BaUplan
7Review of the Active Response Methods applicability in Scottish Power Energy Network licence areas
8 Presentation of findings from the project trials
9 Review of solution applications and project business case

Key Achievements to Date
SOP/SPB preliminary and detail design
completed
LB switch and monitors preliminary design
completed
Remotely controlled CB functional requirement
finalised
Optimization architecture defined
Offline trials
completed
4 Academic partners officially appointed
Deliverable 1, 2 and 3 delivered
Site selection methodology for SOPs
and SPBs defined
Active Response ANM system requirements
defined
SOP/SPB key testing completed
Site preparation/construction plan for first SPB ever
created in place
Enhanced RTUs (Type E) with required I/O
schedule required for advanced optimization
installed on site
Change reporting mechanism required for
automatic real time communication
PowerOn/RTU delivered
2T SOPs locations approved by Council
Dplan enhancements for BaU transition defined

The Project Products
ACTIVE NETWORK MANAGEMENT SYSTEM
Soft Power Bridge (SPB)5 MVA
Soft Open Points (SOP)260 & 400 kVA
LV Circuit Breakers & Link Box Switches

The Trials
Active HV
Active HV will demonstrate Network Optimise and the benefits of automated HV network optimisation only.
Network Optimise
ANM will be applied to the 11 kV network and the new generation of LV hardware including SOPs. The trial will demonstrate the benefits of the active reconfiguration of networks, by releasing capacity for new connection.
Primary Connect
Primary Connect will trial a SPB and demonstrate direct connection between two primary substations. The trial will show the ability of the SPB to release network capacity be managing primary substation peak demands.
Active Response
Active Response will demonstrate both project methods in combination. This will enable the complete solution to be trialled to prove that the technologies operate in conjunction with each other to maximise the benefits.

Active Network Management System
Mark Jaggassar
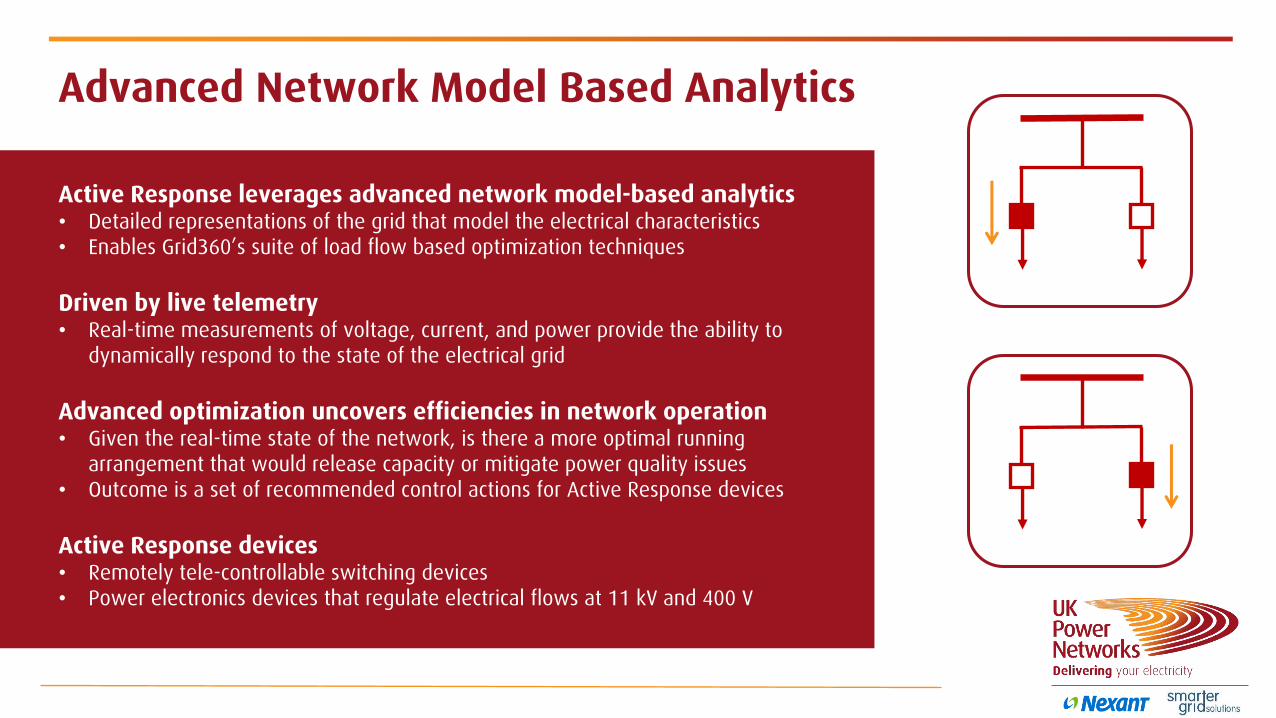
Advanced Network Model Based Analytics
Active Response leverages advanced network model-based analytics• Detailed representations of the grid that model the electrical characteristics• Enables Grid360’s suite of load flow based optimization techniques
Driven by live telemetry• Real-time measurements of voltage, current, and power provide the ability to
dynamically respond to the state of the electrical grid
Advanced optimization uncovers efficiencies in network operation• Given the real-time state of the network, is there a more optimal running
arrangement that would release capacity or mitigate power quality issues • Outcome is a set of recommended control actions for Active Response devices
Active Response devices• Remotely tele-controllable switching devices• Power electronics devices that regulate electrical flows at 11 kV and 400 V

Conceptual Model
Active Network Management System
Grid360 Optimisation Engine• AR Algorithms• Load Flow• Fault Level• State Estimation
ANM Strata• Overall ANM supervisory duties• Connection to live system• Enacting of services (such as
Grid360)• Instruction of control for ADMS
Harmonised Network Model• CIM format• Comprehensive network
information
Advanced Distribution Management System• PowerOn (Fusion/Advantage)• Real time connectivity to field
equipment• Connectivity to PI historian• Automation (APRS, PORT, etc.)• Real time control
Field Remote Terminal Units (RTU)• Data collection and aggregation• Connectivity to ADMS• Field device systematic polling• Unsolicited message responses
from both ends
Active Response Field Devices• Link box switches• Link box monitors• Internal software RTU
Active Response Field Devices• PEDs, LV CBs• DNP3 slaves• Unsolicited message initiation and
threshold
ICCP
API
DNP3
DNP3
DNP3

Operationalising Advanced Analytics
Simulation and
Optimization
Real time Control and
Automation
Local DER Control
Preventive Control Layer:
• Simulation and optimization based on real-time data to schedule or dispatch
against target objectives
Corrective (ANM) Control Layer:
• Responds to external stimulus and DER status to issue real-time setpoints
• Fast-acting autonomous control to ensure control actions or optimization
objectives are delivered and enforced
• All DER control / dispatch is through this unique layer
Fail Safe Control Layer:
• Using distributed algorithms to monitor DER compliance, communications
health and implement locally autonomous fail-safe controls
Layering of control is fundamental to delivering flexibility from DER
Grid360
UKPN Operations
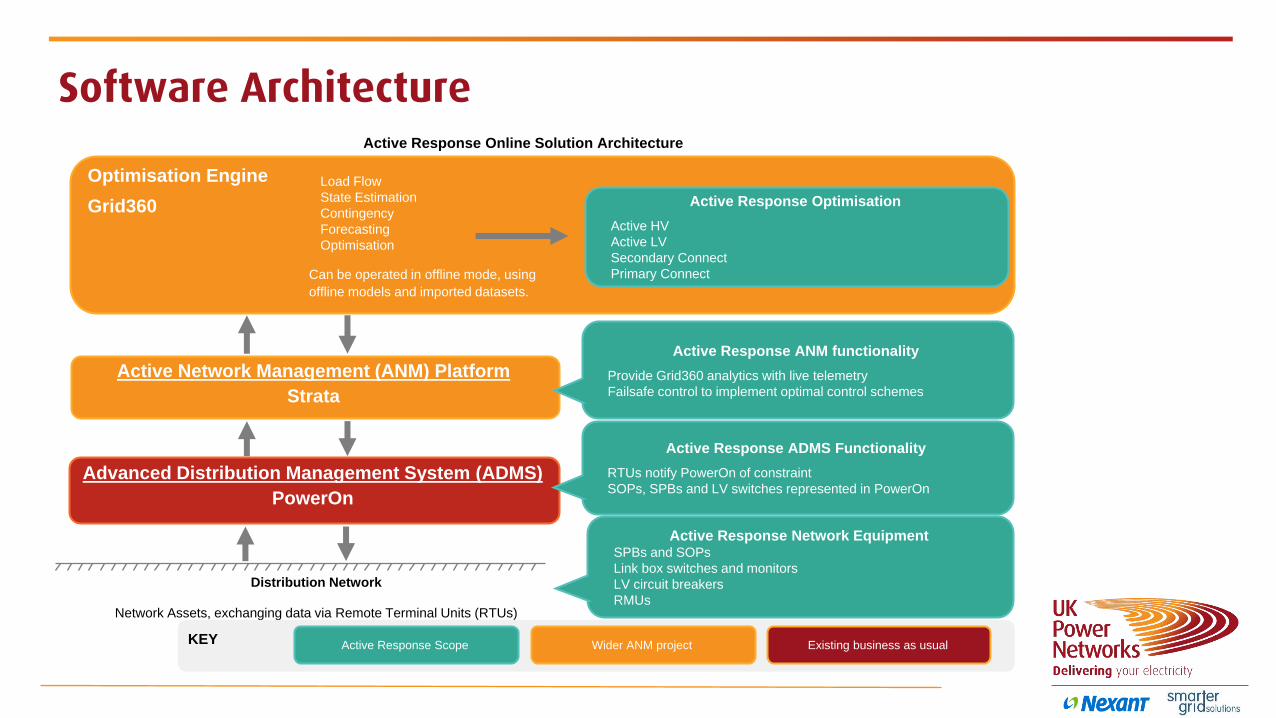
Software Architecture
Optimisation Engine
Grid360
Load Flow
State Estimation
Contingency
Forecasting
Optimisation
Can be operated in offline mode, using
offline models and imported datasets.
Active Response Optimisation
Active HV
Active LV
Secondary Connect
Primary Connect
Active Network Management (ANM) Platform
Strata
Advanced Distribution Management System (ADMS)
PowerOn
Distribution Network
Network Assets, exchanging data via Remote Terminal Units (RTUs)
Active Response Network EquipmentSPBs and SOPs
Link box switches and monitors
LV circuit breakers
RMUs
Active Response ADMS Functionality
RTUs notify PowerOn of constraint
SOPs, SPBs and LV switches represented in PowerOn
Active Response ANM functionality
Provide Grid360 analytics with live telemetry
Failsafe control to implement optimal control schemes
KEY Active Response Scope Wider ANM project
Active Response Online Solution Architecture
Existing business as usual

Test Harness Software Architecture
Optimisation Engine
Grid360 Load Flow
State Estimation
Contingency
Forecasting
Optimisation
Can be operated in offline mode, using offline
models and imported datasets.
Active Response Optimisation
Active HV
Active LV
Secondary Connect
Primary Connect
Active Network Management (ANM) Platform
ANM Strata
Active Response Test Harness Functionality
Simulate changes to network based on optimisation outputs
Provide simulated measurement data based on historical data
Active Response ANM functionality
Provide Grid360 analytics with live telemetry
Failsafe control to implement optimal control schemes
KEYActive Response Scope Wider ANM project
ANM Test Harness Interface
ANM Strata – Grid360
Active Response Offline Testing Architecture
Input / output data

Tests and Results
Hamdi Shishtawi

Some Results Trial 1 Trial 2 Trial 3 Trial 4
Voltage 11kV 11kV and 0.4kV 11kV 11kV and 0.4kV
Number of nodes ~400 ~2600 ~230 ~2600
Number of loads simulated
~150 ~1650 ~60 ~1700
Telemetry the number of optimisable loads
~50 loads (1 years’ worth of half hourly P and Q data
for every load point)
~1800 loads (4 weeks’ worth of
half hourly P and Q data for
every load point)
~60 loads (1 year worth of half hourly P
and Q data for every load
point)
~1800 loads (4 weeks’ worth of
half hourly P and Q data for
every load point)
Execution time for
1-week time series simulation
2 hours 7 hours 45 minutes 7 hours
Output file size for 1-week time series simulation
750kB 1100kB 750kB 1100kB
Number of 1 day runs
61 24 0 15
Number of 1 week runs
6 20 44 16
Total time simulated
~100 days ~160 days ~300 days ~130 days
Total computation time
~30 hours ~160 hours ~30 hours ~130 hours
“In total, nearly 2 years of time-series data was generated over the course of the offline trials to
characterize the impacts of Active
Response”

Trial 1 Site

Trial 1 Site

Managing the Anticipated EV Peaks - Active HV
200
300
400
500
600
700
800
900
1000
1 9 :1 2 2 2 :4 8 0 2 :2 4 0 6 :0 0 0 9 :3 6 1 3 :1 2 1 6 :4 8 2 0 :2 4 0 0 :0 0 0 3 :3 6
LOA
D L
EVEL
(A
)
TIME
160% EV Peaks Winter 2019 Peak Day
Instance
NumberTime Stamp
Number of
Resolved
Buses
Resolved
Branch
Overflow (A)
Resolved
Branch
Overflow (%)
1 12/12/2019
18:00
1 0.218827 100%
2 12/12/2019
18:30
1 0.100317 100%
3 12/12/2019
19:00
0 0.129392 87%
Instance
NumberTime Stamp
Number of
Resolved
Buses
Resolved
Branch
Overflow
(kVA)
Resolved
Branch
Overflow (%)
1 12/12/2019
18:00
6 3683.783197 93.65%
2 12/12/2019
18:30
15 4824.811226 80.03%
3 12/12/2019
19:00
0 9.17417238 0.11%
Monitored
Unmonitored
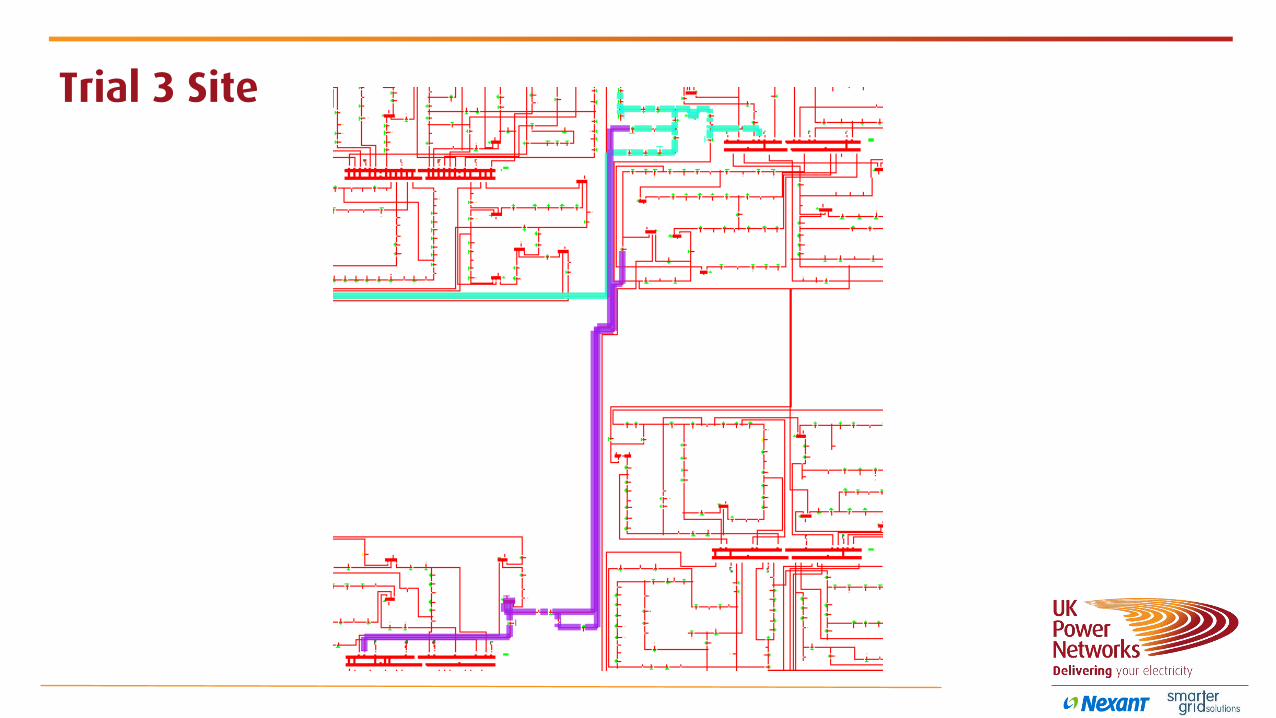
Trial 3 Site

Connecting Two Primary Substations - SPB
SeasonOptimisation Mode
P = Real Power,
No. Branch
overload before
optimisation
No. Branch
overload after
optimisation
Net resolved
overload by
SPB
Spring P optimisation 0 0 0
Summer P optimisation 0 0 0
Autumn P optimisation 0 0 0
Winter P optimisation 2 0 2
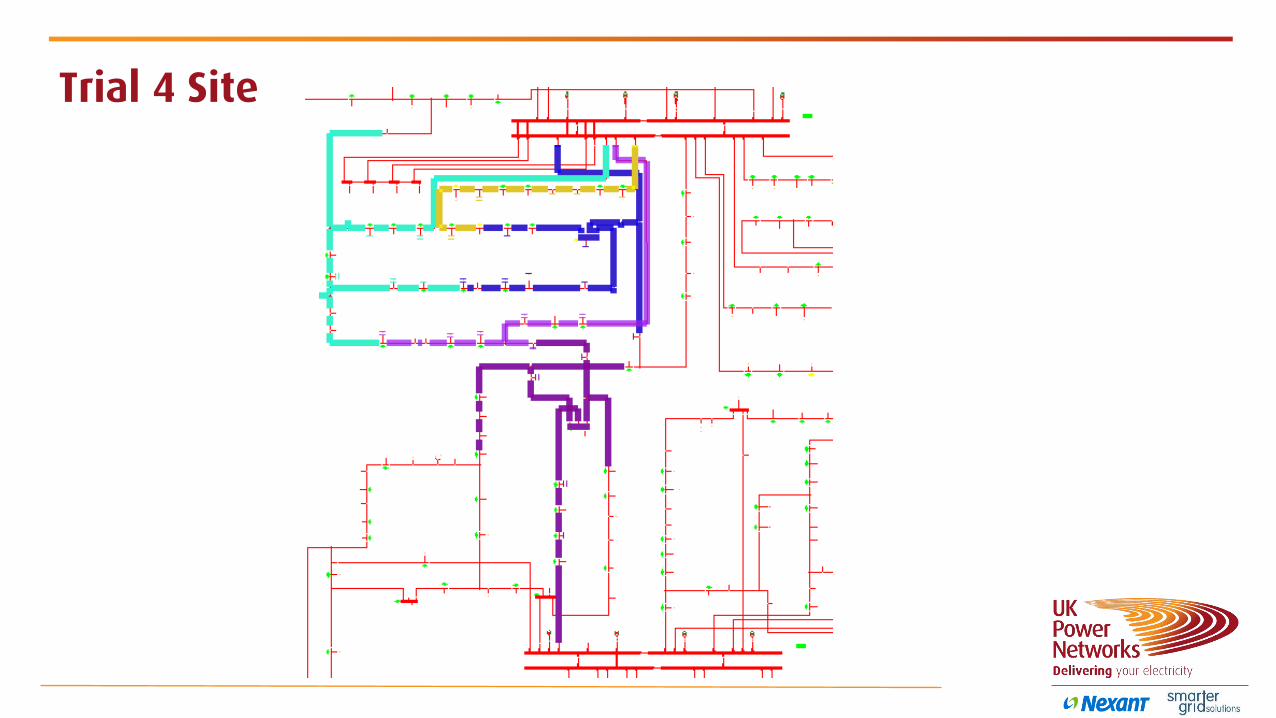
Trial 4 Site

Trial 2 Site99
2082
9920
8399
2056
5
0601
9
9920
5899
2059
5
0656
1
9920
6099
2061
9956
90
9956
91
9920
6299
2063
9920
64
9920
65
9913
23
5
0690
9
5
0853
7
9920
67
9920
66
9920
68
9920
69
8
0643
8
9920
7099
2071
9920
72
9913
19
8
0675
0
9913
24
9913
20
9913
21
9913
22
5
0674
9 9913
14
9913
08
8
0812
806
027
9913
0699
1305
9913
2599
1326
9920
7599
2074
9913
27
9920
76
9920
77
8
0834
2
9913
28
9913
2999
1330
9914
01
9913
3399
1332
9913
31
9913
34
0605
1
9913
99
5
0650
6
9913
36
9913
15
9913
98
9913
0799
1394
8
0643
9
9913
95
9956
11
8
0840
8
9956
09
8
0870
3
???
9914
02
9956
1299
5614
9913
9799
1396
9914
0699
1441
9914
00
9956
10
8
0642
8
9914
0599
1403
9913
7999
1380
9913
77
9913
78
8
0824
0
5
0675
899
1343
9958
19
9913
47
9913
46
9913
48
9913
70
9913
49
5
0668
1
9913
68
9913
66
9913
5099
0317
9913
51
9913
5299
0319
9913
53
5
0646
1
9902
20
9913
62
9913
65
9913
71
9913
67
5
0611
7 9913
60
9913
7299
1373
9913
74
1.0
0848
1
7.5
0693
899
1385
0608
2
9913
82
9913
75
5
0653
8
9913
87
9914
04
9914
0899
1407
9914
09
8
0849
7
5
0606
0
5
0859
8
55
0852
7
7.5
0606
2
9958
24
1.0
0824
7
8
0821
1
7.5
0600
9
7.5
1.0
0676
2
5
0683
9
5
0834
9
5
0836
9
8
0640
299
2081
9920
84To
war
ds
Wim
ble
do
n
par
k tu
be
stat
ion
Sou
th w
est
tow
ard
s 0
63
66
Art
hu
r R
oad
Eas
t 9913
17
9913
16
8
0636
6
No
rth
Eas
t To
war
ds
06
40
2
tow
ards
0
67
72
(LV
O
nly
)
9956
19
806
429
9913
11
9913
10
9913
0499
1300
9912
99
9913
81
7.5
0605
0
9913
92
9913
91
9913
89
5
0676
1
9913
42 9913
45
9913
44
80826
3
9903
16
8
0641
8
9903
21
0664
3
9903
495
0668
099
0350
8
0611
5
9903
5699
1355
8
0823
899
1356
1.0
0825
6
8
0829
1
9919
60
9920
51
8
0819
1
5
0602
8 5
0864
8
X
XX
X
XX
XX
XX
XX
XX
XX
XX X
X
XX
XX
X XXX
XX
XXX
XXXX
XX
XX
XX
XX X
XX
X
8
0880
3
1
2
34
56
7
8
9
10
11
12
13
14
15
16
17
18
19
20
21
22
28
23
24
252
6
27
29
30
31
32
33
34
35
36
37
38
39
, 4
0,
41
, 42
43
44
45
46
47
48
49
50
51
52
53
54
55
56

Active Response – Future of the Network
Instance
NumberTime Stamp Active LV
Secondary
Connect
Resolved
Branches
Resolved
Overload (kVA)
Resolved
Overload (%)
102/04/2019
03:00Yes No 6 245.46 100.00%
202/04/2019
05:30Yes No 4 535.30 27.34%
304/04/2019
01:30Yes No 5 2314.59 100.00%
405/04/2019
11:30Yes Yes 2 485.78 43.87%
505/04/2019
13:30No Yes 1 5.22 0.50%
605/04/2019
17:00No Yes 1 110.40 25.53%
705/04/2019
17:30Yes No 9 380.25 100.00%

Grid360 Demo
John Dirkman

Thank You For Attending!
Visit Innovation.ukpowernetworks.co.uk
Active Network:A Network Optimisation Approach
John Dirkman, Nexant Product [email protected]
Luca Grella, Active Response Project [email protected]
Hamdi Shishtawi, Active Response ANM [email protected]
Mark Jaggassar, SGS Director of Grid [email protected]
Recommended