4 City Road
London EC1Y 2AA
+44 (0) 20 7580 5383
eftec.co.uk
A National Ecosystem Assessment of the
UK Overseas Territory of Montserrat:
Natural capital assessments, mapping and
monitoring methods – Phase II
Contract Number: C17-0304-1159
Final Report
For the Joint Nature Conservation Committee
June 2019

A National Ecosystem Assessment of Montserrat: phase II
Final Report | June 2019
This document has been prepared for the Joint Nature Conservation Committee (JNCC) by:
Economics for the Environment Consultancy Ltd (eftec)
3rd Floor
4 City Road
London
EC1Y 2AA
www.eftec.co.uk
In association with Viridian Logic
Study team:
Ian Dickie
Patricia Yagüe Garcia
Angus Middleton (Viridian Logic)
Leon Baruah (Viridian Logic)
Reviewer
Dr Rob Tinch (tbc)
Acknowledgements
We would like to thank those who provided data to support this work: Melissa O’Garro in the Government of Montserrat, Michael MacCloed of the RSPB, Keith Aidan at CEH, JNCC staff, and Environment Systems in the UK.
Disclaimer
Whilst eftec has endeavoured to provide accurate and reliable information, eftec is reliant on the accuracy of underlying data provided and those readily available in the public domain. eftec will not be responsible for any loss or damage caused by relying on the content contained in this report.
Document evolution
Draft Report 11/04/2019 Review by Ian Dickie
Draft Final Report 29/04/2019 Reviewed by Rob Tinch
Final Report 05/06/2019 Reviewed by Ian Dickie
This report is based on eftec’s Version 1 February 2019 report template.
eftec offsets its carbon emissions through a biodiversity-friendly voluntary offset purchased from the World Land Trust (http://www. carbonbalanced.org) and only prints on 100% recycled paper.
A National Ecosystem Assessment of Montserrat: phase II
Final Report | June 2019 Page i
Executive summary This is the Final Report from Economics for the Environment Consultancy (eftec), in
association with Viridian, to the Joint Nature Conservation Committee (JNCC) for phase II of
the work to develop a national ecosystem assessment for Montserrat.
This report builds on the phase I report of July 2018, which focused on priority provisioning
and cultural ecosystem services. This report adds evidence on regulating services for
carbon sequestration, and soil erosion and flooding. It also improves the agricultural
values from the phase I report.
A summary of ecosystem services measured and valued is provided in Table ES 1. These
initial accounts provide a baseline and structure to enable future iterations to be built
upon. Due to data limitations, the results offer an indication as to the scale of values. The
uncertainty associated with each measure is indicated by colour coding in Table ES 1, and
the uncertainties in several key values means that the total estimated values have a
moderate degree of uncertainty. Over time, with more robust and additional data, the
accuracy and comprehensiveness of the account can be improved.
The data show that:
• The Montserrat environment provides over XCD 40.36 million of annual value across
eight benefits assessed.
• The data broadly illustrate the relative values of different benefits, and inform
potential synergies and trade-offs between them.
• The values used measure final services or benefits to people, as far as data allow.
This has implications for how data are used. For example, fish landings are valued at
market price – as if all landings were sold, even though a proportion of landings are
retained by fishers for domestic consumption. The value for water reflects the
volume and value supplied to users, but does not reflect the contribution that water
from the springs in the Centre Hills makes to supporting wildlife habitats, as this
value is partly measured under cultural services.
• The majority of benefits are measured from market revenues. The measured value
of services is worth more than a quarter of Montserrat’s GDP. However, given some
missing values, and the further value-added activities related to the services
measured (e.g. serving local fish in restaurants), the contribution from the
environment to Montserrat’s GDP is very substantial – it is a major part of the island
economy (not surprisingly). It illustrates the different ways that natural capital
supports the livelihoods and quality of life of everyone on the island.
• A mixture of economic valuation approaches are required to generate monetary
values for the account. This means the account contains a mixture of welfare and

A National Ecosystem Assessment of Montserrat: phase II
Final Report | June 2019 Page ii
market values.
• Further work to understand benefits, such as in regulating soil erosion and flood
hazard, the value of produce from cropping trees, and tourism motivations, would
improve the accuracy of the figures.
• The results can input to a natural capital account for Montserrat.
The results suggest a range of indicators for the contribution of Montserrat’s environment
to benefits for people:
• A key aspect of the state of the environment is the proportion of forest cover and
the intactness and condition of the protected area of forest. This area is important
for water supplies, carbon sequestration, tourism and cultural services. For the value
of species conservation, this indicator could also be extended to include the
Important Bird Areas (IBAs).
• Variation in canopy density can help monitor pressure on the forest from human
activities and grazing by feral animals.
• The extent of human activities, and their impact on the natural environment, can be
monitored through indicators of the percentage of built and cultivated land. An
indicator has also been provided of the risk from soil erosion to the roads network.
• Tourist expenditures are the single largest category of benefit, representing almost
half of total value, and is driven by the number and duration of tourist visits to the
island.
The majority of the benefits analysed are renewable, so with good management their
value can be sustained for future generations. Minerals are the only non-renewable
benefit assessed, but the quantities on the island resulting from volcanic deposits are
huge, and so the current extraction rates are expected to continue for the foreseeable
future.

A National Ecosystem Assessment of Montserrat: phase II
Final Report | June 2019 Page 3
Table ES 1: Estimated Benefits on Montserrat and Asset Value (2018)
Benefits Annual Measure of Benefit Estimated Value XCD/yr. Type of Value PV25
XCD
Water 99 million gallons consumed 2.7 million Price of water sold to households
and businesses 47.26 million
Fish 166,920 lb fish landed 1.8 million Total landings valued at average sale
price 30.85 million
Agriculture 112,780 lbs of crops 0.5 million Ministry of Agriculture records of
production
7.82 million
188,515 lbs of meat 1.7 million 28.18 million
Minerals 1.01 million tonnes exported 8.8 million Value recorded by customs 31 million
Tourism 9,293 tourist visits 22.8 million Estimated expenditures 389.49 million
Cultural Recreation, aesthetics &
species conservation 0.7 million
Willingness to Pay (wellbeing of
conserving the Centre Hills) 12.19 million
Carbon 19,515 tCO2e sequestration
in forest, scrub & seagrass 1.3 million
UK Government value of non-traded
carbon adjusted to Montserrat GDP
per capita
31.39 million
Flood
Hazard
regulation
21.2% of roads network has
erosion risk 10x > than
average
Modelling of risk to roads network
TOTAL - 40.4 million Mix of value types 578.6 million
The data cells are colour-coded to show the robustness of the data as an accurate measure of the full value of each service.
High uncertainty Moderate uncertainty Low uncertainty
Low uncertainty reflects confidence that the evidence can support decisions. High uncertainty reflects results that may be
inaccurate by more than an order of magnitude. Note that some data may be marked as ‘moderate’ uncertainty where the data
used are themselves accurate, but do not provide a full measure of the services’ value (e.g. for hazard regulation).

A National Ecosystem Assessment of Montserrat: phase II
Final Report | June 2019 Page iv
Contents 1. INTRODUCTION 1
1.1 Aims and Objectives 1
2. PROJECT APPROACH 3
2.1 Phase I: Provisioning and Cultural Services 3
2.2 Phase II: Regulating Services 4
3. CONTEXT AND METHODS 5
3.1 Context of Montserrat Economy 5
3.2 Context on Ecosystem Services and Valuation 5
3.3 Accounting Approach 6
3.4 Data gathering 7
3.5 GIS Data Organisation 8
3.6 Data Management 8
3.7 Recommendations for Data Management 9
4. ECOSYSTEMS ON MONTSERRAT 11
4.1 Ecosystems Extent 11
4.2 Habitat Condition 13
5. ECOSYSTEM SERVICES ON MONTSERRAT 16
5.1 Water 16
5.2 Fisheries 17
5.3 Food from Land 19
5.4 Minerals 20
5.5 Tourism 20
5.6 Cultural Services 21
5.7 Hydrological Regulation 22
5.8 Carbon Sequestration 26

A National Ecosystem Assessment of Montserrat: phase II
Final Report | June 2019 Page v
6. CONCLUSIONS 27
6.1 Ecosystem Services 27
6.2 Value of Montserrat’s Natural Capital 31
6.3 Natural Capital Indicators 32
6.4 Recommendations 34
7. REFERENCES 36

A National Ecosystem Assessment of Montserrat: phase II
Final Report | June 2019 Page vi
Tables
Table 3.1: GDP and GDP per capita for Montserrat 5
Table 3.2 Relationship between Natural Assets, Ecosystem Services and Benefits 6
Table 3.3: Collation of Datasets (March 2018) 10
Table 4.1: Areas of Broad Terrestrial and Marine Habitats on Montserrat 13
Table 4.2: Mass of debris extracted at two Montserrat sites 15
Table 5.1: Annual value of Montserrat fisheries in 2018 XCD 18
Table 5.2: Comparison of annual value of Montserrat fisheries in 2018 XCD 18
Table 5.3: Tourist arrivals by place of stay 20
Table 5.4: Willingness to pay of Montserratians for cultural benefits 22
Table 5.5: Estimated annual value of cultural benefits to Montserrat. 22
Table 6.1: Estimated Ecosystem Services on Montserrat 27
Table 6.2: Beneficiaries from ecosystem services 28
Table 6.3: Estimated Natural Capital Asset Values for Montserrat 31
Figures
Figure 4.1: Montserrat Broad Habitat Map 12
Figure 6.1: Montserrat Ecosystem Service - Physical Amount, 2018 29
Figure 6.2: Montserrat Ecosystem Services - Estimated Values, 2018 30
Boxes
Box 1.1: Types of Ecosystem Services 2
A National Ecosystem Assessment of Montserrat: phase II
Final Report | June 2019 Page 1
1. INTRODUCTION
This is the Final Report from Economics for the Environment Consultancy (eftec), in association with Viridian
Logic (Viridian), to the Joint Nature Conservation Committee (JNCC) for the contract ‘A national ecosystem
assessment of the UK Overseas Territory of Montserrat: natural capital assessments, mapping and
monitoring methods – Phase II’ (No: C17-0304-1159).
This project is part of a wider group of projects the JNCC on the UK Overseas Territories using Earth
Observation Based Mapping and Interpretation, and the ecosystem services framework to:
A. Establish the estimated Total Economic Value (eTEV) of the terrestrial and marine natural
environment;
B. Identify the priority natural capital assets and measurable attributes (Natural Capital Metrics) to
monitor changes in value through time;
C. Integrate natural capital valuations into national mapping (GIS) to define the spatial distribution of
these natural assets (Value Mapping) and to promote the integration of such valuations into
planning and policy making, to improve long-term economic growth.
1.1 Aims and Objectives
This project is phase II of work to produce a National Ecosystem Assessment (NEA) for Montserrat. The
overarching objectives of this work provide a baseline assessment of the natural capital assets of
Montserrat and their socio-economic value to the island, and so can be presented in a natural capital
account. This information can provide a framework to incorporate the socio-economic values of the natural
resources of the territory into policy and decision making, and for understanding their changes over time.
Phase II is focusing on assessing priority regulating services and improving previous estimates of food
provisioning services (see Box 1.1). Analysis quantifies the physical amount and value of the ecosystem
services affecting these sectors. Understanding the eTEV of the Montserrat environment has built on work
on Earth Observation (EO) Based Mapping and Interpretation, which developed a detailed map of terrestrial
habitats on Montserrat and has helped select relevant indicators for management of its environment.
The remainder of this report describes the project approach (Section 2), the context for the project and
methods used (Section 3), the extent and condition of Montserrat’s ecosystems (Section 4) and presents
the results for the main ecosystem services on the island (Section 5). Section 6 gives conclusions and
recommendations.

A National Ecosystem Assessment of Montserrat: phase II
Final Report | June 2019 Page 2
Box 1.1: Types of Ecosystem Services
The most widely used definition of ecosystem services is from the Millennium Ecosystem Assessment
(MA, 2005): “the benefits people obtain from ecosystems”. The MA further categorized ecosystem
services into four categories:
• Provisioning: Material outputs from nature (e.g., seafood, water, fibre, genetic material).
• Regulating: Indirect benefits from nature generated through regulation of ecosystem processes
(e.g., mitigation of climate change through carbon sequestration, water filtration by wetlands,
erosion control and protection from storm surges by vegetation, crop pollination by insects).
• Cultural: Non-material benefits from nature (e.g. spiritual, aesthetic, recreational, and others).
• Supporting: Fundamental ecological processes that support the delivery of other ecosystem
services (e.g. nutrient cycling, primary production, soil formation).
Analysis of benefits from natural capital also includes abiotic services: The benefits arising from
fundamental geological processes (e.g., the supply of minerals, metals, oil and gas, geothermal heat,
wind, tides, and the annual seasons).
Source: Based on Natural Capital Coalition (2016) Natural Capital Protocol, and Millennium Ecosystem
Assessment: Ecosystems and human wellbeing. Biodiversity Synthesis. Washington DC: Island Press.
A National Ecosystem Assessment of Montserrat: phase II
Final Report | June 2019 Page 3
2. PROJECT APPROACH
The project was developed through a series of activities:
2.1 Phase I: Provisioning and Cultural Services
Phase I developed the assessment of provisioning and cultural services and undertook visits to Montserrat
for a project workshop and to present draft results.
Montserrat Workshop
The project team helped chair and facilitate a workshop on Montserrat on ‘GIS, Earth Observation and
Valuation to Support Planning & Decision making’ on the 13th -14th of November 2017.
Presentations were given on GIS approaches and ecosystem services valuation, and these were shared with
JNCC and partners on Montserrat. The workshop helped gather significant contextual information for the
island, and identified the following ecosystem service/benefit priorities for the study:
Provisioning Services1:
• Water provision – quantity of water supplied to homes and businesses
• Food production:
o Agricultural production (crops and livestock)
o Productive trees (e.g. for fruits)
o Fisheries
• Materials:
o Fibre (timber)
o Minerals (sand and gravel)
Cultural Services
• Local amenity and cultural significance of the environment
• Tourism/visitor values, with key activities being:
o Landscape & volcano viewing
o Hiking & nature watching
o Marine: scuba, swimming
Regulating Services (which also support the ecosystem services/benefits above):
• Regulation of fresh water quality
• Hazard (e.g. flood) risk reduction
1 Also included are several abiotic benefits from energy resources: Wind, Solar, Geothermal. They can be included in the accounting
framework used in this study to support the longer-term objective of natural capital accounting.

A National Ecosystem Assessment of Montserrat: phase II
Final Report | June 2019 Page 4
• Sequestration of carbon
• Regulation of marine water quality
• Biologically diverse habitats that maintains species and habitats.
The workshop enabled meetings with the GIS Team in Physical Planning Team in Ministry of Agriculture,
Trade, Land, Housing and the Environment (MATLHE) and facilitated on-island and remote data collation.
A series of GIS files were brought back to the UK for analysis (see Section 4). Additional data sources were
also identified, along with contact points through which to obtain them.
Post Workshop Research
Following the visit to Montserrat, further data were obtained through remote discussion with Government
of Montserrat staff in relation to key ecosystem services, and liaison with Environment Systems, who shared
a number of further datasets and details from the JNCC National Ecosystem Assessment of the UK Overseas
Territory Montserrat: Earth Observation based mapping and interpretation project. A meeting was held
with Montserrat’s Head of GIS at eftec’s office in London on the 8th March 2018 to review datasets and
mapping approaches.
The draft outputs from phase I were presented to a meeting on Montserrat on 21st March 2018.
2.2 Phase II: Regulating Services
Phase II developed the assessment of regulating services, in particular carbon sequestration, and
regulation of hydrology. Hydrological modelling covered flow accumulation, soil erosion risk, and a
combination of these two factors to give an overall measure of hydrological regulation services.
The work also addressed the estimation of food production value on Montserrat, which was a key weakness
in the phase I results. Data on volumes and average prices were obtained for crop production and livestock
(meat) production from the Montserrat department of agriculture.

A National Ecosystem Assessment of Montserrat: phase II
Final Report | June 2019 Page 5
3. CONTEXT AND METHODS
This Section describes the approach to valuation of ecosystem services and natural capital applied for this
study.
3.1 Context of Montserrat Economy
The resident population of Montserrat is around 5,000 people. The most recent Census (2011) estimated
the Usual Resident Population at 4,922 people. UN Statistics for Montserrat (last updated 2018) give a
recorded population of 5,216 in 2018.
The GDP and GDP per capita for Montserrat are shown in Table 3.1 in East Caribbean Dollars (XCD) and US
dollars.
Table 3.1: GDP and GDP per capita for Montserrat
XCD USD1
Year GDP GDP/capita2 GDP GDP/capita
2006 139,342,472 28,754 51,608,323 10,650
2007 145,985,620 29,860 54,068,748 11,059
2008 154,989,369 31,579 57,403,470 11,696
2009 160,391,791 32,580 59,404,367 12,067
2010 149,883,351 30,316 55,512,352 11,228
2011 171,986,623 34,439 63,698,749 12,755
2012 168,825,917 33,557 62,528,117 12,429
2013 160,610,028 31,691 59,485,196 11,737
2014 159,259,223 31,240 58,984,897 11,570
2015 159,868,686 31,200 59,210,624 11,556
2016 167,538,713 32,5194 62,051,375 12,044
20173 170,238,028 63,051,121
20183 176,589,809 65,403,633
20193 183,238,591 67,866,145
Note: 1 Conversion rate: XCD/USD = 2.7 2 Estimated based on GDP figures from ECCB and population figures from World Population Prospects 3 Projections by Eastern Caribbean Central Bank 4 Estimated based on latest population recorded by UN Statistics
Source: Eastern Caribbean Central Bank (2017) and World Population Prospects: The 2017 Revision (2017)
3.2 Context on Ecosystem Services and Valuation
Methods to recognise and quantify the economic value of the environment have been in use to inform
Government policies for decades and have been developed and used more extensively in recent years in
response to heightened awareness of environmental pressures. Assessing natural capital through the
ecosystem services framework effectively adapts the principles of mainstream economic analysis to an
environmental context. It measures not only the market value of goods and services like tourism and

A National Ecosystem Assessment of Montserrat: phase II
Final Report | June 2019 Page 6
fisheries, but also the welfare/well-being benefits from goods and services not traded in markets (e.g.
protection of the Centre Hills forests). The basic relationships between natural capital assets, ecosystem
services and benefits to people is shown in Table 3.2, Ecosystem services are defined in Box 1.1.
Table 3.2 Relationship between Natural Assets, Ecosystem Services and Benefits
Natural
Assets
Ecosystem
Services
Economic
Benefits
Definition Components of natural
capital (The elements of
nature that directly and
indirectly produce value
or benefits to people,
including natural
processes and functions).
Functions and products
from nature that provide
benefits to people.
Changes in human
welfare/ wellbeing that
result from the use of
consumption of goods.
Examples Ecosystems, species,
freshwater, land,
minerals, the air and
oceans.
Food, nutrient cycling,
waste breakdown,
detoxification and
storage.
Food, Energy, Materials,
Nature-based tourism.
3.3 Accounting Approach
The evidence needed for a national ecosystem assessment for Montserrat includes the broad habitat
categories present, the ecosystem services these support, and the values of those services to the island’s
economy and wellbeing of its population.
Applying the framework shown in Table 3.2 requires analysis of both bio-physical and socio-economic data
to estimate the total economic value (TEV) for natural capital assets. This can inform decisions on
Montserrat to manage natural assets into the future. The development of this ecosystem assessment will
support subsequent analysis of natural capital impacts and dependencies, and construction of a natural
capital account for Montserrat, through the following links:
• A natural capital account is based on an asset register, which records the extent and condition of
assets, mapping the presence of habitats and species (natural capital stocks) within the
ecosystem assessment, and the extent of abiotic assets.
• A physical flows account examines the goods and services (covering ecosystem services and
abiotic resources like minerals) provided to different sectors.
• Finally, monetary valuations are applied to these physical flows where possible. This gives a
monetary flow account and allows the calculation of values for natural capital assets.
Basic questions to develop this ecosystem services assessment are as follows:
• What ecosystems/assets are there?
A National Ecosystem Assessment of Montserrat: phase II
Final Report | June 2019 Page 7
• What services do they support/provide?
• What benefits are obtained from those services?
• What is the value of the benefits and to whom?
The ecosystem assessment informs choice of the indicators that should be monitored in the future to
identify environmental change most effectively, and to inform policy and planning on an ongoing basis.
3.4 Data gathering
The data collection and metric identification elements of the project have been carried out in close
consultation with the parallel earth observation (EO) project. The following data have been gathered for the
project, in approximately this order:
Habitat Maps
The EO project has provided an up-to-date habitat data layer for the island. Environment Systems created
a map of terrestrial habitats from earth observation data and field visits (ground truthing), using the Living
Maps methodology, which was completed by March 2018. This map identified 16 different habitat and land
use types. These were simplified to present the main habitats for the purposes of the ecosystem
assessment - several of the habitat types were merged to leave 9 broad habitat types (see Table 4.1).
Marine habitat data were sourced through the Waitt Institute’s Blue Halo project. Viridian collated the EO
and Waitt data to construct maps of terrestrial and marine habitats of Montserrat. These form the basis of
the ecosystem services analysis.
The project has tried to obtain soils data for the island through a variety of sources, including Professor
Jenni Barclay at UEA. Data may be held at the University of the West Indies, St Augustine campus.
Unfortunately, it has not been possible to obtain these data, and therefore the modelling is being
progressed without access to detailed soil data.
Maps of ecosystem services
Socio-economic data and the habitats map have been combined to produce maps of key ecosystem service
provision. These maps show both the quantities of the various benefits that flow from the natural assets,
and the economic value they deliver. For instance, the quantity of water arising from Centre Hills is
accompanied by the revenue to Montserrat Utilities Limited for sales to households and businesses.
Economic data
Sources of economic data were identified through discussions on the island in November 2017. These have
been obtained through email and phone calls with Montserrat Government Departments and Montserrat
Utilities Limited, with support from the Physical Planning Unit, plus inputs from individuals on the island.
This has been supported by evidence extracted from the literature on ecosystem services (e.g. rates of
carbon sequestration). Economic data from years prior to 2018 were converted to 2018 prices using
Montserrat’s CPI conversion factor by the Central Statistical Office of Montserrat and the Eastern Caribbean
Central Bank.

A National Ecosystem Assessment of Montserrat: phase II
Final Report | June 2019 Page 8
3.5 GIS Data Organisation
Spatial/GIS information is crucial to the assessment of ecosystem services, and also important to relate the
location of ecosystems to the beneficiaries from the services they provide. This spatial relationship is a key
determinant of the number of beneficiaries, availability of substitutes and other factors that influence
economic value.
Table 3.3lists the datasets identified through the project’s work on Montserrat. They were not all obtained
during the work of the project, as shown in the table – for example, soil data is missing. Those listed as
priority datasets (‘Yes’ entered under the ‘PRIORITY’ column) are especially important for allowing a full,
robust economic valuation of natural capital to be created.
No datasets have been found that show the rate of change of mapped features (e.g. habitat extent) on
Montserrat in recent history, such as development over the last 5 years. Some datasets appear to be older
than others, but the lack of metadata means we do not know their date of acquisition and any attempt at
chronology is not possible. It may be possible to gain some insight into recent changes through satellite
imagery. This has not been possible during this project but is discussed further in Section 6.4 (Indicators).
Viridian have undertaken an initial evaluation of the datasets, including basic cleaning and re-projecting
them to be fully compatible for analysis and presentation. The data management issues are discussed
below, but the lack of metadata means that we are uncertain about the origin of some datasets. The Kew
Gardens 2006 survey information is probably contained within the “NaturalHeritage.gdb/
Mont_NatHeritage_KeyBiodiversity” dataset, but we cannot be certain. Similarly, the Bird Survey may
consist of the “Mont_NaturalHeritage.gdb\Mont_NatHeritage _OrioleSightings” dataset, but again we do not
know if this is the only dataset from the Bird Survey and it may even be the result of an entirely separate
survey.
A full list of the data feature classes, as cleaned and re-ordered by Viridian, was provided as Appendix 1.
(See separate file: Appendix 1 Data_List 141217.xlsx)
3.6 Data Management
For phase I of the project, Viridian reviewed, cleaned and re-projected the data supplied to them. They also
worked with Government of Montserrat on file naming conventions.
Viridian observed the following about the supplied data:
• There are no metadata associated with any of the datasets. This makes it extremely difficult to
understand their origins, content, use and relation to other datasets. Clarification about several of
the datasets was sought early in the project, but was generally not available. These data have
therefore been used with caution and only to the extent that there is confidence in the results
produced.
• Duplicate datasets and multiple data entries of some features exist. This and the lack of metadata
mean we did not know which datasets we should rely upon for various features. Viridian liaised with

A National Ecosystem Assessment of Montserrat: phase II
Final Report | June 2019 Page 9
the Montserrat GIS Department to understand which datasets to use, as well as using comparison
between features within the datasets and any other available, peripheral evidence.
• There are conflicting data. For example, there are differences in the natural vegetation shown in the
south of the island between ‘Landcover’ data and ‘Natural Heritage’ data. The absence of metadata
means we have no way of resolving these conflicts, since we can’t understand why the conflict has
arisen nor which data to use in what circumstances.
• There are a number of feature classes that contain both individual features and the composite of all
these features, but which contain different numbers of total attributes. For instance, the features
‘Road A01’, ‘Road A02’ and ‘Road A03’ together contain a different number of roads than the feature
‘All Main Roads’. Where there are such discrepancies, we have assumed that the composite datasets
are the more complete, as this seems to be the case from the limited comparative analyses that we
have been able to undertake.
3.7 Recommendations for Data Management
• Creating metadata for each data set will ease the understanding of their origins, content, use and
relation to other datasets. The metadata project should create a live register of conflicts, including
why they are problematic, so that it is easier to navigate these datasets in the future. It is worth noting
that JNCC’s Data Management project is currently building a metadata catalogue, spatial display
linked to a national webGIS. This project is addressing these issues, so this problem should be
resolved for future activities.
• There are multiple data formats: mdb, gdb and shapefiles. It is good practice to rationalise data
formats as much as possible and Viridian have issued all geospatial data in single formats for vector
and raster data.
• There are several empty data feature classes, such as ‘Turtles’ on the ‘Fish production’ datasets. This
means that there appear to be more data to work with than there actually are. To ease the efficient
utilisation of dataset, these empty files should be deleted or populated, depending on whether the
data exist elsewhere and can be transferred into their appropriate files.
• Review composite data sets to detect discrepancies in the data.

A National Ecosystem Assessment of Montserrat: phase II
Final Report | June 2019 Page 10
Table 3.3: Collation of Datasets (March 2018) DATA TYPE PRIORITY OBTAINED QUALITY COMMENTS
HABITATS EXTENT & CONDITION
Forest Boundary Yes Yes
Habitat of centre Hills: Vegetation survey (2006, Kew Gardens) Yes Yes Attributed “NaturalHeritage.gdb/Mont_NatHeritage_KeyBiodiversity”
6 types of forest Yes Yes Attributed “LandCover.gdb/Mont_LandCover_Vegetation”
Protected Areas Yes Yes
Marine habitats/Blue Halo (Waitt Inst) Yes Yes
Forest reserve: above 1500 ft contour No Yes Attributed “LandCover.gdb/Mont_LandCover_ForestReserve”
Soil type No No
WATERSHED
Watershed project data No No
Meteorology: rainfall monitored by: Airport, Agricultural Dept,
Montserrat Utilities Yes Yes
Evaporation rates (Was in dept of agri, now in MVO) No No .
Water Utility: springs/ impoundments/ abstraction points Yes Yes Mixed
“Mont_Physical.gdb/Mont_Physical_Springs” (point);
“Mont_Physical.gdb/Mont_Physical_Reservoirs” (point);
“Mont_Physical.gdb/Mont_Physical_Water Features” (line)
Water Utility: distribution network No
Water Utility: treatment works/ discharge points Yes No
PEOPLE
Population distribution (or households) 2011 Census Yes Yes Excel spreadsheet “Household and Institution Population by District
and Sex.xls”
Land ownership No Yes “Cadastre\LandParcels” but issues with feature numbers and no detail
on who owns what
Land type, use or cover Yes Yes “Mont_LandCover.gdb\Mont_LandCover_LandUse.gdb
Tourism ‘areas of interest’ (Tourism Dept) Yes Yes
“Mont_Tourism.gdb\Mont_Tourism_PlacesOfInterest” (point);
“Mont_Tourism.gdb\Mont_Tourism_ShoppingCentres” (point);
“Mont_NaturalHeritage.gdb\Mont_NatHeritage_KeyHeritage” (point);
“Mont_NaturalHeritage.gdb\Mont_NatHeritage_HikingTrails” (line);
“Mont_NaturalHeritage.gdb\Mont_NatHeritage_Beaches” (polygon)
SPECIES
Helicornia clumps (Dept of env & Dr Geoff Hilton, 2006) No No .
Bird survey (Forestry Dept) No Possibly “Mont_NaturalHeritage.gdb\Mont_NatHeritage_OrioleSightings” (point)
Invertebrate surveys (Montana state University) No No
Mountain chicken monitoring (Scott Pedersen/ Durrell Wildlife) No No Empty feature class
Bat monitoring (Dept of Env (DoE)) No No
Reptiles (Durrell - DoE have data) No No
Vegetation Plot monitoring (DoE) No No Marked only. Monitoring has not begun
Feral livestock monitoring (DoE) No No
Marine, bird, reptile, Montserrat tarantula (Coral Cay) No No
Gallios WASP (ZSL) No No

A National Ecosystem Assessment of Montserrat: phase II
Final Report | June 2019 Page 11
4. ECOSYSTEMS ON MONTSERRAT
This Section reports on the extent and condition of the ecosystems on Montserrat.
4.1 Ecosystems Extent
The terrestrial habitats on Montserrat have been mapped in the parallel Earth Observation project: Earth
observation-based mapping and interpretation (2018). For presentation in this report, these have been
consolidated into 9 broad terrestrial habitat types which represent the different land uses that are
considered important to the main ecosystem services on Montserrat.
The marine habitats on Montserrat have been identified from recent survey work by the Waitt Institute.
These data are combined to provide the terrestrial and benthic habitat map shown in Figure 4.1. The
protected forest area boundaries, the location of which are estimated based on the 1,500 foot contour, are
also shown in Figure 4.1.
The areas of the broad habitats mapped in Table 4.1, but with additional breakdown of the woodland
habitat categories on the island. Forest cover is 25%, with a further 35% being thickets and scrub. There are
extensive areas (approximately 20% of the island) of ash and mud bare ground that are a legacy of the
volcano’s eruptive phase that began in July 1995. These data come from a new satellite source, so cannot
be compared to previous habitat mapping in fine detail to accurately measure short-term changes in
habitat areas.
Measurement of disturbed ground and cultivated areas is unreliable using satellite data. This limits the
accuracy of the assessment of food production. The 'Cultivated area' (in Figure 4.1) identifies areas of
probable crop cultivation ('Agriculture'), areas of probable pastureland, and areas of trees (crop and non-
crop). The broad habitat (or SuperClass) 'Cultivated area' is formed of two sub-classes: 'Cultivated areas'
(based on known locations of agricultural activity from Government of Montserrat data) and 'Disturbed
ground'. The 'Disturbed ground' class therefore contains higher uncertainty as the class is a mixture of
disturbed ground, formal and informal agriculture.
Terrestrial habitats data also enable identification of developed areas, and the main ghauts on the island.
The marine habitat data (from a limited sample of camera drops) show the extent of reef habitats: 32% of
the area surveyed is hard-bottom reef, 8% is mixed-bottom reef, and 7% is coral reef. The other main
benthic habitat is sand (36%).

A National Ecosystem Assessment of Montserrat: phase II
Final Report | June 2019 Page 12
Figure 4.1: Montserrat Broad Habitat Map

A National Ecosystem Assessment of Montserrat: phase II
Final Report | June 2019 Page 13
Table 4.1: Areas of Broad Terrestrial and Marine Habitats on Montserrat
Habitat Classification Extent (ha) Percentage
Super Class Class
Ash / mud Ash / mud 2,148 21%
Bare ground Bare ground 436 4%
Beach Beach 249 2%
Developed Land Buildings 48 0%
Cultivated area Cultivated area 31 0%
Cultivated area Disturbed ground / Cultivated area 302 3%
Dry forest Dry forest 1,220 12%
Dry scrub Dry scrub 1,995 19%
Dry scrub Dry thicket 1,973 19%
Wet woodland Elfin woodland 122 1%
Wet woodland Mesic forest 1,077 10%
Rivers and ghauts Rivers and ghauts 101 1%
Roads Roads 46 0%
Urban Urban 295 3%
Wet woodland Wet forest 334 3%
Total 10,376 100%
Marine
Algal Reef (Hard Bottom) 4,149 32%
Algal Reef (Mixed Bottom) 1,043 8%
Artificial Reef 14 0%
Colonized Volcanic Boulders 350 3%
Coral Reef 875 7%
Hard Bottom and Sand 1,339 10%
Sand 4,600 36%
Sargassum Forest 1 0%
Seagrass 449 3%
Total 12,821 100%
4.2 Habitat Condition
The condition of the key habitats shown in Figure 4.1 can be measured in a variety of ways. These reflect
the sustainability of the habitat itself, and/or its capacity to provide ecosystem services now and into the
future. The most important indicators on condition have been selected in the context of the ecosystem
services provided, as analysed in Section 5, and known pressures on the ecosystems.
Two main types of information on condition are biodiversity designations (because they reflected high
biodiversity value habitats at the time of designation) and the intactness of habitat. Montserrat has
extensive areas of intact forest in the Centre Hills, within a protected forest area whose boundary is

A National Ecosystem Assessment of Montserrat: phase II
Final Report | June 2019 Page 14
estimated based on the 1,500 foot contour. The boundary of the forest area that is important for water
resources was derived by Montserrat Utilities work in the 1990’s and is reflected in a buffer zone around
the protected area, which extends slightly below the 1,500ft contour2.
Montserrat is in a Caribbean Islands Global Biodiversity Hotspot and part of the Lesser Antilles Endemic
Bird Area. Montserrat supports a number of rare species including the endemic Montserrat Oriole, one of
the rarest birds in the world. Overall, Montserrat has 3 Important Bird Areas and 2 proposed Ramsar sites,
supporting 4 plant, 1 reptile, 1 amphibian, 4 bat, 4 turtle and 2 bird species of global conservation concern,
several of which are endemic species (Rayment, 2007)3. There are 12 restricted range birds on Montserrat,
present in the Centre Hills forest, and the Important Bird Areas (IBA) identified in the rest of the island,
which make up 474 ha outside the 1,500ft contour used to estimate the protected area of forest. Key
species for biodiversity conservation, such as Montserrat Oriole (the national bird), turtles and Mountain
Chicken, are also of high cultural importance.
The intactness of forest habitat can be measured from earth observation data. The Forest above the
estimated 1,500 feet protected area boundary, is over 92.5% forest, with a further 7.45% covered by Ghauts
and Scrub. Thus, less than 0.05% of the protected area of forest is bare, cultivated or developed.
The canopy density can be assessed for each forest type shown in Figure 4.1. Variation can be measured
relative to the average density within each forest type4. The dry forest, dry scrub, dry thicket, elfin woodland,
mesic forest and wet forest habitats, which collectively cover 60% of the island, all have between 2% and
4% of their area with canopy density 1 standard deviation or more from the mean. Overall the high degree
of forest coverage in the protected area, and the low level of variation in canopy density indicate a high
degree of habitat intactness.
The quality of the marine environment is harder to assess. Discussions with divers suggest it is still of
relatively high quality for the Caribbean region. The marine environment is however known to be impacted
by invasive species (e.g. lionfish), sediment plumes and litter.
There are currently no designations in the marine environment. The Blue Halo project led by the Waitt
Institute has been undertaking consultations on a Marine Spatial Plan for Montserrat, including proposed
boundaries for marine protected areas. The extent and condition of marine habitats, and the quantity and
values of ecosystem services flows from the marine environment, are important evidence to take into
account when devising this Plan and protected area boundaries.
Sediment plumes are a natural phenomenon given the extensive deposits of volcanic ash and mud.
However, they could be exacerbated by increasing runoff rates, for example due to increased precipitation
from climate change or any loss of vegetation cover.
Plastic litter can enter the marine environment from sources on Montserrat or elsewhere. Some litter is
2 See: https://www.protectedplanet.net/centre-hills-protected-forest-area 3 Rayment (2007) Costing Biodiversity Priorities in the UK Overseas Territories, RSPB. Annex 10: Montserrat. 4 Forest canopy density values are derived by calculation of Advanced Vegetation Index (AVI), Bare Soil Index (BSI) and Canopy
Shadow Index (SI) of Pleiades imagery following the method of Banerjee et. al. (2014). These are image algorithm values: it has not been possible to calibrate these values to actual canopy density due to insufficient field data. However, the values can be used to compare relative canopy density between habitat classes, and to analyse change over time. Average canopy density values are derived from image objects (habitat polygons) rather than per pixel.

A National Ecosystem Assessment of Montserrat: phase II
Final Report | June 2019 Page 15
known to enter via the ghauts, with increased risks of litter being washed into the sea during heavy rainfall
events. Table 4.2 displays the mass of debris collected at two sites on Montserrat on dive trips between
2015 and 2017. A breakdown of the type of debris (e.g. plastic bags, plastic bottles) collected during each
dive is also available through the Project AWARE website5.
Table 4.2: Mass of debris extracted at two Montserrat sites
Location Number of
Dives
Total Debris
Collected (lb)
Total Debris
Collected (kg)
Debris Collected
per Dive (kg)
Carr’s Bay 27 1,480 671 25
Little Bay Jetty 3 66 30 10
Total 30 1,546 701 23
Source: Project AWARE – Dive against Debris
5 https://www.projectaware.org/diveagainstdebris

A National Ecosystem Assessment of Montserrat: phase II
Final Report | June 2019 Page 16
5. ECOSYSTEM SERVICES ON MONTSERRAT
This Section describes the measurement and valuation of the key ecosystem services, with the following
goods and services assessed:
• Water,
• Food – Fisheries, Food from Land (Agriculture and trees), Livestock production;
• Minerals;
• Tourism,
• Cultural services,
• Carbon sequestration; and,
• Hydrological regulation.
The most significant omission is of timber: although trees cannot be felled from the protected area of
forest, wood can be sourced from fallen trees, and may be extracted from other areas of trees on the island.
5.1 Water
Information on water consumption and production is recorded by Montserrat Utilities Limited (MUL).
Production levels are recorded at seven springs every month in gallons. All the springs are located in or
adjacent to the Centre Hills. These figures have been totalled giving estimated water production on
Montserrat of 178 million gallons (807,989 m3) per year.
Water consumption on Montserrat is recorded at 99,083,000 gallons per year (450,440 m3) for both
residential and non-residential users. However, this does not include some local water supplies such as
sources used for irrigation by farmers. Water prices vary between commercial and residential properties
and by the volume of water consumed (on an escalating scale). The average price of water consumption is
estimated at around XCD 27.96 (2018 prices) per thousand gallons used for private users. This suggests a
market value for water consumption at around XCD 2.77 million, annually.
Water supply has also been valued by (van Beukering, et al., 2008, pp. 41-45) study on the Centre Hills
protected area of forest. They estimated the annual benefits of water supply as XCD 1,134,000 in 2008,
representing an annual replacement cost. The study based this value on the annual volume of water
produced by springs in the Centre Hills which was recorded at 665 million litres, or 146 million gallons.
However, it noted that the actual volume used was around 523 million litres per year, or roughly 117 million
gallons.
The water volumes recorded by Montserrat Utilities Limited and (van Beukering, et al., 2008) are of a similar
order of magnitude. Van Beukering et al.’s estimated monetary value is lower. This is probably because it
uses a replacement cost method rather than market prices, and also possibly because it measures water
supply differently, and/or it is restricted to the Centre Hills, with some of MUL’s abstraction points lying just
outside the Centre Hills boundary. The MUL market value also captures some added value from the pipes
and other equipment that supply the water to consumers.
A National Ecosystem Assessment of Montserrat: phase II
Final Report | June 2019 Page 17
5.2 Fisheries
Local fisheries provide sustenance for the people of Montserrat. The fishing fleet provides fish both for
consumption by others on the island (providing income for the fishermen), and subsistence for the
fishermen themselves. Fishing occurs along the reefs as well as on the coastal and open ocean pelagic
zones, with reef fishing being the most common type due to the reef’s proximity and also the higher value
of some of the fish. The assessment of the value of fishing to Montserrat covers both the subsistence value
of the fish kept for consumption by the fishermen, and the volume and value of fish sold on the island (i.e.
market value).
Montserrat fisheries have been valued in several studies, most notably by a student thesis supervised by
the Wolf's Company (Fraga Coiro, 2017; Wolfs Company, 2017) and research undertaken by JNCC (2017,
pers com)6. The literature identifies fish species groupings, the local price of fish and the mass of fish
landings by species group. Fraga (2017) identified three main groups of fish species: reef, coastal pelagic
and ocean pelagic.
The study conducted by the Wolf’s Company and Fraga quotes that of the total fish haul of 27,373 kg in
2016, 13,903 kg were reef species (51%) with the remainder coastal (46%) and ocean (3%) pelagic species.
The study also reports recently stable average market prices at XCD 22.00 per kg or XCD 10 per lb for reef
and ocean pelagic species and XCD 17.60 per kg or XCD 8 per lb for coastal pelagic species. By analysing
volume by market price, the Wolf’s Company report (2017) finds that 56% of total revenue was from reef
landings, with 40% from coastal pelagic and 4% open pelagic. The different prices explain much of the
revenue difference between reef and coastal landings. Costs to fishermen can be taken into account to
estimate the valued added in each fishery. This changes their relative importance, with 16% of net value
added from reef landings, 82% from coastal pelagic landings and 2% from ocean pelagic landings. Fraga
(2017) also finds considerable value added through upstream economic activity (i.e. restaurants). This value
added includes purchases by tourists, which are part of the tourism expenditure figures in Section 5.6.
Another report by the Overseas Countries and Territories Innovation Project (2017) divides the fisheries in
a different way, finding that 92% of the fish haul comes from reef and small pelagic fisheries, with 6%
coming from deep slope fisheries and other fisheries, and 2% coming from the offshore pelagic fishery.
The report also finds that 30% to 40% of fish consumed in Montserrat come from local fishers, the rest
being imported. The study found an average catch per trip of 50 kg to 70 kg, and 155 people employed as
fishermen or in fisheries dependent activities, though not all are full time employed.
The field study conducted by JNCC surveyed the volume of fish sold and consumed, as well as market prices
paid for fish by local restaurants. This data source is thought to be the most robust and is used as the basis
for the fishery ecosystem service within this study. As previously stated, Fraga (2017) notes that the market
prices have remained stable over time. The price of fish has not changed over a decade remaining constant
at around XCD 10 per lb, however some of the divers and spear fishers do sell certain species (e.g. lionfish)
at up to XCD 14 per lb7.
As part of the JNCC field study, restaurants on Montserrat were surveyed to determine how many pounds
6 JNCC, 2017. Field study – data provided by JNCC including transcripts from fishermen and restaurant surveys. 7 JNCC, pers com.

A National Ecosystem Assessment of Montserrat: phase II
Final Report | June 2019 Page 18
of local fish per week they purchase, the main local species and the average price they paid per pound.
Taking the average across the prices paid per pound by each restaurant leads to an average price of fish of
XCD 10.83 per lb (2018 prices). This average is based on 10 respondents and is an average price for all
species of fish bought from local sellers (i.e. there is no differentiation between reef fish species or lobster
and lion fish, wahoo or snapper). As the JNCC field study forms the basis of the fisheries analysis presented,
this average price is used to value the subsistence and market value of fisheries on Montserrat.
In regard to the value of the subsistence catch, a methodology produced by the World Bank8 suggests that
the value of subsistence catch can be estimated by the market price of a substitute which would provide
the same calorific and nutritional content. As a high-level estimate, in this case it is reasonable to assume
that the replacement for fish caught for personal consumption would be with fish bought at the market
rate, thus the same valuation approach can be applied to both consumer and subsistence landings.
Based on the JNCC field survey, by extrapolating the estimates of weekly landings to annual values gives
143,530 lb (65,241 kg) per year, with a market value of XCD 1.5 million per year for fish sold. For subsistence,
a market value of fish landings used for personal consumption of 23,390 lb (10,632 kg) per year, and a total
value of XCD 250,813 per year. These values are based on the assumption of 39 fishing weeks per year, to
account for the lack of activity as a result of weather conditions and other factors. These results are
summarised in Table 5.1 below.
Table 5.1: Annual value of Montserrat fisheries in 2018 XCD
Sold on Market Subsistence
Catch per week (lbs) 3,680 600
Catch per year (lbs) 143,350 23,390
Total volume of fish (lbs/year) 166,920
XCD/week $39,560 $6,432
XCD/year $1,536,7129 $250,740
Total annual value of fisheries (XCD) $1,787,452
Applying the revenue proportions between the different fisheries as found in the Fraga thesis (2017) and
OCTA (2017), gives the overall fisheries values found in Table 5.2.
Table 5.2: Comparison of annual value of Montserrat fisheries in 2018 XCD
Fishery
Value – Wolf’s
Company and
Fraga catch data
Value – JNCC catch
data (OCTA
proportions)
Value – JNCC catch
data (Fraga thesis
proportions)
Value – JNCC catch
data (averaged
proportions)
Reef/Small pelagic 302,923 1,646,689 1,002,333 1,324,511
Deep slope/
Coastal pelagic 218,200 107,393 715,952 411,672
Offshore/Ocean
pelagic 20,744 35,798 71,595 53,696
8 World Bank. Economic Valuation of Subsistence Fisheries. Retrieved from:
http://siteresources.worldbank.org/INTPACIFICISLANDS/Resources/3-Annexes.pdf 9 This measure of the value of fisheries is the best measure to include in Montserrat’s GDP.

A National Ecosystem Assessment of Montserrat: phase II
Final Report | June 2019 Page 19
5.3 Food from Land
Agricultural activities on Montserrat include: Vegetable crop production; Livestock production (Goat, Sheep
and Pig rearing); Poultry production (broiler and eggs); Animal slaughtering/ Processing; and, Agro
Processing (Cassava, jams, jellies, hot pepper sauce, and wines).
Areas used for agricultural production are fragmented and hard to measure from the earth observation
mapping. This identifies 755 acres (302 ha) of land that is either cultivated or otherwise disturbed ground,
including land that is known to be uncultivated (e.g. land around the runway at the airfield). Within the 755
acres, there are 76 acres (31 ha) that are more confidently identified as cultivated land based on correlation
of satellite data with land use planning records, including in two districts, Blakes Estate and Duck Pond,
which are the main areas of agricultural activity.
The area of agricultural land is estimated from the 43.2 ha of cultivated or disturbed ground in Blakes Estate
and Duck Pond, plus the 24.9ha of cultivated or otherwise disturbed ground in other districts that matches
planning records of agricultural activity. This gives an estimated cultivated area of 168 acres (68 ha). This
land is leased to farmers, some from private owners and some from public bodies (such as Government
lands and a portion of the Montserrat Company lands).
The volume and value of food production from on Montserrat is captured in livestock and crop production
and value data collected by the Ministry of Agriculture. These data are included in the account spreadsheet,
giving much better coverage of this service than provided in the Phase I report. The total annual value of
production is estimated to be XCD 0.5million for agricultural crops, and XCD 1.65million for meat (2018
prices).
Part of food production on Montserrat is from fruiting trees. Fruiting trees are clustered in plantations and
can be found scattered across the island in the forest and in private gardens – nearly every garden has fruit
trees and a patch to grow a few vegetables. Fruits harvested include, but are not limited to, coconuts,
mangoes, papaya, breadfruit and breadnut10. Certain fruits are also used to make jams and jellies11. These
products are covered in the Ministry of Agriculture data, but it is not known whether these capture
production from back yard or other scattered trees for households’ own consumption.
The harvest from the forest and private gardens that produce fruits and other foods (e.g. breadfruit,
coconut) are probably quite an important source of sustenance and income for some people on the island.
Produce is often sold through an informal roadside economy. An example of their value is that each forest
coconut tree might be harvested twice per year, producing 25 coconuts each time, i.e. 50 coconuts per year.
Each coconut is sold for 2-5 XCD, giving a value of 100 – 250 XCD per tree per year. There are estimated to
potentially be 1,000’s of accessible coconut trees on the island, with the capacity to support 20 - 30
livelihoods. Trees in private gardens have been bolstered by the distribution of over 1,000 fruit trees per
year for more than two decades. Along with forest trees they can be an important food source when
conditions for agricultural crops are poor, contributing to the resilience of the island.
10 Source: Montserrat National Trust. 11 Source: Montserrat Department of Agriculture.

A National Ecosystem Assessment of Montserrat: phase II
Final Report | June 2019 Page 20
5.4 Minerals
Sand and gravel are extracted in the south of island and are used for construction on-island or exported.
Total extraction is not known, but the majority is exported, and the Montserrat Port Authority collects
monthly data on the net weight of sand and aggregate exports (tonnes) and their corresponding customs
value (XCD).
In 2017, 512,000 tonnes of sand were exported, and aggregate exports totalled 495,000 tonnes. The
customs value for these exports was recorded as XCD 7.04 million for sand (XCD 6.95 million in 2018 prices)
and XCD 1.78 million for aggregates (XCD 1.76 in 2018 prices), giving total exports of XCD 8.82 million in
2017 (XCD 8.71 million in 2018 prices).
5.5 Tourism
Montserrat attracts tourists through its culture and natural environment. Within this, the single biggest
attraction is the volcano. Other key features of Montserrat are: Hiking/ the Forest/ Nature; and the Sea
(Beach/ Diving/ Fishing). When people stay for several days, they usually do a combination of these things.
Visitors provide important trade for restaurants on the island, which offer the opportunity to eat fresh,
locally caught fish.
The Montserrat Tourism Division recorded tourist arrivals 2015 and 2016. Excluding visitors who stated
their purpose as visiting friends/relatives, and business travellers, the total number of leisure visitors in
2016 is estimated to be 9,293. The value uses in the account for this benefit is total visitor expenditure,
which in 2016 was reported to be around XCD 22.8 million (2018 prices), indicating that total expenditure
per visitor in 2016 was approximately XCD 2,451 (2018 prices). Data are collected on tourist’s place of stay,
mode of travel and visitor type, and the purpose of visitors, tourists and excursions visits. Place of stay of
tourists for whom this data was collected is shown in Table 5.3.
The large proportion of visitors in ‘Private homes’ is linked to Montserrat having several hundred (perhaps
350) villas that are lived in for several weeks or months during the winter. There is a rental market for these
properties, but many of these villas are privately owned – the mix of national and overseas ownership is
not known. They provide employment for cleaners/ gardeners, but levels of expenditure by people using
them are not known. The stay-over visitor exit survey report (Montserrat Tourism Division, 2011) highlights
that villas and bed and breakfasts and apartments were the most common accommodation types used.
Fewer visitors stayed with friends and relatives.
Table 5.3: Tourist arrivals by place of stay
Place of Stay 2015 2016
Private Home 5,213 5,636
Hotel 721 682
Guest House 1,933 1,606
Apartment 330 576
Villa 665 198
Bed & Breakfast 52 36
Other 30 0

A National Ecosystem Assessment of Montserrat: phase II
Final Report | June 2019 Page 21
TOTAL 8,944 8,734
Source: Montserrat Tourism Division.
The report also gives details on the purpose of respondents’ visits, average length of stay and type of
accommodation. Exit survey respondents were also asked to rate tourism activities and tourism services
on a scale of 1-5. The activities rated were volcano watching, bird watching, festival and event, hiking, and
diving and snorkelling. During the survey period, volcano watching received the highest rating (4.2 – very
good) whilst diving and snorkelling was the lowest (3.8 – good).
There are several specific services provided to tourists on Montserrat, such as nature-guiding, volcano
helicopter tours, and diving/snorkelling. For example, Scuba Montserrat makes about 100 boat trips, for
approximately 375-400 people, each year.
Van Beukering et al. (2008) based their estimates of tourism expenditure on 7,746 tourists in 2007, with
average expenditure per visitor of XCD 2,595. They found that average expenditure (estimated based on
an average length of stay of 10.6 days) of XCD 245 per day, with the main expense for tourists being
accommodation. They estimated total annual value of tourism profits attributable to the Centre Hills as
XCD 1.2 million annually.
5.6 Cultural Services
Cultural services include recreational activities, aesthetic value and knowledge of species conservation.
Cultural values for visitors are partly reflected in tourism values (above). While there is limited research on
Montserrat regarding cultural services, Van Beukering et al. (2008)12 do specifically attempt to value them
for the Centre Hills, which are a prominent feature of Montserrat’s natural capital.
Van Beukering et al. adopted a choice experiment13 approach to evaluate cultural services from the Centre
Hills. A choice modelling exercise, whereby relative values are assigned based on stated preferences for
various packages of attributes, was developed and administered to 342 islanders. The exercise used
attributes for forest cover, wildlife abundance (biodiversity), control of invasive species, trail maintenance
and income tax. Various scenarios were tested for respondent’s preferences, and the relative importance
of the attributes was statistically determined.
As impact on income tax was included within the choice experiment as a numerical value, the relative
preference amongst the attributes can be compared with the financial value of the change in income tax
to assign a relative financial value to the different attributes weighted by respondent’s preferences. The
values are determined on a per household (HH) basis.
The study uses the attribute of trail maintenance as a proxy for recreational value, and values it as the
Willingness to Pay (WTP) to increase trail quality from medium to high. The attribute for quality of forest
cover is used as proxy for aesthetic value, and the value relates to the WTP to avoid a decline in forest cover
quality from high to medium. The attribute of mean species abundance is used to measure biodiversity,
with the value applied as the WTP to improve from a situation in which unique wildlife species are
12 Van Beukering et al (2008) Economic valuation of the Centre Hills, Montserrat. 13 Van Beukering et al. (2008) describes choice experiments as a survey-based method that asks respondents their willingness to pay
for environmental goods that are not traded in markets.

A National Ecosystem Assessment of Montserrat: phase II
Final Report | June 2019 Page 22
endangered to a situation with abundant species populations. The household willingness to pay values per
year, adjusted to 2018 prices, are presented in Table 5.4.
Table 5.4: Willingness to pay of Montserratians for cultural benefits
Benefit WTP (2018
XCD14) Unit
Recreation 102 HH WTP per year to increase trail maintenance from medium to
high
Aesthetic quality 45 HH WTP per year to avoid decline from high quality forest cover
to medium quality of forest cover
Species abundance 120 HH WTP per year to improve from unique wildlife species
endangered to abundant species populations
Source: Van Beukering et al. (2008). (HH – household, WTP Willingness to pay)
These values are applied to the number of households on Montserrat to determine the overall value to the
island. In 2018, Montserrat had a population of 5,21615, and an average household size of 2.016, giving an
estimated number of households at 2,608. The estimated annual values for cultural benefits, adjusted to
2018 prices, are presented in Table 5.5.
Table 5.5: Estimated annual value of cultural benefits to Montserrat.
Benefit Value (2018 XCD17) Unit
Recreation 266,025 HH WTP per year to increase trail maintenance from medium to
high
Aesthetic quality 117,364 HH WTP per year to avoid decline from high quality forest cover
to medium quality forest cover
Species abundance 312,971 HH WTP per year to improve from unique wildlife species
endangered to abundant species populations
The values in Table 5.5 do not capture all cultural services, such as spiritual experience and sense of place,
although there is likely some overlap between these benefits and those that are valued. The overall value
for recreational, aesthetic and species conservation cultural services is estimated at XCD 697,000 per year.
5.7 Hydrological Regulation
Habitats on Montserrat regulate hydrology in several ways. Assessment of these services on Montserrat
has modelled runoff regulation, which mitigates flood and erosion risk, taking into account slope and
vegetation cover18., to give analysis of:
• Flow accumulation;
• Areas liable to flood, which reflects both runoff modelling, and further modelling of the role of
reefs is absorbing wave energy during storms.;
14 Van Beukering et al. (2008) values have been uplifted to 2018 using the Consumer Price Inflation for Caribbean
Small States (CSS) from the World Bank’s World Development Indicators. 15 United Nations statistics retrieved from: http://www.worldometers.info/world-population/montserrat-population/ 16 UN, 2017. Household Size and Composition Around the World. Retrieved from:
http://www.un.org/en/development/desa/population/publications/pdf/ageing/household_size_and_composition_ar
ound_the_world_2017_data_booklet.pdf 17 Van Beukering et al. (2008) values have been uplifted to 2018 using the Consumer Price Inflation for Caribbean Small States (CSS)
from the World Bank’s World Development Indicators. 18 The modelling uses habitat properties gathered by the Natural Capital Project, Stanford University, and island land cover data.

A National Ecosystem Assessment of Montserrat: phase II
Final Report | June 2019 Page 23
• Flooding mitigation, and
• Erosion control.
The maps cover both the ‘provision’ of these services, and the ‘solution’ which represents the optimal areas
to increase them. There are also maps showing overall provision and solution, which combines assessment
of flood mitigation and erosion control. This has resulted in 22 maps of these services19.
The mapped results have been generated for the whole island. However, as the results are relative across
the island (comparing different areas of the island to each other), the volcanic deposits in the south of the
island distort the results, for example due to the very high erosion risk on poorly consolidated ash.
Therefore, the analysis has also been re-run on the northern half of the island, which covers the centre hills
forests and developed areas where these regulating services have more direct effects on human welfare20.
The modelling shows areas which are most liable to flooding. This includes some areas on the coast where
during storms water will pool behind existing flood defences, which could also coincide with areas
inundated with sea surge flooding during an extreme event.
The modelling of erosion control shows similar patterns to flow accumulation. However, erosions risks arise
when there is greater build-up of overland water flow. Therefore, the area identified as at risk of soil erosion
is not as extensive at the area at risk from surface flow accumulation. This can be observed in the more
extensive areas of white around the centre hills. This reflects the soil protection function of the forest cover,
both with the forest and to down-slope areas.
The modelling presented in the maps illustrates the following patterns in hydrological regulating services
on Montserrat:
• The forests of the centre hills have highest value in terms of erosion mitigation service and overall
hydrological regulation.
• The area at risk of soil erosion is lower than the area of surface flow accumulation risk. However,
the consequences of soil erosion, including loss of fertile agricultural soils and soil destabilisation
(potential risk of landslides) may be more severe than for flow accumulation.
• There are opportunities for habitat creation on the coastline to buffer sediment runoff into the
sea. This could help protect the reef and seagrass areas in Montserrat’s waters from
sedimentation.
• There is generally lower service provision on the coast as there is less property and land that is
protected downstream.
The ‘solution’ areas in the erosion risk model identify different types of intervention, as show on the map
key: Slow flows (e.g. through woodland planting); Retain water to prevent flow accumulation in soil (e.g.
through wetland habitats); and Protect soil by binding it (e.g. through establishing grassland).
Figure 5.1 shows the accumulation of erosion risk for the north of the island, and Figure 5.2 shows the
relative provision of erosion control services to the landscape by each map pixel, ranked relative to all other
19 Currently available at: https://www.dropbox.com/sh/lobd79qm7zzktz4/AAD2rJ3RaZPl_iA0u5uK-BBoa?dl=0 20 The boundary of these maps is defined through the island’s districts with a resident population.

A National Ecosystem Assessment of Montserrat: phase II
Final Report | June 2019 Page 24
pixels.
The flow accumulation map in Figure 5.1 is a generalisation of the number of up-slope areas flowing into
each pixel. It is simply a guide to where the main flow paths exist for any surface flow, so judgments on
risks of erosion are indicated, but need further work to be conclusively identified. These maps form a basis
to develop understanding of how development decisions and run-off will impact on infrastructure, water
supplies and the wider environment during storm events.
Figure 5.1: Erosion Risk Accumulation on North Montserrat

A National Ecosystem Assessment of Montserrat: phase II
Final Report | June 2019 Page 25
Figure 5.2 Erosion Control Service Provision on North Montserrat
This mapped information provides an important input to future land use planning on Montserrat, including
identification of the highest-risk areas for flow accumulation and soil erosion. In these areas further
development should be carefully scrutinised for resilience for these risks, and mitigating actions (e.g.
appropriate tree planting) should be considered to protect existing or future developments.
The data that can be produced from the modelling have limitations due to lack of soils data for the island.
These limitations mean there is a moderate level of uncertainty with the results, and also prevents detailed
modelling of the marginal impact of the presence of vegetation on flood and soil erosion risk. This means
that the results cannot be connected to specific impacts on property or infrastructure, or any economic
valuation in monetary terms. Those using the data should be aware of the limitations of the modelling and
use the results in combination with local knowledge.
Although monetary valuation cannot be made, indicators for these services can be quantified. Risk to
infrastructure can be quantified with respect to the roads network, which is key infrastructure and common
to all developed areas. The erosion risk modelling has been analysed across 1 ha pixels for the north of the
island. Approximately 1,050 pixels that contain part of the road network have been identified. Of these, 223
pixels (21.2%) that have at least a 10-times higher than average erosion risk are shown in Figure 5.3. Most
of the cells identified have 10 – 100 times higher risk (yellow), but a handful of cells have 100 – 400 times
higher risk (orange), and 400 – 1,000 times higher risk (red) respectively.
These cells indicate the largest risks to the road network. These risk data can be added to the physical flow
data in the Montserrat ecosystem services account. The analysis to generate these data can be repeated

A National Ecosystem Assessment of Montserrat: phase II
Final Report | June 2019 Page 26
as vegetation and the roads network change, thereby providing an indicator of whether erosion risk to the
road network is increasing or decreasing over time. These data should be calculated in future relative to
the 2018 median used here, to provide a meaningful comparison over time.
Figure 5.3 Erosion risk to roads on Montserrat
5.8 Carbon Sequestration
Expert advice (including from CEH) has been obtained and literature consulted to identify suitable
assumptions for carbon sequestration rates in Montserrat’s forests, scrub and seagrass beds. Using these
sequestration rates an estimate of annual sequestration has been calculated and valued using the UK
Government central non-traded price of carbon.
An estimated 19,500 tonnes of Carbon are sequestered into habitats on Montserrat each year. This carbon
has a value of XCD 4.5million per year based on UK Government non-traded price in 2018. This price is
derived from costs in the UK, and therefore can be adjusted to a more relevant level for Montserrat based
on the ratio between UK and Monserrat GDP per capita in 2016 (the last year of available data). This gives
an estimated value of XCD 1.3 million per year.

A National Ecosystem Assessment of Montserrat: phase II
Final Report | June 2019 Page 27
6. CONCLUSIONS
This Section summarises the key results and observations from the work.
6.1 Ecosystem Services
A summary of the ecosystem services measures and valued in Section 5 is provided in Table 6.1.
Table 6.1: Estimated Ecosystem Services on Montserrat
Ecosystem
service Annual Measure of Benefit
Estimated Value
XCD/yr. Type of Value
Water 99 million gallons consumed 2.7 million Price of water sold to
households and businesses
Fish 166,920 lb fish landed 1.8 million Total landings valued at average
sale price
Agriculture 112,780 lb crops 0.5 million
Market price of agricultural
produce
188,515 lb meat 1.7 million Market price for meat
Minerals 1.01 million tonnes exported 8.8 million Value recorded by customs
Tourism 9,293 tourist visits 22.8 million Estimated expenditures
Cultural Recreation, aesthetics & species
conservation 0.7 million
Willingness to Pay (wellbeing
from conserving the Centre
Hills)
Carbon
Sequestration 19,515 tCO2e 1.3 million
Government price for carbon
(central, non-traded)
Flood Hazard
Regulation
TBC
Run-off 21.2% of roads network has
erosion risk 10x > than average
Modelling of risk to roads
network
TOTAL - 40.4 million Mix of value types
It should be noted that limits on available data mean the values identified in Section 5 and summarised in
Table 6.1, include a mix of different measures of economic value. The uncertainty associated with each
measure is indicated by the following colour coding in Table 6.1, and the uncertainties in several key values
means that the total estimated values have a moderate degree of uncertainty.
High uncertainty
Moderate uncertainty
Low uncertainty
Low uncertainty reflects confidence in the evidence to support decisions. Very high uncertainty reflects
results that may be inaccurate by more than an order of magnitude. Note that some data may be marked
as ‘moderate’ uncertainty where the data used are themselves accurate, but do not provide a full measure
of the services’ value.
Different groups of people can benefit from different ecosystem services. The beneficiaries for the main
services are summarised in Table 6.2. In a small-island economy like Montserrat’s, all activities have some
linkage and inter-dependence. For example, while export of minerals directly generates income for
extractors, this also supports demand for other products on the island when employees spend money on
produce such as fish. A fuller assessment of the impacts of different activities across society would require
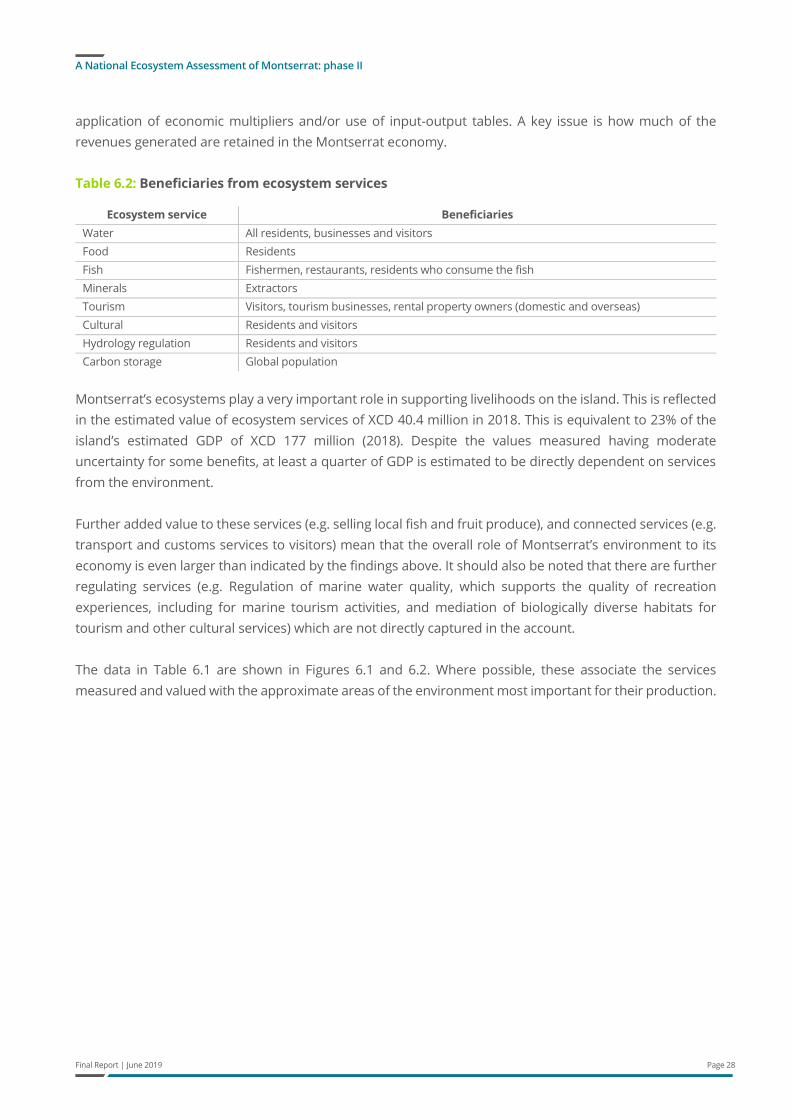
A National Ecosystem Assessment of Montserrat: phase II
Final Report | June 2019 Page 28
application of economic multipliers and/or use of input-output tables. A key issue is how much of the
revenues generated are retained in the Montserrat economy.
Table 6.2: Beneficiaries from ecosystem services
Ecosystem service Beneficiaries
Water All residents, businesses and visitors
Food Residents
Fish Fishermen, restaurants, residents who consume the fish
Minerals Extractors
Tourism Visitors, tourism businesses, rental property owners (domestic and overseas)
Cultural Residents and visitors
Hydrology regulation Residents and visitors
Carbon storage Global population
Montserrat’s ecosystems play a very important role in supporting livelihoods on the island. This is reflected
in the estimated value of ecosystem services of XCD 40.4 million in 2018. This is equivalent to 23% of the
island’s estimated GDP of XCD 177 million (2018). Despite the values measured having moderate
uncertainty for some benefits, at least a quarter of GDP is estimated to be directly dependent on services
from the environment.
Further added value to these services (e.g. selling local fish and fruit produce), and connected services (e.g.
transport and customs services to visitors) mean that the overall role of Montserrat’s environment to its
economy is even larger than indicated by the findings above. It should also be noted that there are further
regulating services (e.g. Regulation of marine water quality, which supports the quality of recreation
experiences, including for marine tourism activities, and mediation of biologically diverse habitats for
tourism and other cultural services) which are not directly captured in the account.
The data in Table 6.1 are shown in Figures 6.1 and 6.2. Where possible, these associate the services
measured and valued with the approximate areas of the environment most important for their production.

A National Ecosystem Assessment of Montserrat: phase II
Final Report | June 2019 Page 29
Figure 6.1: Montserrat Ecosystem Service - Physical Amount, 2018

A National Ecosystem Assessment of Montserrat: phase II
Final Report | June 2019 Page 30
Figure 6.2: Montserrat Ecosystem Services - Estimated Values, 2018

A National Ecosystem Assessment of Montserrat: phase II
Final Report | June 2019 Page 31
6.2 Value of Montserrat’s Natural Capital
The benefits described in Section 6.1 are annual flows. Having identified their importance, a key question
is whether these flows can be sustained into the future. This will depend on the health of the underlying
assets that provide them – natural capital.
Table 6.3 shows the present value of the services valued in Table 6.2. The present values are calculated
using UK Treasury Green Book guidance:
• Values are calculated over 25 years, and most annual service levels and values are assumed to be
maintained. Therefore, trends over time, such as due to population of tourism change are not
accounted for. The UK non-traded price of carbon, used to value sequestration, increases over time,
which results in a higher natural capital asset value for this benefit than if the value were constant.
• A shorter time-period would usually be used for a non-renewable resource such as minerals.
However, large volumes of mineral deposits were generated by the volcano, and these are regularly
washed to accessible locations by heavy rains. Therefore, the availability of accessible minerals
resources into the future seems reliable, and present values are also calculated over 25 years.
• The UK Government recommended discount rate is used, of 3.5%.
It should be noted that these values have the same mix of economic data as described in Table 6.1, so
similar caveats apply. Also, the full value of Montserrat’s natural capital would include the value of
regulating services.
Table 6.3: Estimated Natural Capital Asset Values for Montserrat
Ecosystem service Natural Capital Asset Present Value XCD*
Water Centre Hills forest 47.26 million
Fish Marine environment, reefs 30.85 million
Agriculture Whole island (crops) 7.82 million
Whole island (livestock) 28.18 million
Minerals Mineral reserves 31 million
Tourism Whole island (Volcano/ Forest/ Sea) 389.49 million
Cultural Centre Hills 12.19 million
Carbon storage Forest, Scrub and seagrass 31.39 million
Hydrology regulating services Not estimated
TOTAL - 578.6 million
*Values over 25 years
The extent and condition, physical flows and monetary values in this report can input to a natural capital
account for Montserrat, based on UK national natural capital accounting guidelines21. Publication of partial
accounts should be done with appropriate caveats. Otherwise it can risk prioritisation of the services and
assets valued, at the expense of other important services/ values not yet covered. This risk needs to be
balanced against those of overlooking the values of provisioning and cultural services identified in the
assessment.
Key gaps in the results reported that could be addressed through future work include:
21 See recent publications at: https://www.ons.gov.uk/economy/nationalaccounts/uksectoraccounts/methodologies/naturalcapital

A National Ecosystem Assessment of Montserrat: phase II
Final Report | June 2019 Page 32
• Alignment of economic data for market goods, either at first sale value, or value-added (after
deducting for costs of production).
• Further consideration of the sustainability of activities (i.e. whether benefits are expected to
continue over time).
• Further evaluation of the resource available to provide potential benefits from renewable energy
resources (Wind, Solar, Geothermal).
• Valuation of hydrological regulating services and mediation of biologically diverse habitats for
tourism and other cultural services.
• Assessment of the informal production of food from fruiting trees taking place on the island.
Due to its status as a small island, barriers exist to the degree to which islanders can interact, economically
and otherwise, with other economies. By necessity there is a high degree of reliance on, and interaction
with, the natural environment. Thus, the value of natural capital to the Montserrat economy should be fully
recognised.
6.3 Natural Capital Indicators
Indicators should be developed to assist the integration of the natural capital into planning and policy
making to improve long-term economic growth, including by:
• Highlighting natural capital dependencies, revenue generated from such dependencies, and
opportunities to generate additional revenue;
• Output indicators to reflect how programmes manage the extent, condition and service flows for
each asset (e.g. forest management and use); and,
• Outcome indicators to link Government programmes to the state of natural capital assets (e.g.
average landing size of key commercial species/ condition of protected areas).
The values in the account help link environmental management to current fiscal planning instruments and
relevant legislation. The ecosystem assessment and values described in Sections 4 and 5 provide data with
which to monitor the state of Montserrat’s environment, and its ability to support people’s wellbeing into
the future. The latter represents its natural capital value. The values calculated, shown in Table 6.1, have
some significant uncertainties. The influence of any updates must be borne in mind if a time-series of
accounts is produced and used to indicate trends in natural capital value.
Therefore, suggested indicators of natural capital relate to specific elements of the assessment, rather than
the overall value shown in the account. Indicators need to inform understanding of key assets and benefits,
but also be practical to collect and interpret consistently over time. Therefore, earth observation-derived
data are a suitable source of indicators. These indicators of the extent and condition of assets, and the
physical and monetary flows of benefits, can help inform future monitoring approaches and policy.
Potential indicators on are described in Table 6.4, followed by notes on their interpretation.

A National Ecosystem Assessment of Montserrat: phase II
Final Report | June 2019 Page 33
Table 6.4: Natural Capital Indicators for Montserrat
Natural Capital Assets - Extent Natural Capital Assets - Condition Benefits flows
Extent of forest types (as shown in
Table 4.1), including: Elfin Woodland,
and Dry, Mesic and Wet Forest that
represent important habitat diversity
for nature conservation
Habitat intactness inside the
protected area of forest and IBA
boundaries. This can be measured
through the % forest cover – which
should be maintained over time
Values of key services, as shown in
Table 6.1
Generation of fiscal revenues from
ecosystem services
Other extent indicators may show the
rate of development for buildings or
agriculture, and the change in habitat
cover on areas of ash/mud.
The volume of fish landings and
average size of fish are partial
indicators of the condition of the
marine environment.
Contribution of ecosystem values to
average GDP per capita
Visitor numbers
Habitat cover in ghauts Erosion risk to roads network
Habitat intactness inside the protected area of forest and IBA boundaries. This can be measured through
the % forest cover – which should be maintained over time. Earth observation data suggest the habitats
above the 1,500 feet contour is over 92.5% forest, with a further 7.45% covered by Ghauts and Scrub. Thus
less than 0.05% of the protected area of forest above 1,500 feet is bare, cultivated or developed. This
indicator could also be extended to include the IBAs.
Extent data are also relevant to marine habitats (e.g. different reefs). The frequency of monitoring for
these habitats is uncertain. Regular monitoring of these habitats is recommended, and this would mean
that a measure of reef extent would be a viable indicator.
Canopy density data needs to be careful interpreted, and should be complemented by field-survey
evidence, such as of tree species diversity:
• Changes in average canopy density over time within each detailed forest habitat will provide an
indicator of whether overall condition is being maintained.
• The % of forest cover with canopy density more than one standard deviation less than the mean
will indicate whether specific areas of forest are being degraded.
• These data can again be subdivided to monitor canopy density within the protected area of forest
and IBA boundaries.
Data on forest cover density within forest types indicates degradation, and risks to services such as
provision of water and the regulation of water quality (see below). Another important indicator of
hydrological services is the habitat cover in the ghauts. Earth observation data suggest that habitats in the
ghauts (measured within 75m of the water course) are 37% forest and 37% scrub, but 10% is
developed/cultivated and a further 10% is bare ground/mud (the remainder is water/ beach). Any reduction
in the vegetation cover percentages in the ghauts would indicate a risk of more rapid runoff and greater
flood hazard.
Indicators of the condition of the marine environment are harder to obtain. A key service is fish
landings, and the volume of landings in itself can be an indicator of the health of fish populations and
hence the marine environment. However, fish landings may increase for a variety of reasons, including
short-term overfishing (implying degradation of the marine environment) or improved marine health that

A National Ecosystem Assessment of Montserrat: phase II
Final Report | June 2019 Page 34
supports more landings. Fish landings per fishing trip are also a useful indicator and can give insight into
the health and sustainability of the fishery. However, both these fishery indicators are sensitive to changes
in technology.
Average size of fish can also be a useful indicator of the fish stock, with low or falling average size indicating
a potentially unsustainable fishery. However, consistent data on fish size need to be gathered to provide
an indicator. The presence of invasive species in the marine environment is another potential indicator of
its condition. However, although invasive species such as Lionfish are known to be present in Montserratian
waters, there are no consistently gathered data to provide an indicator.
The regulation of hazard risk is a key benefit from regulating services. The mapping of erosion risk to the
roads network has identified 223 one-hectare pixels in the north of the island which contain roads and have
a level of erosion risk 10 times greater than the average. Continue to monitor this risk to roads can provide
an indicator of whether land-use change and/or expansion of the road network on Montserrat is increasing
the risk to infrastructure from soil erosion.
6.4 Recommendations
Montserrat’s status as a small island economy creates barriers to how it can interact, economically and
otherwise, with other economies. By necessity there is a high degree of reliance on, and interaction with,
the natural environment - the value of natural capital to the Montserrat economy should be fully recognised
by the Government of Montserrat, in UK overseas territories policies, and by other stakeholders (e.g.
development banks, NGOs).
This report provides a first account of the value of ecosystem services and natural capital for Montserrat.
With awareness of how the data is generated, and in combination with local knowledge, it can be used to
inform decision-making (e.g. land use planning).
Going forward, further work is strongly recommended to:
1. Update the natural capital indicators (see Section 6.3), over time. This requires collation of annual
data from different organisations on Montserrat in a consistent manner using the account structure.
It may also require renewed data collection (e.g. repeating visitor surveys). Doing so will provide a
time series, revealing trends in natural capital that can help inform management and policies on the
island.
2. Address key gaps in the results, through future work including:
o Alignment of economic data for market goods, either at first sale value, or value-added (after
deducting for costs of production).
o Further analysis of cultural services, such as the role of reefs in tourism, and to capture the
cultural value of iconic species (such as turtles, mountain chicken).
o Valuation of regulating services, using more accurate modelling informed by soils data, through
risk to property mitigated.
o Further consideration of the sustainability of activities (i.e. whether benefits are expected to
continue over time) and reflecting this in the present value calculations.

A National Ecosystem Assessment of Montserrat: phase II
Final Report | June 2019 Page 35
o Expanding the account to cover renewable energy sources. This could cover current use of solar
energy (e.g. for water heating) and the potential for any future developments (e.g. wind, solar or
geothermal power).
3. Use the data in this report as a baseline for future annual natural capital accounts. This report has
been compiled from data already being collected by various departments within the Government of
Montserrat. The statistics department should take the lead in consistently collating this data each
year and updating the account.

A National Ecosystem Assessment of Montserrat: phase II
Final Report | June 2019 Page 36
7. REFERENCES
Fraga Coiro, F. (2017). An economic valuation and qualitative analysis of the commercial fishing sector in
Montserrat (Thesis).
JNCC; Montserrat National Trust; Environment Systems. (2018). A National Ecosystem Assessment of the UK
Overseas Territory Montserrat: Earth observation based mapping and interpretation. JNCC. Online on
http://jncc.defra.gov.uk/pdf/ot_nca_sup_cbn_13_mst_nea_eo_may2018.pdf
Overseas Countries and Territories Innovation Project (OCTA). (2017). Montserrat – Marine and Fisheries
Sector. European Commission.
van Beukering, P., Brander, L., Immerzeel, D., Leotaud, N., Mendes, S., van Soesbergen, A., . . . McCauley,
C. (2008). Economic valuation of the Centre Hills, Montserrat. Sandy: The Royal Society for the
Protection of Birds (RSPB).
Wolfs Company. (2017). Memo: Final reporting on project results; Project: A student research on economic
value of the fishing industry.

Final report | June 2018
4 City Road, London EC1Y 2AA
+44 (0) 20 7580 5383
eftec.co.uk
@eftecUK
Recommended