A Metrics-Based Approach to TechnicalDocumentation Quality
Anna Wingkvist∗, Morgan Ericsson†, Rudiger Lincke∗ and Welf Lowe∗∗School of Computer Science, Physics, and Mathematics,
Linnaeus University, SwedenEmail: {anna.wingkvist|rudiger.lincke.|welf.lowe}@lnu.se
†Department of Information Technology,Uppsala University, Sweden
Email: [email protected]
Abstract—Technical documentation is now fully taking the stepfrom stale printed booklets (or electronic versions of these) tointeractive and online versions. This provides opportunities toreconsider how we define and assess the quality of technicaldocumentation. This paper suggests an approach based on theGoal-Question-Metric paradigm: predefined quality goals arecontinuously assessed and visualized by the use of metrics. Totest this approach, we perform two experiments. We adoptwell known software analysis techniques, e.g., clone detectionand test coverage analysis, and assess the quality of two realworld documentations, that of a mobile phone and of (partsof) a warship. The experiments show that quality issues can beidentified and that the approach is promising.
Index Terms—Information Quality, Quality Assurance, Soft-ware Metrics, Documentation
I. INTRODUCTION
The quality of technical documentation and user manuals isan important part of the perceived quality of a product. Whenend users encounter problems or want to learn more about theproduct they turn to its documentation. The documentationconstitutes a first line of support, and it is important that endusers can trust it and get the information they require.
As documentation moves from printed books and bookletsto electronic versions, it is no longer bound to the limitationsof “stale” paper. The electronic version can, for example,include powerful navigation (such as search and hyperlinks),video, or even interactive content. The electronic version alsohas the advantage of being easier to keep up to date.
Electronic versions of the documentation have changed therole of software. Previously, it was used only to produce thedocumentation, but now software is also used to deliver andaccess it, and can even be seen as a part of the documentation,especially in regard of presentation. The technical documen-tation is becoming deeply integrated with the product and theboundary between technical documentation and software isbecoming less and less clear. The car manufacture Hyundai isa recent example where technical documentation has come“alive” in form of a software product. They provide theowner’s manual of one of their car models as an applicationfor the Apple iPad (which is included in the purchase of acar).
As information production and presentation is bound tosoftware systems, the notion of information quality can befurther explored using means of software quality management.The quality of the software used as part of the processes hasa large impact on the perceived quality of the documentation.For example, the quality of the browsers, their search function,or the video codecs largely influences the perception of theinformation presented. Traditional means to manage qualityof software systems involves software analysis and testing.It is natural to extend these approaches to cover quality oftechnical documentation.
We suggest such an approach to assess and assure thequality of technical documentation. Based on our experiencewith measuring software quality [2, 17], we build on theGoal-Question-Metric (GQM) paradigm [4] and suggest ametrics-based quality model. Quantitative metrics are collectedthroughout production and use of the technical documenta-tion. The metrics can together be used to answer operationalquestions regarding quality. The conceptual goals determinethe quality as perceived by the stakeholders. Considering theoutcome, the metrics can also be used to visualize and pinpointquality defects.
We validate our metrics-based approach by two experimentsat companies producing technical documentation. We adapteda number of metrics and assessed the documentation connectedto two products, a mobile phone and a warship.
The rest of the paper is organized as follows. Section IIdiscusses the notion of quality from an information and soft-ware perspective. Section III then defines our quality model fortechnical documentation. Section IV presents the experimentsand Section V concludes the paper.
II. QUALITY
The notion of quality is used in daily language as anintangible trait, something that can be subjectively felt orjudged, but often not exactly measured or weighted. Termslike good or bad quality are intently vague and used with nointention of ever being an exact science. Another issue is thatquality is multidimensional, and includes an object of interest,the viewpoint on that object and the quality attributes attributedto the object. This can make “quality” a confusing concept.
In order to discuss quality, and to be able to assess andimprove it, it has to be defined. Crosby [6] defines quality as“conformance to requirements”. This definition suggests thatthere must exist a set of requirements that are defined in sucha way that they cannot be misunderstood. Something that isof quality conforms to these requirements and anything thatdoes not conform is considered a defect. The requirements arenot to be considered universal, but set by an entity or for asingle product.
Another notion of quality is given by Juran [13] who definesquality as “fitness for use”. This definition considers thecustomers, and the requirements and expectations that theyhave on the product and their use of it. Juran further statesthat since different customers may use the product in differentways, the product must possess multiple elements of fitnessof use. These elements are quality characteristics that can bedivided into parameters.
The two definitions of quality can seem unrelated, but com-plement each other in reality. The demands and expectations ofthe customers guide the requirements set by the producers. So,a conformance to the well motivated requirements generallymeans that the product will be fit for use as well.
Quality assurance and management processes and prac-tices are standardized, e.g., in the ISO 9000 family of stan-dards [12].
A. Software Quality
McCall et al. [18] present a quality model defining elevenquality factors that relate to the three stages of a simplifiedsoftware life-cycle: revision, operation and transition. McCallet al. also define about 22 metrics that are used to measurethe quality of the eleven factors. Several metrics are weightedand used to determine the quality of each factor. Many ofthe metrics are based on checklists and a 0 to 10 scale,which means that they are subjectively measured. This qualitymodel is standardized in ISO/IEC 9126-1:2001 [11]. Qualitymodels also differentiate perspectives, stages or phases. Thereare several aspects of quality and not all of these may beappropriate for all perspectives and phases. McConnell [19]differentiate between internal and external quality, i.e., qualitythat affects the product while produced versus quality when theproduct is in use. These aspects are standardized in ISO/IEC9126, as well.
The model by McCall et al. introduces several importantideas. First, there is not one product quality, but several factorsthat affect the product quality. Second, these factors matterduring different periods of the life cycle. Third, the qualityfactors should be measurable and metrics should be defined.Several modern quality models and metrics suites exist, suchas those by Li and Henry [16], Chidamber and Kemerer[5], Abreu [1], and Henderson-Sellers [10]. There are severalstudies that validate the claim that metrics can be used as anindicator of the quality of software, for example Basili et al.[3] and Harrison et al. [9].
B. Information Quality
Building on Juran [13], Wang and Strong [22] define IQ asfitness for use by information consumers. However, Klein et al.[15] shows that information consumers have trouble pointingout and detecting errors in information and altering the waythey use it. Hence, placing all the responsibility on a user isnot appropriate. In response to this, Kahn et al. [14] suggestsa view where quality also depends on conforming to spec-ifications or requirements (adopted from Crosby [6]). Thesetwo views are called user perspective and data perspective,respectively.
In the process of assessing IQ, Ge and Helfert [8] classifiedtypical IQ problems in a two by two model distinguish-ing user and data perspective, and context-independent andcontext-dependent aspects, respectively (see Table I). Theuser perspective/context-independent quadrant indicates IQproblems that may happen while processing the information.The user perspective/context-dependent quadrant indicates IQproblems that are due to unfitness for the intended use by infor-mation consumers. The data perspective/context-independentquadrant indicates IQ problems in the content managementsystems (CMS). These IQ problems can be applied to any dataset. The data perspective/context-dependent quadrant indicatesIQ problems due to violation of business specifications. TheseIQ problems can be detected by contextual rules.
This assessment method of IQ is inherently subjectiveand not automated. To the best of our knowledge, unlikein software quality assessment, automated measurement andtesting method do not exist for the assessment of IQ. For ex-ample, SQuaRE (Software Product Quality Requirements andEvaluation) uses the software quality model of ISO/IEC 9126-1:2001 and distinguishes the software quality (ISO/IEC 25010)from the data quality (ISO/IEC 25010) of an informationsystem. However, while data quality affects the informationquality, they are not the same. The goal of this paper is toadapt automated methods known from software measurementand testing to the assessment of IQ.
III. A QUALITY MODEL FOR TECHNICALDOCUMENTATION
Information and software quality need to acknowledge thedifferent approaches in defining and assessing quality. Acommon basis is that the respective notion of quality can beapproximated by a set of attributes that describe what defineshigh quality. These attributes are in turn approximated by aset of metrics.
The various quality models defined for information showsthat there can be a huge gap between an ideal definition ofquality, an approximation by attributes and what can be mea-sured by metrics. For example, the negative quality attribute“the information is hard to understand” (cf. Table I) can bevery difficult to approximate by a set of metrics. We concludethat the metrics should be complemented by human insights.
Quality models for information and software (cf. Section II)quickly grow complex. Stvilia et al. [20] point out that onecannot manage information quality without first being able to
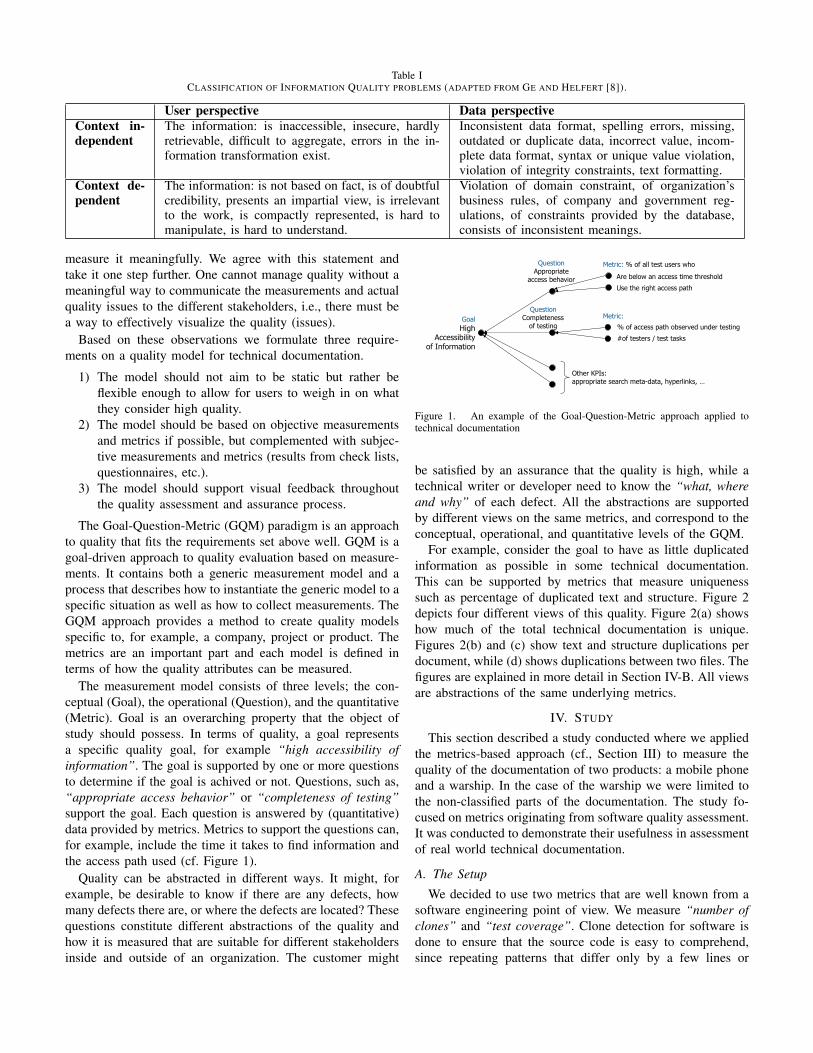
Table ICLASSIFICATION OF INFORMATION QUALITY PROBLEMS (ADAPTED FROM GE AND HELFERT [8]).
User perspective Data perspectiveContext in-dependent
The information: is inaccessible, insecure, hardlyretrievable, difficult to aggregate, errors in the in-formation transformation exist.
Inconsistent data format, spelling errors, missing,outdated or duplicate data, incorrect value, incom-plete data format, syntax or unique value violation,violation of integrity constraints, text formatting.
Context de-pendent
The information: is not based on fact, is of doubtfulcredibility, presents an impartial view, is irrelevantto the work, is compactly represented, is hard tomanipulate, is hard to understand.
Violation of domain constraint, of organization’sbusiness rules, of company and government reg-ulations, of constraints provided by the database,consists of inconsistent meanings.
measure it meaningfully. We agree with this statement andtake it one step further. One cannot manage quality without ameaningful way to communicate the measurements and actualquality issues to the different stakeholders, i.e., there must bea way to effectively visualize the quality (issues).
Based on these observations we formulate three require-ments on a quality model for technical documentation.
1) The model should not aim to be static but rather beflexible enough to allow for users to weigh in on whatthey consider high quality.
2) The model should be based on objective measurementsand metrics if possible, but complemented with subjec-tive measurements and metrics (results from check lists,questionnaires, etc.).
3) The model should support visual feedback throughoutthe quality assessment and assurance process.
The Goal-Question-Metric (GQM) paradigm is an approachto quality that fits the requirements set above well. GQM is agoal-driven approach to quality evaluation based on measure-ments. It contains both a generic measurement model and aprocess that describes how to instantiate the generic model to aspecific situation as well as how to collect measurements. TheGQM approach provides a method to create quality modelsspecific to, for example, a company, project or product. Themetrics are an important part and each model is defined interms of how the quality attributes can be measured.
The measurement model consists of three levels; the con-ceptual (Goal), the operational (Question), and the quantitative(Metric). Goal is an overarching property that the object ofstudy should possess. In terms of quality, a goal representsa specific quality goal, for example “high accessibility ofinformation”. The goal is supported by one or more questionsto determine if the goal is achived or not. Questions, such as,“appropriate access behavior” or “completeness of testing”support the goal. Each question is answered by (quantitative)data provided by metrics. Metrics to support the questions can,for example, include the time it takes to find information andthe access path used (cf. Figure 1).
Quality can be abstracted in different ways. It might, forexample, be desirable to know if there are any defects, howmany defects there are, or where the defects are located? Thesequestions constitute different abstractions of the quality andhow it is measured that are suitable for different stakeholdersinside and outside of an organization. The customer might
5th February 2010 Framtidens Informationssystem 29/22
Example quality index: Accessibility of Information
Goal High
Accessibility of Information
Are below an access time threshold
Use the right access path
Other KPIs: appropriate search meta-data, hyperlinks, …
Question Appropriate
access behavior
Metric: % of all test users who
Question Completeness
of testing % of access path observed under testing
#of testers / test tasks
Metric:
Figure 1. An example of the Goal-Question-Metric approach applied totechnical documentation
be satisfied by an assurance that the quality is high, while atechnical writer or developer need to know the “what, whereand why” of each defect. All the abstractions are supportedby different views on the same metrics, and correspond to theconceptual, operational, and quantitative levels of the GQM.
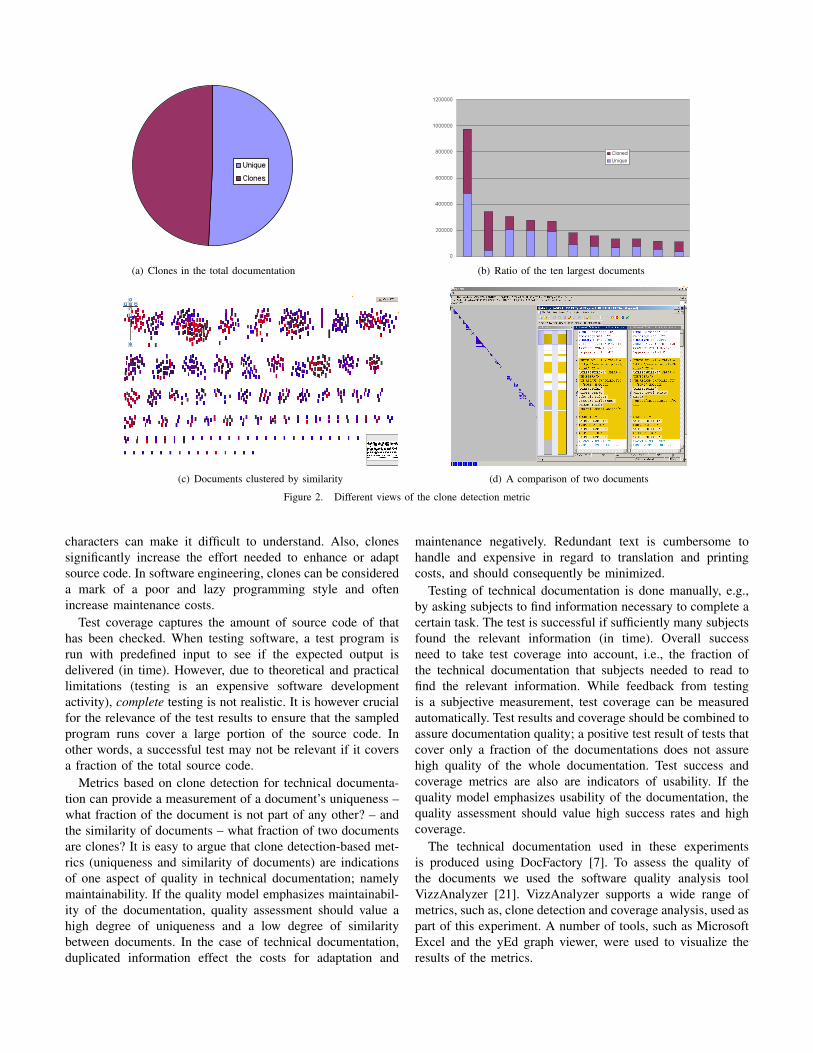
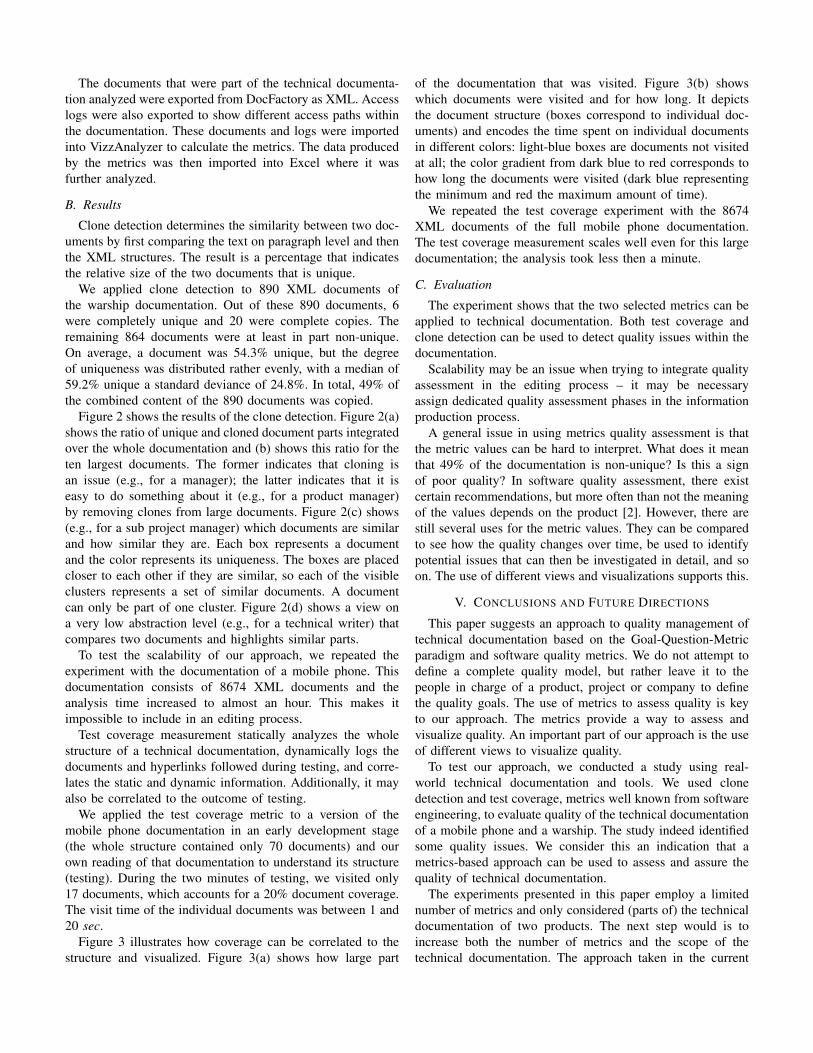
For example, consider the goal to have as little duplicatedinformation as possible in some technical documentation.This can be supported by metrics that measure uniquenesssuch as percentage of duplicated text and structure. Figure 2depicts four different views of this quality. Figure 2(a) showshow much of the total technical documentation is unique.Figures 2(b) and (c) show text and structure duplications perdocument, while (d) shows duplications between two files. Thefigures are explained in more detail in Section IV-B. All viewsare abstractions of the same underlying metrics.
IV. STUDY
This section described a study conducted where we appliedthe metrics-based approach (cf., Section III) to measure thequality of the documentation of two products: a mobile phoneand a warship. In the case of the warship we were limited tothe non-classified parts of the documentation. The study fo-cused on metrics originating from software quality assessment.It was conducted to demonstrate their usefulness in assessmentof real world technical documentation.
A. The Setup
We decided to use two metrics that are well known from asoftware engineering point of view. We measure “number ofclones” and “test coverage”. Clone detection for software isdone to ensure that the source code is easy to comprehend,since repeating patterns that differ only by a few lines or
5th February 2010 Framtidens Informationssystem 9/22
Similar and Redundant Information
! Quality goal: • Awareness of text copies to - fix errors consistently - unambiguousness of information - Low maintenance, translation, costs
! KPIs: • Uniqueness - Percentage of text clones - Percentage of structural copies (document hierarchy or cross reference structure)
! Overview for the owner
(a) Clones in the total documentation5th February 2010 Framtidens Informationssystem 10/22
! Views for the maintainer:
(b) Ratio of the ten largest documents
5th February 2010 Framtidens Informationssystem 11/22 (c) Documents clustered by similarity 5th February 2010 Framtidens Informationssystem 12/22
! View for the technical writer
(d) A comparison of two documents
Figure 2. Different views of the clone detection metric
characters can make it difficult to understand. Also, clonessignificantly increase the effort needed to enhance or adaptsource code. In software engineering, clones can be considereda mark of a poor and lazy programming style and oftenincrease maintenance costs.
Test coverage captures the amount of source code of thathas been checked. When testing software, a test program isrun with predefined input to see if the expected output isdelivered (in time). However, due to theoretical and practicallimitations (testing is an expensive software developmentactivity), complete testing is not realistic. It is however crucialfor the relevance of the test results to ensure that the sampledprogram runs cover a large portion of the source code. Inother words, a successful test may not be relevant if it coversa fraction of the total source code.
Metrics based on clone detection for technical documenta-tion can provide a measurement of a document’s uniqueness –what fraction of the document is not part of any other? – andthe similarity of documents – what fraction of two documentsare clones? It is easy to argue that clone detection-based met-rics (uniqueness and similarity of documents) are indicationsof one aspect of quality in technical documentation; namelymaintainability. If the quality model emphasizes maintainabil-ity of the documentation, quality assessment should value ahigh degree of uniqueness and a low degree of similaritybetween documents. In the case of technical documentation,duplicated information effect the costs for adaptation and
maintenance negatively. Redundant text is cumbersome tohandle and expensive in regard to translation and printingcosts, and should consequently be minimized.
Testing of technical documentation is done manually, e.g.,by asking subjects to find information necessary to complete acertain task. The test is successful if sufficiently many subjectsfound the relevant information (in time). Overall successneed to take test coverage into account, i.e., the fraction ofthe technical documentation that subjects needed to read tofind the relevant information. While feedback from testingis a subjective measurement, test coverage can be measuredautomatically. Test results and coverage should be combined toassure documentation quality; a positive test result of tests thatcover only a fraction of the documentations does not assurehigh quality of the whole documentation. Test success andcoverage metrics are also are indicators of usability. If thequality model emphasizes usability of the documentation, thequality assessment should value high success rates and highcoverage.
The technical documentation used in these experimentsis produced using DocFactory [7]. To assess the quality ofthe documents we used the software quality analysis toolVizzAnalyzer [21]. VizzAnalyzer supports a wide range ofmetrics, such as, clone detection and coverage analysis, used aspart of this experiment. A number of tools, such as MicrosoftExcel and the yEd graph viewer, were used to visualize theresults of the metrics.
The documents that were part of the technical documenta-tion analyzed were exported from DocFactory as XML. Accesslogs were also exported to show different access paths withinthe documentation. These documents and logs were importedinto VizzAnalyzer to calculate the metrics. The data producedby the metrics was then imported into Excel where it wasfurther analyzed.
B. Results
Clone detection determines the similarity between two doc-uments by first comparing the text on paragraph level and thenthe XML structures. The result is a percentage that indicatesthe relative size of the two documents that is unique.
We applied clone detection to 890 XML documents ofthe warship documentation. Out of these 890 documents, 6were completely unique and 20 were complete copies. Theremaining 864 documents were at least in part non-unique.On average, a document was 54.3% unique, but the degreeof uniqueness was distributed rather evenly, with a median of59.2% unique a standard deviance of 24.8%. In total, 49% ofthe combined content of the 890 documents was copied.
Figure 2 shows the results of the clone detection. Figure 2(a)shows the ratio of unique and cloned document parts integratedover the whole documentation and (b) shows this ratio for theten largest documents. The former indicates that cloning isan issue (e.g., for a manager); the latter indicates that it iseasy to do something about it (e.g., for a product manager)by removing clones from large documents. Figure 2(c) shows(e.g., for a sub project manager) which documents are similarand how similar they are. Each box represents a documentand the color represents its uniqueness. The boxes are placedcloser to each other if they are similar, so each of the visibleclusters represents a set of similar documents. A documentcan only be part of one cluster. Figure 2(d) shows a view ona very low abstraction level (e.g., for a technical writer) thatcompares two documents and highlights similar parts.
To test the scalability of our approach, we repeated theexperiment with the documentation of a mobile phone. Thisdocumentation consists of 8674 XML documents and theanalysis time increased to almost an hour. This makes itimpossible to include in an editing process.
Test coverage measurement statically analyzes the wholestructure of a technical documentation, dynamically logs thedocuments and hyperlinks followed during testing, and corre-lates the static and dynamic information. Additionally, it mayalso be correlated to the outcome of testing.
We applied the test coverage metric to a version of themobile phone documentation in an early development stage(the whole structure contained only 70 documents) and ourown reading of that documentation to understand its structure(testing). During the two minutes of testing, we visited only17 documents, which accounts for a 20% document coverage.The visit time of the individual documents was between 1 and20 sec.
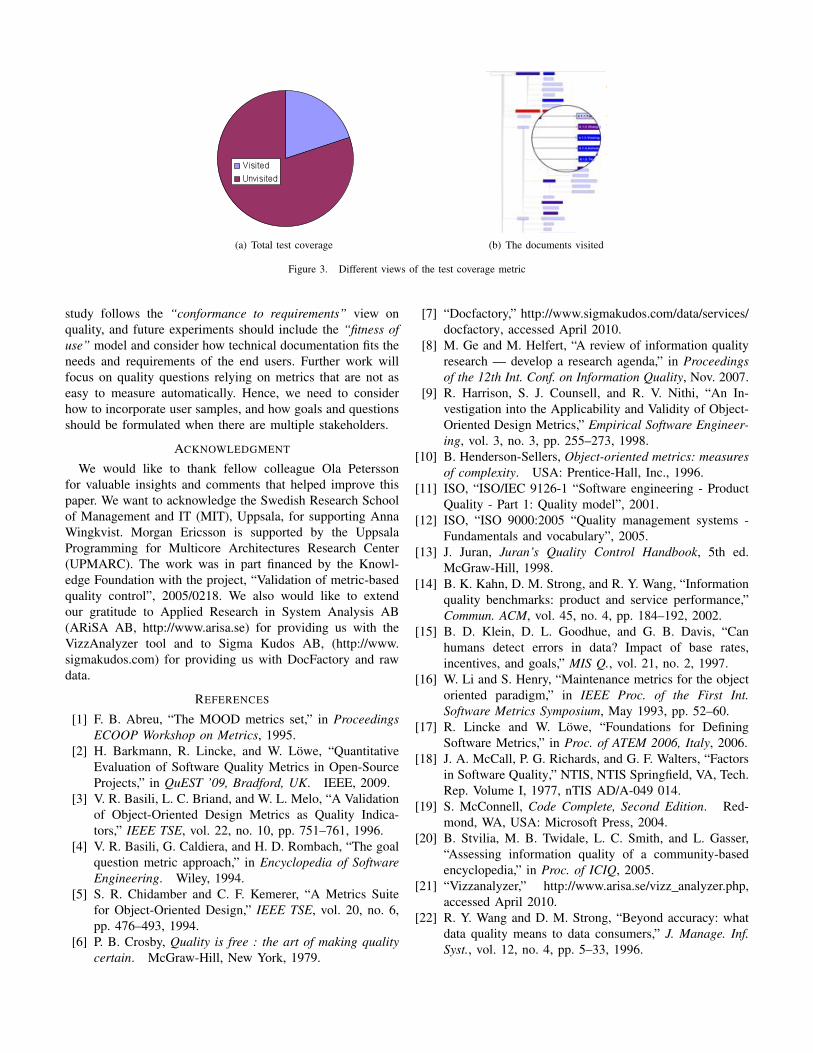
Figure 3 illustrates how coverage can be correlated to thestructure and visualized. Figure 3(a) shows how large part
of the documentation that was visited. Figure 3(b) showswhich documents were visited and for how long. It depictsthe document structure (boxes correspond to individual doc-uments) and encodes the time spent on individual documentsin different colors: light-blue boxes are documents not visitedat all; the color gradient from dark blue to red corresponds tohow long the documents were visited (dark blue representingthe minimum and red the maximum amount of time).
We repeated the test coverage experiment with the 8674XML documents of the full mobile phone documentation.The test coverage measurement scales well even for this largedocumentation; the analysis took less then a minute.
C. Evaluation
The experiment shows that the two selected metrics can beapplied to technical documentation. Both test coverage andclone detection can be used to detect quality issues within thedocumentation.
Scalability may be an issue when trying to integrate qualityassessment in the editing process – it may be necessaryassign dedicated quality assessment phases in the informationproduction process.
A general issue in using metrics quality assessment is thatthe metric values can be hard to interpret. What does it meanthat 49% of the documentation is non-unique? Is this a signof poor quality? In software quality assessment, there existcertain recommendations, but more often than not the meaningof the values depends on the product [2]. However, there arestill several uses for the metric values. They can be comparedto see how the quality changes over time, be used to identifypotential issues that can then be investigated in detail, and soon. The use of different views and visualizations supports this.
V. CONCLUSIONS AND FUTURE DIRECTIONS
This paper suggests an approach to quality management oftechnical documentation based on the Goal-Question-Metricparadigm and software quality metrics. We do not attempt todefine a complete quality model, but rather leave it to thepeople in charge of a product, project or company to definethe quality goals. The use of metrics to assess quality is keyto our approach. The metrics provide a way to assess andvisualize quality. An important part of our approach is the useof different views to visualize quality.
To test our approach, we conducted a study using real-world technical documentation and tools. We used clonedetection and test coverage, metrics well known from softwareengineering, to evaluate quality of the technical documentationof a mobile phone and a warship. The study indeed identifiedsome quality issues. We consider this an indication that ametrics-based approach can be used to assess and assure thequality of technical documentation.
The experiments presented in this paper employ a limitednumber of metrics and only considered (parts of) the technicaldocumentation of two products. The next step would is toincrease both the number of metrics and the scope of thetechnical documentation. The approach taken in the current
5th February 2010 Framtidens Informationssystem 13/22
Use of Information
! Quality goal • Relevance • Completeness • Accessibility
! KPIs • Access behavior of test users is as expected - Access path, - Access times, - Access frequencies.
• Completeness of testing the information system
! Overview for the owner
(a) Total test coverage
5th February 2010 Framtidens Informationssystem 14/22
! Detailed view … • Document hierarchy • Color encoding
- Red visited heavily - Light blue not visited
! … for the owner: • Does the user find the right information? • Is there unnecessary information?
! … for the maintainer • Is the information accessible? • Do we need cross references etc?
Use of Information
(yEd)
(b) The documents visited
Figure 3. Different views of the test coverage metric
study follows the “conformance to requirements” view onquality, and future experiments should include the “fitness ofuse” model and consider how technical documentation fits theneeds and requirements of the end users. Further work willfocus on quality questions relying on metrics that are not aseasy to measure automatically. Hence, we need to considerhow to incorporate user samples, and how goals and questionsshould be formulated when there are multiple stakeholders.
ACKNOWLEDGMENT
We would like to thank fellow colleague Ola Peterssonfor valuable insights and comments that helped improve thispaper. We want to acknowledge the Swedish Research Schoolof Management and IT (MIT), Uppsala, for supporting AnnaWingkvist. Morgan Ericsson is supported by the UppsalaProgramming for Multicore Architectures Research Center(UPMARC). The work was in part financed by the Knowl-edge Foundation with the project, “Validation of metric-basedquality control”, 2005/0218. We also would like to extendour gratitude to Applied Research in System Analysis AB(ARiSA AB, http://www.arisa.se) for providing us with theVizzAnalyzer tool and to Sigma Kudos AB, (http://www.sigmakudos.com) for providing us with DocFactory and rawdata.
REFERENCES
[1] F. B. Abreu, “The MOOD metrics set,” in ProceedingsECOOP Workshop on Metrics, 1995.
[2] H. Barkmann, R. Lincke, and W. Lowe, “QuantitativeEvaluation of Software Quality Metrics in Open-SourceProjects,” in QuEST ’09, Bradford, UK. IEEE, 2009.
[3] V. R. Basili, L. C. Briand, and W. L. Melo, “A Validationof Object-Oriented Design Metrics as Quality Indica-tors,” IEEE TSE, vol. 22, no. 10, pp. 751–761, 1996.
[4] V. R. Basili, G. Caldiera, and H. D. Rombach, “The goalquestion metric approach,” in Encyclopedia of SoftwareEngineering. Wiley, 1994.
[5] S. R. Chidamber and C. F. Kemerer, “A Metrics Suitefor Object-Oriented Design,” IEEE TSE, vol. 20, no. 6,pp. 476–493, 1994.
[6] P. B. Crosby, Quality is free : the art of making qualitycertain. McGraw-Hill, New York, 1979.
[7] “Docfactory,” http://www.sigmakudos.com/data/services/docfactory, accessed April 2010.
[8] M. Ge and M. Helfert, “A review of information qualityresearch — develop a research agenda,” in Proceedingsof the 12th Int. Conf. on Information Quality, Nov. 2007.
[9] R. Harrison, S. J. Counsell, and R. V. Nithi, “An In-vestigation into the Applicability and Validity of Object-Oriented Design Metrics,” Empirical Software Engineer-ing, vol. 3, no. 3, pp. 255–273, 1998.
[10] B. Henderson-Sellers, Object-oriented metrics: measuresof complexity. USA: Prentice-Hall, Inc., 1996.
[11] ISO, “ISO/IEC 9126-1 “Software engineering - ProductQuality - Part 1: Quality model”, 2001.
[12] ISO, “ISO 9000:2005 “Quality management systems -Fundamentals and vocabulary”, 2005.
[13] J. Juran, Juran’s Quality Control Handbook, 5th ed.McGraw-Hill, 1998.
[14] B. K. Kahn, D. M. Strong, and R. Y. Wang, “Informationquality benchmarks: product and service performance,”Commun. ACM, vol. 45, no. 4, pp. 184–192, 2002.
[15] B. D. Klein, D. L. Goodhue, and G. B. Davis, “Canhumans detect errors in data? Impact of base rates,incentives, and goals,” MIS Q., vol. 21, no. 2, 1997.
[16] W. Li and S. Henry, “Maintenance metrics for the objectoriented paradigm,” in IEEE Proc. of the First Int.Software Metrics Symposium, May 1993, pp. 52–60.
[17] R. Lincke and W. Lowe, “Foundations for DefiningSoftware Metrics,” in Proc. of ATEM 2006, Italy, 2006.
[18] J. A. McCall, P. G. Richards, and G. F. Walters, “Factorsin Software Quality,” NTIS, NTIS Springfield, VA, Tech.Rep. Volume I, 1977, nTIS AD/A-049 014.
[19] S. McConnell, Code Complete, Second Edition. Red-mond, WA, USA: Microsoft Press, 2004.
[20] B. Stvilia, M. B. Twidale, L. C. Smith, and L. Gasser,“Assessing information quality of a community-basedencyclopedia,” in Proc. of ICIQ, 2005.
[21] “Vizzanalyzer,” http://www.arisa.se/vizz analyzer.php,accessed April 2010.
[22] R. Y. Wang and D. M. Strong, “Beyond accuracy: whatdata quality means to data consumers,” J. Manage. Inf.Syst., vol. 12, no. 4, pp. 5–33, 1996.
Recommended