Spatial Analysis Project
A Joint Project between the Indiana Division of
Forestry, Purdue University, and the USDA Forest Service
Shorna R. Broussard, Ph.D., Rick Farnsworth, Ph.D., Tika Adhikari,
and Andriy Zhalnin Department of Forestry and Natural Resources
Purdue University
Dan Ernst, Brenda Huter, Brett Martin Indiana Department of Natural Resources
Division of Forestry
March 2006

1
(page left blank intentionally)

2
Table of Contents
Introduction................................................................................ 3
Spatial Analysis Project ............................................................. 5
SAP Model ................................................................................ 6
Application of SAP to Indiana.................................................. 10
Base SAP Model ..................................................................... 10
Private Forestlands ............................................... 12
Forest Patches...................................................... 14
Natural Heritage and Priority Habitats................... 17
Wetlands ............................................................... 19
Riparian Zones...................................................... 22
Public Drinking Water Sources ............................. 24
Impaired Watersheds............................................ 26
Proximity to Public Lands...................................... 28
Slope..................................................................... 30
Development......................................................... 32
Forest Fires........................................................... 36
Forest Health ........................................................ 38
Stewardship Potential.............................................................. 41
Spatial Analysis ....................................................................... 42
Acknowledgements ................................................................. 46
3
Introduction
Indiana’s forestlands contribute significantly to the state’s economy,
environment and overall wellbeing of its citizens. Covering 4.5 million of
Indiana’s 23 million acres of land, these forestlands contribute more than $9
billion annually to the state’s economy. Forest-based manufacturing accounts for
more than $8 billion. Indiana ranks first nationally in the manufacture of wood
office furniture. Forest-based manufacturing alone employs more than 54,000
Hoosiers, making it the state’s fourth largest manufacturing sector behind
transportation equipment, metal manufacturing, and plastics and rubber
products. Nationally, Indiana ranks 16th in forest based manufacturing.
Recreation and tourism directly linked to forestlands add another $1 billion; tree
sales, $175 million; and the sale of Christmas trees, maple syrup, firewood and
other forest products, $25 million. Other economic, ecologic, and social benefits
such as carbon sequestration, species diversity, water and air quality, and an
appreciation for nature substantially enhance the primary role played by
forestlands in Indiana1.
The newly formed Indiana State Department of Agriculture recognized the
important role of the forest economy by making it part of its strategic plan. The
agency set an objective to increase the competitiveness of Indiana’s hardwood
sector and create new value-added manufacturing opportunities. At the core of
the Indiana State Department of Agriculture’s initiative are viable, well-managed
forests that regularly produce high quality, cost-competitive timber for the state’s

4
manufacturing sector, increase the flow of ecosystem services, promote
recreation, improve water quality, and sequester carbon2.
As part of its strategic plan, the Indiana State Department of Agriculture is
working closely with the Indiana Department of Natural Resources to develop
several education initiatives for the over 100,000 landowners who own 85
percent of the state’s forestlands1. These education initiatives follow a logical
sequence that inform landowners about the economic and ecological potential of
their woodlots discuss how good forestry practices increase economic returns
and the flow of ecosystem services, assist landowners in writing and
implementing forest management plans, and help them realize gains through the
harvesting and marketing of their timber.
The Indiana Department of Natural Resources is investigating ways to
improve the program effectiveness of state and federal forestry programs.
Currently, Indiana’s Division of Forestry is participating in the U.S. Forest
Service’s Spatial Analysis Project (SAP)3. The primary goal of SAP is the
development and use of a GIS-based decision model that assists communities,
agencies, and conservation organizations in identifying and displaying highly
valued (rich in natural resources, vulnerable to threat) non-industrial private
forestlands within the state. Given this information, state and federal forestry
agencies and conservation groups may choose to redirect their expertise and
funds to these highly valued areas. The results are improved program
effectiveness, an economically viable forest sector, higher flows of ecosystem
services, and stable, species-rich ecosystems. In the remainder of this report,
5
we review the Spatial Analysis Project and summarize the results of the
application of the SAP project in Indiana.
Spatial Analysis Project
The U.S. Forest Service Forest Stewardship Program (FSP) provided the
impetus for the Spatial Analysis Project. The objective of the Forest Stewardship
Program (FSP) is to improve individual and societal welfare through improved
long-term management of non-industrial private forestlands. FSP is a voluntary
program for landowners who want to keep their forested lands as healthy and
productive as possible. A forester or natural resource professional works with a
participating landowner to ascertain the landowner’s management objectives,
writes a management plan consistent with those objectives, and assists the
landowner in implementing and updating the plan. Participation is high with more
than 238,000 forest stewardship plans covering 27 million acres on file in state
forestry agencies across the nation.
Enrollment numbers suggest that the Forest Stewardship Program is
successful. Voluntary programs, however, typically generate fewer benefits at
higher costs because landowners’ objectives seldom mirror society’s economic,
ecologic, and social objectives.4 A partial solution is environmental targeting,
which the Northeastern Area, an administrative unit of the State and Private
Forestry branch of the U.S. Forest Service, proposed as part of their assessment
of the FSP. The Northeastern Area unit created the Spatial Analysis Project in
2002 and recruited forestry agencies from the states of Connecticut,
Massachusetts, Maryland, and Missouri to assist them in the development and

6
implementation of a pilot SAP decision model. The stated objective of the SAP
decision model is to identify, score and categorize private forestlands into low,
medium, and high categories of “stewardship potential.” Given this information,
state and federal agencies, conservation organizations, and communities may
find it in their best interests to redirect limited education, technical assistance,
staff, and funding to the most highly valued areas, as determined by stewardship
potential.
Since its creation in 2002, the SAP project has more than expanded in
size. In 2004, Indiana, Iowa, Rhode Island and West Virginia agreed to apply the
SAP model and digitize FSP plans. In 2005, Alaska, Oregon and Colorado
joined the effort. In the remainder of this section, we focus on the application of
the SAP model to Indiana.
SAP Model
At the core of the Spatial Analysis Project is a GIS-based decision tool
that allows forestry agencies to identify, score, categorize, and spatially display
lands in low, medium, and high categories of “stewardship potential.” Currently,
the base model consists of 12 variables (see Figure 1) that capture a wide range
of ecologic and socioeconomic benefits – harvested timber for the construction
and wood products industries, habitat for wildlife and other species, and
ecological services such as cleaner air and water – provided by forests. Though
not immediately obvious, resource potential represents the benefits or services
that flow to society from forested lands. Resource threats, on the other hand,
diminish the flow of services or benefits from forestlands.

7
A better understanding and justification of the SAP decision tool is
possible by viewing the underlying decision model as shown in Figure 1. The
base SAP model consists of 12 objectives that capture many of the benefits
generated by forestlands. Meaning is added to each objective through the
selection of an attribute or proxy variable. The attribute or proxy variable can be
as simple as the existence or absence of a condition or more complicated such
as a continuous variable that allows one to assess progress toward an objective.
Second, the attribute or proxy variables allow one to score or measure progress
regarding each objective as well as the overall project. In terms of the SAP
model, the 12 objectives define “stewardship potential,” and the corresponding
12 measurable attributes provide the means for assessing different levels of
“stewardship potential” of non-industrial private forestlands throughout a state.
Statewide GIS layers exist for each of the 12 attributes.

8
Figure 1. Forest Stewardship Suitability Model: Framework Variables and
Associated Spatial Data Layers.
Application of the SAP decision model consists of three steps. In the first
step, the unit of analysis is selected. For SAP, the unit of analysis is a 30 square
meter cell. The second step entails the scoring of every 30 square meter using
the base SAP model. Scoring is straightforward. Each cell receives a total score
between 0 and 12. A cell that exhibits an attribute receives a score of 1;
otherwise it receives a score of 0. A cell devoid of attributes receives a score of
zero, while the a score of 1 is the highest “stewardship potential” score possible.
Public and private forestry professionals aided in developing the weight for the
relative importance of the 12 objectives. The last step consists of categorizing
cell scores into three categories – low, medium, and high stewardship potential –

9
and displaying the results in a map. The map provides a basis for realigning
limited state and federal education, technical assistance, and cost-share funds to
the highest stewardship potential, non-industrial private forestlands.
States may customize the SAP model many different ways, such as
expanding the analysis to include additional sub-objectives and their
corresponding measurable attributes. They may also decide how to define the
low, medium, and high categories of stewardship potential or conduct the
analysis on a regional basis rather than for the entire state.
For this base study Indiana chose to implement the base SAP model, the
12-objective (data layer) model. An expanded version adding data layers on soil
productivity and proximity to lands enrolled in the Classified Forest (Indiana’s
Forest Stewardship program) program is also undergoing evaluation. That
information is not presented in this report. The 12 data layers were prepared
jointly by Purdue University and the Indiana Division of Forestry. In the next
section, we discuss the implementation of SAP in Indiana.

10
Application of SAP to Indiana Forestlands provide timber, wildlife habitat, watershed protection,
recreational opportunities and many other benefits to landowners and society.
The Spatial Analysis Project provides a model that assists state forestry
agencies, conservation groups and others in identifying “high benefit” or “high
stewardship potential” forestlands.
The Base SAP Model The base SAP model consists of 12 objectives, or data layers reflecting
natural resources potential or threats to the forest resource. These objectives
and their associated attributes or proxy variables capture many of the benefits
attributed to forestlands. We discuss each objective-attribute combination to
facilitate a better understanding of the model. The 12 data layers analyzed
include:
Resource Potential
• Riparian Zones
• Priority Watersheds
• Forest Patch Size
• Natural Heritage Data
• Public Drinking Water Supply Sources
• Private Forest Lands
• Proximity to Public Lands
• Wetlands

11
• Topographic Slopes
Resource Threats:
• Forest Health
• Development
• Wildlife Assessment

12
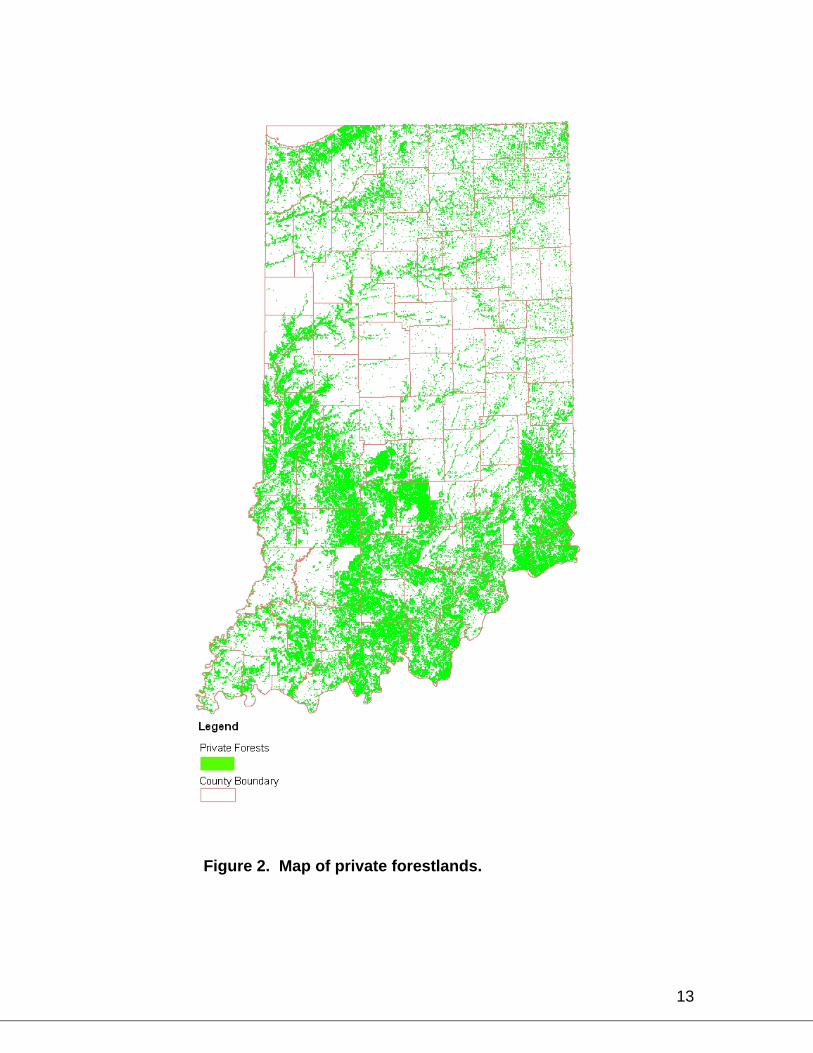
Private Forestlands
The private forestlands objective captures the notion that existing
forestlands contribute to ecosystem stability and provide flows of benefits to
human and natural communities. Furthermore, better management of existing
private forestlands will significantly improve the flow of benefits. Insufficient
information exists to measure most of the benefit flows. Therefore, we assign a
value of 1 to cells comprised of private forestlands. Non-forestland cells receive
a value of 0.
To construct the private forestlands map shown in Figure 2, we completed
a series of steps that began with extracting forest cover information from the
1992 National Land Cover Dataset
(http://landcover.usgs.gov/nlcd/show_data.asp?code=IN&state=Indiana).
Derived from Landsat Thematic Mapper satellite data, the NLCD data includes
21 classes of land cover on a 30x30 meter grid. Five classes – deciduous
forests (41), evergreen forests (42), mixed forests (43), shrubland (51), and
woody wetlands (91) – comprise the forest cover layer for Indiana.
This 5-class forest cover layer contains private and public forestlands. To
obtain the private forestlands map, we removed public forestlands such as the
Hoosier National Forest and state-owned lands. As mentioned above, every
30x30 meter cell coded as private forestland receives a value of 1, which
denotes the important benefit flows from forestlands to human and natural
communities.
13
Figure 2. Map of private forestlands.

14
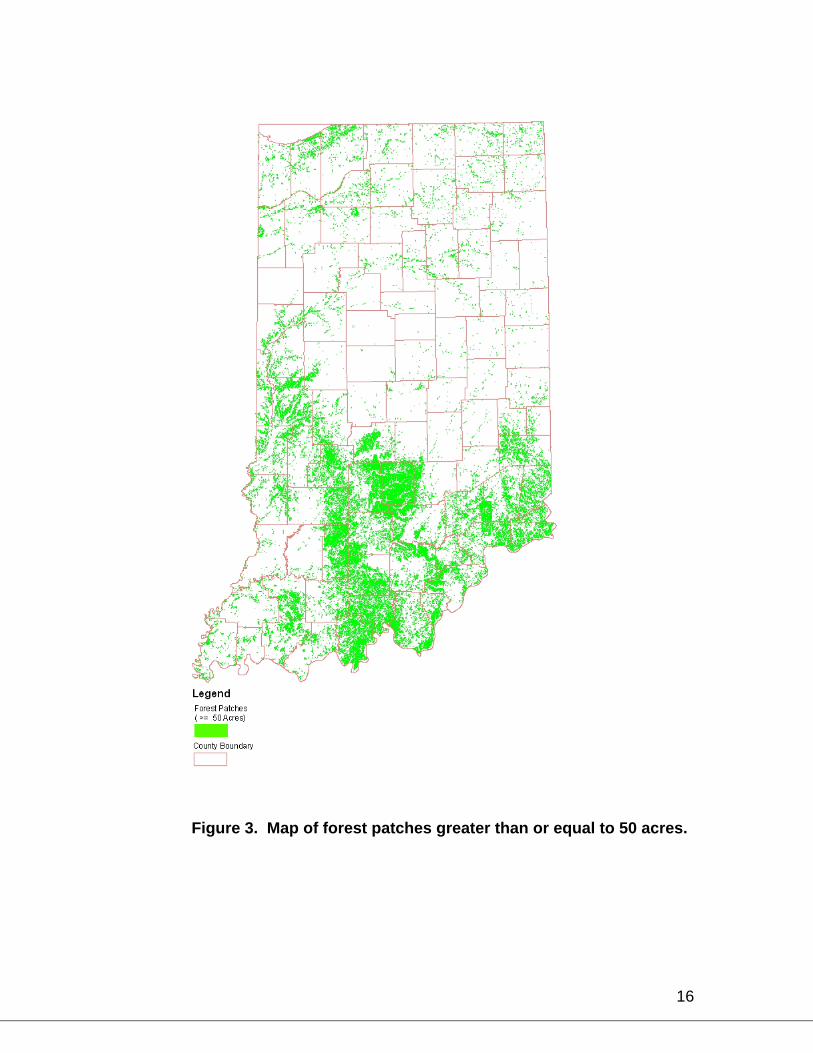
Forest Patches
Large areas of forestland contribute to ecosystem integrity and stability,
species diversity, genetic variability, and commercial timber production. The
forest patch map layer accounts for these benefits by assigning a value of 1 to
forest patches 50 acres or larger. Forest patches less than 50 acres receive a
value of 0.
The forest patches map layer is a subset of Indiana’s forestlands cover
map. The forestlands cover map consists of deciduous forests (41), evergreen
forests (42), mixed forests (43), shrubland (51), and woody wetlands (91) from
the 1992 National Land Cover Dataset
(http://landcover.usgs.gov/nlcd/show_data.asp?code=IN&state=Indiana).
We completed a series of steps to create the forest patch data layer.
First, we converted the forestlands cover map to a vector format. Second, we
overlaid state and federal roads on the forestlands cover map, added a 15 meter
buffer on each side of the roads, and then removed forestlands within the
buffered areas. The purpose of this step was to account for the fragmentation of
forest cover caused by roads. At this point, the map consisted of small to large
areas of forestlands and unidentified land cover. Third, we identified only
contiguous forestlands 50 acres or larger. Forestland areas less than 50 acres in
size were removed from the map layer. Fourth, we converted the vector file of
forest patches 50 acres or greater to a 30x30 meter raster grid, the basic unit of
analysis of the SAP model. Forestlands within the forest patches receive a value
of 1. Cells outside the forest patches receive a value of zero. Lastly, we used
15
the urban mask to remove forest patches inside urban areas. The final forest
patch map is shown in Figure 3. It should be mentioned that this layer shows
public forests (which were later clipped out by the Analysis Mask) because forest
patches may span political boundaries, and we want to capture private forests
that may be less than 50 acres on their own, but when considered with adjoining
public lands, create a forest area that is 50 acres or larger.
16
Figure 3. Map of forest patches greater than or equal to 50 acres.

17
Natural Heritage and Priority Habitats
Forestlands provide critical habitat or supporting habitat for a wide range
of species. The need to maintain forest cover is especially important if continued
existence of threatened and endangered forest dwelling and forest-dependent
species rely almost exclusively on the cover.
Experts within and outside the DNR reviewed the list of threatened and
endangered plants and animals and high quality habitats. They identified the
species that would be negatively impacted if their habitat was converted to forest.
Those species that would be negatively impacted and the non-forest high quality
habitats were removed from the data layer. Those species that were neutral to a
forest habitat were left in the data set. With this information, a natural heritage
and priority habitat map was created. Furthermore, a ½-mile buffer surrounds
each point and polygon.
We converted the DNR buffered map layer to a 30x30 meter grid. Cells
that denote the likely existence of threatened and endangered species or their
priority habitat receive a value of one. Land cover may or may not be forested.
Cells outside the buffered points and polygons receive a value of zero. The
natural heritage and priority habitat map is shown in Figure 4.

18
Figure 4. Map of forest dependent threatened and endangered wildlife species.

19
Wetlands
Wetlands are the transitional lands between terrestrial and aquatic
systems, where the water table is usually at or near the surface or the land
covered by shallow water. Wetlands generate numerous benefits of value to
human and natural communities. For example, they intercept surface water
runoff. Sediment and chemicals suspended in the runoff water become trapped
in the wetlands, thus improving downstream water quality. Wetlands support
large commercial fish and shellfish industries in the Gulf of Mexico and
elsewhere, the cranberry industry in the Northeast, and commercial timber
production throughout the U.S. Bottomland hardwood forests account for nearly
50% of Indiana’s wetlands and have among the highest soil and timber
productivity rates in the state and region. Lately, the flood control benefits
associated with wetlands have become apparent throughout the Southeast in the
aftermath of several seasons of high levels of hurricane activity. With respect to
nature, thousands of aquatic and terrestrial plant and animal species use
wetlands as habitat or breeding grounds. Almost one-third of the nation’s
threatened and endangered species live in wetlands. Another one-half of the
nation’s threatened and endangered species rely on wetlands at some point in
their life cycles.
The wetlands map for Indiana consists of wetlands from the Fish and
Wildlife Services National Wetland Inventory (http://wetlands.fws.gov/). The data
is also available for download at
20
http://igs.indiana.edu/arcims/statewide/dload_page/hydrology.html at a
scale of 1:24,000.
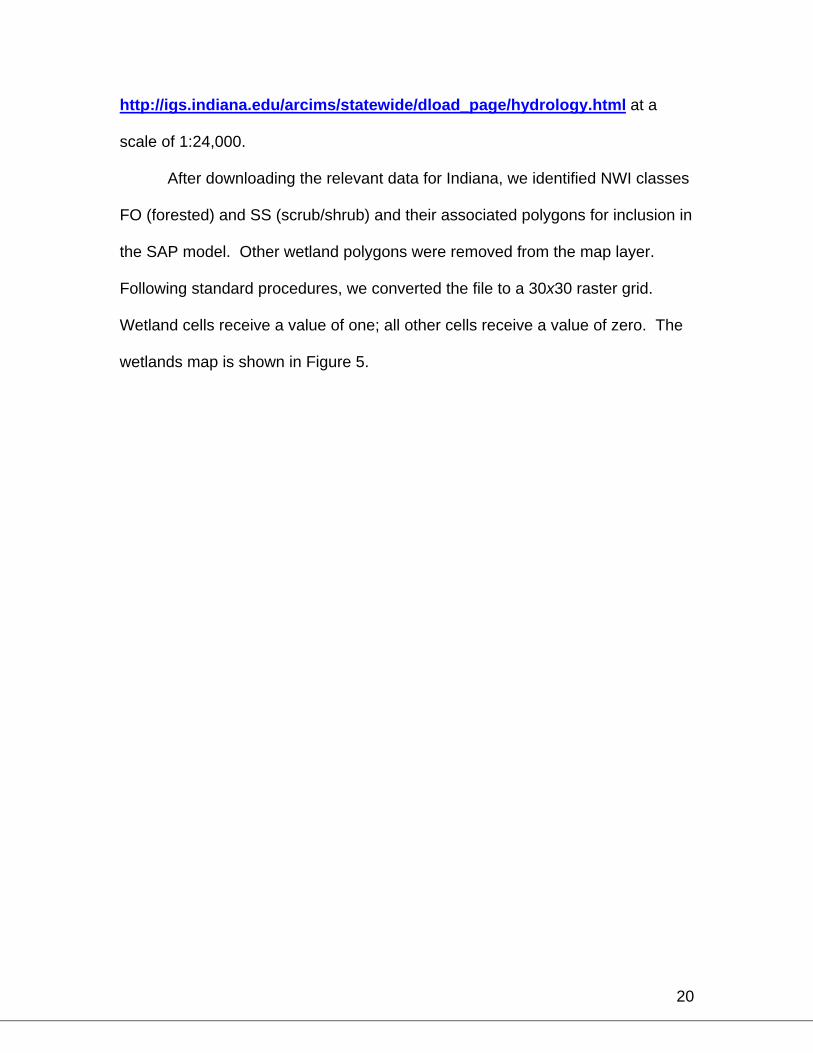
After downloading the relevant data for Indiana, we identified NWI classes
FO (forested) and SS (scrub/shrub) and their associated polygons for inclusion in
the SAP model. Other wetland polygons were removed from the map layer.
Following standard procedures, we converted the file to a 30x30 raster grid.
Wetland cells receive a value of one; all other cells receive a value of zero. The
wetlands map is shown in Figure 5.
21
Figure 5. Map of woody wetlands.
22
Riparian Zones
Similar to wetlands, land adjacent to rivers and streams generate many
benefits that contribute to the well being of human and natural communities.
Riparian buffers filter runoff water, reducing the flow of sediment and chemicals
to our waterways. Riparian buffers provide habitat and breeding grounds for
thousands of plant and animal species. Aquatic species also benefit from
riparian buffers, especially forest buffers that shade streams and stabilize stream
banks.
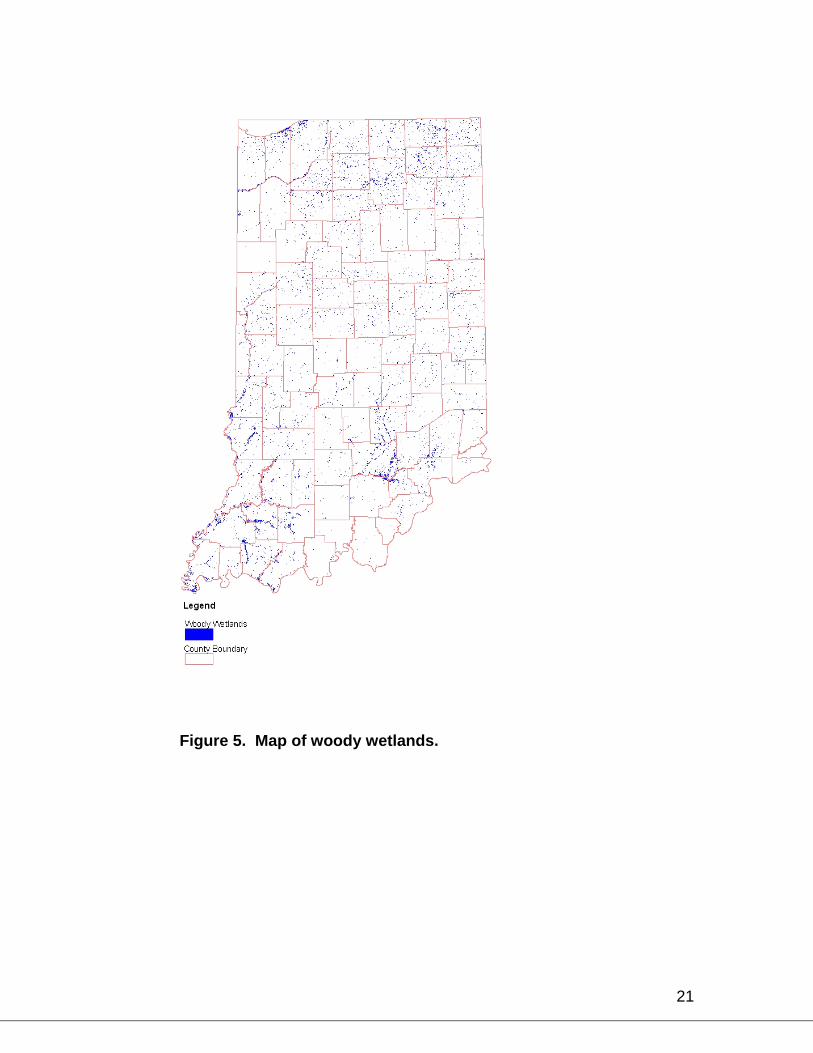
The riparian zone map consists of perennial streams and rivers buffered
by 100 meters on both sides. We obtained the original vector data of streams
and rivers at scale of 1:100,000 from the National Hydrography dataset created
by the U.S. geological survey and the Environmental Protection Agency
(www.nhd.usgs.gov). We converted the vector file to a 30x30 meter raster. Cells
within the stream and river buffers receive a value of 1. Forest cover may or may
not exist within the stream and river buffers. Assigning a value of one to these
cells, however, targets them as areas preferred for better management of
existing forests or the planting and managing of forests within the stream and
river buffers. Cells outside the buffered streams and rivers receive a value of 0.
The riparian zone map is shown in Figure 6.
23
Figure 6. Map of riparian zones.

24
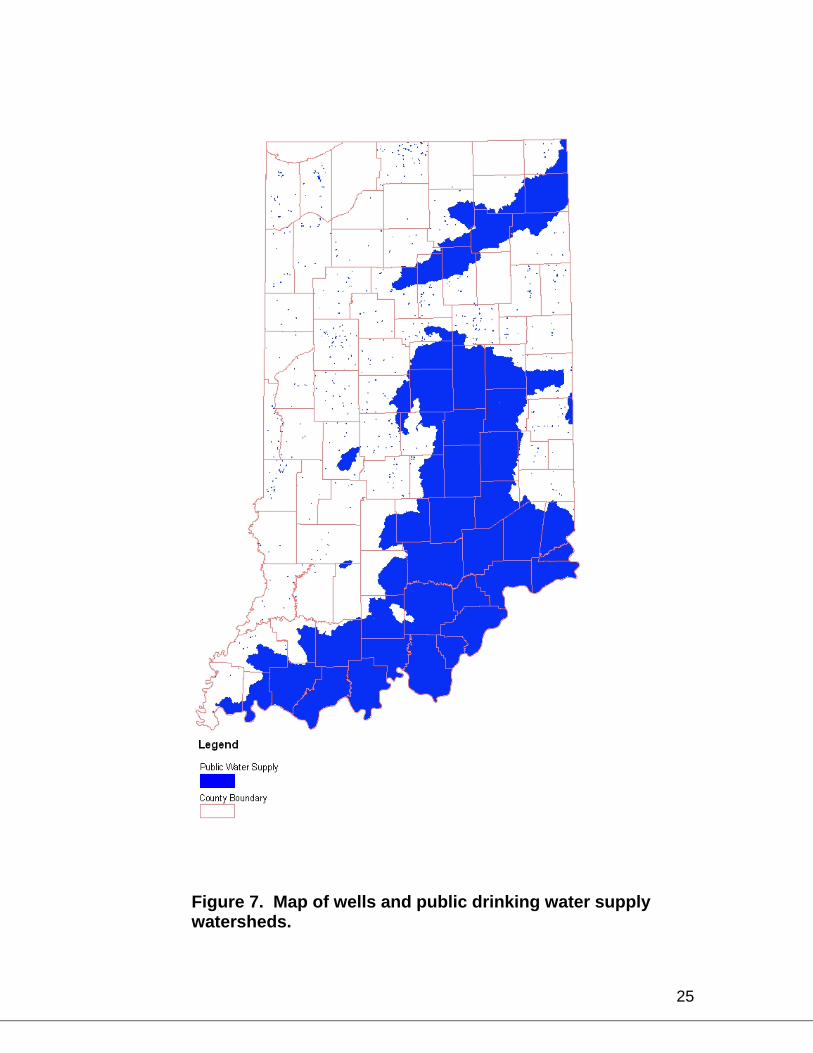
Public Drinking Water Supply Sources
A major benefit attributed to forestlands is water quality protection of
surface water and aquifers. Trees and high infiltration forest soils intercept rain
and slow the flow of runoff, thus reducing soil erosion and the movement of
pollutants into streams or aquifers. The water quality benefits of forestlands
increase significantly in those watersheds and aquifers tapped by communities
for public drinking water and commercial water uses.
The public drinking water supply sources map consists of public water
supply watersheds, public water supply wells, and community wells. We obtained
watershed boundaries at a scale of 1:24,000 from the Indiana GIS Atlas
(http://igs.indiana.edu/arcims/statewide/dload_page/hydrology.html). We used
information provided by the Indiana Department of Environmental Management
to identify public water supply watersheds, public wells, and community wells. A
buffer of one-mile radius surrounds every public and community well. This
composite map of public water supply watersheds and wells was then converted
to a 30x30 meter raster file. Forested and non-forested cells within public water
supply watersheds and buffered areas around wells receive a score of 1. In
these areas, it is desirable to improve the management of existing forestlands or
to promote the addition of well-managed forestlands for increasing the flow of
water quality benefits to humans. Cells outside the delineated watersheds and
well buffers receive a score of 0. The public water supply sources map is shown
in Figure 7.
25
Figure 7. Map of wells and public drinking water supply watersheds.
26
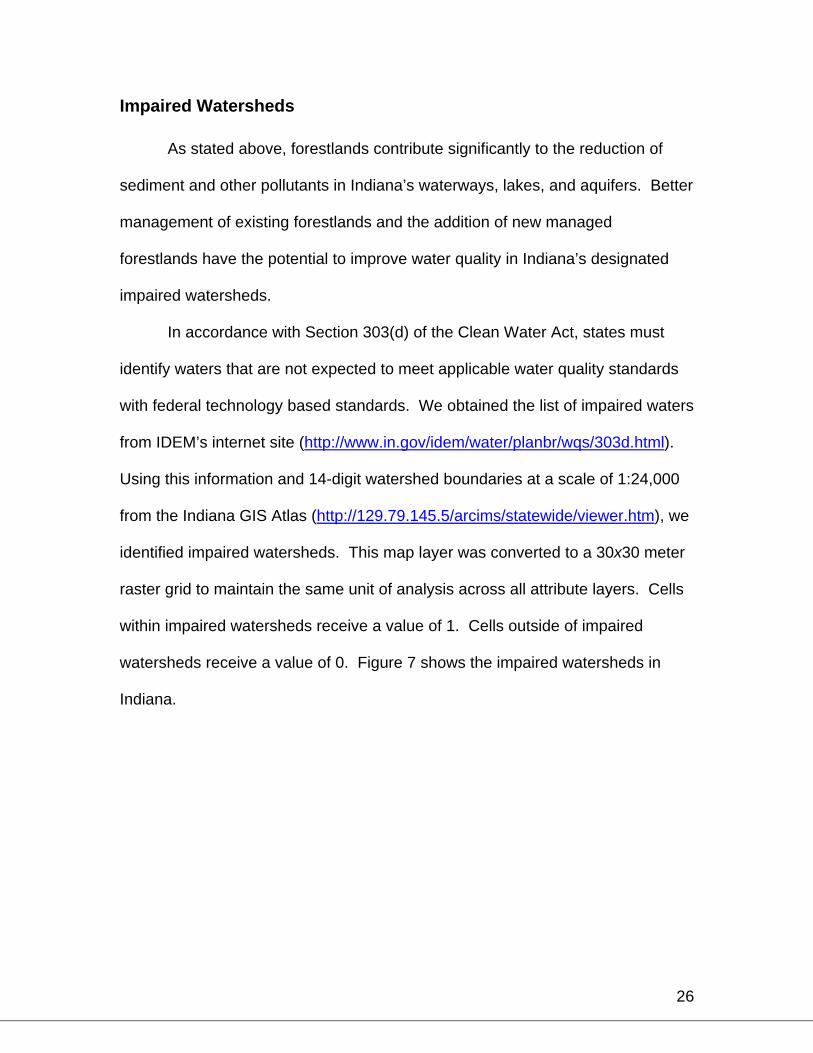
Impaired Watersheds
As stated above, forestlands contribute significantly to the reduction of
sediment and other pollutants in Indiana’s waterways, lakes, and aquifers. Better
management of existing forestlands and the addition of new managed
forestlands have the potential to improve water quality in Indiana’s designated
impaired watersheds.
In accordance with Section 303(d) of the Clean Water Act, states must
identify waters that are not expected to meet applicable water quality standards
with federal technology based standards. We obtained the list of impaired waters
from IDEM’s internet site (http://www.in.gov/idem/water/planbr/wqs/303d.html).
Using this information and 14-digit watershed boundaries at a scale of 1:24,000
from the Indiana GIS Atlas (http://129.79.145.5/arcims/statewide/viewer.htm), we
identified impaired watersheds. This map layer was converted to a 30x30 meter
raster grid to maintain the same unit of analysis across all attribute layers. Cells
within impaired watersheds receive a value of 1. Cells outside of impaired
watersheds receive a value of 0. Figure 7 shows the impaired watersheds in
Indiana.
27
Figure 8. Map of impaired watersheds.

28
Proximity to Public Lands
Using a GIS layer constructed by the Indiana Department of Natural Resources,
public lands consist of federal and state forests, recreation areas, military lands,
and other public lands. By themselves, public lands contribute to the well being
of human and natural communities. Just as important are the lands adjacent to
public lands. Forestlands adjacent to non-forested and forested public lands, for
example, enhance ecosystem stability and increase benefit flows, making them
high-priority areas for improved forest management or conversion to forestlands.
The public lands proximity map accounts for the lands that border public
lands by adding a quarter-mile buffer around them. Similar to the other maps, we
converted the buffered public lands to a 30x30 meter raster grid. Cells within the
quarter-mile buffer receive a score of 1 to reflect their importance regarding
“stewardship potential.” Cells outside the quarter mile buffers, which include the
public lands, receive a 0 score. The proximity to public lands map is shown in
Figure 9.

29
Figure 9. Map of public lands buffer.

30
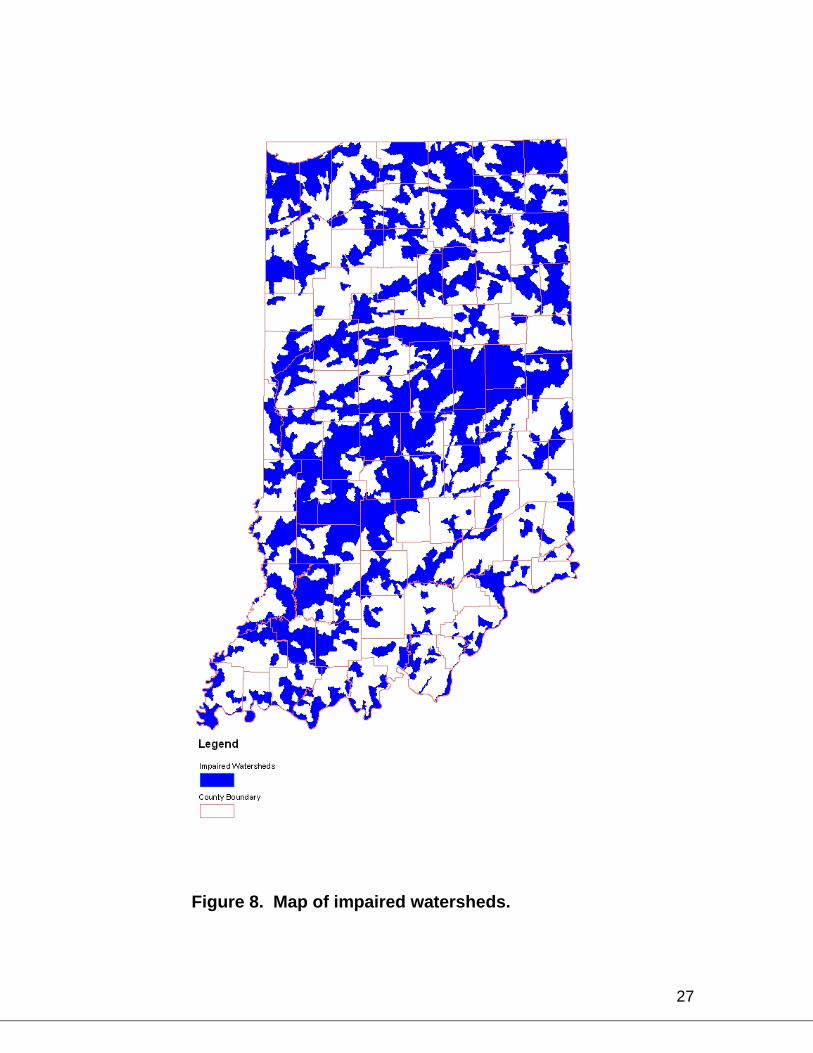
Topographic Slope
Topographic slope is a proxy variable for the benefits derived from the
production and use of timber in the economy. Forests dominated the Indiana
landscape 200 years ago, covering 85 percent of the land. Today, forests cover
only about 20 percent of the land. Much of the highly productive, relatively flat
land that grew trees a century ago now produces corn, soybeans, and other
agricultural commodities. Residential and commercial development also account
for yearly losses of forestlands throughout the state.
The most likely use of Indiana’s productive, relative flat, flood resistant
soils will be agriculture. As slope increases and agricultural soil productivity
decreases, the competitive edge moves increasingly toward tree production.
Excluding urban demands for land, tree production is a competitive alternative to
agricultural production on 6 to 30 percent sloping lands. On steep slopes,
greater than 30 percent, trees provide a number of immeasurable societal
benefits – soil protection, a constant water supply, and clean water – that can
outweigh or significantly complement the private returns to timber production.
To pinpoint the lands most favorable to economically viable timber
production, we downloaded the state’s 30 meter Digital Elevation Model from the
U.S. Geological Survey (http://ask.usgs.gov/digidata). We estimated slope for
each 30x30 meter cell. Cells with slopes between 6 and 30 percent received a
value of 1. Cells with slopes less than 6 percent and cells above 30 percent
received a score of 0. The slope map is shown in Figure 10.
31
Figure 10. Map of (6-30%) slope category.
32
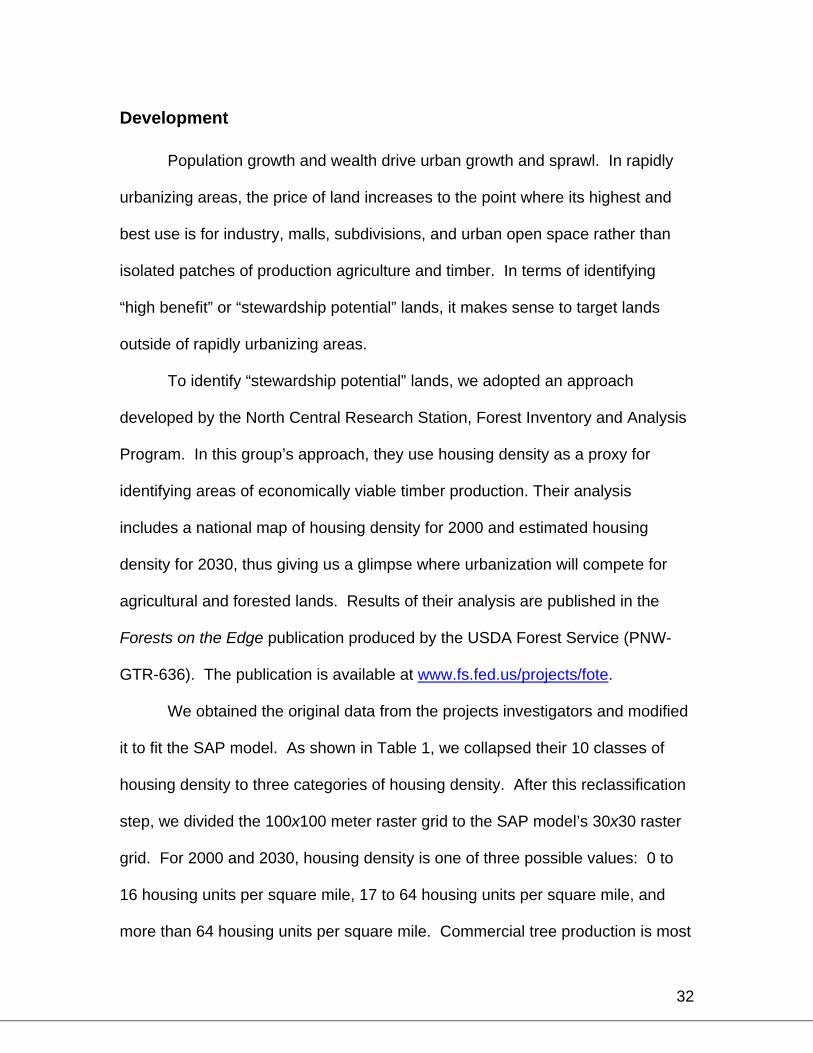
Development
Population growth and wealth drive urban growth and sprawl. In rapidly
urbanizing areas, the price of land increases to the point where its highest and
best use is for industry, malls, subdivisions, and urban open space rather than
isolated patches of production agriculture and timber. In terms of identifying
“high benefit” or “stewardship potential” lands, it makes sense to target lands
outside of rapidly urbanizing areas.
To identify “stewardship potential” lands, we adopted an approach
developed by the North Central Research Station, Forest Inventory and Analysis
Program. In this group’s approach, they use housing density as a proxy for
identifying areas of economically viable timber production. Their analysis
includes a national map of housing density for 2000 and estimated housing
density for 2030, thus giving us a glimpse where urbanization will compete for
agricultural and forested lands. Results of their analysis are published in the
Forests on the Edge publication produced by the USDA Forest Service (PNW-
GTR-636). The publication is available at www.fs.fed.us/projects/fote.
We obtained the original data from the projects investigators and modified
it to fit the SAP model. As shown in Table 1, we collapsed their 10 classes of
housing density to three categories of housing density. After this reclassification
step, we divided the 100x100 meter raster grid to the SAP model’s 30x30 raster
grid. For 2000 and 2030, housing density is one of three possible values: 0 to
16 housing units per square mile, 17 to 64 housing units per square mile, and
more than 64 housing units per square mile. Commercial tree production is most
33
viable in cells with a housing density of 0 to 16 housing units per square mile.
These areas are the least threatened and therefore of lower immediate priority
than lands transitioning to the moderate housing density. Nonetheless, these low
density areas should be considered appropriate and priority targets for
stewardship. Commercial tree production and harvesting is problematic when
housing density is 16 to 64 unit per square mile. Housing densities above 64
units per square mile is highly urbanized. Remaining patches of trees are too
small and the logistics of harvesting make commercial timber activities generally
unfeasible.
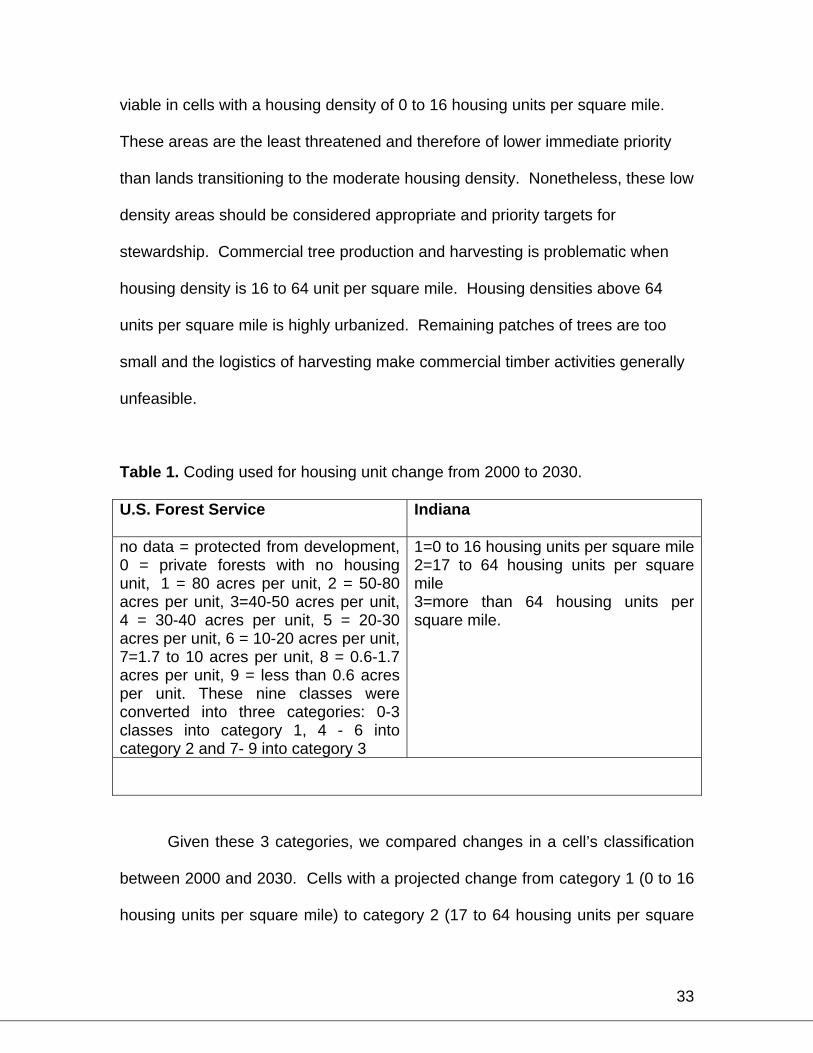
Table 1. Coding used for housing unit change from 2000 to 2030.
U.S. Forest Service Indiana
no data = protected from development, 0 = private forests with no housing unit, 1 = 80 acres per unit, 2 = 50-80 acres per unit, 3=40-50 acres per unit, 4 = 30-40 acres per unit, 5 = 20-30 acres per unit, 6 = 10-20 acres per unit, 7=1.7 to 10 acres per unit, 8 = 0.6-1.7 acres per unit, 9 = less than 0.6 acres per unit. These nine classes were converted into three categories: 0-3 classes into category 1, 4 - 6 into category 2 and 7- 9 into category 3
1=0 to 16 housing units per square mile 2=17 to 64 housing units per square mile 3=more than 64 housing units per square mile.
Given these 3 categories, we compared changes in a cell’s classification
between 2000 and 2030. Cells with a projected change from category 1 (0 to 16
housing units per square mile) to category 2 (17 to 64 housing units per square

34
mile) between 2000 and 2030 received a score of 1. All other cells received a
value of 0. We selected this coding criteria because we did not want to target
lands that are not threatened by development (category 1 to category 1), lands
where development pressure was too great for viable forest stewardship to be
feasible (category 1 to category 3), or lands that were already developed
(category 3). The map shown in Figure 11 denotes areas where economically
viable timber production is possible considering the development projections.

35
Figure 11. Map of housing unit change (0-16 to 16-64 units per
square mile), 2000-2030.

36
Forest Fires
Nature and humans cause forest fires. Indiana’s climate minimizes the
number of lightening-caused forest fires to a handful a year and those fires
seldom spread beyond the lightening-struck tree. Humans cause almost all the
forest fires in Indiana. Forest fires are a risk and stewardship can help reduce
that risk. Proper forest management (stewardship) can reduce fuel loads and
modify the fuel structure of the forest to make it more resistant to extreme fire
events
Researchers at the University of Wisconsin developed a fire risk map for
the Northeastern United States. In developing a fire risk map, the Wisconsin
researchers used population density, volunteer fire department boundaries, and
weather data to map fire risk and categorize the risk into low, moderate,
moderately high, and high. The data can be viewed and extracted from
www.silvis.forest.wisc.edu/projects/WUI_Main.asp. We adopted Wisconsin’s fire
risk attribute and incorporated it into the SAP model with one minor modification.
After making the map layer compatible with the SAP model – 30x30 meter raster
grid and UTM 16N NAD83 – we combined the moderately high and high fire risk
categories into one category and labeled it high fire risk. Cells within this new
category receive a score of 1 and contribute to increasing “stewardship
potential.” All other cells receive a score of 0. The map of fire risk is shown in
Figure 12. It should be noted that overall fire risk in Indiana is low and generally
considered a minimal threat given current forest conditions.
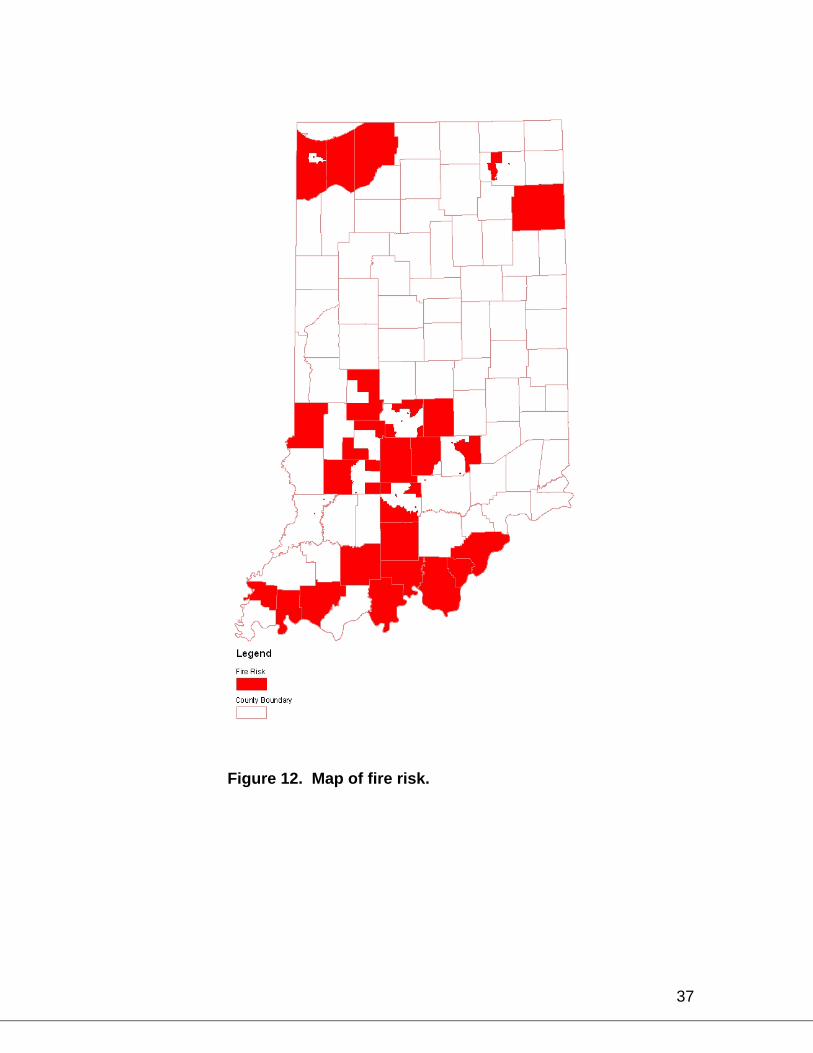
37
Figure 12. Map of fire risk.
38
Forest Health
Exotic species threaten the economic and ecosystem viability of
forestlands. The risk is too great to ignore, thus making eradication or
containment a key objective of state and federal forest agencies, conservation
groups, and communities.
Experts at the Indiana Department of Natural Resources aggregated pest
incidence information for the four major exotic species – emerald ash borer,
gypsy moth, looper and forest tent caterpillar - threatening Indiana’s valuable
forestlands. A half-mile radius buffer surrounds each confirmed sighting of
emerald ash borer colonizing a tree or an area such as a campground. The
affected sites can be viewed from the following website:
www.emeraldashborer.info.
The Indiana Department of Natural Resources relied on gypsy moth
incidence data from Gypsy Moth Slow the Spread, Inc. (www.gmsts.org/ or
www.gmsts.org/cgi-bin/gmsts_mapserver.pl). Phil Marshall, IDNR Forest Health
Specialist used 2004 moth lines (isolines of number of moths captured per trap)
and 2005 kriged surfaces (an estimated surface derived from a scattered set of
points to delineate existing known outbreaks and areas likely to become infested
during the next five years. Specifically, Marshall added a 35-mile wide buffer to
the 2004 1-moth line located in the northeastern part of Indiana to capture the
movement of gypsy moth over five years. For the southern part of Indiana,
Marshall used the 2005 kriged surface to select all areas with a value of 1 or
more moths and adding a 20 mile buffer.
39
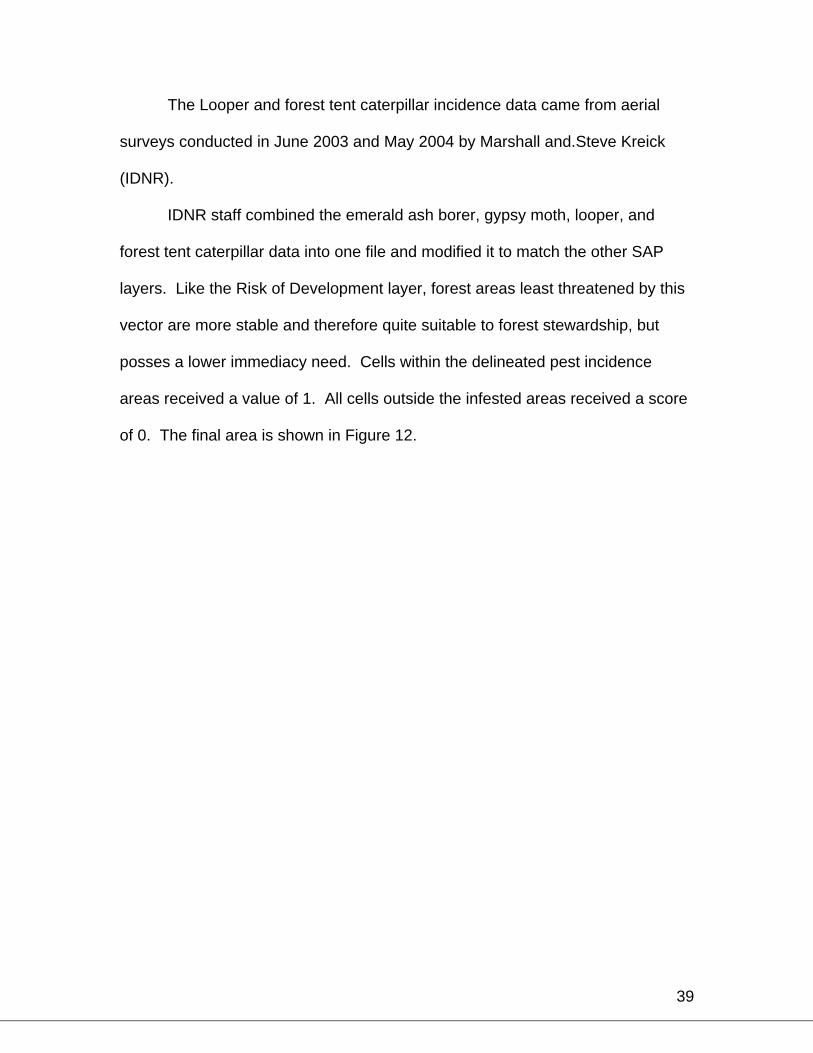
The Looper and forest tent caterpillar incidence data came from aerial
surveys conducted in June 2003 and May 2004 by Marshall and.Steve Kreick
(IDNR).
IDNR staff combined the emerald ash borer, gypsy moth, looper, and
forest tent caterpillar data into one file and modified it to match the other SAP
layers. Like the Risk of Development layer, forest areas least threatened by this
vector are more stable and therefore quite suitable to forest stewardship, but
posses a lower immediacy need. Cells within the delineated pest incidence
areas received a value of 1. All cells outside the infested areas received a score
of 0. The final area is shown in Figure 12.
40
Figure 13. Map of insect risk (gypsy moth, forest tent caterpillar,
looper).

41
Stewardship Potential
Forest stewardship potential can be identified in various ways based on a
given number factors found to have a relationship with stewardship potential of
land—12 factors have been identified as part of the SAP project. The simplest
method of determining stewardship would be a basic overlay analysis. Using this
method, all the spatial data layers were combined to produce a map of areas of
stewardship potential. To account for varying degrees of importance associated
with each of the different data layers, a weighting system was employed based
on input from IDNR District Foresters and the Forest Stewardship Coordinating
Committee (a diverse group of forestry stakeholders and professionals) (Table
2). The weighting system for the 12 spatial analysis project data layers is
presented in table 2. The weighting was derived from the number of votes given
to the data layer by the two different groups of decision makers. Voting was
based on the individual’s perceived importance attributed to each data layer. As
an example- as has been noted ‘fire risk’ in Indiana is generally considered low.
This bore out to be the lowest ranked factor by both focus groups. The number of
weighting points associated with each influencing factor ranged from 1 to 100.
The number of votes allocated to each factor were summed and then divided by
the total number of votes for the factor. This number was used to multiply the
grid cells of the respective layers. Each grid cell was given a value based on the
weighting of each data layer.

42
Table 2. Weighting of t he 12 data layers.
Data Layer
Number of
Votes Weighting
(%) Weighting
Applied Fire Risk 6 0.78 0.007 Impaired Watersheds 44 5.74 0.057 Slope 48 6.27 0.062 Natural Heritage Data 50 6.53 0.065 Wetlands 52 6.79 0.067 Public Water Supply 55 7.18 0.071 Proximity to Public Lands 56 7.31 0.073 Forest Health (pests) 67 8.75 0.087 Risk of Development 69 9.01 0.090 Forest Patches 96 12.53 0.125 Riparian Corridors 98 12.79 0.128 Private Forests 125 16.32 0.163 Total 766 100.00 1.00
Spatial Analysis
Each of the weighted grid layers was overlaid through raster addition. The
overlay procedure of each layer is presented in the Figure 1. All twelve layers
and the mask layer have same cell size dimension and coordination system,
including the same origin for x and y coordinates. The raster method also
generates a continuous map surface based the attribute values. The final
product of raster overlay is a single map layer in which grid cell value range from
0 to 1.
The Analysis Mask layer was used to exclude areas that don’t meet
eligibility criteria for inclusion in the Forest Stewardship program (urban areas
and public lands). The raster addition between the mask and stewardship grids
layer was done to create the stewardship eligible areas. In addition, the raster
addition utilized county boundaries to calculate the areas at the state level. This
43
alleviated the State acre discrepancy due to the fact that part of Lake Michigan is
included with overall Indiana acreage figures. .
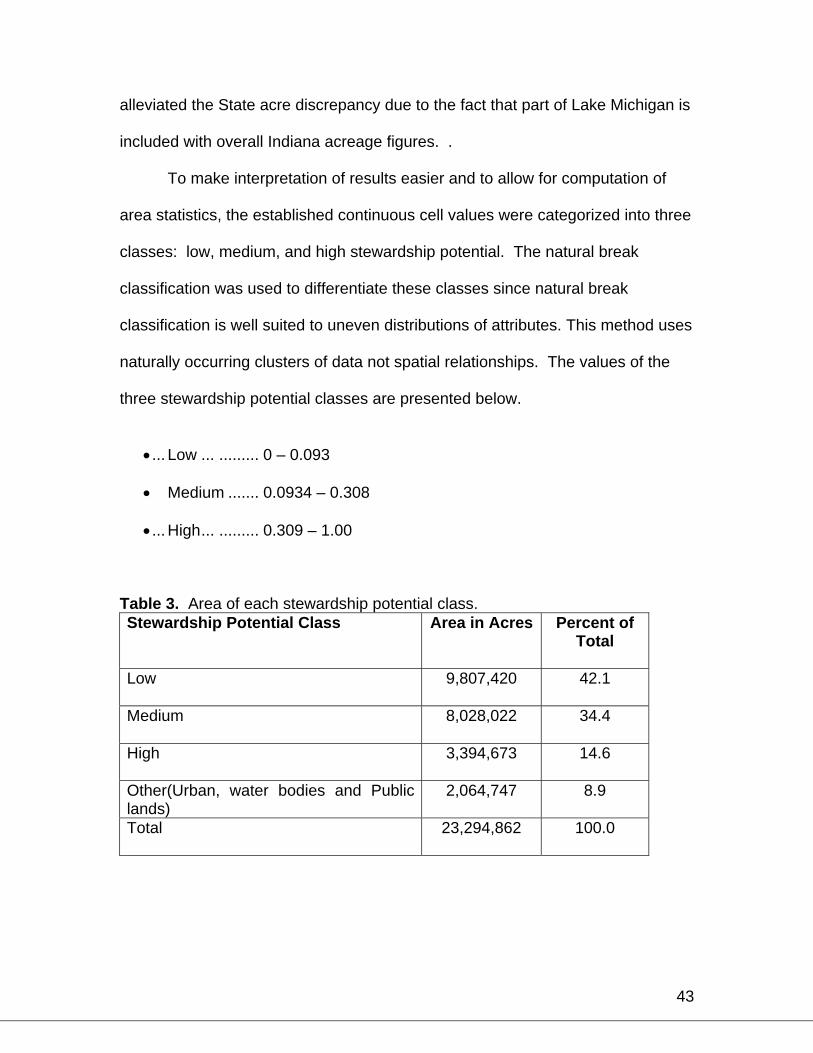
To make interpretation of results easier and to allow for computation of
area statistics, the established continuous cell values were categorized into three
classes: low, medium, and high stewardship potential. The natural break
classification was used to differentiate these classes since natural break
classification is well suited to uneven distributions of attributes. This method uses
naturally occurring clusters of data not spatial relationships. The values of the
three stewardship potential classes are presented below.
•... Low ... ......... 0 – 0.093
• Medium ....... 0.0934 – 0.308
•... High... ......... 0.309 – 1.00
Table 3. Area of each stewardship potential class. Stewardship Potential Class Area in Acres Percent of
Total
Low 9,807,420
42.1
Medium 8,028,022
34.4
High 3,394,673
14.6
Other(Urban, water bodies and Public lands)
2,064,747 8.9
Total 23,294,862
100.0
44
Summary
To summarize, there are nine data layers representing resource potential
and three data layers representing resource threats. We overlaid the 12 data
layers and used an “analysis mask” layer to exclude urban areas and public
lands from the spatial analysis (indicated in orange on Figure 14). Once the
mask removed urban areas, a weighting system was applied to the 12 data
layers. We derived the weighting system with input from IDNR District Foresters
and the Forest Stewardship Coordinating Committee. Using natural breaks,
stewardship potential was classified according to high, medium, and low potential
(Figure 14).
The resource potential factors include:
1. Riparian Zones 2. Priority Watersheds 3. Forest Patch Size 4. Natural Heritage Data 5. Public Drinking Water Supply Sources 6. Private Forest Lands 7. Proximity to Public Lands 8. Wetlands 9. Topographic Slope
The resource threat factors include:
1. Forest Health 2. Development Level 3. Wildfire Assessment
Further analysis to included layers on 1) soil productivity, 2) proximity to lands
enrolled in Classified Forest program, and 3) market accessibility are
encouraged. These additional objectives have direct correlation to the daily
realities forest managers face on the ground.

45
Figure 14. Map of low, medium, and high areas of stewardship
potential in Indiana.

46
Acknowledgements
We would like to recognize the considerable financial and technical
support and project guidance provided by Barbara Tormoehlen, USDA Forest
Service. We would also like to thank the IDNR Division of Forestry District
Foresters for their continued involvement and cooperation.
1 BratKovich, Stephen, Gallion, Joey, Leatherberry, Earl, Reading, William, Hoover, William, and Durham, Glenn. Forests of Indiana: Their Economic Importance. 2004. NA-TP-02-04. U.S. Department of Agriculture, Forest Service, Northeastern Area State and Private Forestry; 18 p. 2 Indiana Department of Agriculture. Possibilities Unbound: The Plan for 2025, Indiana Agriculture’s Strategic Plan. 2005. Indianapolis, Indiana; 43 p. 3 U.S. Forest Service. Forest Stewardship Spatial Analysis Project. 2005. http://www.fs.fed.us/na/sap/ . Accessed August 9, 2005. 4 Khanna, Madhu, Yang, Wanhong, Farnsworth, Richard, and Onal, Hayri. Cost-Effective Targeting of Land Retirement to Improve Water Quality with Endogenous Sediment Deposition Coefficients. 2003. American Journal of Agricultural Economics 85(3): 438-553.
Recommended