IMEXRESEARCH.COM
© 2010‐11 IMEX Research, Copying prohibited. All rights reserved.
Are SSDs Ready for Enterprise Storage Systems
Anil Vasudeva, President & Chief Analyst, IMEX Research
Solid State Storage :Key to Efficient Tiered Storage Infrastructure
Anil VasudevaPresident & Chief [email protected]
© 2007-11 IMEX ResearchAll Rights Reserved
Copying ProhibitedPlease write to IMEX for authorization
IMEXRESEARCH.COM

IMEXRESEARCH.COM
© 2010‐11 IMEX Research, Copying prohibited. All rights reserved.
2
Agenda – Automated Tiered Storage
1. NextGen Data Center and Cloud Computing Infrastructure 2. Solid State Enabling New Systems Architecture3. Improving Transaction Query Response Time and IOPS 4. Workload Characterization 5. Applications best utilizing Solid State Storage6. Data Forensics and Tiered Mapping7. Selecting Automated Storage Tiering Software 8. Key Takeaways
Source: IMEX Research SSD Industry Report ©2011

IMEXRESEARCH.COM
© 2010‐11 IMEX Research, Copying prohibited. All rights reserved.
33
IT Industry’s Journey - Roadmap
CloudizationCloudizationOn-Premises > Private Clouds > Public CloudsDC to Cloud-Aware Infrast. & Apps. Cascade migration to SPs/Public Clouds.
Integrate Physical Infrast./Blades to meet CAPSIMS ®IMEX
Cost, Availability, Performance, Scalability, Inter-operability, Manageability & Security
Integration/ConsolidationIntegration/Consolidation
Standard IT Infrastructure- Volume Economics HW/Syst SW(Servers, Storage, Networking Devices, System Software (OS, MW & Data Mgmt SW)
StandardizationStandardization
VirtualizationVirtualizationPools Resources. Provisions, Optimizes, MonitorsShuffles Resources to optimize Delivery of various Business Services
Automatically Maintains Application SLAs (Self-Configuration, Self-Healing©IMEX, Self-Acctg. Charges etc)
AutomationAutomationSIVACSIVAC
by by IMEX Research
Source:: IMEX Research - Cloud Infrastructure Report ©2009-11

IMEXRESEARCH.COM
© 2010‐11 IMEX Research, Copying prohibited. All rights reserved.
44
Data Centers & Cloud InfrastructureEnterprise VZ Data Center
On-Premise Cloud
Home Networks
Web 2.0Social Ntwks.
Facebook,Twitter, YouTube…
Cable/DSL…Cellular
Wireless
InternetISP
CoreOptical
Edge ISP
ISPISP
ISP
ISP
Supplier/Partners
Remote/Branch Office
Public CloudCenter©
Servers VPNIaaS, PaaS
SaaS
Vertical Clouds
ISP
Tier-3Data Base
ServersTier-2 Apps
ManagementDirectory Security PolicyMiddleware Platform
Switches: Layer 4-7,Layer 2, 10GbE, FC Stg
Caching, Proxy, FW, SSL, IDS, DNS,
LB, Web Servers
Application ServersHA, File/Print, ERP, SCM, CRM Servers
Database Servers, Middleware, Data Mgmt
Tier-1 Edge Apps
FC/ IPSANs
Source:: IMEX Research - Cloud Infrastructure Report ©2009-11
Request for data from a remote client to an enterprise data center crosses a myriad of systems and devices. Key is identifying bottlenecks & improving performance

IMEXRESEARCH.COM
© 2010‐11 IMEX Research, Copying prohibited. All rights reserved.
Virtualized Cloud Infrastructure
Application’s SLA dictates the Resources Required to meet specific requirements of Availability, Performance, Cost, Security, Manageability etc.
Platform Tools & Services
Operating Systems
Cloud ComputingPublic Cloud Service
Providers Private Cloud
Enterprise
AppApp SLA
SLA
SaaS Applications
PaaS
IaaS
SaaS
Virtualization
Resources (Servers, Storage, Networks)
AppApp SLA
SLA AppApp SLA
SLA AppApp SLA
SLA AppApp SLA
SLA
Man
agem
ent
HybridCloud

IMEXRESEARCH.COM
© 2010‐11 IMEX Research, Copying prohibited. All rights reserved.
Server to Storage IO Gap
Disk I/O
Server
Processor
Perf
orm
ance
1980 1990 2000 2010
A 7.2K/15k rpm HDD can do 100/140 IOPS
For Each Disk Operation:Millions of CPU Operations or Hundreds of Thousands of Memory Operations can be done
I/O Gap

IMEXRESEARCH.COM
© 2010‐11 IMEX Research, Copying prohibited. All rights reserved.
77
SSD Filling Price/Perf Gaps in Storage
HDD
Tape
DRAM
CPUSDRAM
Performance I/O Access Latency
HDD becoming Cheaper, not faster
DRAM getting Faster (to feed faster CPUs) & Larger (to feed Multi-cores & Multi-VMs from Virtualization)
SCM
NOR
NANDPCIe SSD
SATASSD
Price$/GB
Source: IMEX Research SSD Industry Report ©2011
SSD segmenting into PCIe SSD Cache
- as backend to DRAM & SATA SSD
- as front end to HDD
Source: IMEX Research SSD Industry Report ©2011
IMEXRESEARCH.COM
© 2010‐11 IMEX Research, Copying prohibited. All rights reserved.
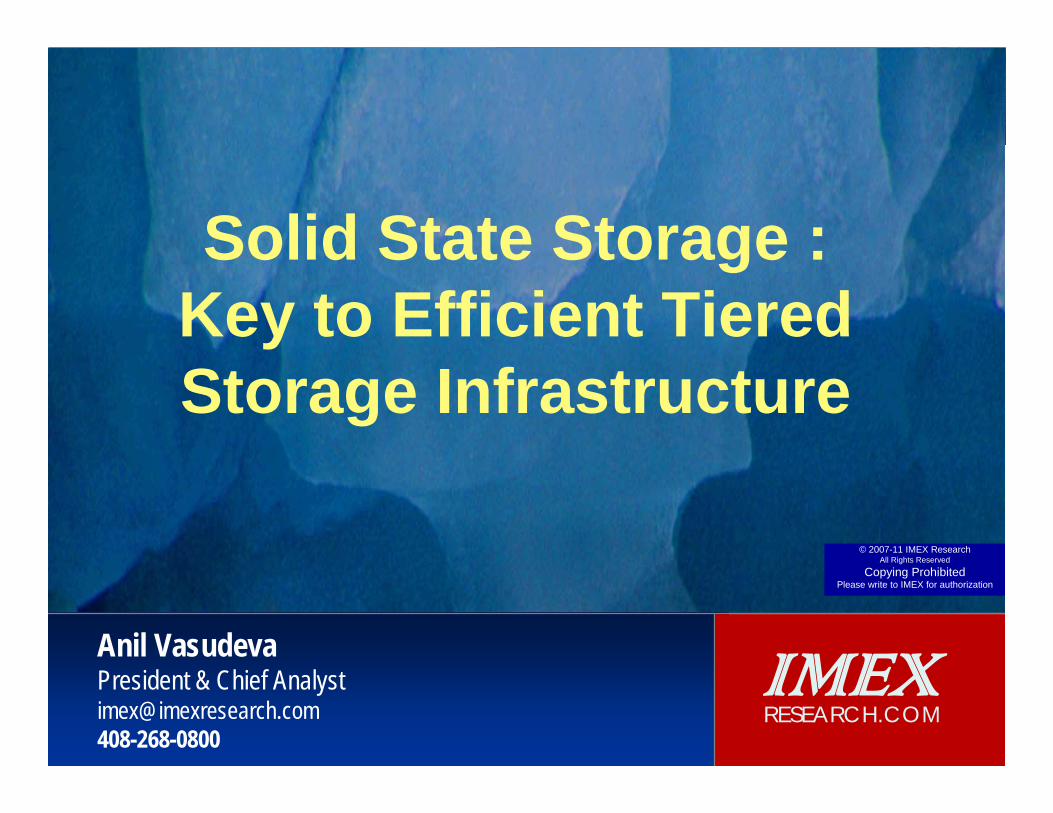
SSDs - Price Erosion & IOPS/GB
Source: IMEX Research SSD Industry Report ©2011
Note: 2U storage rack, • 2.5” HDD max cap = 400GB / 24 HDDs, de-stroked to 20%, • 2.5” SSD max cap = 800GB / 36 SSDs
0
300
600
2009 2010 2011 2012 2013 2014
Uni
ts (M
illio
ns)
0
4
8
IOPS
/GB
Enterprise HDD Units (M)
SSD Units (M)
IOPS/GB SSDs
IOPS/GB HDDs
HDD
SSD
8
Key to Database performance are random IOPS. SSDs outshine HDD in IO price/performance – a major reason, besides better space and power, for their
explosive growth.
IMEXRESEARCH.COM
© 2010‐11 IMEX Research, Copying prohibited. All rights reserved.
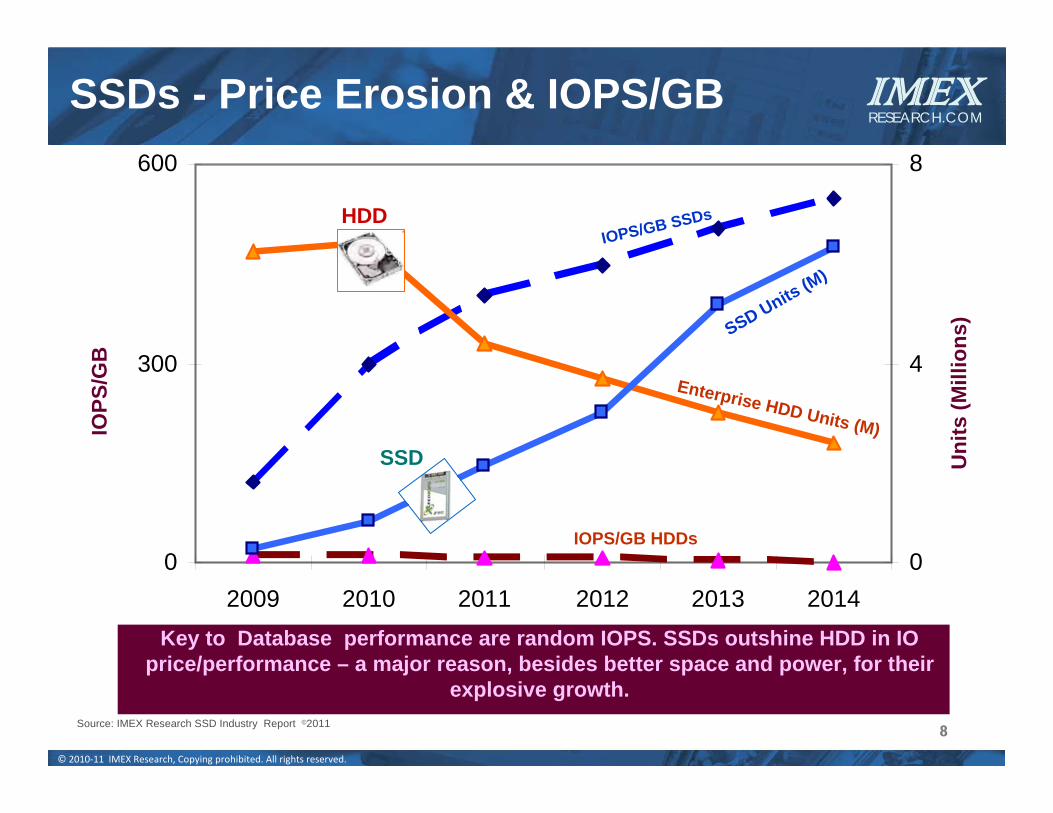
Advantage Solid State Storage (vs. HDDs)
Source: IMEX Research SSD Industry Report ©2011 ** JEDEC’s Mfr’s Required Specs#Reduced -Booting Up, -Virus Scan, -Defrag, -RAID Build, -Patching, -Data Restoration
800/1600%/30dBLessShock/Vibration/Noise
50 %Weight
50 %Maintenance/Op.Time #
110 %2.1MTBF (Million Hrs) *1.0
93 %0.5 WattsIdling Power6.8 Watts
91 %0.9 WattsLoad Power10.1 Watts
100,000 %42,850 IOPS/WPerformance/Power 43.1 IOPS/W
1600 %16 GB/in3Storage Density 1.0 GB/in3
30,000 %1,250 IOPS/in3Performance Density4.2 IOPS/in3
900 %Concurrent Access
<1 %Data Access Time ms
ImprovementSSD vs. HDD
40 %16 %
5,000 %
500%475 %
SSD
<=3%
10^ (-16)
570 GB/W
Parameter
Failure Rate (AFR%) **
UBER **
Power Efficiency
Read Speed
IOPS
HDD
<5%
10^(-14)
11.4 GB/W

IMEXRESEARCH.COM
© 2010‐11 IMEX Research, Copying prohibited. All rights reserved.
1010
For a targeted query response time in DB & OLTP applications, many more concurrent users can be added cost-effectively when using SSDs or SSD +
HDDs storage vs. adding more HDDs or short-stroking HDDs
Improving DB Query Response Time
HDDs14 Drives
HDDs 112 Drives
w short stroking SSDs
12 Drives$$$$$$$$
$$
$$$
IOPS (or Number of Concurrent Users)
Que
ry R
espo
nse
Tim
e (m
s)
0
8
2
4
6
0 20,000 40,00010,000 30,000
Conceptual Only -Not to Scale
Hybrid HDDs
36 Drives + SSDs$$$$
Source: IMEX Research SSD Industry Report ©2011
IMEXRESEARCH.COM
© 2010‐11 IMEX Research, Copying prohibited. All rights reserved.
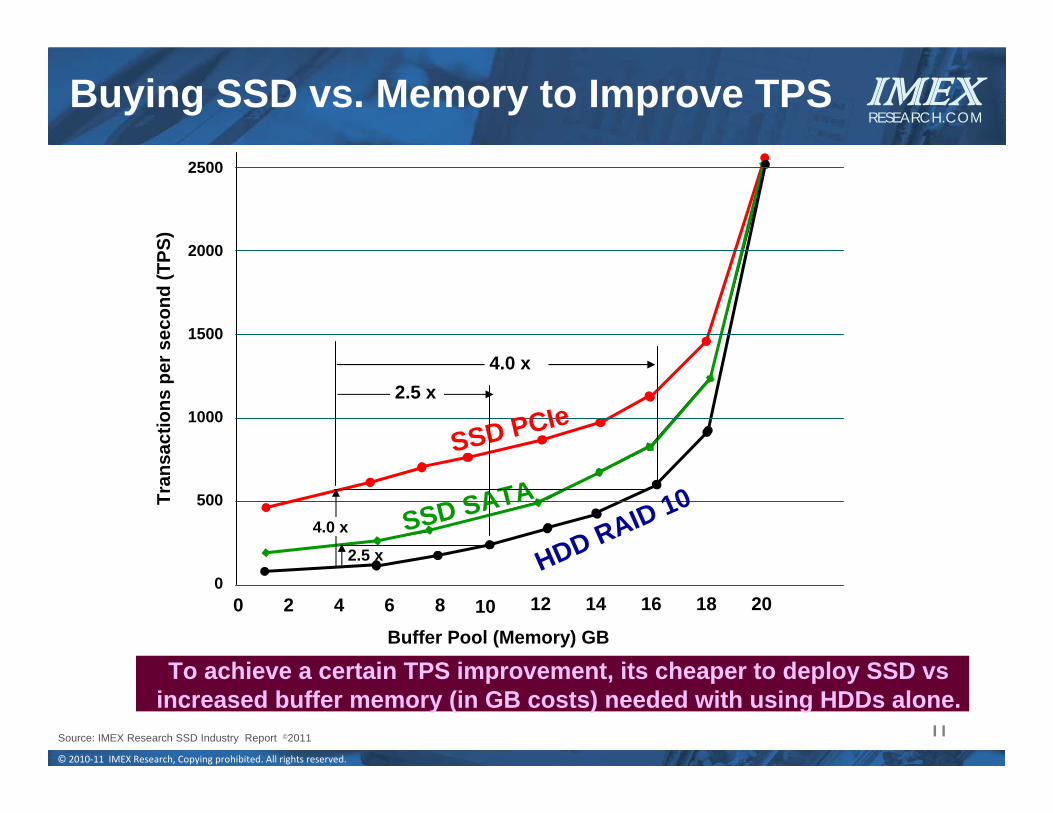
2500
2000
1500
1000
500
0
Tran
sact
ions
per
sec
ond
(TPS
)
Buffer Pool (Memory) GB0 2 4 6 8 10 12 14 16 18 20
SSD PCIe
SSD SATA
HDD RAID 10
2.5 x4.0 x
2.5 x
4.0 x
11Source: IMEX Research SSD Industry Report ©2011
To achieve a certain TPS improvement, its cheaper to deploy SSD vsincreased buffer memory (in GB costs) needed with using HDDs alone.
Buying SSD vs. Memory to Improve TPS

IMEXRESEARCH.COM
© 2010‐11 IMEX Research, Copying prohibited. All rights reserved.
*IOPS for a required response time ( ms)*=(#Channels*Latency-1)
(RAID - 0, 3)
500100MB/sec
101 505
Data Warehousing
OLAP
BusinessIntelligence(RAID - 1, 5, 6)
IOPS
* (*L
aten
cy-1
)
Web 2.0Web 2.0AudioAudio
VideoVideo
Scientific ComputingScientific Computing
ImagingImagingHPCHPC
TPHPCHPC
Market Segments by Apps/Workloads
10K
100 K
1K
100
10
1000 K OLTP
eCommerceeCommerceTransaction Transaction ProcessingProcessing
Source:: IMEX Research - Cloud Infrastructure Report ©2009-11

IMEXRESEARCH.COM
© 2010‐11 IMEX Research, Copying prohibited. All rights reserved.
1313
I/O Access Frequency vs. Percent of Corporate Data
SSD• Logs• Journals• Temp Tables• Hot Tables
SSD• Logs• Journals• Temp Tables• Hot Tables
FCoE/ SAS
Arrays• Tables• Indices
• Hot Data
FCoE/ SAS
Arrays• Tables• Indices
• Hot Data
Cloud Storage
SATA• Back Up Data• Archived Data
• Offsite DataVault
Cloud Storage
SATA• Back Up Data• Archived Data
• Offsite DataVault
2% 10% 50% 100%1%% of Corporate Data
65%
75%
95%
% o
f I/O
Acc
esse
s
Data Storage Usage – In DCs & Cloud ©
Source:: IMEX Research - Cloud Infrastructure Report ©2009-11
IMEXRESEARCH.COM
© 2010‐11 IMEX Research, Copying prohibited. All rights reserved.
14
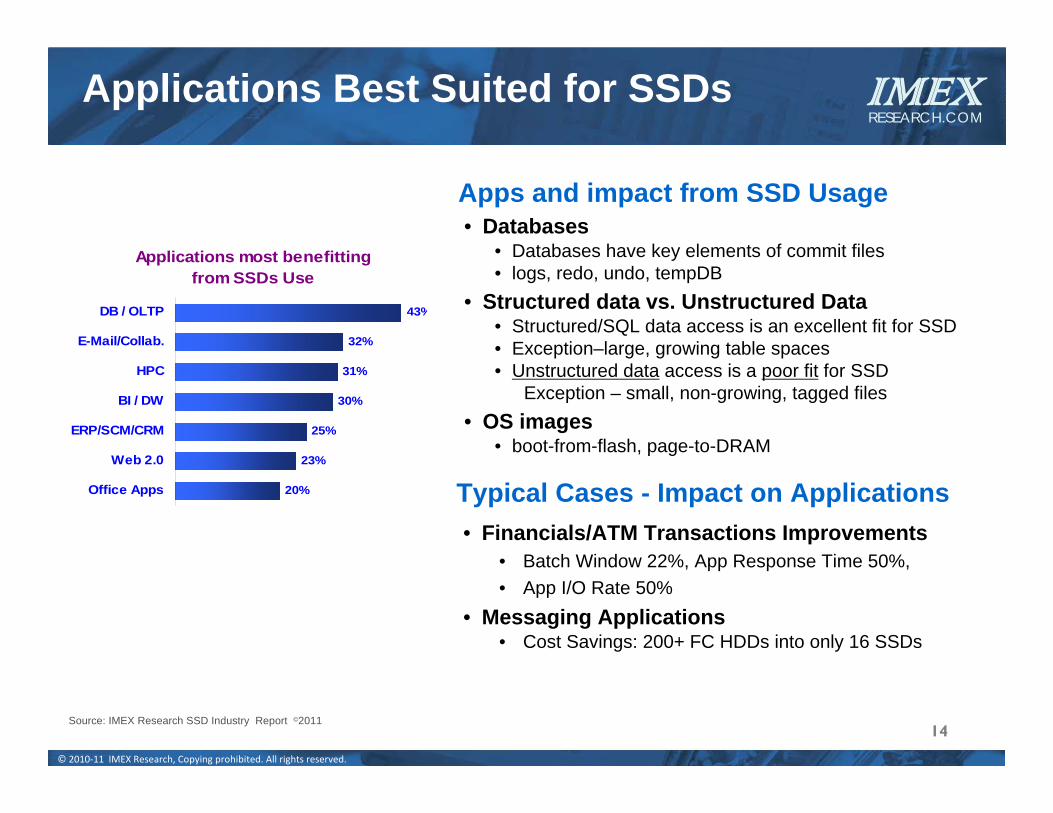
Applications Best Suited for SSDs
• Databases• Databases have key elements of commit files• logs, redo, undo, tempDB
• Structured data vs. Unstructured Data• Structured/SQL data access is an excellent fit for SSD• Exception–large, growing table spaces• Unstructured data access is a poor fit for SSD
Exception – small, non-growing, tagged files• OS images
• boot-from-flash, page-to-DRAM
Applications most benefitting from SSDs Use
20%
23%
25%
30%
31%
32%
43%
Office Apps
Web 2.0
ERP/SCM/CRM
BI / DW
HPC
E-Mail/Collab.
DB / OLTP
• Financials/ATM Transactions Improvements• Batch Window 22%, App Response Time 50%, • App I/O Rate 50%
• Messaging Applications• Cost Savings: 200+ FC HDDs into only 16 SSDs
Typical Cases - Impact on Applications
Apps and impact from SSD Usage
Source: IMEX Research SSD Industry Report ©2011
IMEXRESEARCH.COM
© 2010‐11 IMEX Research, Copying prohibited. All rights reserved.
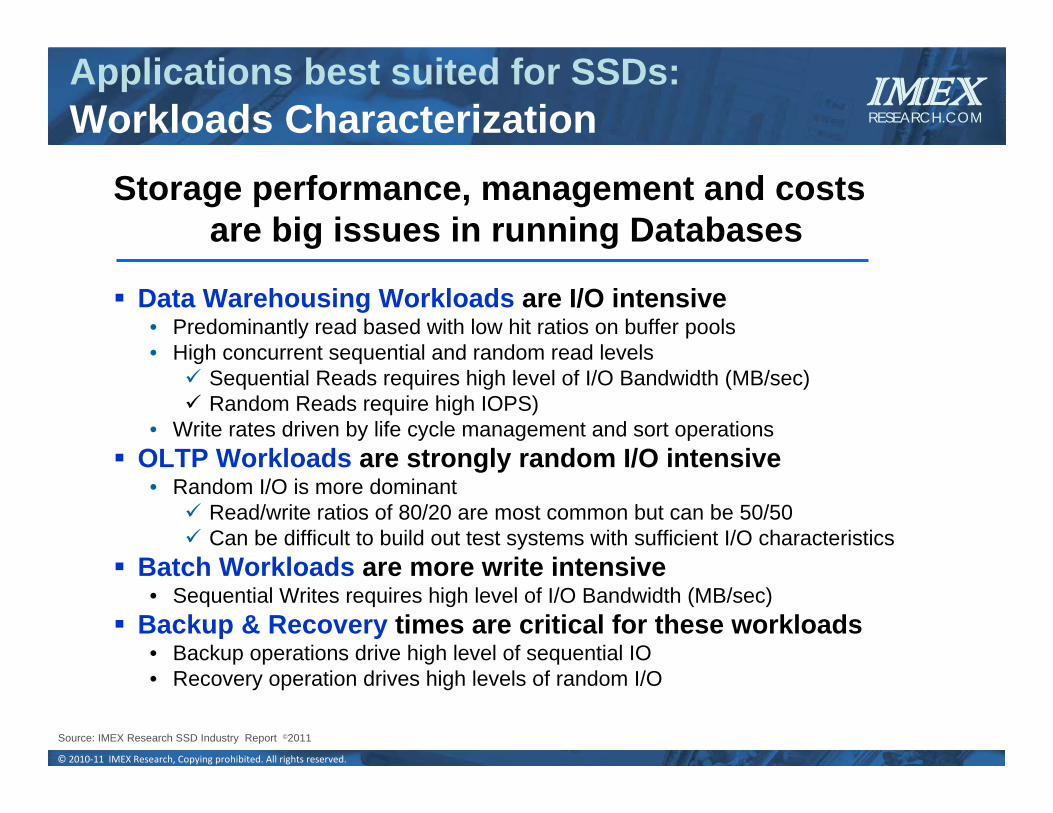
Storage performance, management and costsare big issues in running Databases
Data Warehousing Workloads are I/O intensive• Predominantly read based with low hit ratios on buffer pools• High concurrent sequential and random read levels Sequential Reads requires high level of I/O Bandwidth (MB/sec) Random Reads require high IOPS)
• Write rates driven by life cycle management and sort operations OLTP Workloads are strongly random I/O intensive
• Random I/O is more dominant Read/write ratios of 80/20 are most common but can be 50/50 Can be difficult to build out test systems with sufficient I/O characteristics
Batch Workloads are more write intensive• Sequential Writes requires high level of I/O Bandwidth (MB/sec)
Backup & Recovery times are critical for these workloads• Backup operations drive high level of sequential IO• Recovery operation drives high levels of random I/O
Applications best suited for SSDs:Workloads Characterization
Source: IMEX Research SSD Industry Report ©2011

IMEXRESEARCH.COM
© 2010‐11 IMEX Research, Copying prohibited. All rights reserved.
Scale In
Scale Out
Scal
e U
p
Large DB Size Growth by Market Segment
0100200300400500600700800900
100011001200
2009 2010 2011 2012 2013 2014
DB S
ize
(TB) OLTP
DW/BI
Storage Usage vs DB Capacity
0 20 40 60 80
>10 TB
5-10 TB
2-5 TB
1-2 TB
DB
Siz
e
TB
DB Size (TB)Storage Size (TB)
Applications Best Suited for SSDs:Data Warehouse/BI
Data Source: IMEX Research Cloud Infrastructure Report ©2009-11
I/O Access Frequency vs. Percent of Corporate Data
SSD• Logs• Journals• Temp Tables• Hot Tables
SSD• Logs• Journals• Temp Tables• Hot Tables
FCoE/SASArrays• Tables• Indices
• Hot Data
FCoE/SASArrays• Tables• Indices
• Hot Data
Cloud Storage
SATA• Back Up
Data• Archived
Data• Offsite
DataVault
Cloud Storage
SATA• Back Up
Data• Archived
Data• Offsite
DataVault
2 10 50 1001
% of Corporate Data
65
75
95%
of I
/O A
cces
ses
IMEXRESEARCH.COM
© 2010‐11 IMEX Research, Copying prohibited. All rights reserved.
1717
Dat
a: IM
EX R
esea
rch
& Pa
nasa
s
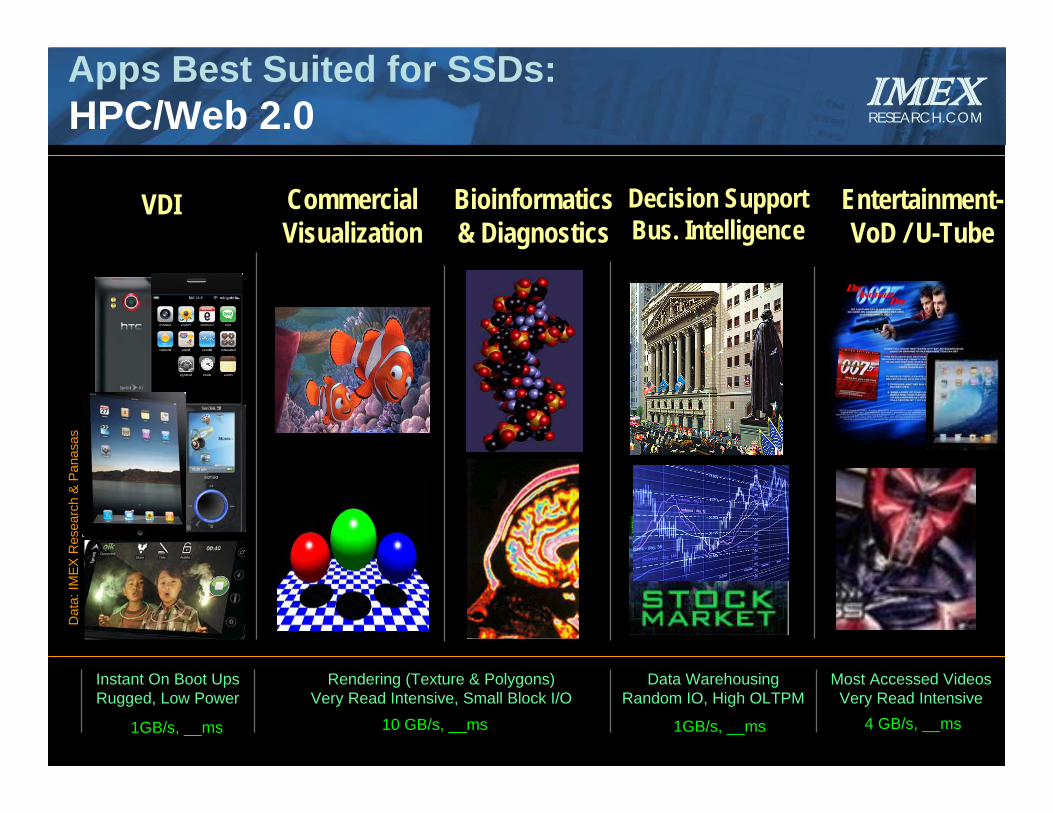
VDI Commercial Visualization
Bioinformatics& Diagnostics
Decision Support Bus. Intelligence
Entertainment-VoD / U-Tube
Instant On Boot UpsRugged, Low Power
1GB/s, __ms
Rendering (Texture & Polygons)Very Read Intensive, Small Block I/O
10 GB/s, __ms 4 GB/s, __ms
Data WarehousingRandom IO, High OLTPM
Most Accessed VideosVery Read Intensive
1GB/s, __ms
Apps Best Suited for SSDs:HPC/Web 2.0

IMEXRESEARCH.COM
© 2010‐11 IMEX Research, Copying prohibited. All rights reserved.
Automated Storage Tiering- Next Frontier in Storage Efficiency
DRAM
Flash SSD
Performance Disk
Capacity Disk
Tape
Auto TieringData Class (Tiers 0,1,2,3)
Storage Media Type (Flash/Disk/Tape)Policy Engines (Workload Mgmt)
Transparent Migration (Data Placement)File Virtualization (Uninterrupted App.Opns.in Migration)
Replication
RAID – 0,1,5,6,10
Virtual Tape
Back Up/Archive/DRData Protection
Storage Virtualization
MAID
Deduplication
Thin Provisioning
Storage Efficiency
Source: IMEX Research SSD Industry Report ©2011

IMEXRESEARCH.COM
© 2010‐11 IMEX Research, Copying prohibited. All rights reserved.
1919
Automated Storage Tiering:The Killer App for Enterprise SSDs
• Traditional Disk Mapping• Volumes have different
characteristics. Applications need to place them on correct tiers of storage based on usage
• Smart Storage Mapping• All volumes appear to be
“logically” homogenous to apps. But data is placed at the right tier of storage based on its usage through smart data placement and migration
Source: IMEX Research SSD Industry Report ©2011

IMEXRESEARCH.COM
© 2010‐11 IMEX Research, Copying prohibited. All rights reserved.
2020
Automated Storage Tiering:Workload I/O Monitoring & Migration
• Automated Storage Tiering• Continuously monitor and
analyze data access on the tiers
• Automatically elevate hot data to “Hot Tiers” and demote cool data/volumes to “Lower Tiers
• Allocate and relocate volumes on each tier based on use
• Automated Migration reduces OPEX to otherwise SANsmanaged manually
Storage-Tiering at LBA/Sub-LUN Level
Storage-Tiered Virtualization
Physical Storage Logical Volume
SSDs Arrays
HDDs Arrays
Hot Data
Cold Data
Source: IMEX Research SSD Industry Report ©2011
IMEXRESEARCH.COM
© 2010‐11 IMEX Research, Copying prohibited. All rights reserved.
2121
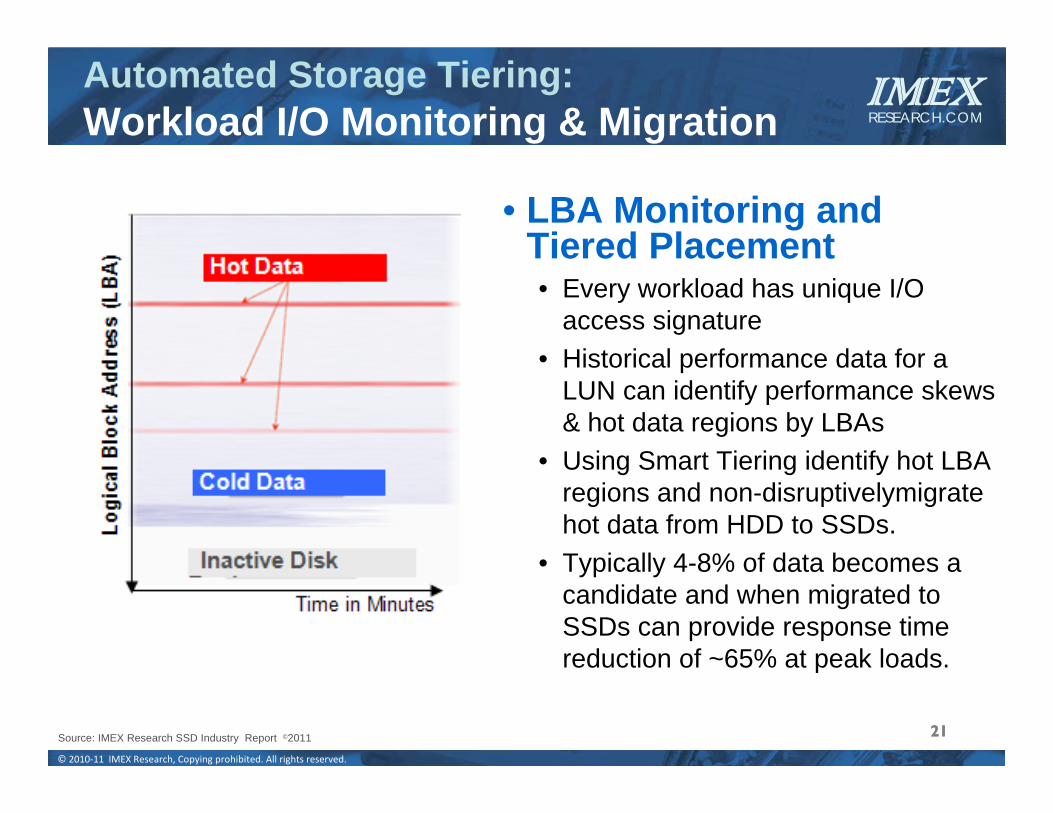
• LBA Monitoring and Tiered Placement• Every workload has unique I/O
access signature• Historical performance data for a
LUN can identify performance skews & hot data regions by LBAs
• Using Smart Tiering identify hot LBA regions and non-disruptivelymigratehot data from HDD to SSDs.
• Typically 4-8% of data becomes a candidate and when migrated to SSDs can provide response time reduction of ~65% at peak loads.
Automated Storage Tiering:Workload I/O Monitoring & Migration
Source: IMEX Research SSD Industry Report ©2011

IMEXRESEARCH.COM
© 2010‐11 IMEX Research, Copying prohibited. All rights reserved.
2222
Automated Storage Tiering:Improving Response Time
• Productivity Improvements(Response Time)
• With automated reallocation of hot spot data (~ 5-10% of total data) to SSDs, performance improvements Response time reduction ~70+%
IOPS increase of 200% for any I/O intensive workloads in Time-Perishable OLTP markets: Airlines Reservations, Wall Street Investment Banking Stock Transactions, Financial Institutions Hedge Funds etc.
Performance boost in Low Latency seeking Systems (High Perf. Clustered Systems)
Source: IMEX Research SSD Industry Report ©2011
IMEXRESEARCH.COM
© 2010‐11 IMEX Research, Copying prohibited. All rights reserved.
2323
Automated Storage Tiering:Enhancing Database Throughput
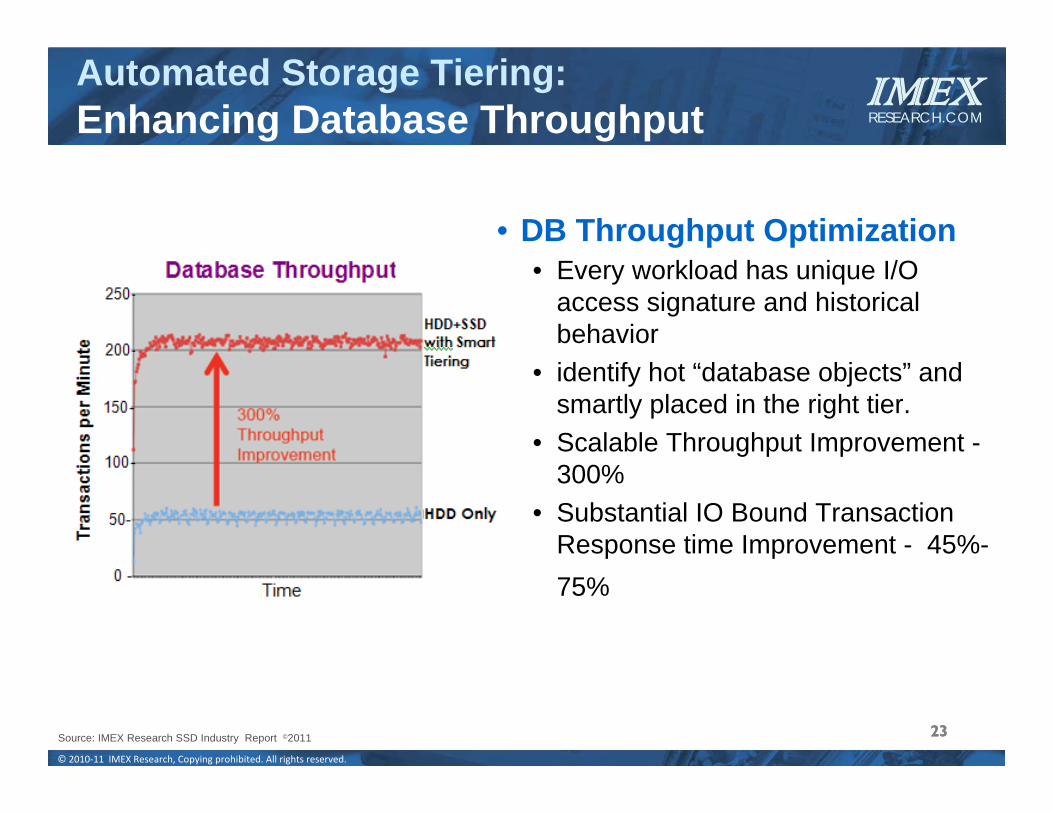
• DB Throughput Optimization• Every workload has unique I/O
access signature and historical behavior
• identify hot “database objects” and smartly placed in the right tier.
• Scalable Throughput Improvement -300%
• Substantial IO Bound Transaction Response time Improvement - 45%-75%
Source: IMEX Research SSD Industry Report ©2011
IMEXRESEARCH.COM
© 2010‐11 IMEX Research, Copying prohibited. All rights reserved.
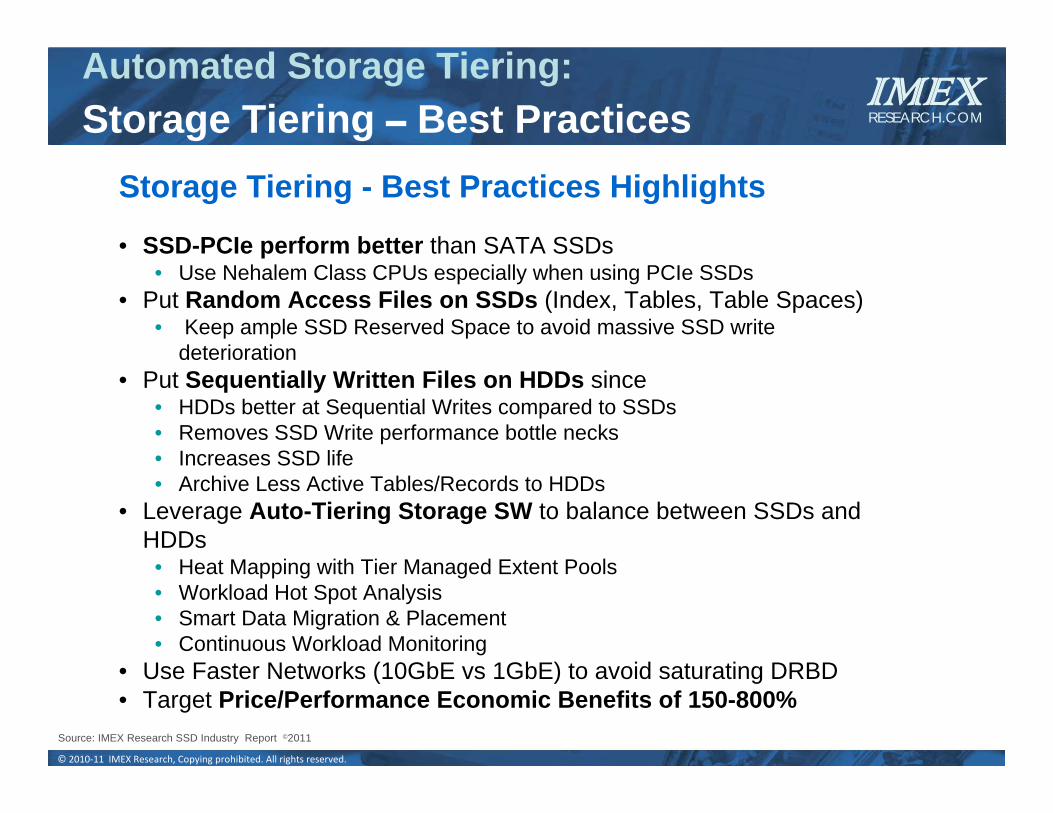
Storage Tiering - Best Practices Highlights
• SSD-PCIe perform better than SATA SSDs• Use Nehalem Class CPUs especially when using PCIe SSDs
• Put Random Access Files on SSDs (Index, Tables, Table Spaces)• Keep ample SSD Reserved Space to avoid massive SSD write
deterioration • Put Sequentially Written Files on HDDs since
• HDDs better at Sequential Writes compared to SSDs• Removes SSD Write performance bottle necks• Increases SSD life• Archive Less Active Tables/Records to HDDs
• Leverage Auto-Tiering Storage SW to balance between SSDs and HDDs
• Heat Mapping with Tier Managed Extent Pools• Workload Hot Spot Analysis• Smart Data Migration & Placement• Continuous Workload Monitoring
• Use Faster Networks (10GbE vs 1GbE) to avoid saturating DRBD• Target Price/Performance Economic Benefits of 150-800%
Automated Storage Tiering:Storage Tiering – Best Practices
Source: IMEX Research SSD Industry Report ©2011

IMEXRESEARCH.COM
© 2010‐11 IMEX Research, Copying prohibited. All rights reserved.
SSS in DB Environments:Enabling new System Architectures
SSD class memories fundamentally changing Computing Systems Architectures
Using SSDs, a leading Computer Systems company achieved:
• Sustained 1 million IOPS with random 4K size• 70%RD/30%WR with Queue depth of 16• System Latency 720 us Average • Floor Space Less than 25% vs. Std. Disk Storage System• Energy Used only 55% vs Std. System• Comparable Total Cost New system vs. Standard System• System Test HW:
Host - 2 Servers (26 cores, 28 GB Memory), Cluster - 14 Storage Controller Nodes,Storage - 31 Storage Arrays with 41 PCIe SSDs 160GB Each
Source: IMEX Research SSD Industry Report ©2011

IMEXRESEARCH.COM
© 2010‐11 IMEX Research, Copying prohibited. All rights reserved.
• Storage management, performance and cost - a big issue in DBs• SSDs enable super IO performance and cost reduction in DBs
SSS in DB Environments:DB Improvements with Flash SSDs
Improve Responsiveness
Reduce Costs
New AddedBenefits
Improve • Insert/Update/Delete Performance• Random Read I/O Performance• Query Response Time• Sort Performance• Batch Performance too.
Reduce• DRAM size for Buffer Pools used to cache
data on SSDs• Power/Cooling Space for housing Databases
Reduce • Database Recovery performance• I/O performance impact by Flash Copy• Skill levels required for DB tuning & monitoring
Source: IMEX Research SSD Industry Report ©2011
IMEXRESEARCH.COM
© 2010‐11 IMEX Research, Copying prohibited. All rights reserved.
SSS in DB Environments:Best Practices for DB/DW/BI Apps
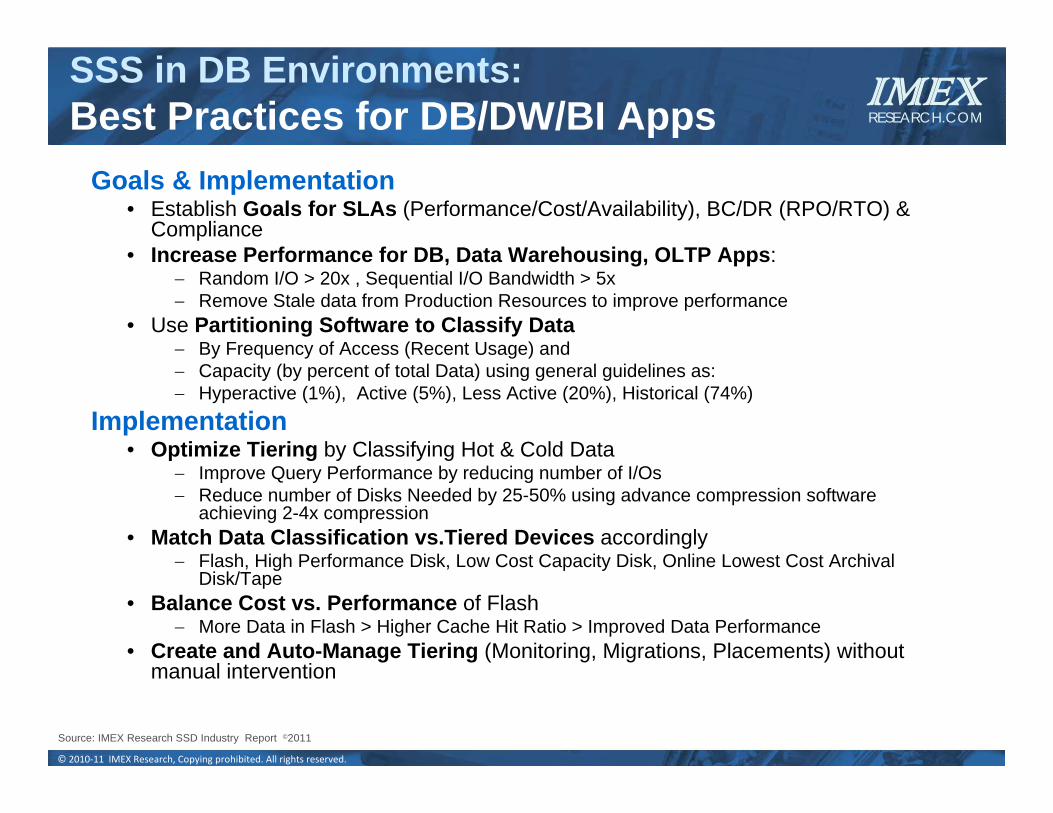
Goals & Implementation• Establish Goals for SLAs (Performance/Cost/Availability), BC/DR (RPO/RTO) &
Compliance• Increase Performance for DB, Data Warehousing, OLTP Apps:
Random I/O > 20x , Sequential I/O Bandwidth > 5x Remove Stale data from Production Resources to improve performance
• Use Partitioning Software to Classify Data By Frequency of Access (Recent Usage) and Capacity (by percent of total Data) using general guidelines as: Hyperactive (1%), Active (5%), Less Active (20%), Historical (74%)
Implementation• Optimize Tiering by Classifying Hot & Cold Data
Improve Query Performance by reducing number of I/Os Reduce number of Disks Needed by 25-50% using advance compression software
achieving 2-4x compression• Match Data Classification vs.Tiered Devices accordingly
Flash, High Performance Disk, Low Cost Capacity Disk, Online Lowest Cost Archival Disk/Tape
• Balance Cost vs. Performance of Flash More Data in Flash > Higher Cache Hit Ratio > Improved Data Performance
• Create and Auto-Manage Tiering (Monitoring, Migrations, Placements) without manual intervention
Source: IMEX Research SSD Industry Report ©2011

IMEXRESEARCH.COM
© 2010‐11 IMEX Research, Copying prohibited. All rights reserved.
2828
SAN TCO using HDD vs. Hybrid Storage
14.2 5.2
75
28
0
64
0
36
145
0
0
50
100
150
200
250
HDD Only HDD/SSD
Cos
t $K
Power & Cooling RackSpace SSDs HDD SATA HDD FC
Pwr/Cool
RackSpace
SSD
HDD-SATA
HDD-FC
SAN PerformanceImprovements using SSD
0
50
100
150
200
250
300
FC-HDD Only SSD/SATA-HDD
IOPS
0
1
2
3
4
5
6
7
8
9
10
$/IO
P
Performance (IOPS) $/IOP
$/IOPS Improvement
800%
IOPS Improvement
475%
Source: IMEX Research SSD Industry Report ©2011
SSS in DB Environments: Enabling new Economics

IMEXRESEARCH.COM
© 2010‐11 IMEX Research, Copying prohibited. All rights reserved.
Storage Systems
Tiered Storage – Industry Ecosystem
SSD StorageNAND FlashSSD Controllers Computer Systems
Industry Status
• Integrated Storage Tiering Products offered by over top 10 Storage Vendors• Major Storage Vendors
- Automated Volume Level Tiering (SSD & HDD) • New Storage Start Ups
– Integrated Flash Caching & Block Level Tiering• Cloud Vendors
– Adding Shared Cloud for Lowest Cost Backup & Restore Storage
Source: IMEX Research SSD Industry Report ©2011

IMEXRESEARCH.COM
© 2010‐11 IMEX Research, Copying prohibited. All rights reserved.
SSD Challenges & Solutions:Goals & Best Practices
Best Practices • By leveraging Error Avoidance Algorithms, and
Best Practices of Verification Testing, to keep total functional failure rate <=3% (with defects and wear-outs issues combined)
• In practice, endurance ratings are likely to be significantly higher than typical use, so data errors and failures will be even less.
• Capacity Over-provisioning will provide large increases in random performance and endurance.
• Select SSD based on confirmed EVT Ratings• Use MLC within requirements of Endurance
Limits
Real
Wor
ld P
rom
ise
20%
15%
10%
5%
0%% o
f Driv
es F
ailin
g (A
FR %
)
53210 4
Years of UseJEDEC
SSD Std.
<=3%
Para
noia
Cur
ve
Be aware of Tools & Best Practices …And you should be OK !!
Concerned about SSD Adoption in your Enterprise ?
Using Best-of-Breed Controllers to achieve <=3% AFR and JEDEC Endurance Verification Testing should allow Enterprise Capabile SSDs
Source: Intel IDF’10 & IMEX Research SSD Industry Report 2011 ©IMEX 2010-11

IMEXRESEARCH.COM
© 2010‐11 IMEX Research, Copying prohibited. All rights reserved.
3131
New Intelligent Controllers:Meeting Enterprise Requirements
Enterprise Requirements• Always-On 24x7 Reliability and performance supersede cost• Fast I/O Performance required by business-critical applications and • 5-Yr. Life Cycle Endurance required by mission-critical applications in the
enterprise. • Use State-of-the-Art new sophisticated controllers and firmware
technologies to run mission critical applications in the enterprise, using- Robust ECC, Internal RAID, Wear Leveling (To reduce hot spots),
Spare Capacity, Write Amplification, Avoidance, Garbage Collection Efficiency, Wear Out Prediction Management etc.
Sou
rce:
San
dFor
ce
New Intelligent Controller (2nd Generation)Optimized
WriteBlock Mgmt/
Wear LevelingGarbage
CollectionRead/Disturb Management
RAID w/o Std. Parity OH
SATA3 I/F6Gb/s,32 NCQ
PH
Y
Link
Tran
spor
t
Com
man
d
AES 256/128 Encryption
TCG Compliance
55b/512B BCH ECC
RS232,GPIO,I2C, JTAG I/F
NAND Flash I/F• Toggle , ONFI-2• SLC/ MLC/ eMLC• 8ch/16 Byte Lanes • 3x,2x nm Supp• 512 GB Capable
New Gen Controllers allow SSDs to meet Enterprise Class Availability/Performance/ over 5-Year Life/Scalability/
Auto-Configuration & Auto Data-TieringSource: IMEX Research SSD Industry Report ©2011
IMEXRESEARCH.COM
© 2010‐11 IMEX Research, Copying prohibited. All rights reserved.
32
Key Takeaways
• Solid State Storage creating a paradigm shift in Storage Industry• Leverage the opportunity to optimize your computing infrastructure with SSD adoption
after making a due diligence in selection of vendors/products, industry testing and interoperability
• Optimize Transactions for Query Response Time vs. # of Users • Improving Query Response time for a given number of users (IOPs) or Serving more
users (IOPS) for a given query response time
• Select Automated Storage Tiering Software• Data Forensics and Tiered Placement• Every workload has unique I/O access signature• Historical performance data for a LUN can identify performance skews & hot data
regions by LBAs.Non-disruptively migrate hot data from HDD to SSDs.• Optimize Infrastructure to meet needs of Applications/SLA
• Performance Economics/Benefits• Typically 4-8% of data becomes a candidate and when migrated to SSDs can provide
response time reduction of ~65% at peak loads
Source: IMEX Research SSD Industry Report ©2011
Recommended